Embed Size (px)
Citation preview

BioSB Conference 2016
Quantification of variability and uncertainty in systems medicine models
April 20, 2016Natal van RielEindhoven University of Technology, the NetherlandsDepartment of Biomedical EngineeringSystems Biology and Metabolic [email protected]
@nvanriel

Computational modelling
• Explaining the data & understanding the biological system
2Wolkenhauer, Front Physiol. 2014; 5:21.
TOP-DOWN
BOTTOM-UP
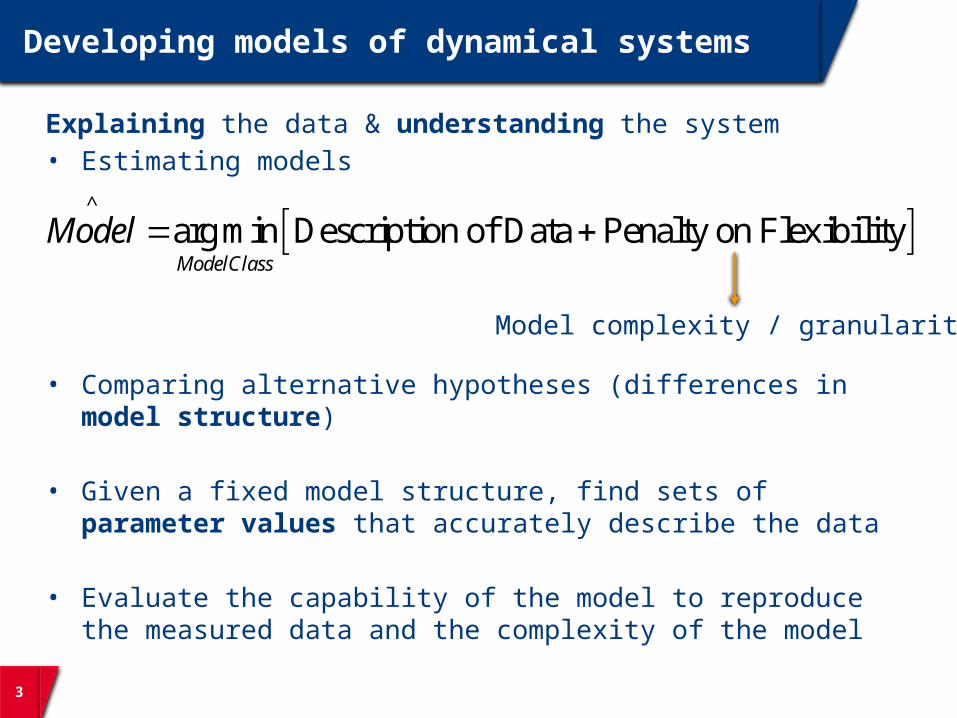
Developing models of dynamical systems
Explaining the data & understanding the system• Estimating models
• Comparing alternative hypotheses (differences in model structure)
• Given a fixed model structure, find sets of parameter values that accurately describe the data
• Evaluate the capability of the model to reproduce the measured data and the complexity of the model
3
^
arg min Description of Data Penalty on FlexibilityModelClass
Model
Model complexity / granularity

Model Errors
The error in an estimated model has two sources: 1. Too much constraints and restrictions; “too simple model sets". This
gives rise to a bias error or systematic error. 2. Data is corrupted by noise, which gives rise to a variance error or
random error.
4
^
arg min Description of Data Penalty on FlexibilityModelClass
Model
Adapted from Ljung & Chen, 2013

5
Model calibration
Parameter identification• Maximum likelihood techniques
• Implemented using nonconvex optimization
• Error model
2
2
1 1
( ) ( | )( )n N
i i
i k ik
d k y k
2
ˆ 0
ˆ arg min ( )
( ) ( | )i id k y k
( | ) ( )i iy k k
Quantitative and Predictive Modelling

6
Bias – Variance trade-off
• To minimize the MSE is a trade off in constraining the model: A flexible model gives small bias (easier to describe complex behavior) and large variance (with a flexible model it is easier to get fooled by the noise), and vice versa
• This trade-off is at the heart of all modelling that aims to explain data
Zero biasHigh variance(overfitting)
Adequate Bias - Variance trade-off

Fitting elephants
• Famous aphorism: ‘‘With four parameters I can fit an elephant, and with five I can make him wiggle his trunk’’
• Estimating dynamic models of networks is not equivalent to curve fitting• The interconnected structure of biological systems imposes strong
constraints
7
http://en.wikiquote.org/wiki/John_von_Neumann
“Even with a thousand parameters I cannot fit the biological network in a single cell of an elephant. Let alone to make him blink his eye”

Information-rich data
It is often not trivial to find a mechanistic (mechanism-based) model that can describe information-rich data of an interconnected system
• If the measurements provide sufficient coverage of the system components (details)
• Under (multiple) physiological, in vivo conditions (operational context)
8
measurements
No.
of c
ompo
nent
sNo. of observations per component

Rethinking Maximum Likelihood Estimation
9
• The bias - variance trade-off is often reached for rather large bias
• Typically, we are far away from the asymptotic situation in which Maximum Likelihood Estimation (MLE) provides the best possible estimates

10
Tiemann et al. (2011) BMC Syst Biol, 5:174Van Riel et al, Interface Focus 3(2): 20120084, 2013Tiemann et al. (2013) PloS Comput Biol, 9(8):e1003166
Room for more flexibility
• Instead of increasing structural complexity (increasing model size)• Introduce more freedom in model parameters to compensate for
bias (‘undermodelling’) in the original model structure• Increasing model flexibility using time-varying parameters
•ADAPTAnalysis of Dynamic Adaptations in Parameter Trajectories
11
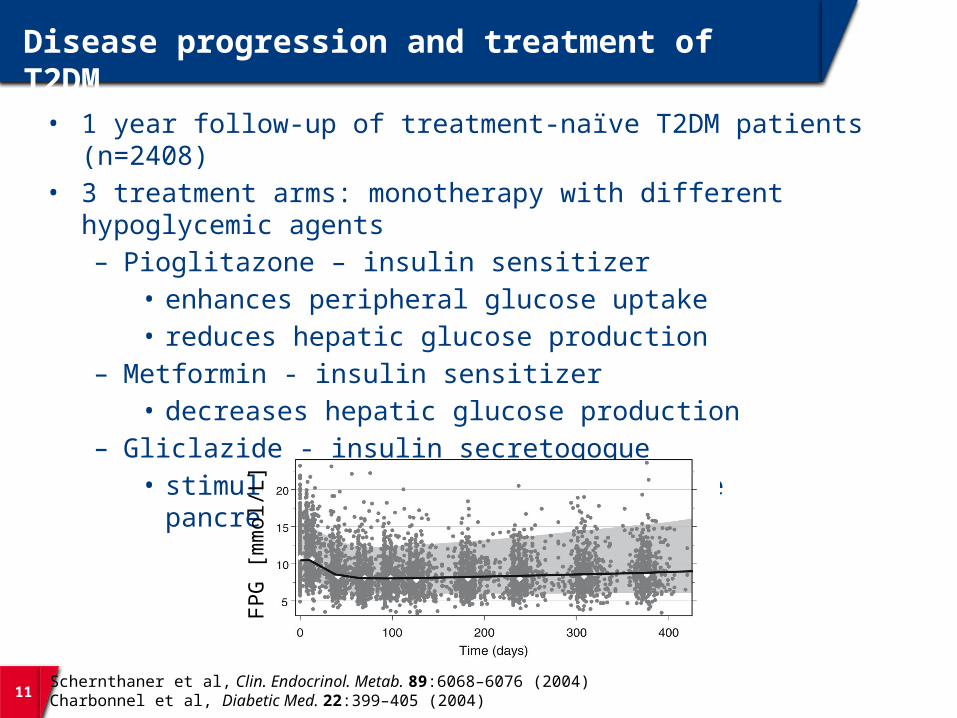
Disease progression and treatment of T2DM
• 1 year follow-up of treatment-naïve T2DM patients (n=2408)• 3 treatment arms: monotherapy with different hypoglycemic agents
– Pioglitazone – insulin sensitizer• enhances peripheral glucose uptake• reduces hepatic glucose production
– Metformin - insulin sensitizer• decreases hepatic glucose production
– Gliclazide - insulin secretogogue• stimulates insulin secretion by the pancreatic beta-cells
FPG
[mm
ol/L
]
Schernthaner et al, Clin. Endocrinol. Metab. 89:6068–6076 (2004)Charbonnel et al, Diabetic Med. 22:399–405 (2004)

12
Glucose-insulin homeostasis model
• Pharmaco-Dynamic model • 3 ODE’s, 15 parameters
hepatic glucose production
glucose utilization
insulin secretion
glucose (FPG)
insulinsensitivity (S)
insulin (FSI)HbA1c
beta-cell function (B)
OHA(insulin sensitizer)
OHA(insulin secretagogue)
1 2
1 2
1 2
1
2
compensation phase: hyperinsulinemiaexhaustion phase: disease onsettreatment effects
De Winter et al. (2006) J Pharmacokinet Pharmcodyn, 33(3):313-343
FPG: fasting plasma glucoseFSI: fasting serum insulinHbA1c: glycosylated hemoglobin A1c

13
T2DM disease progression model
• Fixed parameters
• Adaptive changes in -cell function B(t) and insulin sensitivity S(t)
• Parameter trajectories
Nyman et al, Interface Focus. 2016 Apr 6;6(2): 20150075

Reducing bias while controlling variance
• The common way to handle the flexibility constraint is to restrict / broaden the model class
• If an explicit penalty is added, this is known as regularization
14 Cedersund & Roll (2009) FEBS J 276: 903
15
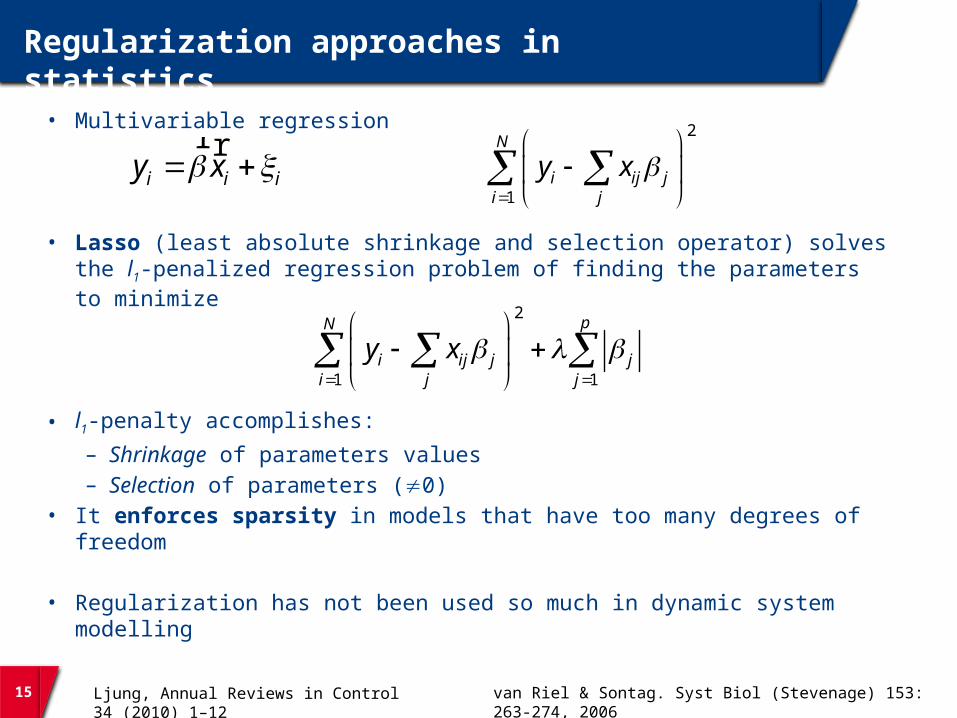
Regularization approaches in statistics
• Multivariable regression
• Lasso (least absolute shrinkage and selection operator) solves the l1-penalized regression problem of finding the parameters to minimize
• l1-penalty accomplishes:– Shrinkage of parameters values– Selection of parameters (0)
• It enforces sparsity in models that have too many degrees of freedom
• Regularization has not been used so much in dynamic system modelling
2
1
N
i ij ji j
y x
i i iy x
r r
2
1 1
pN
i ij j ji j j
y x
Ljung, Annual Reviews in Control 34 (2010) 1–12 van Riel & Sontag. Syst Biol (Stevenage) 153: 263-274, 2006
16
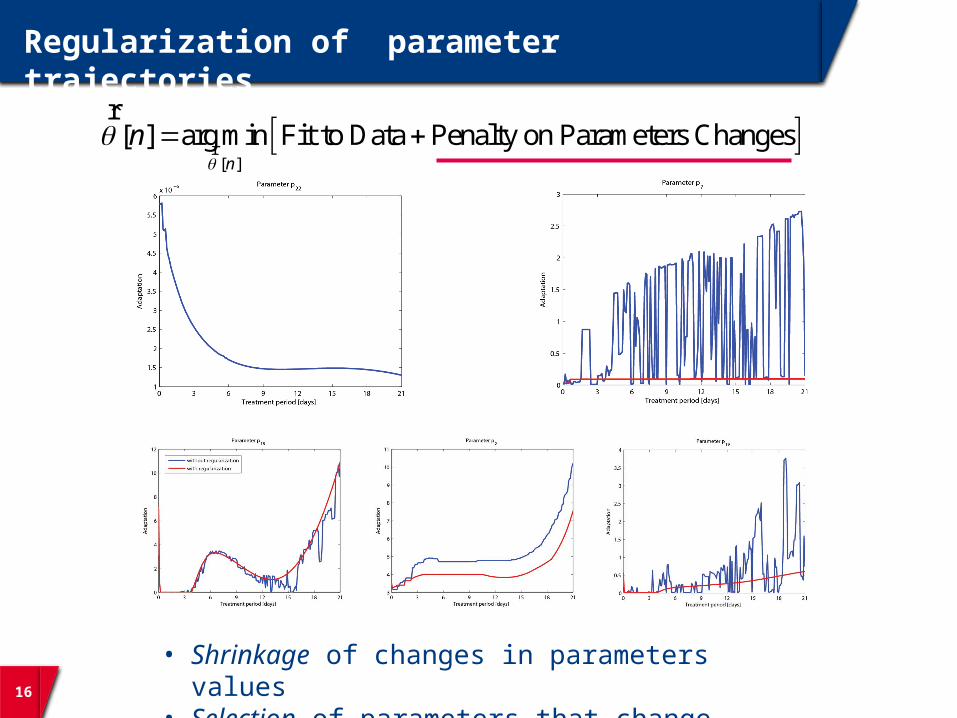
Regularization of parameter trajectories
[ ]
ˆ[ ] arg min Fit to Data Penalty on Parameters Changesn
n
r
r
• Shrinkage of changes in parameters values• Selection of parameters that change
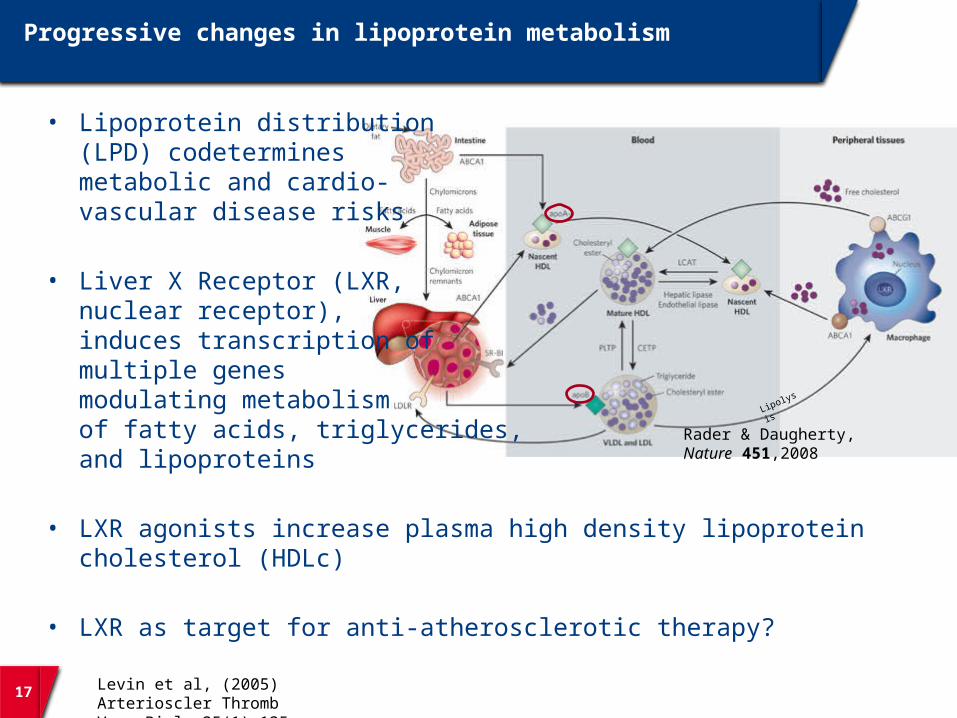
Progressive changes in lipoprotein metabolism
17
Rader & Daugherty, Nature 451,2008
Lipolysis
• Lipoprotein distribution (LPD) codetermines metabolic and cardio-vascular disease risks
• Liver X Receptor (LXR, nuclear receptor),induces transcription of multiple genes modulating metabolism of fatty acids, triglycerides, and lipoproteins
• LXR agonists increase plasma high density lipoprotein cholesterol (HDLc)
• LXR as target for anti-atherosclerotic therapy?
Levin et al, (2005) Arterioscler Thromb Vasc Biol. 25(1):135-42
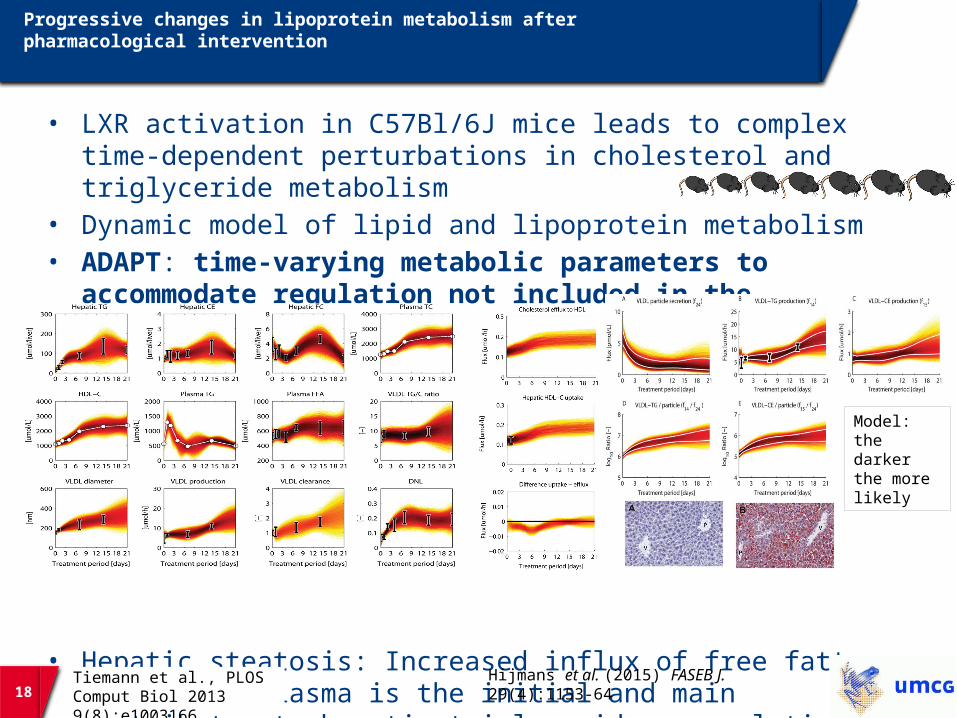
Progressive changes in lipoprotein metabolism after pharmacological intervention
• LXR activation in C57Bl/6J mice leads to complex time-dependent perturbations in cholesterol and triglyceride metabolism
• Dynamic model of lipid and lipoprotein metabolism• ADAPT: time-varying metabolic parameters to accommodate
regulation not included in the metabolic model
• Hepatic steatosis: Increased influx of free fatty acids from plasma is the initial and main contributor to hepatic triglyceride accumulation
18Tiemann et al., PLOS Comput Biol 2013 9(8):e1003166
Hijmans et al. (2015) FASEB J. 29(4):1153-64
Model: the darker the more likely

Quantification of Identifiability and Uncertainty
Verification, Validation, and Uncertainty Quantification (VVUQ)
• Profile Likelihood Analysis (PLA)
• Prediction Uncertainty Analysis (PUA)– Ensemble modelling
• Uncertainty quantification: the elephant in the room
19
Raue.et al 2009 Bioinformatics, 25(15): 1923-1929Vanlier et al. 2012 Bioinformatics, 28(8):1130-5
“Uncertainty quantification is an underdeveloped science, emerging from real-life problems.” Bassingthwaighte JB. Biophys J. 2014 Dec 2;107(11):2481-3
Vanlier et al. Math Biosci. 2013 Mar 25Vanlier et al. Bioinformatics. 2012, 28(8):1130-5
Conclusions
• The network structure of the biological systems imposes strong constraints on possible solutions of a model
• The bias - variance trade-off is often reached for rather large bias, not favoring MLE
• Systems Biology / Systems Medicine is entering an era in which dynamic models, despite their size and complexity, are not flexible enough to correctly describe all data
• Computational techniques to introduce more degrees of freedom in models, but simultaneously enforcing sparsity if extra flexibility is not required (ADAPT)
• Model estimation tools are complemented with ‘regularization’ methods to reduce the error (bias) in models without escalating uncertainties (variance)
20

21
Systems Biology of Disease Progression - ADAPT modelinghttp://www.youtube.com/watch?v=x54ysJDS7i8