BioSB Conference 2016
Quantification of variability and uncertainty in systems medicine models
April 20, 2016Natal van RielEindhoven University of Technology, the NetherlandsDepartment of Biomedical EngineeringSystems Biology and Metabolic [email protected]
@nvanriel

Computational modelling
• Explaining the data & understanding the biological system
2Wolkenhauer, Front Physiol. 2014; 5:21.
TOP-DOWN
BOTTOM-UP
Developing models of dynamical systems
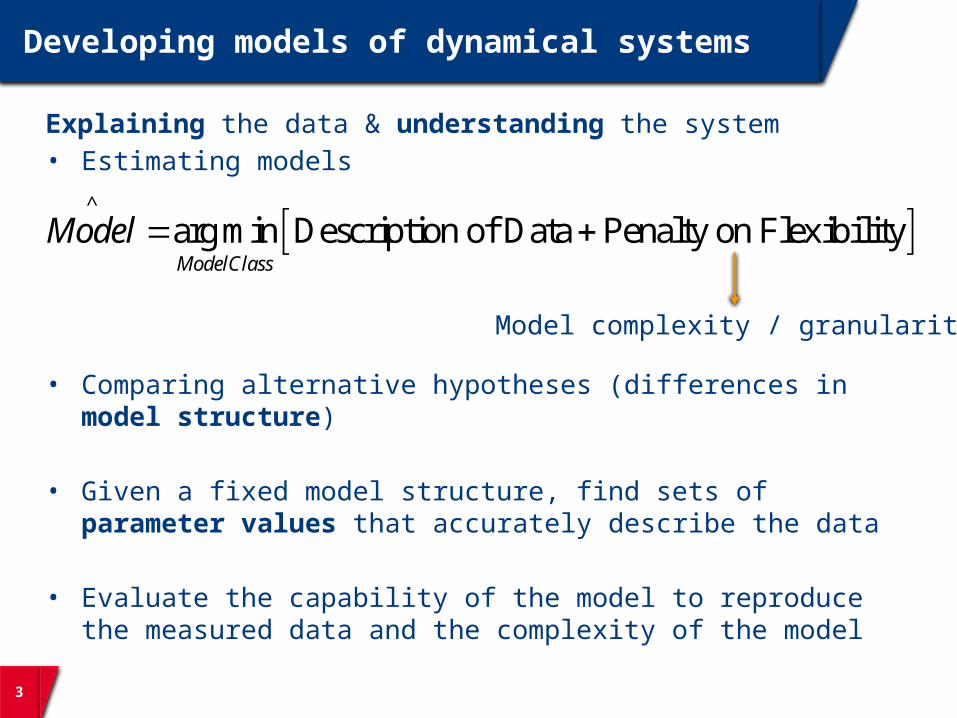
Explaining the data & understanding the system• Estimating models
• Comparing alternative hypotheses (differences in model structure)
• Given a fixed model structure, find sets of parameter values that accurately describe the data
• Evaluate the capability of the model to reproduce the measured data and the complexity of the model
3
^
arg min Description of Data Penalty on FlexibilityModelClass
Model
Model complexity / granularity

Model Errors
The error in an estimated model has two sources: 1. Too much constraints and restrictions; “too simple model sets". This
gives rise to a bias error or systematic error. 2. Data is corrupted by noise, which gives rise to a variance error or
random error.
4
^
arg min Description of Data Penalty on FlexibilityModelClass
Model
Adapted from Ljung & Chen, 2013

5
Model calibration
Parameter identification• Maximum likelihood techniques
• Implemented using nonconvex optimization
• Error model
2
2
1 1
( ) ( | )( )n N
i i
i k ik
d k y k
2
ˆ 0
ˆ arg min ( )
( ) ( | )i id k y k
( | ) ( )i iy k k
Quantitative and Predictive Modelling

6
Bias – Variance trade-off
• To minimize the MSE is a trade off in constraining the model: A flexible model gives small bias (easier to describe complex behavior) and large variance (with a flexible model it is easier to get fooled by the noise), and vice versa
• This trade-off is at the heart of all modelling that aims to explain data
Zero biasHigh variance(overfitting)
Adequate Bias - Variance trade-off

Fitting elephants
• Famous aphorism: ‘‘With four parameters I can fit an elephant, and with five I can make him wiggle his trunk’’
• Estimating dynamic models of networks is not equivalent to curve fitting• The interconnected structure of biological systems imposes strong
constraints
7
http://en.wikiquote.org/wiki/John_von_Neumann
“Even with a thousand parameters I cannot fit the biological network in a single cell of an elephant. Let alone to make him blink his eye”

Information-rich data
It is often not trivial to find a mechanistic (mechanism-based) model that can describe information-rich data of an interconnected system
• If the measurements provide sufficient coverage of the system components (details)
• Under (multiple) physiological, in vivo conditions (operational context)
8
measurements
No.
of c
ompo
nent
sNo. of observations per component

Rethinking Maximum Likelihood Estimation
9
• The bias - variance trade-off is often reached for rather large bias
• Typically, we are far away from the asymptotic situation in which Maximum Likelihood Estimation (MLE) provides the best possible estimates

10
Tiemann et al. (2011) BMC Syst Biol, 5:174Van Riel et al, Interface Focus 3(2): 20120084, 2013Tiemann et al. (2013) PloS Comput Biol, 9(8):e1003166
Room for more flexibility
• Instead of increasing structural complexity (increasing model size)• Introduce more freedom in model parameters to compensate for
bias (‘undermodelling’) in the original model structure• Increasing model flexibility using time-varying parameters
•ADAPTAnalysis of Dynamic Adaptations in Parameter Trajectories
11
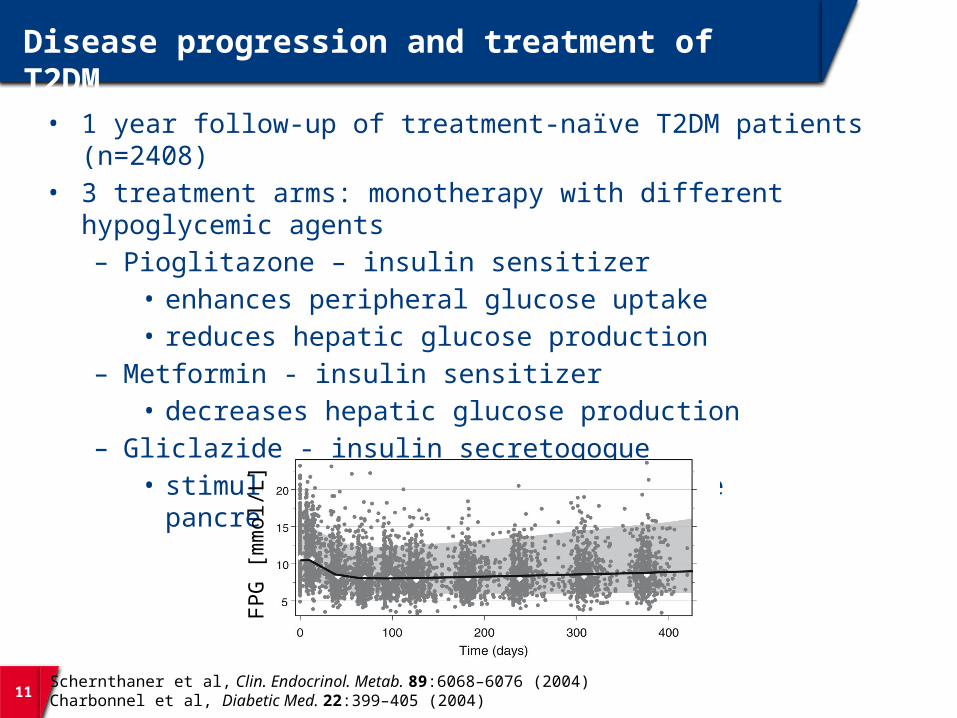
Disease progression and treatment of T2DM
• 1 year follow-up of treatment-naïve T2DM patients (n=2408)• 3 treatment arms: monotherapy with different hypoglycemic agents
– Pioglitazone – insulin sensitizer• enhances peripheral glucose uptake• reduces hepatic glucose production
– Metformin - insulin sensitizer• decreases hepatic glucose production
– Gliclazide - insulin secretogogue• stimulates insulin secretion by the pancreatic beta-cells
FPG
[mm
ol/L
]
Schernthaner et al, Clin. Endocrinol. Metab. 89:6068–6076 (2004)Charbonnel et al, Diabetic Med. 22:399–405 (2004)

12
Glucose-insulin homeostasis model
• Pharmaco-Dynamic model • 3 ODE’s, 15 parameters
hepatic glucose production
glucose utilization
insulin secretion
glucose (FPG)
insulinsensitivity (S)
insulin (FSI)HbA1c
beta-cell function (B)
OHA(insulin sensitizer)
OHA(insulin secretagogue)
1 2
1 2
1 2
1
2
compensation phase: hyperinsulinemiaexhaustion phase: disease onsettreatment effects
De Winter et al. (2006) J Pharmacokinet Pharmcodyn, 33(3):313-343
FPG: fasting plasma glucoseFSI: fasting serum insulinHbA1c: glycosylated hemoglobin A1c

13
T2DM disease progression model
• Fixed parameters
• Adaptive changes in -cell function B(t) and insulin sensitivity S(t)
• Parameter trajectories
Nyman et al, Interface Focus. 2016 Apr 6;6(2): 20150075

Reducing bias while controlling variance
• The common way to handle the flexibility constraint is to restrict / broaden the model class
• If an explicit penalty is added, this is known as regularization
14 Cedersund & Roll (2009) FEBS J 276: 903
15
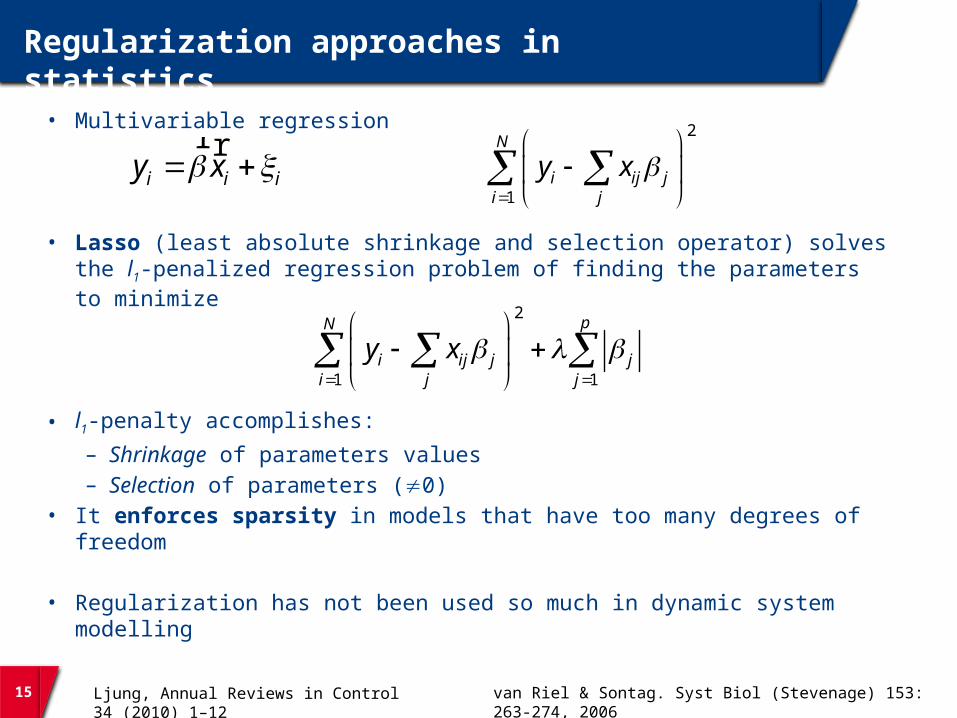
Regularization approaches in statistics
• Multivariable regression
• Lasso (least absolute shrinkage and selection operator) solves the l1-penalized regression problem of finding the parameters to minimize
• l1-penalty accomplishes:– Shrinkage of parameters values– Selection of parameters (0)
• It enforces sparsity in models that have too many degrees of freedom
• Regularization has not been used so much in dynamic system modelling
2
1
N
i ij ji j
y x
i i iy x
r r
2
1 1
pN
i ij j ji j j
y x
Ljung, Annual Reviews in Control 34 (2010) 1–12 van Riel & Sontag. Syst Biol (Stevenage) 153: 263-274, 2006
16
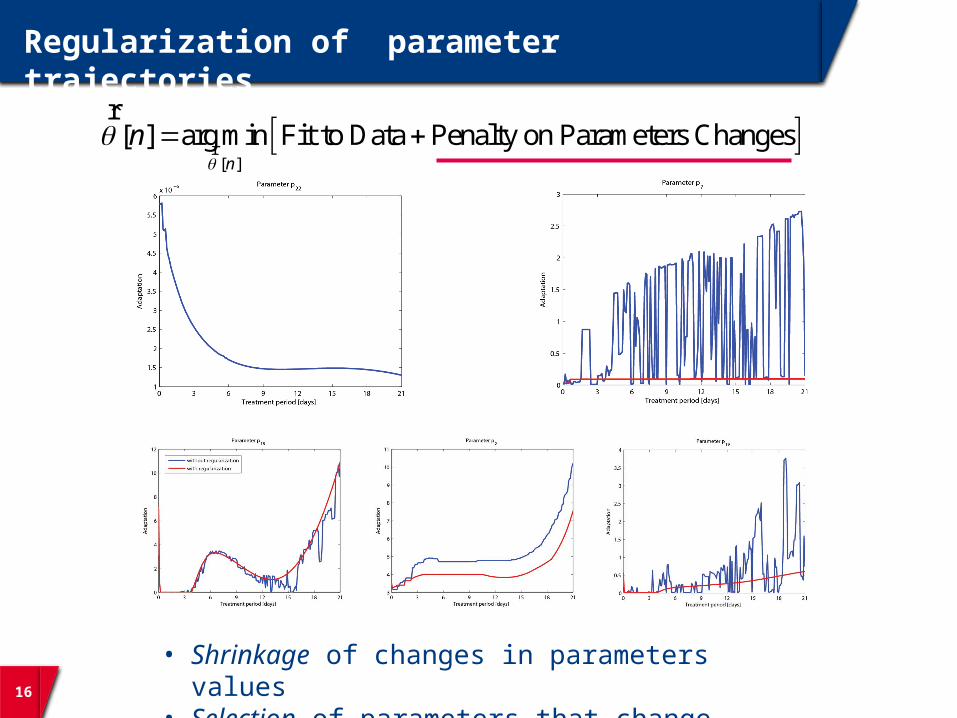
Regularization of parameter trajectories
[ ]
ˆ[ ] arg min Fit to Data Penalty on Parameters Changesn
n
r
r
• Shrinkage of changes in parameters values• Selection of parameters that change
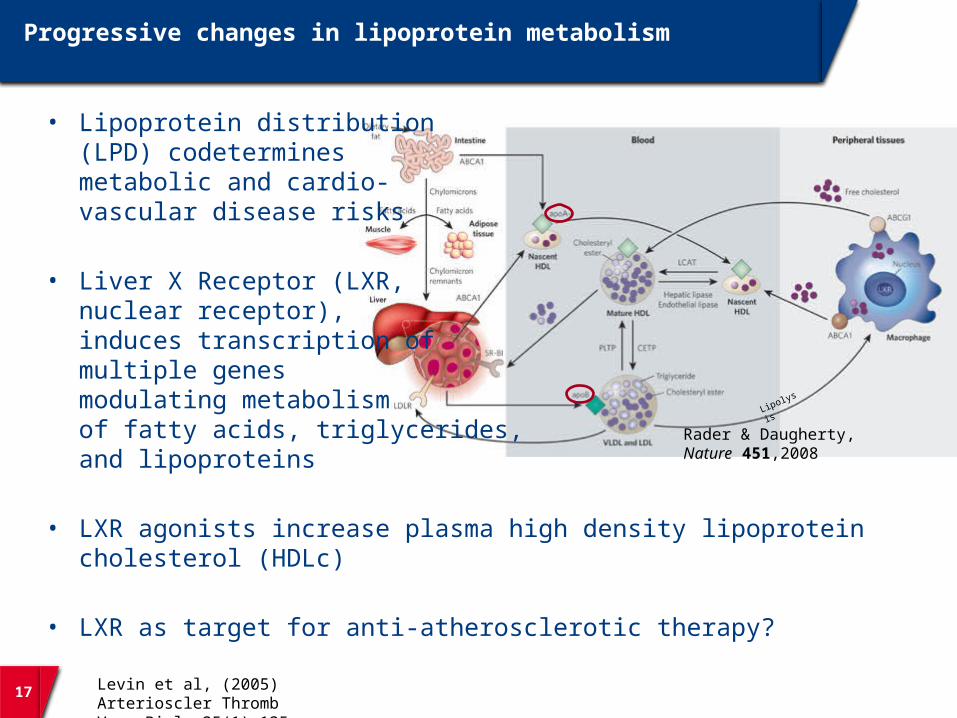
Progressive changes in lipoprotein metabolism
17
Rader & Daugherty, Nature 451,2008
Lipolysis
• Lipoprotein distribution (LPD) codetermines metabolic and cardio-vascular disease risks
• Liver X Receptor (LXR, nuclear receptor),induces transcription of multiple genes modulating metabolism of fatty acids, triglycerides, and lipoproteins
• LXR agonists increase plasma high density lipoprotein cholesterol (HDLc)
• LXR as target for anti-atherosclerotic therapy?
Levin et al, (2005) Arterioscler Thromb Vasc Biol. 25(1):135-42
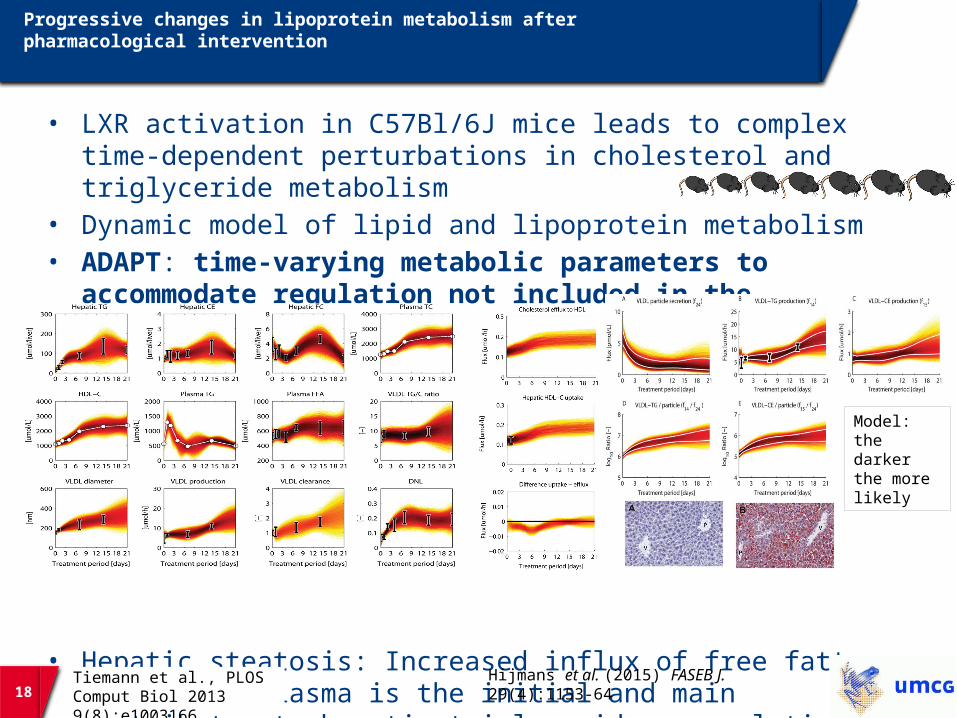
Progressive changes in lipoprotein metabolism after pharmacological intervention
• LXR activation in C57Bl/6J mice leads to complex time-dependent perturbations in cholesterol and triglyceride metabolism
• Dynamic model of lipid and lipoprotein metabolism• ADAPT: time-varying metabolic parameters to accommodate
regulation not included in the metabolic model
• Hepatic steatosis: Increased influx of free fatty acids from plasma is the initial and main contributor to hepatic triglyceride accumulation
18Tiemann et al., PLOS Comput Biol 2013 9(8):e1003166
Hijmans et al. (2015) FASEB J. 29(4):1153-64
Model: the darker the more likely

Quantification of Identifiability and Uncertainty
Verification, Validation, and Uncertainty Quantification (VVUQ)
• Profile Likelihood Analysis (PLA)
• Prediction Uncertainty Analysis (PUA)– Ensemble modelling
• Uncertainty quantification: the elephant in the room
19
Raue.et al 2009 Bioinformatics, 25(15): 1923-1929Vanlier et al. 2012 Bioinformatics, 28(8):1130-5
“Uncertainty quantification is an underdeveloped science, emerging from real-life problems.” Bassingthwaighte JB. Biophys J. 2014 Dec 2;107(11):2481-3
Vanlier et al. Math Biosci. 2013 Mar 25Vanlier et al. Bioinformatics. 2012, 28(8):1130-5
Conclusions
• The network structure of the biological systems imposes strong constraints on possible solutions of a model
• The bias - variance trade-off is often reached for rather large bias, not favoring MLE
• Systems Biology / Systems Medicine is entering an era in which dynamic models, despite their size and complexity, are not flexible enough to correctly describe all data
• Computational techniques to introduce more degrees of freedom in models, but simultaneously enforcing sparsity if extra flexibility is not required (ADAPT)
• Model estimation tools are complemented with ‘regularization’ methods to reduce the error (bias) in models without escalating uncertainties (variance)
20

21
Systems Biology of Disease Progression - ADAPT modelinghttp://www.youtube.com/watch?v=x54ysJDS7i8
Recommended