Embed Size (px)
Citation preview

Maize Lethal Necrosis
Molecular breeding
CIMMYT

MLN – Molecular breeding
MLN – Two viruses + interaction effect
Transmission by many insect vectors
Seed transmission
Alternative vectors – sugarcane, sorghum?
MCMV interact with other poty viruses too
Therefore genetic control is the more effective
way to control MLN
Understanding the genetic architecture of the
MLN is crucial and here molecular breeding
come into picture

Discovery – Discover genomic regions associated with
MLN resistance
Validation – Validate the results
Deployment – Integrate into breeding program
Major genes - MABC
Minor genes / quantitative trait - MARS or GWS
MLN – Molecular breeding

Maize Lethal Necrosis - Discovery
Association studies
QTL Mapping
Validation of AM results with QTL Mapping
Genomic prediction
Implementation - MABC
4

Association mapping panels - Two
IMAS panel – 382 lines genotyped
with GBS,
Artificial inoculation – 3
DTMA panel – 235 lines - GBS,
Artificial inoculation - 3
Natural inoculation - 2
Maize Lethal Necrosis

IMAS panel DTMA panel
Phenotypic analysis – Across environments

MLN_86DAP Environment Mean (range) σ²G σ²GxE σ²e h²
IMAS panel
Narok12 2.84 (1.00-4.99) 0.36** - 0.27 0.73
Narok13 3.20 (1.00-5.00) 0.34** - 0.32 0.68
Naivasha13 2.83 (1.14-5.00) 0.25** - 0.60 0.40
Across Env 2.98 (1.15-4.85) 0.25** 0.08** 0.38 0.73
Phenotypic analysis - AM panel
DTMA panel
Naivasha13 3.66 (2.01-5.00) 0.16** - 0.19 0.63
Naivasha14 3.29 (1.99-4.25) 0.11** - 0.22 0.68
Narok13 3.61 (2.31-5.00) 0.12** - 0.34 0.41
Across Env 3.53 (2.51-5.00) 0.09** 0.05** 0.23 0.62
Across Across Env 3.00 (1.00-5.00) 0.19** 0.07** 0.45 0.78

Genotype
MLND scores (scale 1-5) Seed
color
Breeding Program
Env1 Env2 Env3 Across Env
CLRCY039 1.18 0.92 1.14 1.17 Yellow CIMMYT lowland tropics
CPHYS138 1.02 1.49 1.42 1.32 Yellow CIMMYT Physiology
CLRCY034 1.14 1.62 1.71 1.48 Yellow CIMMYT lowland tropics
CLWN270 1.36 1.80 1.41 1.52 Yellow CIMMYT lowland tropics
CKL05003 1.12 1.58 2.12 1.62 White CIMMYT Kenya
SM-189-75 1.07 1.57 2.26 1.69 Orange KALRO, Kenya
CLWQ251 1.42 2.28 1.60 1.81 White CIMMYT lowland tropics
CML494 1.33 2.30 1.92 1.83 White CIMMYT Gene bank
SM-189-38 1.73 1.88 1.63 1.86 White KALRO, Kenya
CPHYS159 1.97 1.50 2.15 1.86 White CIMMYT Physiology
CLYN261 1.87 1.49 2.19 1.87 Yellow CIMMYT lowland tropics
SM-189-78 1.86 2.75 1.14 1.88 Orange KALRO, Kenya
CLYN231 1.08 2.03 2.48 1.90 Orange CIMMYT lowland tropics
SM-189-69 1.23 1.98 2.59 1.99 Yellow KALRO, Kenya

Genome-wide Association mapping
Quality screening of GBS markers
Select the SNPs with MAF of > 0.01
Remove the SNPs with >5% of the missing
Select the lines which has both genotypic and
phenotypic data
For IMAS the final set has 381 lines and 259,476
SNPs
For DTMA the final set has 235 lines and 260,000
SNPs

PCA and density distribution plots

MLM based GWAS results
DTMA-AM panel
P<0.00001

MLM based association mapping results
Chr - SNP
MLM_P values
Pg
(%) MAF
M
allele FAE
Donors
86DAP
Lowland
Midland
Highland
S1_52083545 1.06E-05 7.36 0.22 A 0.09 CLRCY039
CLRCY034
DTPYC9-F46-
1-2-1-2-B
CLWN270
CLWQ251
CML494
CLYN261
CLYN231
LaPoSeqC7-
F78-2-1-1-1-B
CML543
BSC-9
BSC-12
BSC13
KTN71-3 S2_8916323 7.03E-06 7.99 0.03 A -1.06
S2_38324933 3.97E-06 8.39 0.32 G -0.35
S2_211771737 2.51E-06 8.38 0.03 G -1.38
S3_44062810 1.66E-06 8.36 0.36 T 0.02
S3_169349054 7.53E-06 7.47 0.07 A -0.57
S3_202831000 5.25E-06 8.09 0.02 C 0.00
S3_203868724 1.10E-06 7.88 0.02 G 0.00
S5_162012868 1.00E-06 9.56 0.02 A -1.21
S5_198780420 9.38E-06 7.57 0.48 C 0.05
S6_70013961 5.92E-06 6.79 0.01 A 0.00
S9_2825540 3.19E-06 8.42 0.26 T -0.42
S9_152057703 8.63E-06 7.78 0.47 G -0.07
S10_9212960 9.66E-06 7.37 0.17 A -0.02
S10_103937258 6.83E-06 8.04 0.02 T -0.73
Total 59.0

SNP Chr Position
(Mba)
MLM-P
values
Pg (%) Putative
candidate genes
Predicted function of
candidate gene
S1_46411896 1 46.4 6.78E-05 15.26 GRMZM5G814718 Oxidoreductase activity
S1_269037989 1 269.0 2.86E-05 16.16 GRMZM2G047055 Actin cross link
S5_16837972 5 16.8 5.04E-06 17.91 GRMZM2G077828 Unknown
S5_16839191 5 16.8 3.79E-06 18.44 GRMZM2G018943 Translation initiation factor eIF-2B
delta subunit
S5_95192724 5 95.1 6.26E-06 18.81 GRMZM2G109805 Hypersensitivity
S5_199371477 5 199.3 3.43E-05 14.91 GRMZM2G376067 MAIZE Putative uncharacterized
protein
S6_84786872 6 84.7 4.29E-06 18.42 GRMZM2G139073 MADS-box transcription factor
S7_15457394 7 15.4 4.13E-05 14.67 GRMZM2G480050 Response to freezing
S10_148638187 10 148.6 5.11E-05 15.30 GRMZM2G074754 Transporter activity
Total 41.93
MLM based association mapping results

Association mapping - Conclusions
Best 15 significant SNPs explained individually 7 to
10% and together up to 59% of the total genotypic
variance for MLN resistance
MLN is controlled by few major and many minor
genes
The best performing lines can be used as a donors
Validation of significant SNPs is crucial

Pop1 – CML444 x CML539,
pop size 184, Locations - 3
Pop2 – CML444 x CML543,
Pop size 203, Locations – 3
Pop3 – LaPostaSeqC7-F71-1-2-1-2-B-B-B-B. x CML543,
Pop size 229, Locations – 3
Pop4 – M37W x CML144 – Pop size -130
Pop5 – J80W x CML144 - Pop size -156
DH Pop – CML494 x CML550 - Pop size -236
Maize Lethal Necrosis – QTL mapping

Maize Lethal Necrosis – CML539xCML444
MLN2_Bom MLN2_Nai MLN2_Ole MLN2_3loc
12
34
5
Dis
ea
se
se
ve
rity
sca
le (
1-5
)
CML444 CML539
86DAP
CML444 2.71
CML539 (CZL3014) 3.35
CML543(CML543) 2.32
La Posta Seq C7-F71-1-2-1-2-B-B-B-B-B 3.27

Maize Lethal Necrosis – CML539xCML444
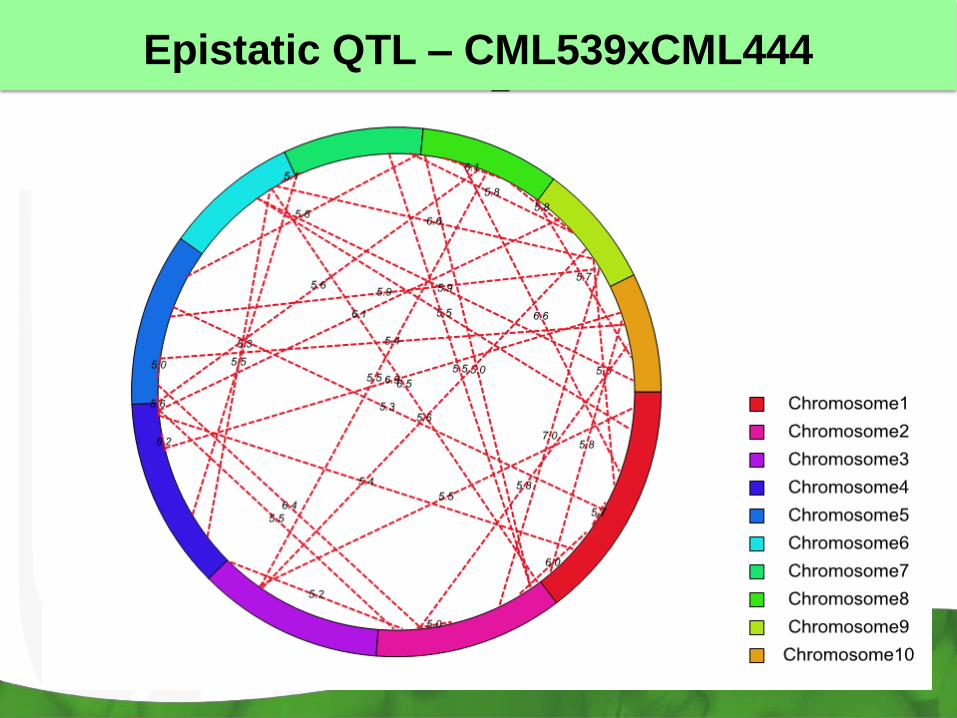
Epistatic QTL – CML539xCML444
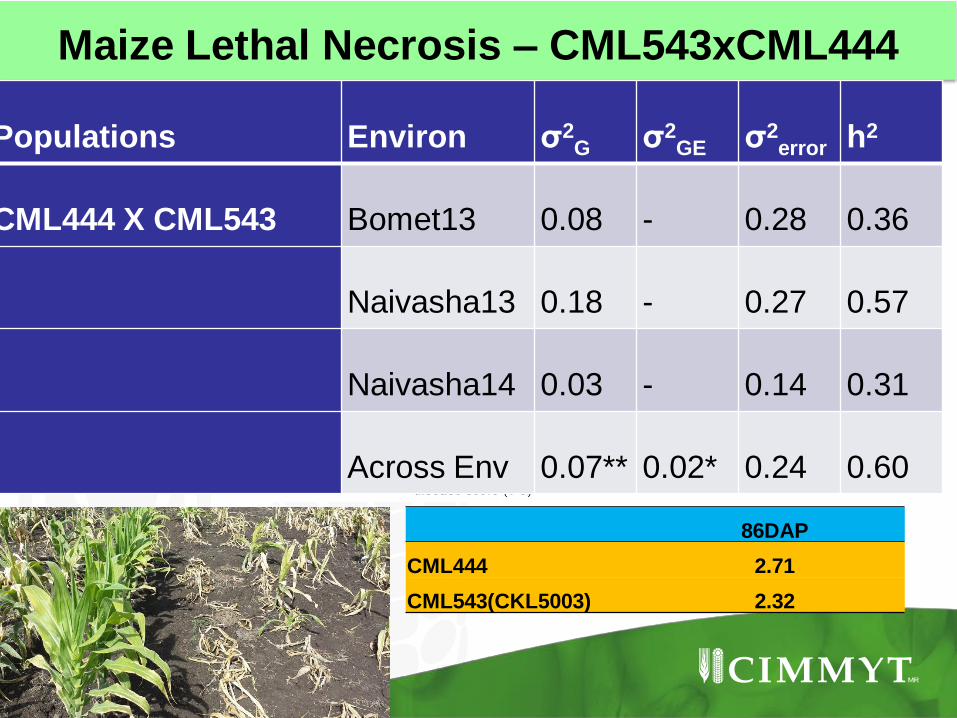
Maize Lethal Necrosis – CML543xCML444
86DAP
CML444 2.71
CML543(CKL5003) 2.32
Populations Environ σ2G σ2
GE σ2error h2
CML444 X CML543 Bomet13 0.08 - 0.28 0.36
Naivasha13 0.18 - 0.27 0.57
Naivasha14 0.03 - 0.14 0.31
Across Env 0.07** 0.02* 0.24 0.60

Main and Epistatic QTL – CML543xCML444

Pop3 - CML543xLa Posta Seq C7-F71
86DAP
La Posta Seq C7-F71-1-2-1-2-B-B-B-B-B 3.27
CML543(CKL5003) 2.32
Environments σ2G σ2
GE σ2error h2
Bomet13 0.21** - 0.25 0.62
Naivasha13 0.17** - 0.32 0.52
Naivasha14 0.02** - 0.12 0.29
Across Env 0.06** 0.06** 0.23 0.52

CML543xLa Posta Seq C7-F71

CML494xCML550 DH pop
Chromosome 1
15.7Mbp
Chromosome 3 Chromosome 7 Chromosome 9

Conclusion
In each Pop and DH – best 3 major QTL are explained ~40-
50% of the total phenotypic variance
Major additive QTL detected on Chr 3 was consistent across
scorings and locations in two populations
The presence of major QTL(s) on chromosome 3 and 6 are
planned to use in MABC to improve the resistance in the
elite lines

Prediction of MLN performance based on random
and random with linked SNPs
Inclusion of MLN resistance associated SNPs can
significantly increase the prediction accuracy

Future direction for discovery phase
MLN --- SCMV + MCMV + Interaction
SCMV – Oligogenic – Major genes
MCMV – Oligogenic or polygenic
Interaction effect – Complex and non-genetic
Selecting resistance for individual viruses, either
in same or in different lines, to avoid interaction
effect and able to manage MLN effectively
26
MCMV1 MCMV2 MCMV3 MCMV4
Geno_Var 0.09 0.12 0.25 0.13
Block_Var 0.01 0.02 0.05 0.00
Res_Var 0.06 0.09 0.15 0.24
Herritability 0.73 0.73 0.77 0.52
Trait Marker Chr P-value Pg (%)
MCMV2 S1_273096577 1 6.86E-06 10.22
MCMV2 S1_273036576 1 6.93E-06 9.39
MCMV2 S1_240766785 1 4.72E-05 7.85
MCMV2 S2_63372985 2 9.12E-05 7.64
MCMV2 S4_30928389 4 3.49E-05 8.16
MCMV2 S5_143970340 5 2.35E-05 9.36
MCMV2 S6_161804207 6 9.29E-05 7.52
MCMV2 S7_29253328 7 5.60E-05 8.23
MCMV2 S8_139630981 8 3.72E-05 8.37
MCMV2 S8_166902808 8 7.47E-05 7.63
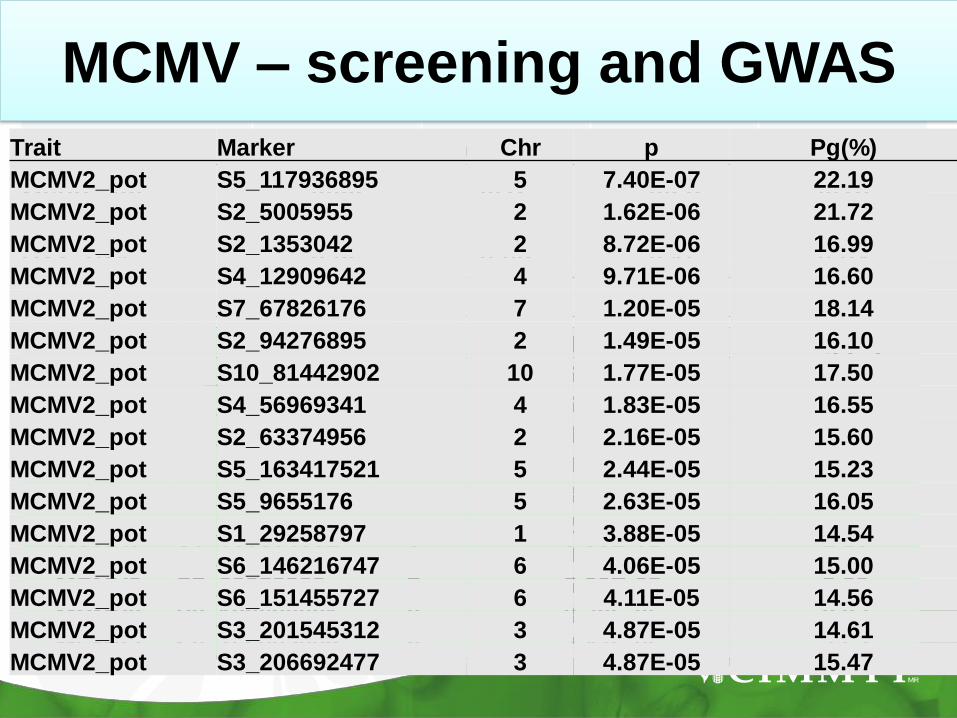
MCMV – screening and GWAS
Trait Marker Chr p Pg(%)
MCMV2_pot S5_117936895 5 7.40E-07 22.19
MCMV2_pot S2_5005955 2 1.62E-06 21.72
MCMV2_pot S2_1353042 2 8.72E-06 16.99
MCMV2_pot S4_12909642 4 9.71E-06 16.60
MCMV2_pot S7_67826176 7 1.20E-05 18.14
MCMV2_pot S2_94276895 2 1.49E-05 16.10
MCMV2_pot S10_81442902 10 1.77E-05 17.50
MCMV2_pot S4_56969341 4 1.83E-05 16.55
MCMV2_pot S2_63374956 2 2.16E-05 15.60
MCMV2_pot S5_163417521 5 2.44E-05 15.23
MCMV2_pot S5_9655176 5 2.63E-05 16.05
MCMV2_pot S1_29258797 1 3.88E-05 14.54
MCMV2_pot S6_146216747 6 4.06E-05 15.00
MCMV2_pot S6_151455727 6 4.11E-05 14.56
MCMV2_pot S3_201545312 3 4.87E-05 14.61
MCMV2_pot S3_206692477 3 4.87E-05 15.47

Thank you