Embed Size (px)
Citation preview

Selection and demography in maize evolution
Jeffrey Ross-Ibarra @jrossibarra • www.rilab.org
Dept. Plant Sciences • Center for Population Biology • Genome Center University of California Davis
photo by lady_lbrty


Photos: Matt Hufford, Brandon Gaut, John Doebley

maizeteosinte
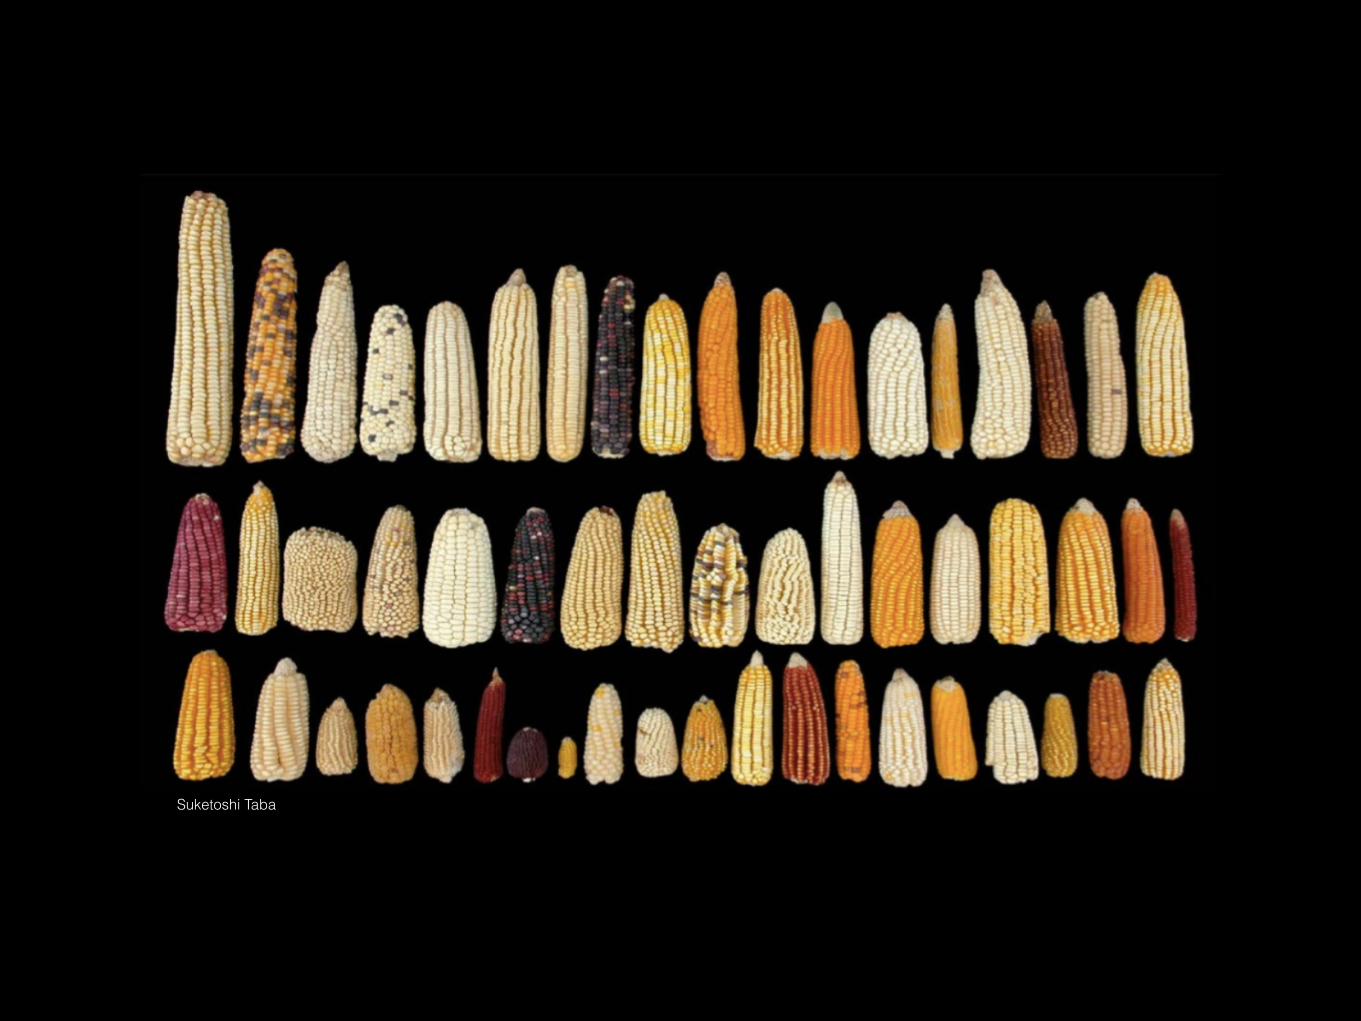
Suketoshi Taba

Geo
grap
hica
l Bre
adth
0
0.02
0.04
0.06
0.08
0.1
mai
ze
pota
to
whe
at
soyb
ean
sorg
hum
barle
y
sunfl
ower
rice
grou
ndnu
t
rape
seed
cass
ava
mill
et rye
suga
rcan
e
oilp
alm
suga
rbee
tHake & Ross-Ibarra 2015 eLife
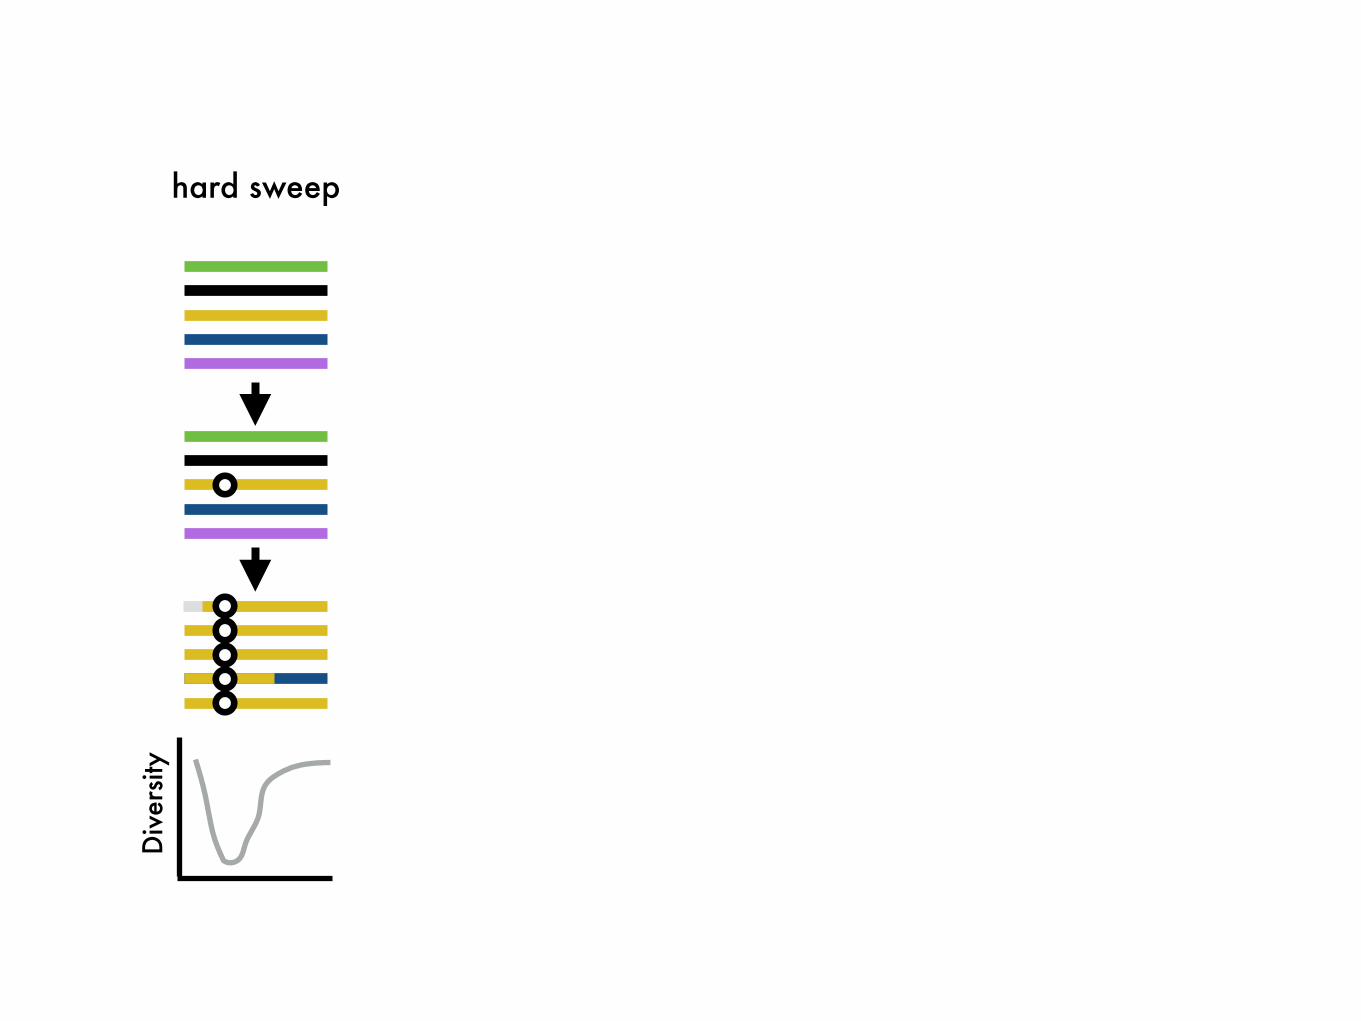
hard sweepD
iver
sity

hard sweep multiple mutations
Div
ersit
ystanding variation
“soft” sweeps

hard sweep multiple mutations polygenic adaptation
Div
ersit
ystanding variation
“soft” sweeps

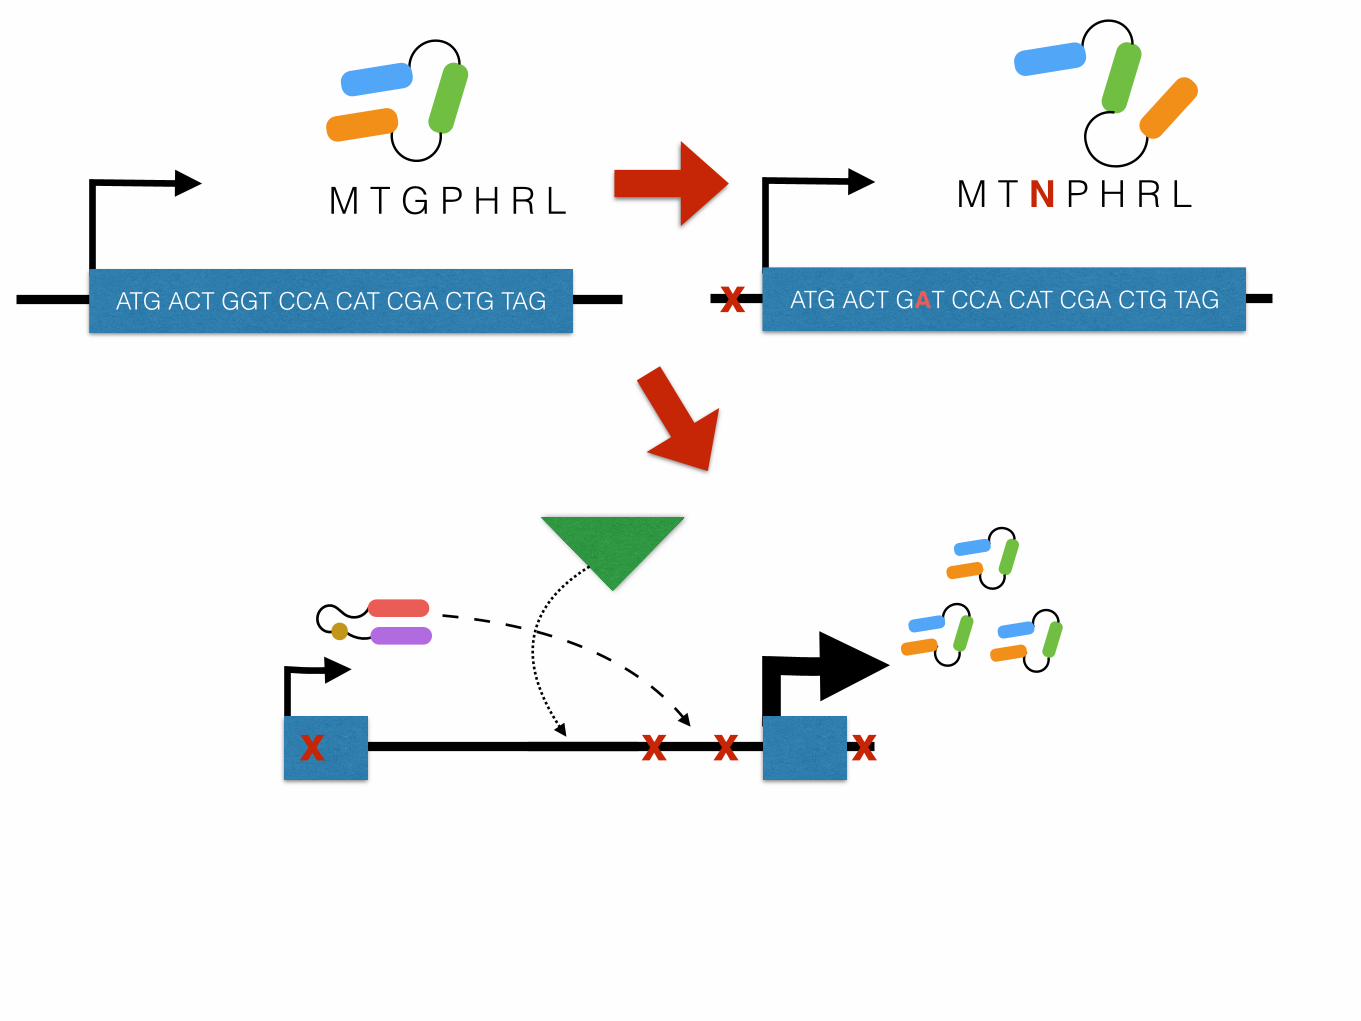
M T G P H R L
GGTCGAC ATG ACT GGT CCA CAT CGA CTG TAG

M T G P H R L
GGTCGAC ATG ACT GGT CCA CAT CGA CTG TAG
M T N P H R L
GGTCGAC ATG ACT GAT CCA CAT CGA CTG TAG
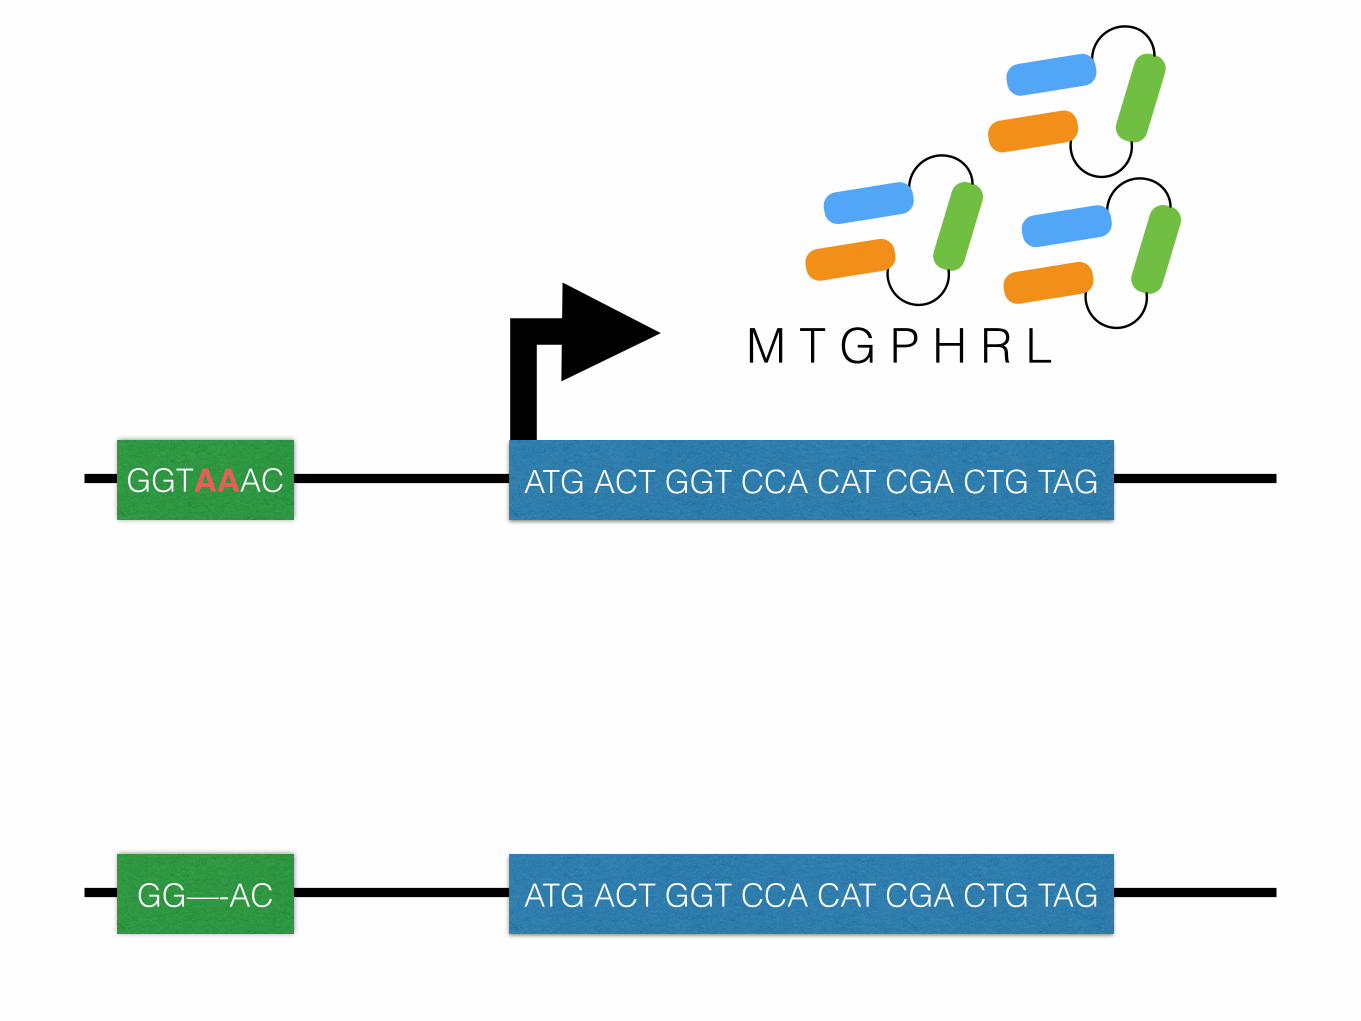
M T G P H R L
GGTAAAC ATG ACT GGT CCA CAT CGA CTG TAG
GG—-AC ATG ACT GGT CCA CAT CGA CTG TAG

Meyerowitz 1994 Current Biology Duvick et al. 1999 US 6639132 B1
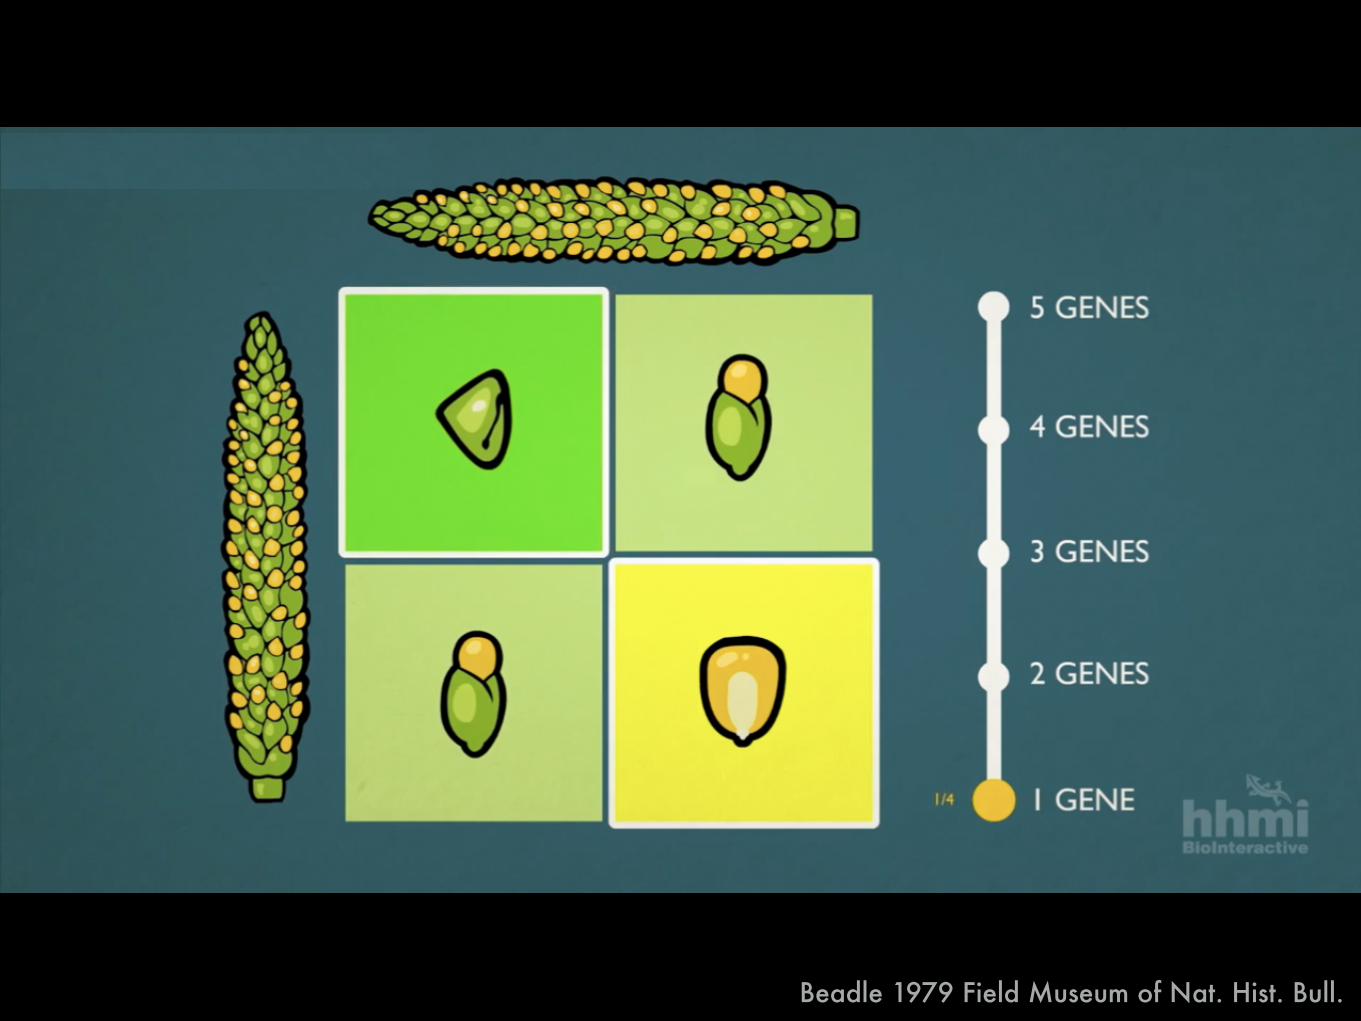
maize origins
Tripsacum extinct maizeF1F1
teosinte (Z. mays ssp. parviglumis)
maize (Z. mays ssp. mays)

F1
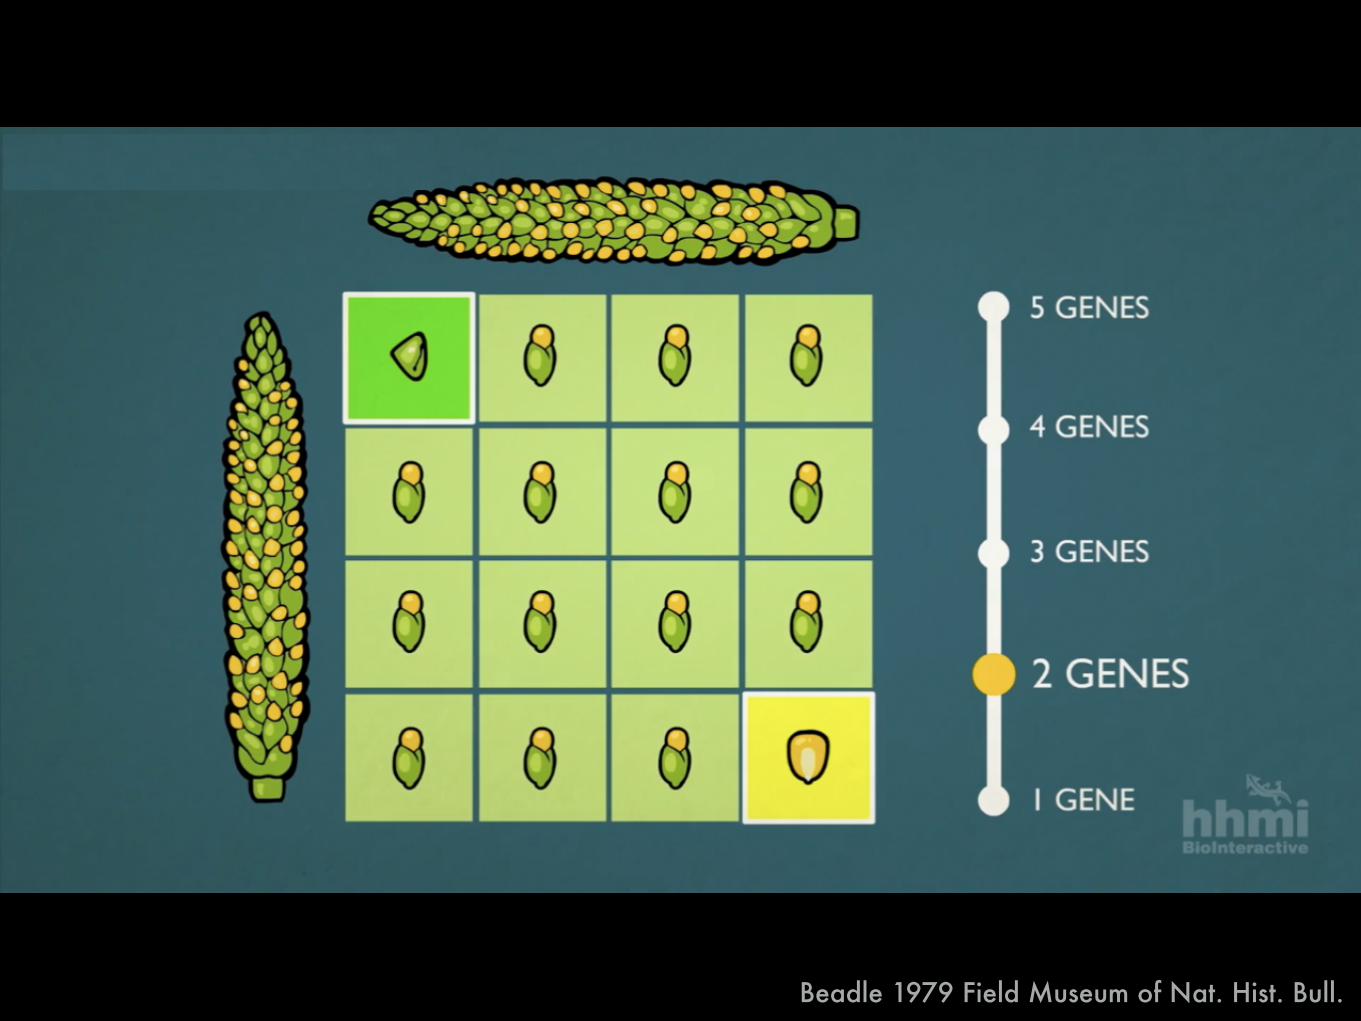
Beadle 1979 Field Museum of Nat. Hist. Bull.
F1
Beadle 1979 Field Museum of Nat. Hist. Bull.
F1
Beadle 1979 Field Museum of Nat. Hist. Bull.

F1
Beadle 1979 Field Museum of Nat. Hist. Bull.

Briggs et al. 2007 Genetics
1 2 3 4 5
6 7 8 9 10

Wang et al. 2005 Nature
1 2 3 4 5
6 7 8 9 10
Figure 1.Phenotypes. a. Maize ear showing the cob (cb) exposed at top. b. Teosinte ear with the rachisinternode (in) and glume (gl) labeled. c. Teosinte ear from a plant with a maize allele of tga1introgressed into it. d. Close-up of a single teosinte fruitcase. e. Close-up of a fruitcase fromteosinte plant with a maize allele of tga1 introgressed into it. f. Ear of maize inbred W22(Tga1-maize allele) with the cob exposed showing the small white glumes at the base. g. Earof maize inbred W22:tga1 which carries the teosinte allele, showing enlarged (white) glumes.h. Ear of maize inbred W22 carrying the tga1-ems1 allele, showing enlarged glumes. For highermagnification copies of f–h see Supplementary Information.
Wang et al. Page 10
Nature. Author manuscript; available in PMC 2006 May 23.
NIH
-PA
Author M
anuscriptN
IH-P
A A
uthor Manuscript
NIH
-PA
Author M
anuscript
tga1
Wang et al. 2015 Genetics

1 2 3 4 5
6 7 8 9 10
gt1 tga1
Wills et al. 2013 PLoS Genetics

1 2 3 4 5
6 7 8 9 10
gt1 tga1
Wills et al. 2013 PLoS Genetics
teosinte maizeClint Whipple, BYU

1 2 3 4 5
6 7 8 9 10
gt1 tga1
Wills et al. 2013 PLoS Genetics

1 2 3 4 5
6 7 8 9 10
gt1 tga1
Wills et al. 2013 PLoS Genetics
5’ control region 3’ UTR

1 2 3 4 5
6 7 8 9 10
tb1
Studer et al. 2011 Nat. Gen.; Vann et al. 2015 PeerJ
tga1gt1

1 2 3 4 5
6 7 8 9 10
tb1
Studer et al. 2011 Nat. Gen.; Vann et al. 2015 PeerJ
tga1
©20
11 N
atur
e A
mer
ica,
Inc.
All
righ
ts r
eser
ved.
NATURE GENETICS ADVANCE ONLINE PUBLICATION 3
L E T T E R S
mutation rate21, strongly suggesting that the Hopscotch insertion (and thus, the older Tourist as well) existed as standing genetic variation in the teosinte ancestor of maize. Thus, we conclude that the Hopscotch insertion likely predated domestication by more than 10,000 years and the Tourist insertion by an even greater amount of time.
We identified four fixed differences in the portion of the proximal and distal components of the control region that show evidence of selection. We used transient assays in maize leaf protoplasts to test all four differences for effects on gene expression. Maize and teosinte chromosomal segments for the portions of the proximal and distal components with these four differences were cloned into reporter constructs upstream of the minimal promoter of the cauliflower mosaic virus (mpCaMV), the firefly luciferase ORF and the nopaline synthase (NOS) terminator (Fig. 4). Each construct was assayed for luminescence after transformation by electroporation into maize pro-toplast. The constructs for the distal component contrast the effects of the Tourist insertion plus the single fixed nucleotide substitution that distinguish maize and teosinte. Both the maize and teosinte constructs for the distal component repressed luciferase expression
relative to the minimal promoter alone. The maize construct with Tourist excised gave luciferase expression equivalent to the native maize and teosinte constructs and less expression than the minimal promoter alone. These results indicate that this segment is function-ally important, acting as a repressor of luciferase expression and, by inference, of tb1 expression in vivo. However, we did not observe any difference between the maize and teosinte constructs as anticipated. One possible cause for the lack of differences in expression between the maize and teosinte constructs might be that additional proteins required to cause these differences are not present in maize leaf pro-toplast. Another possibility is that the factor affecting phenotype in the distal component lies in the unselected region between −64.8 and −69.5 kb, which is not included in the construct. Nevertheless, the results do indicate that the distal component has a functional element that acts as a repressor. The functional importance of this segment is supported by its low level of nucleotide diversity (Fig. 3a), suggesting a history of purifying selection.
The constructs for the proximal component of the control region contrast the effects of the Hopscotch insertion plus a single fixed nucleo-tide substitution that distinguish maize and teosinte. The construct with the maize sequence including Hopscotch increased expression of the luciferase reporter twofold relative to the teosinte construct for the proximal control region and the minimal promoter alone (Fig. 4). Luciferase expression was returned to the level of the teosinte con-struct and the minimal promoter construct by deleting the Hopscotch element from the full maize construct. These results indicate that the Hopscotch element enhances luciferase expression and, by
a
b
0.06
A B C D M
T
P = 0.95 P = 0.41 P = 0.04
HKA neutrality tests
P 0.0001
0.04
0.02
0–67 kb –66 kb
Distalcomponent
Teosinte clusterhaplotype
Maize clusterhaplotype
Proximalcomponent
–65 kbTourist408 bp
Hopscotch4,885 bp
–64 kb –58 kb
Figure 3 Sequence diversity in maize and teosinte across the control region. (a) Nucleotide diversity across the tb1 upstream control region. Base-pair positions are relative to AGPv2 position 265,745,977 of the maize reference genome sequence. P values correspond to HKA neutrality tests for regions A–D, as defined by the dotted lines. Green shading signifies evidence of neutrality, and pink shading signifies regions of non-neutral evolution. Nucleotide diversity ( ) for maize (yellow line) and teosinte (green line) were calculated using a 500-bp sliding window with a 25-bp step. The distal and proximal components of the control region with four fixed sequence differences between the most common maize haplotype and teosinte haplotype are shown below. (b) A minimum spanning tree for the control region with 16 diverse maize and 17 diverse teosinte sequences. Size of the circles for each haplotype group (yellow, maize; green, teosinte) is proportional to the number of individuals within that haplotype.
Transient assay constructs
mpCaMV luc
luc
luc
luc
luc
luc
luc
luc
Hopscotch
Tourist
mpCaMV
T-dist
M-dist
T-prox
M-prox
0 0.5 1.0 1.5 2.0
∆M-dist
∆M-proxPro
xim
al c
ontr
ol r
egio
nD
ista
l con
trol
reg
ion
Relative expression
Figure 4 Constructs and corresponding normalized luciferase expression levels. Transient assays were performed in maize leaf protoplast. Each construct is drawn to scale. The construct backbone consists of the minimal promoter from the cauliflower mosaic virus (mpCaMV, gray box), luciferase ORF (luc, white box) and the nopaline synthase terminator (black box). Portions of the proximal and distal components of the control region (hatched boxes) from maize and teosinte were cloned into restriction sites upstream of the minimal promoter. “ ” denotes the excision of either the Tourist or Hopscotch element from the maize construct. Horizontal green bars show the normalized mean with s.e.m. for each construct.
relative expressionconstruct
gt1

1 2 3 4 5
6 7 8 9 10
tb1Figure 2 Map of parviglumis Populations and Hopscotch allele frequency. Map showing the frequencyof the Hopscotch allele in populations of parviglumis where we sampled more than 6 individuals. Size ofcircles reflects number of individuals sampled. The Balsas River is shown, as the Balsas River Basin isbelieved to be the center of domestication of maize.
as our independent trait for phenotyping analyses. SAS code used for analysis is available athttp://dx.doi.org/10.6084/m9.figshare.1166630.
RESULTSGenotyping for the Hopscotch insertionThe genotype at the Hopscotch insertion was confirmed with two PCRs for 837 individualsof the 1,100 screened (Table S1 and Table S2). Among the 247 maize landrace accessionsgenotyped, all but eight were homozygous for the presence of the insertion Withinour parviglumis and mexicana samples we found the Hopscotch insertion segregatingin 37 (n = 86) and four (n = 17) populations, respectively, and at highest frequencywithin populations in the states of Jalisco, Colima, and Michoacan in central-westernMexico (Fig. 2). Using our Hopscotch genotyping, we calculated diVerentiation betweenpopulations (FST) and subspecies (FCT) for populations in which we sampled sixteenor more chromosomes. We found that FCT = 0, and levels of FST among populationswithin each subspecies (0.22) and among all populations (0.23) (Table 1) are similar togenome-wide estimates from previous studies Pyhajarvi, HuVord & Ross-Ibarra, 2013.Although we found large variation in Hopscotch allele frequency among our populations,BayEnv analysis did not indicate a correlation between the Hopscotch insertion andenvironmental variables (all Bayes Factors < 1).
Vann et al. (2015), PeerJ, DOI 10.7717/peerj.900 8/21
Studer et al. 2011 Nat. Gen.; Vann et al. 2015 PeerJ
tga1
©20
11 N
atur
e A
mer
ica,
Inc.
All
righ
ts r
eser
ved.
NATURE GENETICS ADVANCE ONLINE PUBLICATION 3
L E T T E R S
mutation rate21, strongly suggesting that the Hopscotch insertion (and thus, the older Tourist as well) existed as standing genetic variation in the teosinte ancestor of maize. Thus, we conclude that the Hopscotch insertion likely predated domestication by more than 10,000 years and the Tourist insertion by an even greater amount of time.
We identified four fixed differences in the portion of the proximal and distal components of the control region that show evidence of selection. We used transient assays in maize leaf protoplasts to test all four differences for effects on gene expression. Maize and teosinte chromosomal segments for the portions of the proximal and distal components with these four differences were cloned into reporter constructs upstream of the minimal promoter of the cauliflower mosaic virus (mpCaMV), the firefly luciferase ORF and the nopaline synthase (NOS) terminator (Fig. 4). Each construct was assayed for luminescence after transformation by electroporation into maize pro-toplast. The constructs for the distal component contrast the effects of the Tourist insertion plus the single fixed nucleotide substitution that distinguish maize and teosinte. Both the maize and teosinte constructs for the distal component repressed luciferase expression
relative to the minimal promoter alone. The maize construct with Tourist excised gave luciferase expression equivalent to the native maize and teosinte constructs and less expression than the minimal promoter alone. These results indicate that this segment is function-ally important, acting as a repressor of luciferase expression and, by inference, of tb1 expression in vivo. However, we did not observe any difference between the maize and teosinte constructs as anticipated. One possible cause for the lack of differences in expression between the maize and teosinte constructs might be that additional proteins required to cause these differences are not present in maize leaf pro-toplast. Another possibility is that the factor affecting phenotype in the distal component lies in the unselected region between −64.8 and −69.5 kb, which is not included in the construct. Nevertheless, the results do indicate that the distal component has a functional element that acts as a repressor. The functional importance of this segment is supported by its low level of nucleotide diversity (Fig. 3a), suggesting a history of purifying selection.
The constructs for the proximal component of the control region contrast the effects of the Hopscotch insertion plus a single fixed nucleo-tide substitution that distinguish maize and teosinte. The construct with the maize sequence including Hopscotch increased expression of the luciferase reporter twofold relative to the teosinte construct for the proximal control region and the minimal promoter alone (Fig. 4). Luciferase expression was returned to the level of the teosinte con-struct and the minimal promoter construct by deleting the Hopscotch element from the full maize construct. These results indicate that the Hopscotch element enhances luciferase expression and, by
a
b
0.06
A B C D M
T
P = 0.95 P = 0.41 P = 0.04
HKA neutrality tests
P 0.0001
0.04
0.02
0–67 kb –66 kb
Distalcomponent
Teosinte clusterhaplotype
Maize clusterhaplotype
Proximalcomponent
–65 kbTourist408 bp
Hopscotch4,885 bp
–64 kb –58 kb
Figure 3 Sequence diversity in maize and teosinte across the control region. (a) Nucleotide diversity across the tb1 upstream control region. Base-pair positions are relative to AGPv2 position 265,745,977 of the maize reference genome sequence. P values correspond to HKA neutrality tests for regions A–D, as defined by the dotted lines. Green shading signifies evidence of neutrality, and pink shading signifies regions of non-neutral evolution. Nucleotide diversity ( ) for maize (yellow line) and teosinte (green line) were calculated using a 500-bp sliding window with a 25-bp step. The distal and proximal components of the control region with four fixed sequence differences between the most common maize haplotype and teosinte haplotype are shown below. (b) A minimum spanning tree for the control region with 16 diverse maize and 17 diverse teosinte sequences. Size of the circles for each haplotype group (yellow, maize; green, teosinte) is proportional to the number of individuals within that haplotype.
Transient assay constructs
mpCaMV luc
luc
luc
luc
luc
luc
luc
luc
Hopscotch
Tourist
mpCaMV
T-dist
M-dist
T-prox
M-prox
0 0.5 1.0 1.5 2.0
∆M-dist
∆M-proxPro
xim
al c
ontr
ol r
egio
nD
ista
l con
trol
reg
ion
Relative expression
Figure 4 Constructs and corresponding normalized luciferase expression levels. Transient assays were performed in maize leaf protoplast. Each construct is drawn to scale. The construct backbone consists of the minimal promoter from the cauliflower mosaic virus (mpCaMV, gray box), luciferase ORF (luc, white box) and the nopaline synthase terminator (black box). Portions of the proximal and distal components of the control region (hatched boxes) from maize and teosinte were cloned into restriction sites upstream of the minimal promoter. “ ” denotes the excision of either the Tourist or Hopscotch element from the maize construct. Horizontal green bars show the normalized mean with s.e.m. for each construct.
relative expressionconstruct
gt1

hard sweep
M T N P H R L
GGTCGA ATG ACT GAT CCA CAT CGA CTG TAG
tga1

hard sweep
M T N P H R L
GGTCGA ATG ACT GAT CCA CAT CGA CTG TAG
tga1 gt1 tb1
Multiple Mutations
Standing Variation
M T G P H R L
GGTAAA ATG ACT GGT CCA CAT CGA CTG TAG

Vann et al. 2015 PeerJ
polygenic adaptation
30% phenotypic variance
0% phenotypic variance

Hufford et al. 2012 Nat. Gen. Chia et al. 2012 Nat. Gen
13 teosinte 23 maize
~500 genes (2%) 11M shared SNPs
3,000 fixed genomes:

Hufford et al. 2012 Nat. Gen. Chia et al. 2012 Nat. Gen
13 teosinte 23 maizegenomes:

Hufford et al. 2012 Nat. Gen. Chia et al. 2012 Nat. Gen
13 teosinte 23 maizegenomes:

Swanson-Wagner et al. 2012 PNAS
whereas others are lost after domestication (Fig. 3B). It should benoted that many of these genes have unique coexpression edges inmaize that are not observed in teosinte (Fig. S4B).
Expression data provide an opportunity to investigate furtherfunctional alterations to genes located within genomic regionsthat population genomic analyses identify as targets of selective
E
DE(n=612)
AEC(n=1115)
Dom/Imp genes(n=1761)
292 230750
894644
1582
A
B
Teosinte network edges Maize network edges
D
C
GRMZM2G068436
GRMZM2G137947
GRMZM2G375302
Mb
Mb
Fig. 3. Analysis of genes with altered expression or conservation and targets of selection during improvement and/or domestication. (A) Venn diagramshowing the overlap between DE genes, AEC genes, and the genes that occur in genomic regions that have evidence for selective sweeps during maizedomestication or improvement (Dom/Imp genes). (B) Teosinte coexpression networks for three genes (GRMZM2G068436, GRMZM2G137947, andGRMZM2G375302). (Right) Edges that are maintained in maize coexpression networks are shown. Although the differentially expressed gene (red node) ishighly connected in teosinte, most of these connections are lost in maize. However, some parts of the teosinte network are still conserved in maize. (C) Cross-population composite likelihood ratio test (XP-CLR) plot shows the evidence for a selective sweep that occurs on chromosome 9. The tick marks along the xaxis represent genes, and the red tick mark indicates the gene (GRMZM2G448355) that was chosen as the candidate target of selection and is differentiallyexpressed in maize and teosinte. The bar plot underneath the graph shows the expression levels of all maize (blue) and teosinte (red) samples. (D) XP-CLR plotfor a large region on chromosome 5. The candidate target of selection is indicated in green and shows similar expression in maize and teosinte. Two othergenes (red) exhibit DE. (E) Neighbor-joining tree shows the relationships among the haplotypes at GRMZM2G141858. (Right) Bar plot shows expression levelsfor each genotype; red bars indicate teosinte genotypes, and blue bars represent maize genotypes. At least one teosinte genotype (TIL15) contains thehaplotype that has been selected in maize and has expression levels similar to maize genotypes.
Table 2. Genes in selected regions with evidence for DE or AEC
Gene listNo. genes selectedduring dom/imp
% up-regulatedin maize Significance
% higher connectedin maize % candidates
AEC and DE (n = 276) 46 76 0.0002 41.3 39.1DE only (n = 336) 44 61 0.0230 40.9 22.7AEC only (n = 839) 89 54 0.1837 57.3 32.6
dom, domestication; imp, improvement.
4 of 6 | www.pnas.org/cgi/doi/10.1073/pnas.1201961109 Swanson-Wagner et al.
ExpressionGenealogy
teosintemaize

nucl
eotid
e di
vers
ity
distance to nearest substitution (cM)
Beissinger et al. In Prep: http://biorxiv.org/content/early/

nucl
eotid
e di
vers
ity
distance to nearest substitution (cM)
Beissinger et al. In Prep: http://biorxiv.org/content/early/

Mexico lowland
9,000 BP
Matsuoka et al. 2002; Piperno 2006 Perry et al. 2006; Piperno et al. 2009

Mexico highland6,000 BP
Mexico lowland
9,000 BP
Matsuoka et al. 2002; Piperno 2006 Perry et al. 2006; Piperno et al. 2009

Mexico highland6,000 BP
S. America lowland
6,000 BP
Mexico lowland
9,000 BP
Matsuoka et al. 2002; Piperno 2006 Perry et al. 2006; Piperno et al. 2009

Mexico highland6,000 BP
S. America lowland
6,000 BP
S. America Highland
4,000 BP
Mexico lowland
9,000 BP
Matsuoka et al. 2002; Piperno 2006 Perry et al. 2006; Piperno et al. 2009

Mexico
phot
o by
Mon
thon
Wac
hira
sett
akul
Andes
phot
o by
Mat
t H
uffo
rd

SA MEX SA MEX
SA MEX SA MEX SA MEX SA MEX
Ear Height Plant Height
Tassel Br. Number
TW
Days to AnthesisSA MEX SA MEX
SA MEX SA MEX
LowlandHighland

95 landraces ~100K SNPs
Takuno et al. 2015 Genetics

-Log
p-v
alue
Fst
S. A
mer
ica
-Log p-value Fst Mexico
shared SNPs
unique S. America
unique Mexico
95 landraces ~100K SNPs
Takuno et al. 2015 Genetics

-Log
p-v
alue
Fst
S. A
mer
ica
-Log p-value Fst Mexico
shared SNPs
unique S. America
unique Mexico
39%61%
IntergenicGenic
19%
81%
Standing VariationNew mutation
Takuno et al. 2015 Genetics

Beissinger et al. In Prep (b) Berg & Coop 2014 PLoS Genetics

Beissinger et al. In Prep (b) Berg & Coop 2014 PLoS Genetics
Z =LX
i=1
↵ipi
allele freq.population breeding value
effect size

Beissinger et al. In Prep (b) Berg & Coop 2014 PLoS Genetics
Z =LX
i=1
↵ipi
allele freq.population breeding value
effect size
relatednessdispersion
add. genetic var.
QX =~Z 0TF�1 ~Z 0
2VA

Beissinger et al. In Prep (b) Berg & Coop 2014 PLoS Genetics
Warm

Cold
Beissinger et al. In Prep (b) Berg & Coop 2014 PLoS Genetics
Warm

Cold
Beissinger et al. In Prep (b) Berg & Coop 2014 PLoS Genetics
Warm

masl
Pyhäjärvi et al. GBE 2013

Pyhäjärvi et al. GBE 2013

Pyhäjärvi et al. GBE 2013

Pyhäjärvi et al. GBE 2013

Beissinger et al. In Prep: http://biorxiv.org/content/early/

how to adapt: Zea mays
soft sweeps
M T G P H R L
GGTAAA ATG ACT GGT CCA CAT CGA CTG TAG
polygenic adaptation
regulatory variation

Sattah et al. 2011 PLoS Gen. Williamson et al. 2014 PLoS Gen Hernandez et al. 2011 Science

Sattah et al. 2011 PLoS Gen. Williamson et al. 2014 PLoS Gen Hernandez et al. 2011 Science

Sattah et al. 2011 PLoS Gen. Williamson et al. 2014 PLoS Gen Hernandez et al. 2011 Science
dive
rsity

Ne diploids
s selection coefficient
selection is effective if 2Nes > 1

Ne diploids
s selection coefficient
selection is effective if 2Nes > 1
Ne ~ 150,000 Ne ~ 10,000
Ne ~ 2,000,000 Ne ~ 600,000

Ne diploids
s selection coefficient
selection is effective if 2Nes > 1
Ne ~ 150,000 Ne ~ 10,000
Ne ~ 2,000,000 Ne ~ 600,000
20% nonsyn. subs 10% nonsyn. subs
50% nonsyn. subs 40% nonsyn. subs

teos
inte
maize
DATAte
osin
te
maize
MODEL
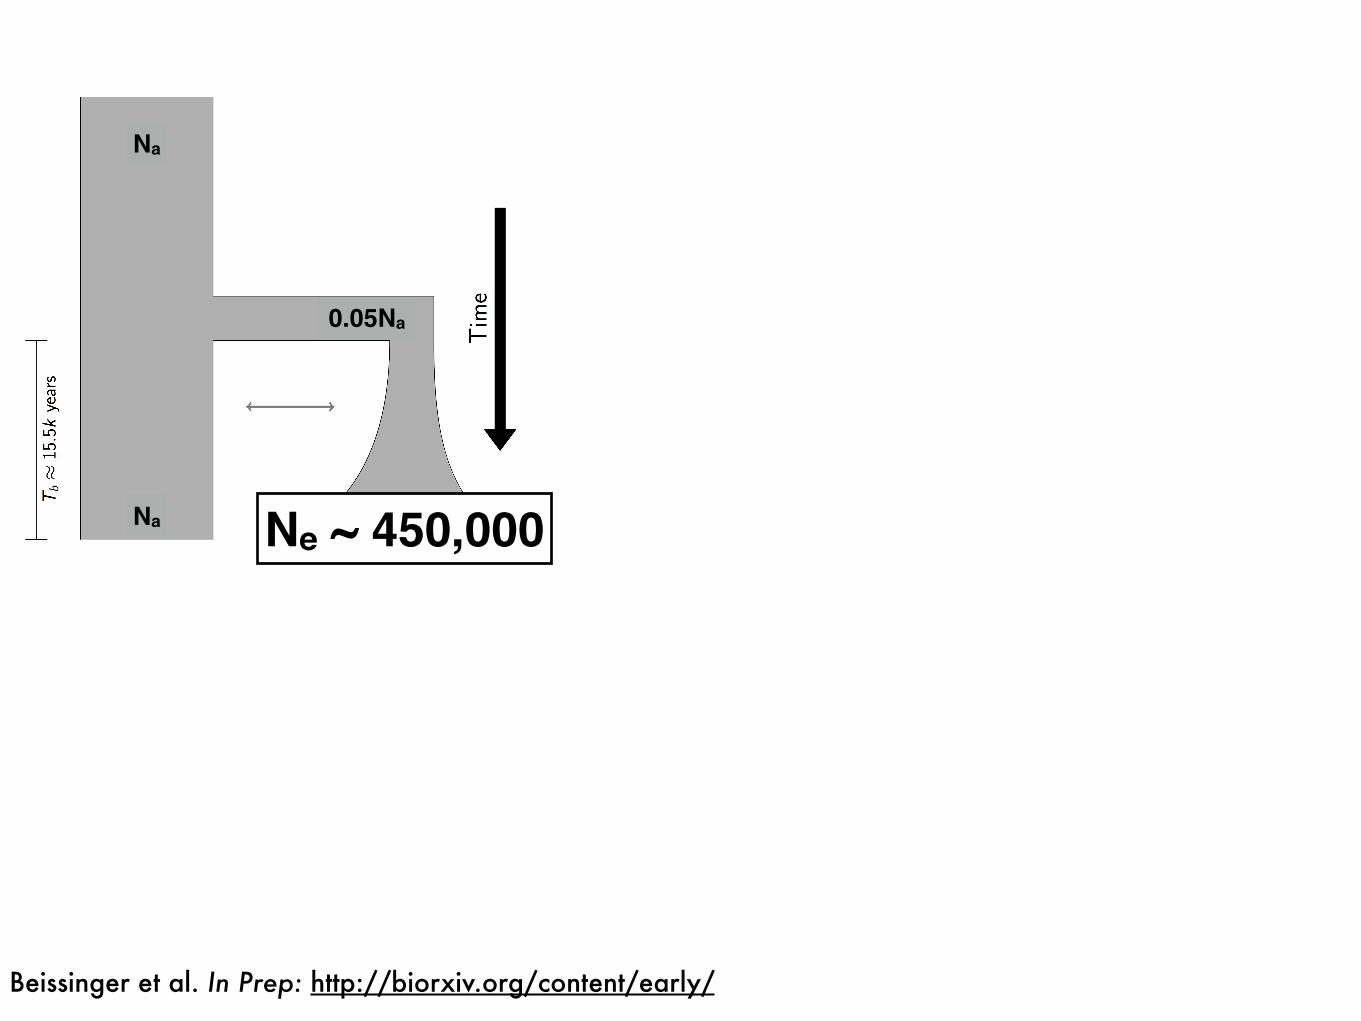
Beissinger et al. In Prep: http://biorxiv.org/content/early/2015/11/13/031666 Hufford et al. 2012

teos
inte
maize
DATAte
osin
te
maize
MODEL
0.05Na
Na
Na 3Na
Beissinger et al. In Prep: http://biorxiv.org/content/early/2015/11/13/031666 Hufford et al. 2012

Ne ~ 150,000
Ne ~ 50,000
Beissinger et al. In Prep: http://biorxiv.org/content/early/
0.05Na
Na
Na 3NaNe ~ 450,000
Beissinger et al. In Prep: http://biorxiv.org/content/early/

0.05Na
Na
Na 3NaNe ~ 450,000
Ne ~ 1,000,000
Beissinger et al. In Prep: http://biorxiv.org/content/early/

0.05Na
Na
Na 3NaNe ~ 450,000
Ne ~ 1,000,000
1e+05
1e+07
1e+09
1e+03 1e+042e+04 1e+05years(u=3e−8, generation=1)
effe
ctive
pop
ulat
ion
size
popBKN_4HapBKN_6HapTIL_4Hap_JaliscoTIL_6Hap
Ne ~ 1,000,000,000
Beissinger et al. In Prep: http://biorxiv.org/content/early/

0.05Na
Na
Na 3NaNe ~ 450,000
Ne ~ 1,000,000
1e+05
1e+07
1e+09
1e+03 1e+042e+04 1e+05years(u=3e−8, generation=1)
effe
ctive
pop
ulat
ion
size
popBKN_4HapBKN_6HapTIL_4Hap_JaliscoTIL_6Hap
Ne ~ 1,000,000,000
Ne ~ 5,000,000,000
Beissinger et al. In Prep: http://biorxiv.org/content/early/

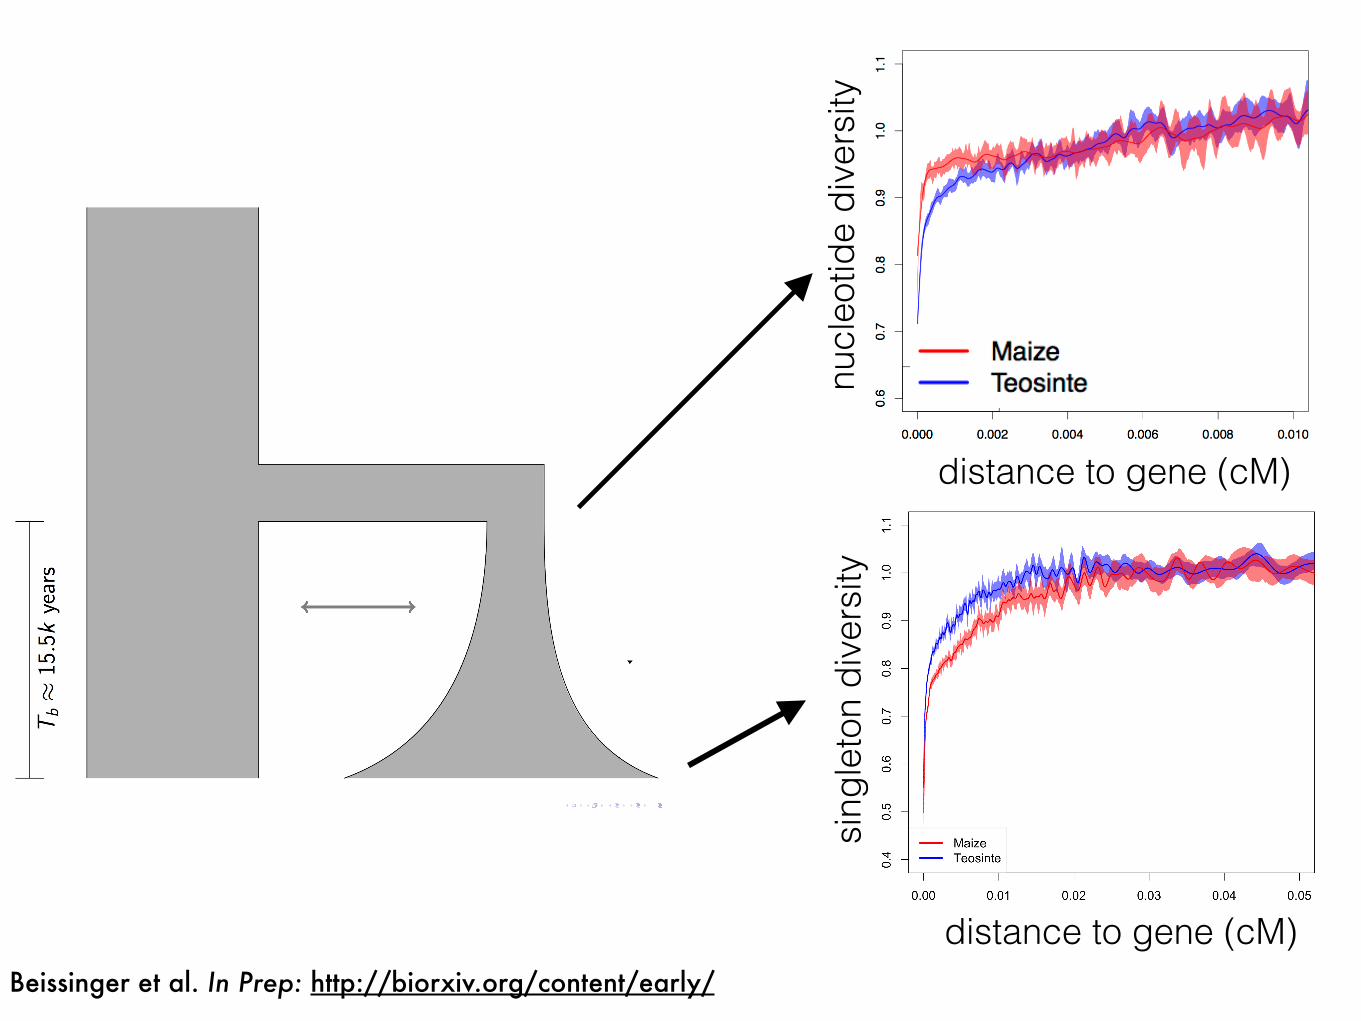
nucl
eotid
e di
vers
ity
distance to gene (cM)
Beissinger et al. In Prep: http://biorxiv.org/content/early/
nucl
eotid
e di
vers
ity
distance to gene (cM)
sing
leto
n di
vers
ity
distance to gene (cM)
Beissinger et al. In Prep: http://biorxiv.org/content/early/

sing
leto
n di
vers
ity
distance to nearest substitution (cM)
Beissinger et al. In Prep: http://biorxiv.org/content/early/

Sattah et al. 2011 PLoS Gen. Williamson et al. 2014 PLoS Gen Hernandez et al. 2011 Science
dive
rsity
Ne >> 1,000,000 Ne ~ 10,000*
Ne ~ 2,000,000 Ne ~ 600,000

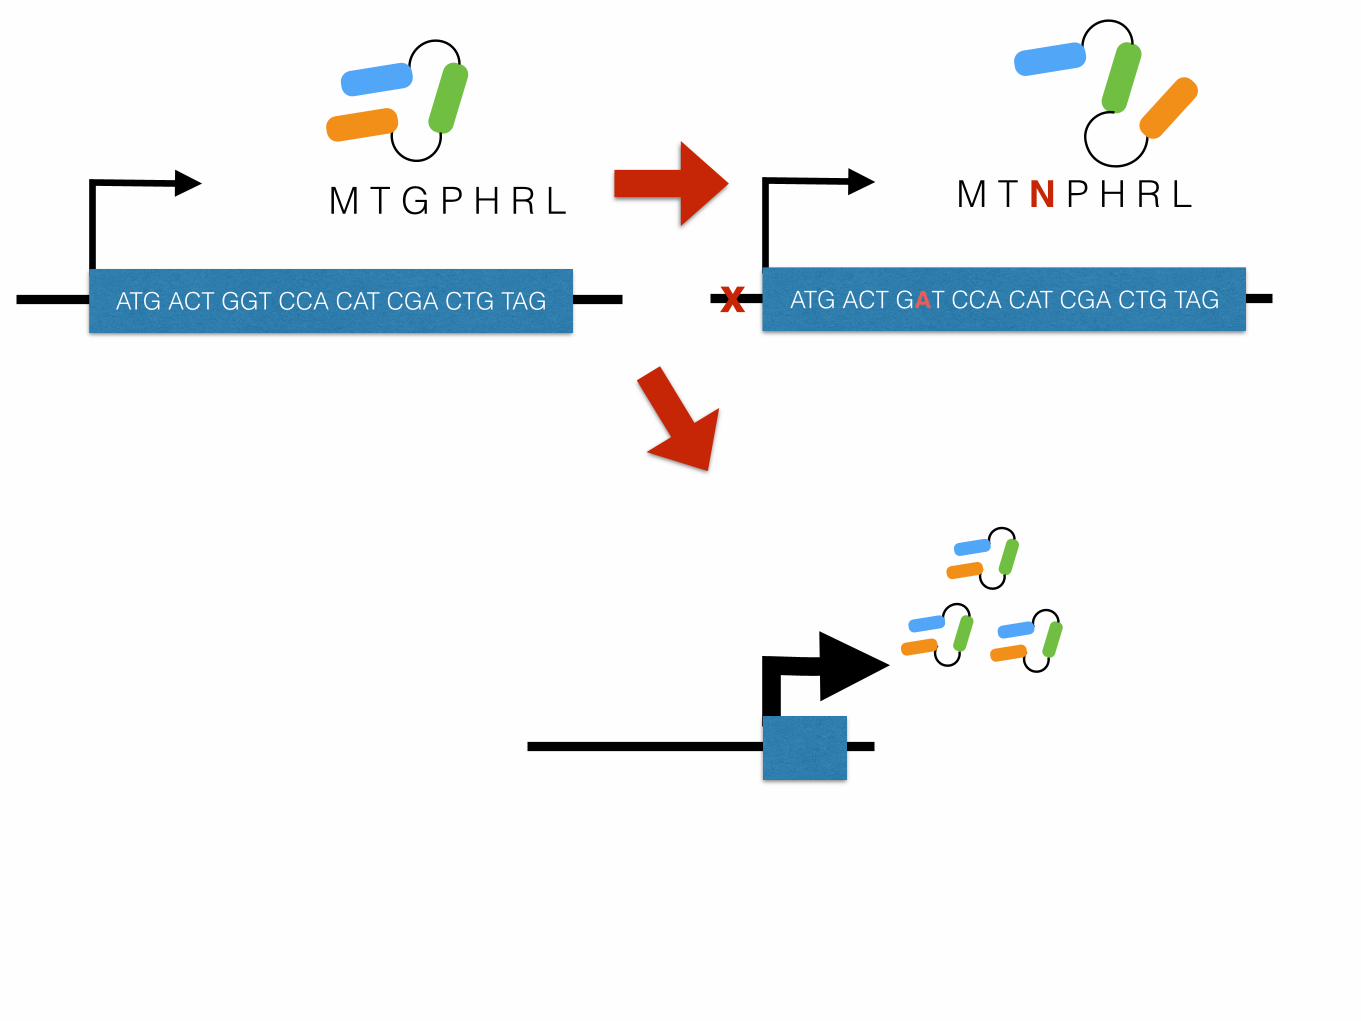
M T G P H R L
ATG ACT GGT CCA CAT CGA CTG TAG

M T G P H R L
ATG ACT GGT CCA CAT CGA CTG TAG
M T N P H R L
ATG ACT GAT CCA CAT CGA CTG TAGx
M T G P H R L
ATG ACT GGT CCA CAT CGA CTG TAG
M T N P H R L
ATG ACT GAT CCA CAT CGA CTG TAGx

M T G P H R L
ATG ACT GGT CCA CAT CGA CTG TAG
M T N P H R L
ATG ACT GAT CCA CAT CGA CTG TAG
x x x
x

M T G P H R L
ATG ACT GGT CCA CAT CGA CTG TAG
M T N P H R L
ATG ACT GAT CCA CAT CGA CTG TAG
x xx x
x
M T G P H R L
ATG ACT GGT CCA CAT CGA CTG TAG
M T N P H R L
ATG ACT GAT CCA CAT CGA CTG TAG
x xx x
x

M T G P H R L
ATG ACT GGT CCA CAT CGA CTG TAG
M T N P H R L
ATG ACT GAT CCA CAT CGA CTG TAG
x xx x
x x x x
x

Makarevitch et al. 2014 PLoS Genetics

Makarevitch et al. 2014 PLoS Genetics
single TE family, many genes

Makarevitch et al. 2014 PLoS Genetics
single TE family, many genes
new insertions activate expression
Makarevitch et al. 2014 bioRxiv
-0.5
0.5
1.5
2.5
Lines with the TE insertion
Lines without the TE insertion
GRMZM2G071206
Log 2
(stre
ss/c
ontro
l)
-202468
1012
Lines with the TE insertion
Lines without the TE insertion
-202468
1012
Log 2
(stre
ss/c
ontro
l) GRMZM2G400718 C
-0.50.00.51.01.52.0D
GRMZM2G102447
Lines with the TE insertion
Lines without the TE insertion
GRMZM2G108057
-202468
101214
Lines with the TE insertion
Lines without the TE insertion
GRMZM2G108149
A
B
Log 2
(stre
ss/c
ontro
l) Lo
g 2(s
tress
/con
trol)
E
Log 2
(stre
ss/c
ontro
l)
Lines with the TE insertion
Lines without the TE insertion
on September 9, 2014http://biorxiv.org/Downloaded from
-0.50.00.51.01.52.02.53.03.5
1 2 3 4 5 6 7 8 9 10
Oh43
B73 Mo17
- - + - - + - + - - ++ - - + - - + - - + - - + - - + - - + Gene
Log 2
(stre
ss/c
ontro
l)
TE presence
0%
20%
40%
60%
80%
100%
alaw
dagaf
etug flip
gyma
ipiki
jeli
joem
onnaiba
nihep
odoj
pebi
raider
riiryl
ubel
uwum
Zm00346
Zm02117
Zm03238
Zm05382
Salt
UV
Heat
Cold
B
A
Per
cent
of c
onse
rved
ge
nes
on September 9, 2014http://biorxiv.org/Downloaded from
***
****
*** *
single gene, many individuals

Hancock et al 2011 Science Hernandez et al. 2011 Science
Fraser et al. 2013 Gen. Research
enric
hmen
t in
terg
enic
<———
>cod
ing
Pyhäjärvi et al. GBE 2013
enric
hmen
t in
terg
enic
<———
>cod
ing

Ne diploids
µ beneficial mutation rate per trait
selection from standing variation when 2Neµ > 1

Ne diploids
µ beneficial mutation rate per trait
selection from standing variation when 2Neµ > 1
Garud et al. 2015 PLoS Gen. Jensen 2014 Nat. Comm.
Pritchard et al. 2010 Curr. Bio. Enard et al. 2014 Gen. Res.
Beissinger et al. In Prep
µ ∝ 2,500 Mbp µ ∝ 3,100 Mbp
µ ∝ 130 Mbp

Ne diploids
µ beneficial mutation rate per trait
selection from standing variation when 2Neµ > 1
Garud et al. 2015 PLoS Gen. Jensen 2014 Nat. Comm.
Pritchard et al. 2010 Curr. Bio. Enard et al. 2014 Gen. Res.
Beissinger et al. In Prep
µ ∝ 2,500 Mbp µ ∝ 3,100 Mbp
µ ∝ 130 Mbp µ ∝ 220 Mbp
µ ∝ 130 Mbp
Williamson et al. 2014 PLoS Gen

Brandon Gaut
maizeArabidopsisKew C-Value Database
log 1C genome size

• “Soft sweeps” and polygenic selection predominate in maize and teosinte
• Most selection appears in noncoding sequence
• Both effective population size & mutational target contribute
• Large, complex genomes may mean more targets & more soft sweeps & less linked effects of selection
Concluding Thoughts

Acknowledgments
Maize Diversity GroupPeter Bradbury
Ed Buckler John Doebley Theresa Fulton
Sherry Flint-GarciaJim Holland
Sharon Mitchell Qi Sun
Doreen Ware
CollaboratorsGraham Coop
Nathan Springer Ruairidh Sawers
Lab AlumniTim Beissinger (USDA-ARS, Mizzou)
Kate Crosby (Monsanto) Matt Hufford (Iowa State)
Tanja Pyhäjärvi (Oulu) Shohei Takuno (Sokendai)
Joost van Heerwaarden (Wageningen)


![[2015] 51 2015 --5 , 2015images.sport.org.cn/File/2015/02/27/1604515386.pdf[2015] 51 2015 --5 , 2015](https://img.dokumen.tips/doc/110x75/5e037ff6be55871de61973c2/2015-51-2015-5-2015-51-2015-5-2015.jpg)