Embed Size (px)
Citation preview

Tips for optimizing your
sales force productivity
SPM webinar series

Sales force effectiveness with Anaplan
Webinar Agenda
• The complexity of HP
• The breaking point
• The Territory & Quota transformation
• The Anaplan value
• Q&A

Featured speaker
Bob Slaby
VP of Customer Operations, Anaplan
Former VP of Sales Operations, Hewlett-Packard


HP’s global complexity
1000+ sales metrics
380+ sales coverage plans
178 countries
800+ metric components
to which quota is
deployed
80K+ customers with
assigned quota
35M+ transactions
every month
8000+ on top bonus
30K+people on sales plan
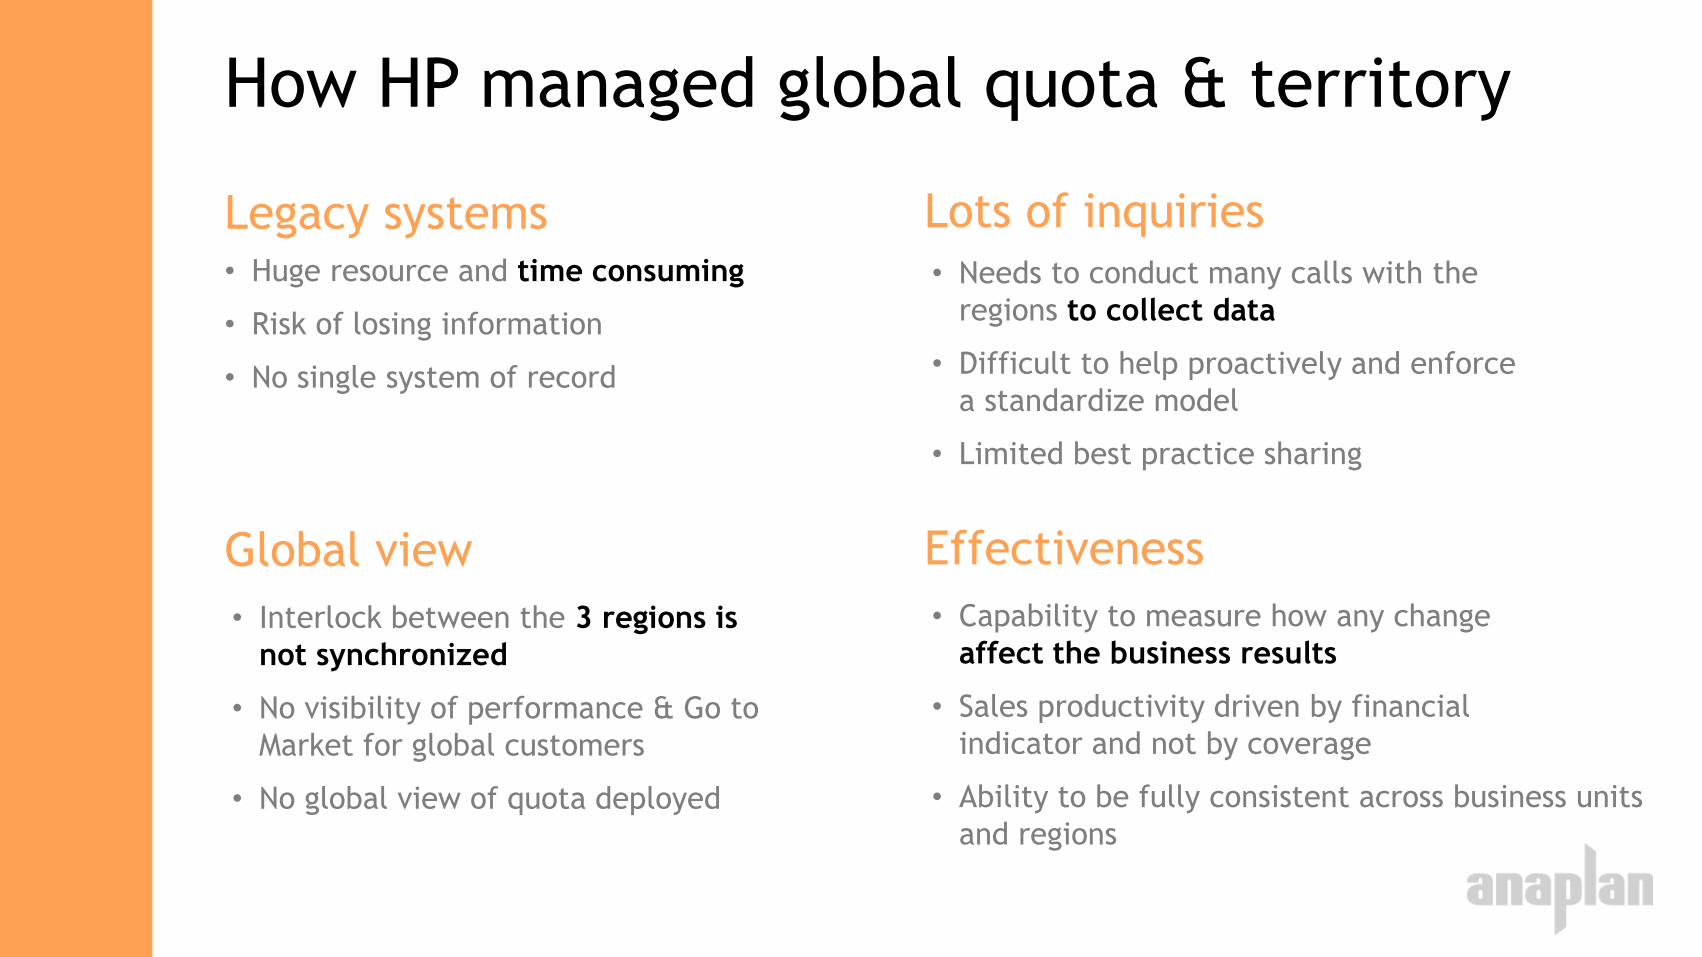
How HP managed global quota & territory
• Huge resource and time consuming
• Risk of losing information
• No single system of record
Legacy systems
• Interlock between the 3 regions is
not synchronized
• No visibility of performance & Go to
Market for global customers
• No global view of quota deployed
Global view
• Capability to measure how any change
affect the business results
• Sales productivity driven by financial
indicator and not by coverage
• Ability to be fully consistent across business units
and regions
Effectiveness
• Needs to conduct many calls with the
regions to collect data
• Difficult to help proactively and enforce
a standardize model
• Limited best practice sharing
Lots of inquiries

• 178 countries
• 30,000+ sales reps
• 5 months to set-up
• 3,500 users
• Auditable process
• Top-down & bottom-up
reconciliation
What HP said What Anaplan heard
• Scale–50 billion cells
• Collaborative
• Complexity
• Hundreds of data feeds
• Global support
• Hard deadline

How Anaplan manages global quota and
territory
Single repository
of info
History tracking and full
Knowledge Base right in
the cloud
Easy access &
easy to use
Provides workflow that
helps governance
Provides
worldwide visibility
Real time KPIs to check
status of deployed quota

Account
Segmentation
& Scoring
Unrivaled modeling &
planning power
Connect plans across
the business
Get pre-built apps or
build your own
Simple, intuitive
interface
Collaboration in
the cloud
Reporting & Analysis
Anaplan Platform
Territory
Planning
Quota
Planning
Sales
CapacityCrediting
Sales
Accruals
Sales
ForecastingDeal Desk
Incentive
Compensation
Anaplan for Sales
End-to-end sales performance management

Anaplan value
and scaleFaster comp letters vs.
data size growth
• Time to value = live in 7 months
• Sales incentives = 2% to 4% of Revenue, e.g. $50B = $1B - $2B
• Every 1% of savings = $10 - $20 Million
• Anaplan ROI < 1 year
0
1
2
3
4
5
6
7
0
2
4
6
8
10
12
14
16
18
20
2012 2013 2014 2015 2016
All Comp letters (weeks) One BU Comp letters (weeks) Data Size (TB)
WEEKS
TERABYTES

4 steps to a successful
implementation
Model build
Business process
Data integration
Change management

Q A


![LIMNOLOGY and OCEANOGRAPHY: METHODS - vliz.be · Neukermans et al. Optimizing [SPM] Measurement Table 1 . Overview of types of [SPM] procedural control filters and treatments. Filter](https://img.dokumen.tips/doc/110x75/5e034171d9e2ea2f20427b9e/limnology-and-oceanography-methods-vlizbe-neukermans-et-al-optimizing-spm.jpg)


![Anaplan SiriusDecisions Sales Survey Infographic [Russian]](https://img.dokumen.tips/doc/110x75/55d39c0ebb61ebfd268b4620/anaplan-siriusdecisions-sales-survey-infographic-russian.jpg)