Embed Size (px)
Citation preview
1
MATRIX MONTHLY
Multifamily Rents Start the New Year StrongRent Survey | January 2016
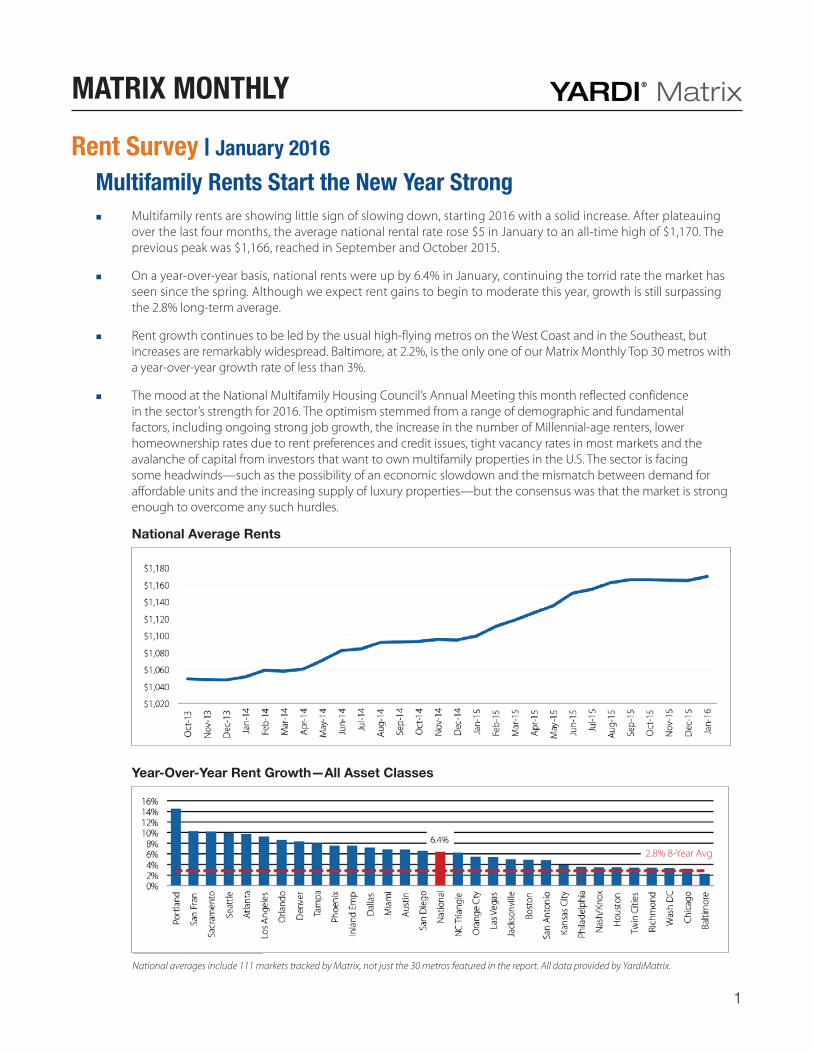
National averages include 111 markets tracked by Matrix, not just the 30 metros featured in the report. All data provided by YardiMatrix.
National Average Rents
�� Multifamily rents are showing little sign of slowing down, starting 2016 with a solid increase. After plateauing over the last four months, the average national rental rate rose $5 in January to an all-time high of $1,170. The previous peak was $1,166, reached in September and October 2015.
�� On a year-over-year basis, national rents were up by 6.4% in January, continuing the torrid rate the market has seen since the spring. Although we expect rent gains to begin to moderate this year, growth is still surpassing the 2.8% long-term average.
�� Rent growth continues to be led by the usual high-flying metros on the West Coast and in the Southeast, but increases are remarkably widespread. Baltimore, at 2.2%, is the only one of our Matrix Monthly Top 30 metros with a year-over-year growth rate of less than 3%.
�� The mood at the National Multifamily Housing Council’s Annual Meeting this month reflected confidence in the sector’s strength for 2016. The optimism stemmed from a range of demographic and fundamental factors, including ongoing strong job growth, the increase in the number of Millennial-age renters, lower homeownership rates due to rent preferences and credit issues, tight vacancy rates in most markets and the avalanche of capital from investors that want to own multifamily properties in the U.S. The sector is facing some headwinds—such as the possibility of an economic slowdown and the mismatch between demand for affordable units and the increasing supply of luxury properties—but the consensus was that the market is strong enough to overcome any such hurdles.
Year-Over-Year Rent Growth—All Asset Classes
2.8% 8-Year Avg
Matrix Monthly | January 2016 2
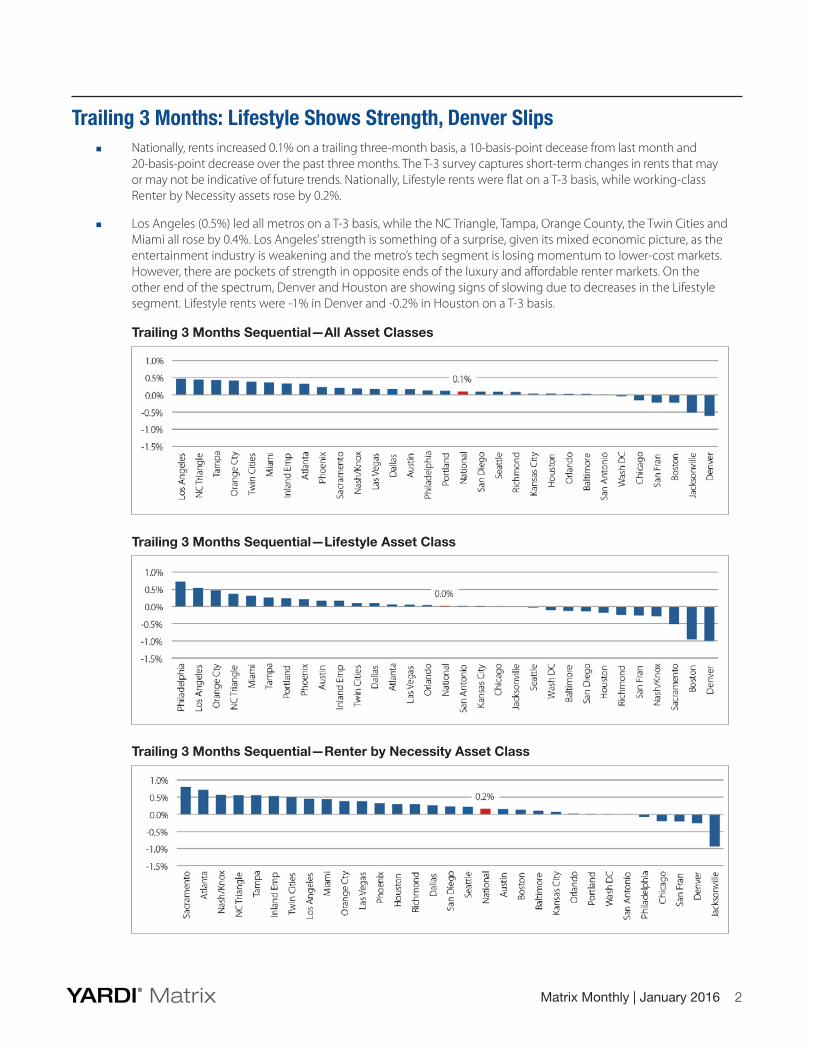
Trailing 3 Months Sequential—Lifestyle Asset Class
Trailing 3 Months Sequential—Renter by Necessity Asset Class
Trailing 3 Months Sequential—All Asset Classes
Trailing 3 Months: Lifestyle Shows Strength, Denver Slips�� Nationally, rents increased 0.1% on a trailing three-month basis, a 10-basis-point decease from last month and
20-basis-point decrease over the past three months. The T-3 survey captures short-term changes in rents that may or may not be indicative of future trends. Nationally, Lifestyle rents were flat on a T-3 basis, while working-class Renter by Necessity assets rose by 0.2%.
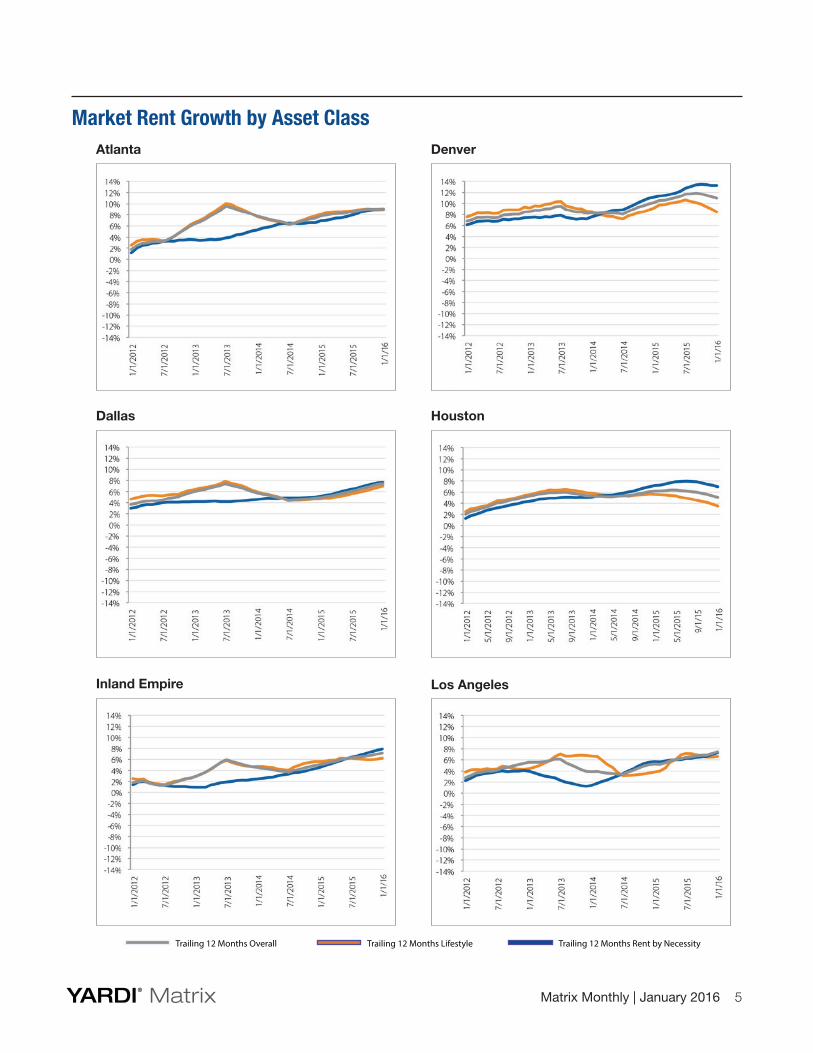
�� Los Angeles (0.5%) led all metros on a T-3 basis, while the NC Triangle, Tampa, Orange County, the Twin Cities and Miami all rose by 0.4%. Los Angeles’ strength is something of a surprise, given its mixed economic picture, as the entertainment industry is weakening and the metro’s tech segment is losing momentum to lower-cost markets. However, there are pockets of strength in opposite ends of the luxury and affordable renter markets. On the other end of the spectrum, Denver and Houston are showing signs of slowing due to decreases in the Lifestyle segment. Lifestyle rents were -1% in Denver and -0.2% in Houston on a T-3 basis.
Matrix Monthly | January 2016 3
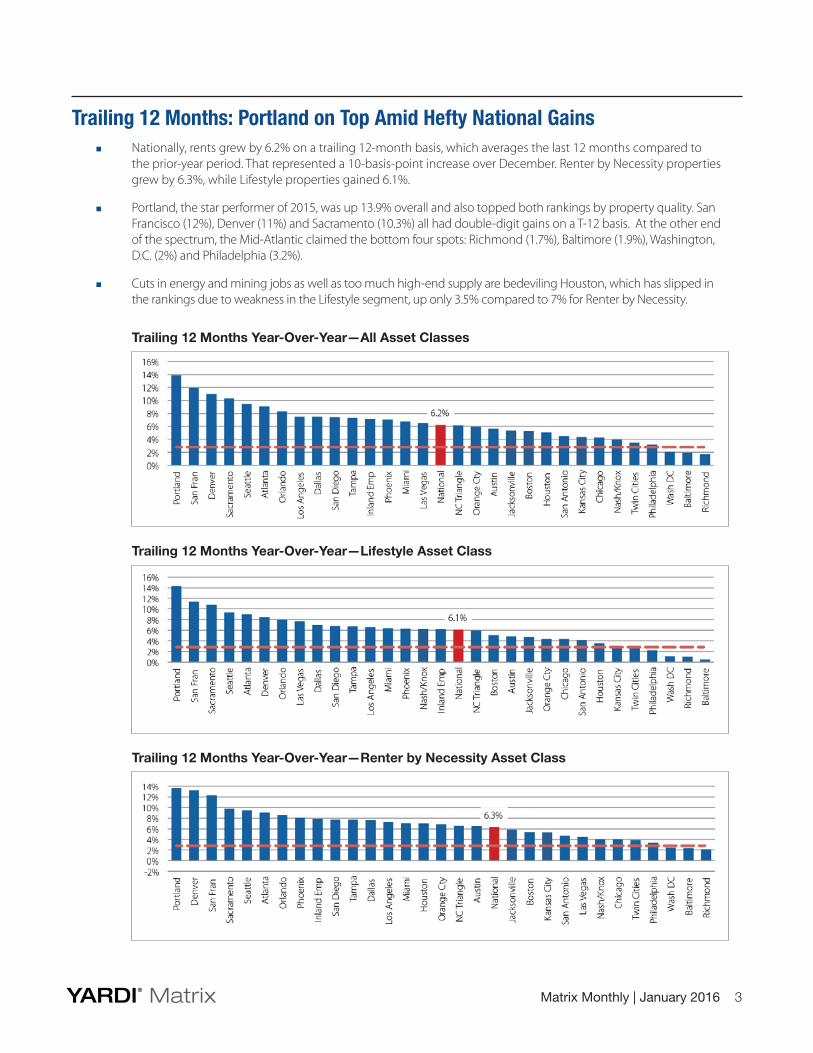
Trailing 12 Months Year-Over-Year—Lifestyle Asset Class
Trailing 12 Months Year-Over-Year—Renter by Necessity Asset Class
Trailing 12 Months Year-Over-Year—All Asset Classes
Trailing 12 Months: Portland on Top Amid Hefty National Gains�� Nationally, rents grew by 6.2% on a trailing 12-month basis, which averages the last 12 months compared to
the prior-year period. That represented a 10-basis-point increase over December. Renter by Necessity properties grew by 6.3%, while Lifestyle properties gained 6.1%.
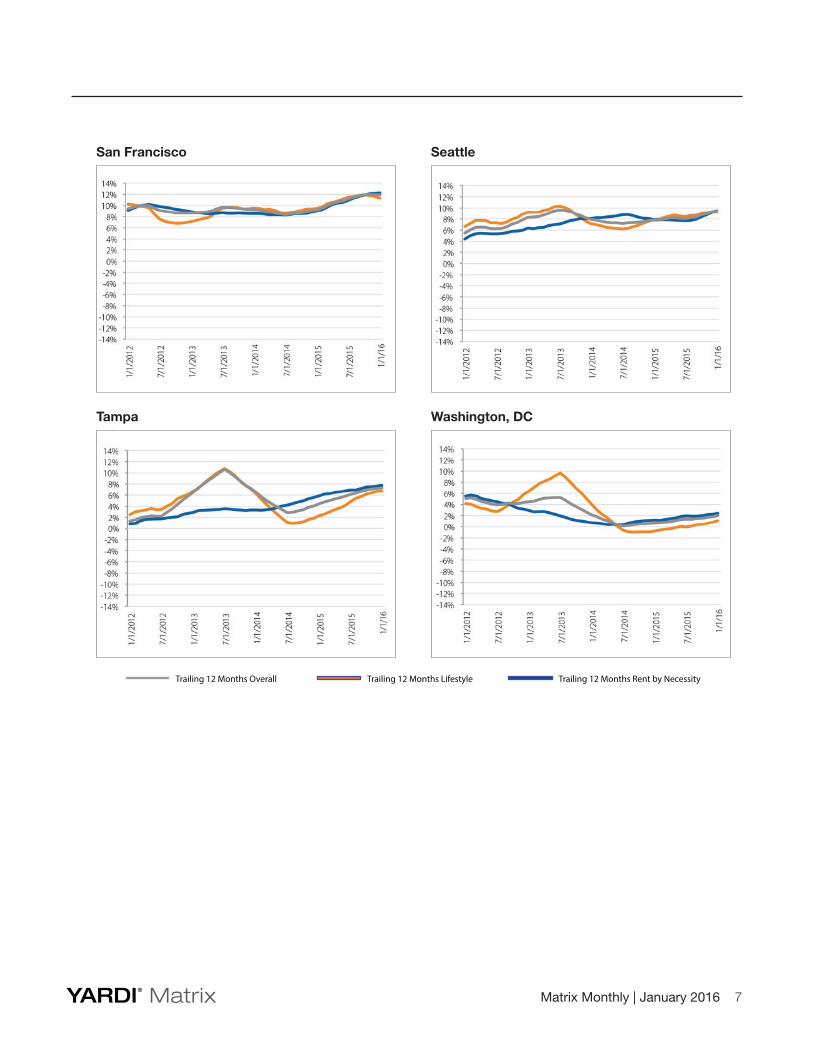
�� Portland, the star performer of 2015, was up 13.9% overall and also topped both rankings by property quality. San Francisco (12%), Denver (11%) and Sacramento (10.3%) all had double-digit gains on a T-12 basis. At the other end of the spectrum, the Mid-Atlantic claimed the bottom four spots: Richmond (1.7%), Baltimore (1.9%), Washington, D.C. (2%) and Philadelphia (3.2%).
�� Cuts in energy and mining jobs as well as too much high-end supply are bedeviling Houston, which has slipped in the rankings due to weakness in the Lifestyle segment, up only 3.5% compared to 7% for Renter by Necessity.
Matrix Monthly | January 2016 4
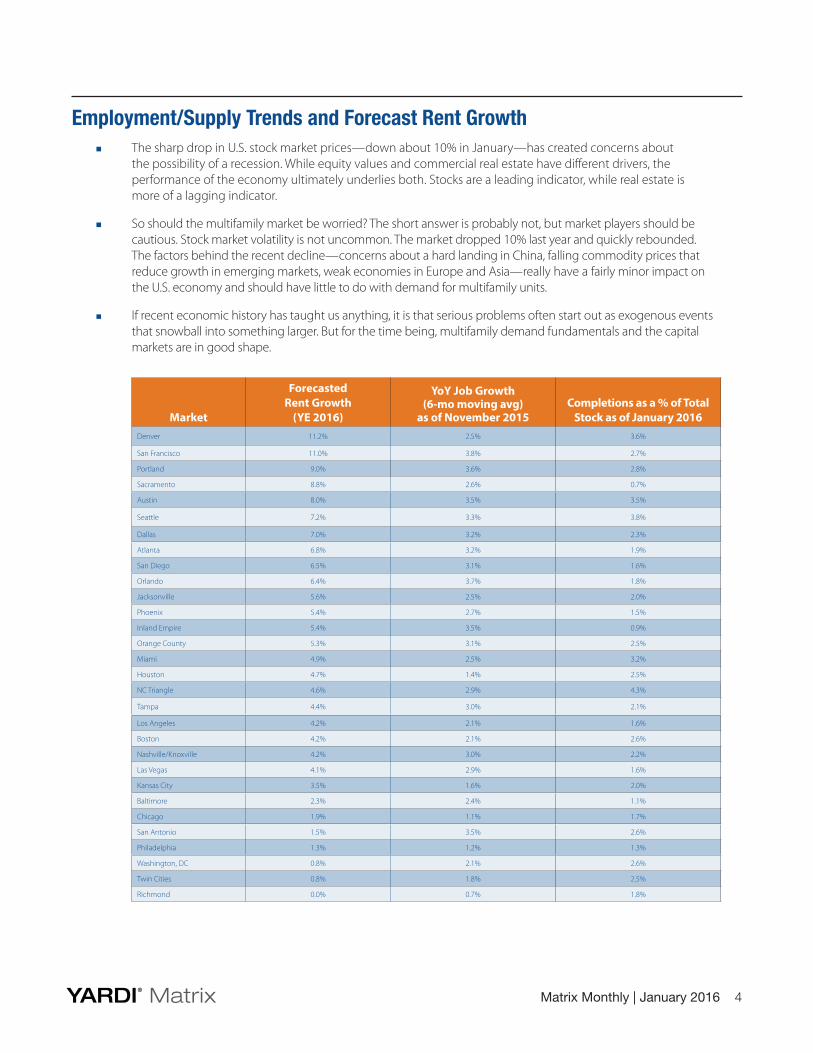
Employment/Supply Trends and Forecast Rent Growth �� The sharp drop in U.S. stock market prices—down about 10% in January—has created concerns about
the possibility of a recession. While equity values and commercial real estate have different drivers, the performance of the economy ultimately underlies both. Stocks are a leading indicator, while real estate is more of a lagging indicator.
�� So should the multifamily market be worried? The short answer is probably not, but market players should be cautious. Stock market volatility is not uncommon. The market dropped 10% last year and quickly rebounded. The factors behind the recent decline—concerns about a hard landing in China, falling commodity prices that reduce growth in emerging markets, weak economies in Europe and Asia—really have a fairly minor impact on the U.S. economy and should have little to do with demand for multifamily units.
�� If recent economic history has taught us anything, it is that serious problems often start out as exogenous events that snowball into something larger. But for the time being, multifamily demand fundamentals and the capital markets are in good shape.
Market
ForecastedRent Growth
(YE 2016)
YoY Job Growth (6-mo moving avg)
as of November 2015Completions as a % of Total
Stock as of January 2016Denver 11.2% 2.5% 3.6%
San Francisco 11.0% 3.8% 2.7%
Portland 9.0% 3.6% 2.8%
Sacramento 8.8% 2.6% 0.7%
Austin 8.0% 3.5% 3.5%
Seattle 7.2% 3.3% 3.8%
Dallas 7.0% 3.2% 2.3%
Atlanta 6.8% 3.2% 1.9%
San Diego 6.5% 3.1% 1.6%
Orlando 6.4% 3.7% 1.8%
Jacksonville 5.6% 2.5% 2.0%
Phoenix 5.4% 2.7% 1.5%
Inland Empire 5.4% 3.5% 0.9%
Orange County 5.3% 3.1% 2.5%
Miami 4.9% 2.5% 3.2%
Houston 4.7% 1.4% 2.5%
NC Triangle 4.6% 2.9% 4.3%
Tampa 4.4% 3.0% 2.1%
Los Angeles 4.2% 2.1% 1.6%
Boston 4.2% 2.1% 2.6%
Nashville/Knoxville 4.2% 3.0% 2.2%
Las Vegas 4.1% 2.9% 1.6%
Kansas City 3.5% 1.6% 2.0%
Baltimore 2.3% 2.4% 1.1%
Chicago 1.9% 1.1% 1.7%
San Antonio 1.5% 3.5% 2.6%
Philadelphia 1.3% 1.2% 1.3%
Washington, DC 0.8% 2.1% 2.6%
Twin Cities 0.8% 1.8% 2.5%
Richmond 0.0% 0.7% 1.8%
Matrix Monthly | January 2016 5
Market Rent Growth by Asset Class
Los Angeles
Dallas Houston
Atlanta
Inland Empire
Denver
Trailing 12 Months Overall Trailing 12 Months Lifestyle Trailing 12 Months Rent by Necessity
Matrix Monthly | January 2016 6
San Diego
Phoenix
Orange County
Sacramento
Orlando
Trailing 12 Months Overall Trailing 12 Months Lifestyle Trailing 12 Months Rent by Necessity
Las Vegas
Matrix Monthly | January 2016 7
Washington, DC
Seattle
Tampa
Trailing 12 Months Overall Trailing 12 Months Lifestyle Trailing 12 Months Rent by Necessity
San Francisco
Matrix Monthly | January 2016 8
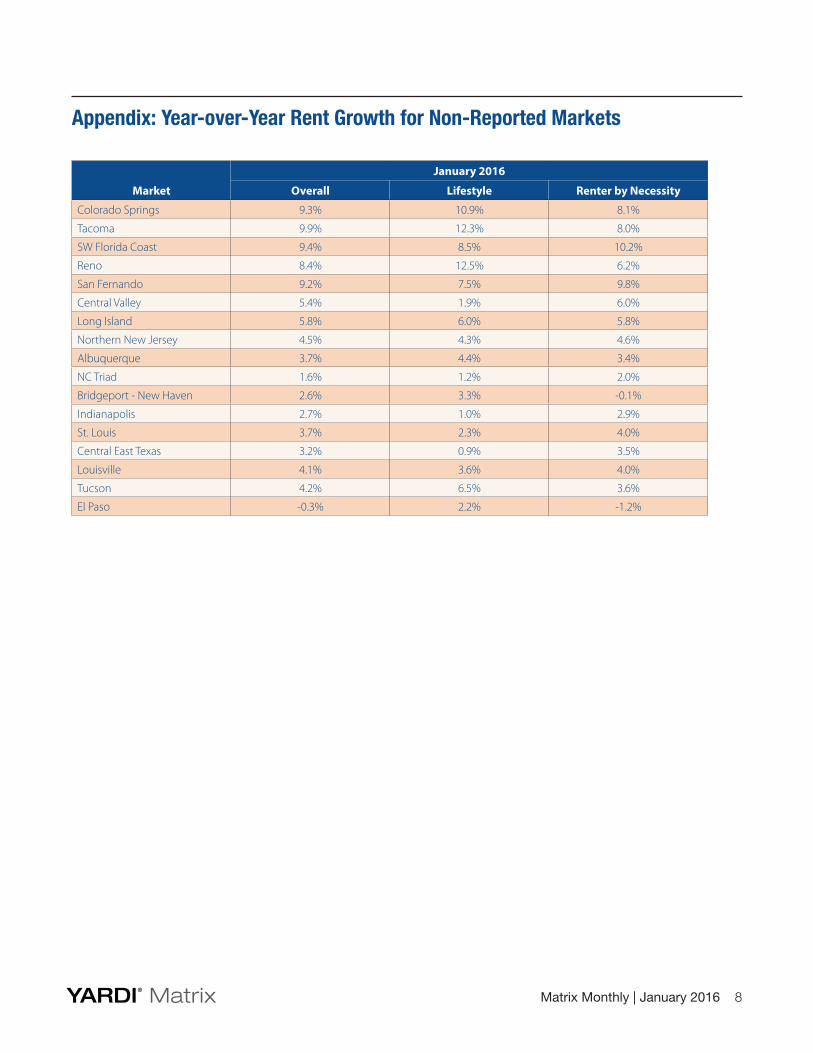
Appendix: Year-over-Year Rent Growth for Non-Reported Markets
Market
January 2016
Overall Lifestyle Renter by Necessity
Colorado Springs 9.3% 10.9% 8.1%
Tacoma 9.9% 12.3% 8.0%
SW Florida Coast 9.4% 8.5% 10.2%
Reno 8.4% 12.5% 6.2%
San Fernando 9.2% 7.5% 9.8%
Central Valley 5.4% 1.9% 6.0%
Long Island 5.8% 6.0% 5.8%
Northern New Jersey 4.5% 4.3% 4.6%
Albuquerque 3.7% 4.4% 3.4%
NC Triad 1.6% 1.2% 2.0%
Bridgeport - New Haven 2.6% 3.3% -0.1%
Indianapolis 2.7% 1.0% 2.9%
St. Louis 3.7% 2.3% 4.0%
Central East Texas 3.2% 0.9% 3.5%
Louisville 4.1% 3.6% 4.0%
Tucson 4.2% 6.5% 3.6%
El Paso -0.3% 2.2% -1.2%
Matrix Monthly | January 2016 9
Definitions Lifestyle households (renters by choice) have wealth sufficient to own but have chosen to rent. Discretionary households, most typically a retired couple or single professional, have chosen the flexibility associated with renting over the obligations of ownership.
Renter by Necessity households span a range. In descending order, household types can be:
�� A young-professional, double-income-no-kids household with substantial income but without wealth needed to acquire a home or condominium;
�� Students, who also may span a range of income capability, extending from affluent to barely getting by;
�� Lower-middle-income (“gray collar”) households, composed of office workers, policemen, firemen, technical workers, teachers, etc.;
�� Blue-collar households, which may barely meet rent demands each month and likely pay a disproportionate share of their income toward rent;
�� Subsidized households, which pay a percentage of household income in rent, with the balance of rent paid through a governmental agency subsidy. Subsidized households, while typically low income, may extend to middle-income households in some high-cost markets, such as New York City;
�� Military households, subject to frequency of relocation.
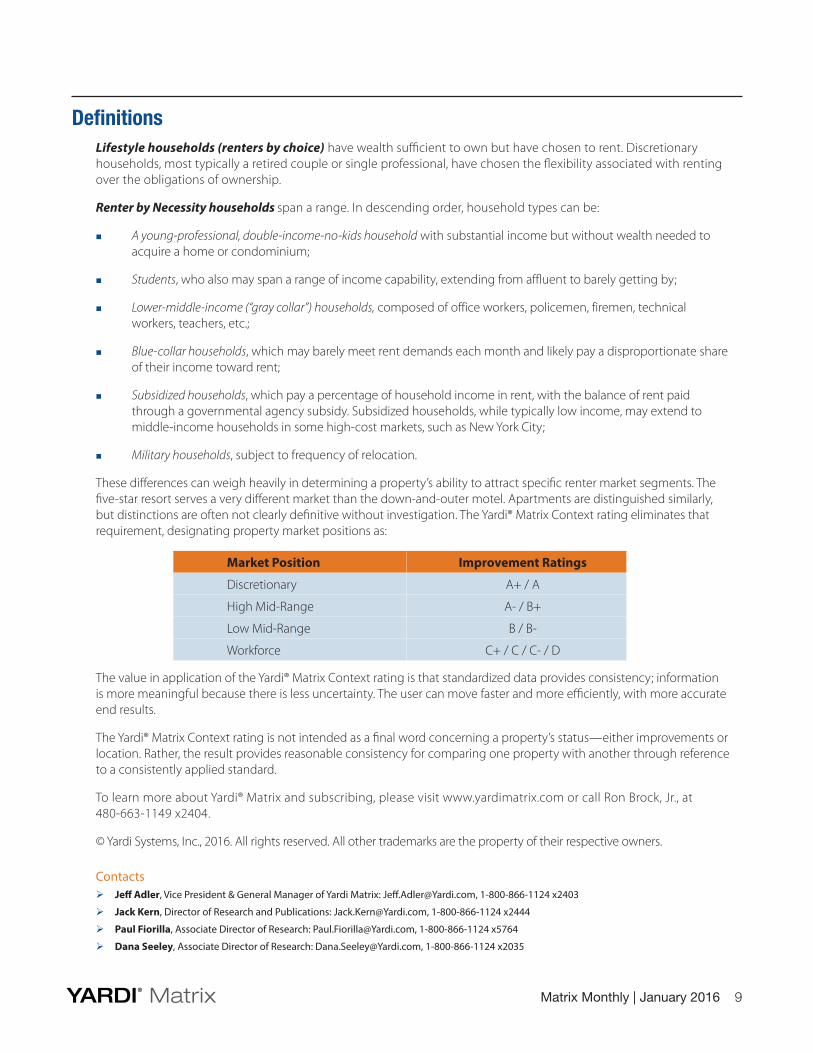
These differences can weigh heavily in determining a property’s ability to attract specific renter market segments. The five-star resort serves a very different market than the down-and-outer motel. Apartments are distinguished similarly, but distinctions are often not clearly definitive without investigation. The Yardi® Matrix Context rating eliminates that requirement, designating property market positions as:
Market Position Improvement Ratings
Discretionary A+ / A
High Mid-Range A- / B+
Low Mid-Range B / B-
Workforce C+ / C / C- / D
The value in application of the Yardi® Matrix Context rating is that standardized data provides consistency; information is more meaningful because there is less uncertainty. The user can move faster and more efficiently, with more accurate end results.
The Yardi® Matrix Context rating is not intended as a final word concerning a property’s status—either improvements or location. Rather, the result provides reasonable consistency for comparing one property with another through reference to a consistently applied standard.
To learn more about Yardi® Matrix and subscribing, please visit www.yardimatrix.com or call Ron Brock, Jr., at 480-663-1149 x2404.
© Yardi Systems, Inc., 2016. All rights reserved. All other trademarks are the property of their respective owners.
Contacts�Jeff Adler, Vice President & General Manager of Yardi Matrix: [email protected], 1-800-866-1124 x2403
�Jack Kern, Director of Research and Publications: [email protected], 1-800-866-1124 x2444
�Paul Fiorilla, Associate Director of Research: [email protected], 1-800-866-1124 x5764
�Dana Seeley, Associate Director of Research: [email protected], 1-800-866-1124 x2035