Embed Size (px)
Citation preview

Toronto EmploymentGrowthJanuary 2016 4.8%
Month February 20161 Year3 Year5 Year
3.14%3.39%4.64%
February 20161 Year3 Year5 Year
------
Market Watch For All TREB Member Inquiries:
(416) 443-8158For All Media/Public Inquiries:
(416) 443-8152
Record February SalesTORONTO, March 3, 2016 – Toronto Real Estate Board President Mark McLeanannounced Greater Toronto Area REALTORS® reported a record number of homesales through TREB’s MLS® System in February 2016. There were 7,621transactions reported this past February – up 21.1 per cent compared to February2015.
The number of new listings entered into TREB’s MLS® System was also up on ayear-over-year basis, but by a lesser 8.2 per cent. The fact that the annual rate ofsales growth outstripped the annual rate of price growth shows a tightening of marketconditions compared to last year.
“Even after accounting for the leap year day, sales were above the previous recordfor February set back in 2010. Sales were up strongly from the 15th day of the monthonward as well, despite the new federal mortgage lending guidelines coming intoeffect that require at least a 10 per cent down payment on the portion of purchaseprices between $500,000 and $1,000,000,” said Mr. McLean.
Seller’s market conditions continued throughout the GTA in February. Strongcompetition between buyers resulted in a healthy growth in selling prices. The MLS®Home Price Index (HPI) Composite Benchmark was up by 11.3 per cent year-over-year. The average selling price was up by 14.9 per cent annually to $685,278.
“Recent polling conducted for TREB by Ipsos suggested that GTA households willremain upbeat about purchasing a home in 2016. Early sales results for January andFebruary certainly support this view. With strong sales up against a constrainedsupply of listings, home prices continued to trend strongly upward,” said JasonMercer, TREB’s Director of Market Analysis.
TREB MLS® Sales Activity
7,6216,294
February 2016 February 2015
TREB MLS® Average Price
$685,278
$596,320
February 2016 February 2015
Year-Over-Year Summary2016 2015 % Chg.
SalesNew ListingsActive ListingsAverage PriceAverage DOM
7,621 6,294 21.1%11,275 10,421 8.2%10,902 12,793 -14.8%
$685,278 $596,320 14.9%21 23 -8.7%
Sources and Notes:
i - Statistics Canada, Quarter-over-quartergrowth, annualized
ii - Statistics Canada, Year-over-yeargrowth for the most recently reportedmonth
iii - Bank of Canada, Rate from mostrecent Bank of Canada announcement
iv - Bank of Canada, Rates for mostrecently completed month
Real GDP GrowthQ4 2015 0.8%
Toronto UnemploymentRate January 2016 7.1%
Inflation Rate (Yr./Yr. CPIGrowth) January 2016 2.0%
Bank of Canada OvernightRate February 2016 - 0.50%
Prime Rate February 2016 - 2.70%
Economic Indicators
Metrics Sales Average Price416 905 Total 416 905 Total
2016DetachedSemi - DetachedTownhouseCondo Apartment
855 2,772 3,627 $1,211,459 $816,705 $909,761239 486 725 $848,835 $534,476 $638,106253 849 1,102 $578,667 $493,092 $512,739
1,439 607 2,046 $435,579 $327,086 $403,392
Sales & Average Price By Major Home TypeFebruary 2016
February 2016
i
ii
ii
iii
iv
DetachedSemi - DetachedTownhouseCondo Apartment
16.3% 17.4% 16.1%20.7% 12.7% 16.1%13.9% 13.8% 13.7%17.8% 1.6% 13.4%
DetachedSemi - DetachedTownhouseCondo Apartment
11.8% 23.1% 20.3%21.9% 21.8% 21.8%11.0% 18.1% 16.4%25.6% 26.7% 25.9%
1,7
1,7
1,7
1,7
Year-Over-Year Per Cent Change
Mortgage Rates

Toronto Real Estate Board
Market Watch, February 2016
SALES BY PRICE RANGE AND HOUSE TYPE FEBRUARY 2016
2
Price Range Detached Semi-Detached Att/Row/Twnhouse Condo Townhouse Condo Apt Link Co-op Apt Det Condo Co-ownership Apt Total
$0 to $99,999$100,000 to $199,999$200,000 to $299,999$300,000 to $399,999$400,000 to $499,999$500,000 to $599,999$600,000 to $699,999$700,000 to $799,999$800,000 to $899,999$900,000 to $999,999$1,000,000 to $1,249,999$1,250,000 to $1,499,999$1,500,000 to $1,749,999$1,750,000 to $1,999,999$2,000,000+
0 0 0 0 11 0 0 0 0 1110 0 2 12 89 0 1 0 1 11550 9 5 63 561 0 2 1 3 694154 45 66 155 642 14 1 0 2 1,079352 158 181 159 365 24 2 1 2 1,244481 216 113 61 153 11 0 1 0 1,036531 122 89 23 94 16 0 0 0 875481 66 74 17 57 15 1 0 0 711336 41 38 10 22 18 0 0 0 465249 24 10 3 14 3 0 0 0 303334 15 8 4 18 2 0 0 0 381247 9 4 3 7 0 0 0 0 270131 10 1 0 3 0 0 0 0 14596 3 0 1 5 0 0 0 0 105175 7 0 0 5 0 0 0 0 187
Price Range Detached Semi-Detached Att/Row/Twnhouse Condo Townhouse Condo Apt Link Co-op Apt Det Condo Co-ownership Apt Total
$0 to $99,999$100,000 to $199,999$200,000 to $299,999$300,000 to $399,999$400,000 to $499,999$500,000 to $599,999$600,000 to $699,999$700,000 to $799,999$800,000 to $899,999$900,000 to $999,999$1,000,000 to $1,249,999$1,250,000 to $1,499,999$1,500,000 to $1,749,999$1,750,000 to $1,999,999$2,000,000+
0 0 0 0 14 0 0 0 0 1415 2 2 29 149 0 2 0 1 20096 21 10 122 966 1 5 1 5 1,227271 71 103 269 1,053 24 2 0 3 1,796581 289 300 256 570 35 3 1 2 2,037799 355 202 96 252 22 0 1 0 1,727881 195 162 32 144 28 0 0 0 1,442731 98 104 30 75 25 1 0 0 1,064531 60 51 12 33 26 1 1 0 715368 32 12 4 21 7 0 0 0 444514 21 10 11 32 2 0 0 0 590356 10 8 3 12 0 0 0 0 389199 10 1 0 6 0 0 0 0 216133 4 0 1 6 0 0 0 0 144257 8 0 0 8 0 0 0 0 273
SALES BY PRICE RANGE AND HOUSE TYPE YEAR-TO-DATE, 2016
Total SalesShare of Total SalesAverage Price
3,627 725 591 511 2,046 103 7 3 8 7,62147.6% 9.5% 7.8% 6.7% 26.8% 1.4% 0.1% 0.0% 0.1% 100.0%
$909,761 $638,106 $575,306 $440,376 $403,392 $615,549 $399,643 $431,000 $287,750 $685,278
Total SalesShare of Total SalesAverage Price
5,732 1,176 965 865 3,341 170 14 4 11 12,27846.7% 9.6% 7.9% 7.0% 27.2% 1.4% 0.1% 0.0% 0.1% 100.0%
$886,639 $611,419 $566,714 $428,273 $396,872 $612,448 $375,321 $541,500 $278,818 $664,533
1,7
1,7

Toronto Real Estate Board
Market Watch, February 2016
Number of Sales Dollar Volume Average Price Median Price New Listings SNLR (Trend) Active Listings Mos. Inv. (Trend) Avg. SP / LP Avg. DOMTREB TotalHalton Region
BurlingtonHalton HillsMiltonOakville
Peel RegionBramptonCaledonMississauga
City of TorontoToronto WestToronto CentralToronto East
York RegionAuroraE. GwillimburyGeorginaKingMarkhamNewmarketRichmond HillVaughanWhitchurch-Stouffville
Durham RegionAjaxBrockClaringtonOshawaPickeringScugogUxbridgeWhitby
Dufferin CountyOrangeville
Simcoe CountyAdjala-TosorontioBradford WestGwillimburyEssaInnisfilNew Tecumseth
7,621 $5,222,502,241 685,278 $565,000 11,275 64.0% 10,902 1.7 101% 21678 $517,885,287 763,843 $653,000 974 70.1% 928 1.7 99% 20126 $82,862,992 657,643 $597,500 209 73.5% 229 1.7 99% 2688 $51,017,466 579,744 $534,500 107 73.4% 105 1.7 99% 25
178 $103,648,850 582,297 $551,800 254 74.1% 171 1.2 101% 14286 $280,355,979 980,266 $875,000 404 64.9% 423 2.0 99% 20
1,591 $902,025,141 566,955 $517,000 2,337 64.9% 1,933 1.6 99% 18738 $401,757,754 544,387 $508,000 1,004 67.5% 670 1.2 99% 1576 $58,409,657 768,548 $719,000 124 62.0% 147 2.6 98% 17
777 $441,857,730 568,671 $514,000 1,209 63.0% 1,116 1.8 100% 212,809 $2,022,039,822 719,843 $549,900 4,476 58.5% 5,070 2.1 102% 24678 $404,810,520 597,066 $538,500 1,089 60.7% 1,267 2.0 101% 25
1,448 $1,210,592,783 836,045 $519,950 2,444 53.8% 3,018 2.6 101% 26683 $406,636,519 595,368 $595,000 943 66.3% 785 1.3 104% 20
1,452 $1,248,122,558 859,589 $774,750 2,141 64.8% 1,929 1.6 102% 2093 $80,562,239 866,261 $731,000 134 73.2% 99 1.3 101% 2228 $18,397,400 657,050 $618,000 47 65.3% 47 2.3 101% 1973 $31,884,540 436,775 $413,500 93 70.0% 105 1.8 98% 2638 $42,396,291 1,115,692 $1,030,001 60 55.2% 92 4.0 96% 56
393 $350,977,362 893,072 $802,000 578 61.6% 508 1.5 104% 20122 $88,079,347 721,962 $695,000 148 79.2% 85 0.9 102% 13293 $279,522,081 954,000 $888,000 449 62.1% 396 1.6 103% 16351 $307,874,101 877,134 $789,000 556 64.4% 504 1.6 101% 1861 $48,429,197 793,921 $736,253 76 67.3% 93 1.9 99% 28
845 $414,118,253 490,081 $465,000 1,053 75.5% 710 1.1 102% 16149 $82,347,694 552,669 $530,000 171 78.0% 75 0.7 103% 1215 $4,414,400 294,293 $280,000 31 55.3% 60 4.6 96% 68
135 $57,094,472 422,922 $415,000 193 78.2% 135 1.1 102% 18220 $89,576,420 407,166 $400,000 245 78.7% 130 0.8 103% 13109 $63,881,701 586,071 $525,000 135 70.4% 106 1.2 101% 1731 $14,649,200 472,555 $470,000 40 64.6% 46 2.6 100% 2722 $13,961,701 634,623 $635,000 32 63.7% 52 2.8 98% 33
164 $88,192,665 537,760 $525,000 206 77.3% 106 0.8 102% 1351 $21,130,100 414,316 $395,000 74 86.6% 54 1.1 100% 1351 $21,130,100 414,316 $395,000 74 86.6% 54 1.1 100% 13
195 $97,181,080 498,365 $455,000 220 73.4% 278 2.0 98% 2712 $6,447,400 537,283 $458,500 11 70.0% 39 3.4 97% 5670 $41,217,539 588,822 $554,000 77 77.3% 57 1.3 98% 1718 $7,756,900 430,939 $388,500 20 75.2% 33 2.1 98% 5241 $17,272,100 421,271 $410,000 55 64.3% 86 2.7 98% 2054 $24,487,141 453,466 $425,000 57 80.0% 63 1.8 98% 31
SUMMARY OF EXISTING HOME TRANSACTIONS ALL HOME TYPES, FEBRUARY 2016ALL TREB AREAS
3
1 1 1 2 5498 3

Toronto Real Estate Board
Market Watch, February 2016
SUMMARY OF EXISTING HOME TRANSACTIONS ALL HOME TYPES, FEBRUARY 2016CITY OF TORONTO MUNICIPAL BREAKDOWN
4
Number of Sales Dollar Volume Average Price Median Price New Listings SNLR (Trend) Active Listings Mos. Inv. (Trend) Avg. SP / LP Avg. DOMTREB TotalCity of Toronto TotalToronto West
Toronto W01Toronto W02Toronto W03Toronto W04Toronto W05Toronto W06Toronto W07Toronto W08Toronto W09Toronto W10
Toronto CentralToronto C01Toronto C02Toronto C03Toronto C04Toronto C06Toronto C07Toronto C08Toronto C09Toronto C10Toronto C11Toronto C12Toronto C13Toronto C14Toronto C15
Toronto EastToronto E01Toronto E02Toronto E03Toronto E04Toronto E05Toronto E06Toronto E07Toronto E08Toronto E09Toronto E10Toronto E11
7,621 $5,222,502,241 $685,278 $565,000 11,275 64.0% 10,902 1.7 101% 212,809 $2,022,039,822 $719,843 $549,900 4,476 58.5% 5,070 2.1 102% 24678 $404,810,520 $597,066 $538,500 1,089 60.7% 1,267 2.0 101% 2553 $40,442,412 $763,064 $521,022 72 55.8% 80 2.2 103% 2761 $45,804,324 $750,891 $700,000 75 70.2% 61 1.2 104% 1853 $28,258,212 $533,174 $550,000 72 66.3% 56 1.3 101% 1655 $30,110,550 $547,465 $555,000 108 62.4% 112 1.9 101% 2287 $38,012,000 $436,920 $460,000 141 63.3% 189 2.1 100% 34
105 $55,406,776 $527,684 $461,000 189 47.9% 282 3.3 100% 3330 $26,962,831 $898,761 $892,500 41 60.9% 39 1.6 104% 26
134 $97,154,578 $725,034 $487,500 242 60.5% 289 2.2 101% 2136 $19,111,900 $530,886 $648,250 49 68.9% 54 1.6 101% 2564 $23,546,937 $367,921 $292,500 100 68.3% 105 1.6 99% 24
1,448 $1,210,592,783 $836,045 $519,950 2,444 53.8% 3,018 2.6 101% 26442 $235,380,222 $532,534 $441,000 830 50.0% 1,096 3.1 100% 2769 $87,597,608 $1,269,531 $900,800 133 47.3% 186 3.4 101% 2240 $48,376,788 $1,209,420 $1,078,000 76 55.5% 104 2.4 102% 2182 $131,921,145 $1,608,794 $1,647,500 122 60.7% 101 1.7 104% 1632 $21,211,500 $662,859 $454,000 43 57.7% 45 2.5 104% 36
109 $84,578,707 $775,951 $461,000 184 56.5% 205 2.3 100% 25146 $72,786,166 $498,535 $437,000 222 56.5% 297 2.4 99% 3133 $54,165,100 $1,641,367 $1,506,500 46 60.3% 51 2.1 97% 2752 $39,859,417 $766,527 $580,250 79 58.6% 83 1.8 102% 2033 $23,893,788 $724,054 $363,000 57 64.4% 61 1.6 110% 2445 $94,024,599 $2,089,436 $1,900,000 89 49.7% 131 3.6 100% 2866 $73,874,366 $1,119,309 $771,500 95 66.1% 90 1.6 109% 17
175 $156,817,107 $896,098 $471,000 254 51.5% 318 2.8 100% 27124 $86,106,270 $694,405 $456,500 214 54.2% 250 2.4 103% 25683 $406,636,519 $595,368 $595,000 943 66.3% 785 1.3 104% 2078 $61,799,671 $792,303 $752,500 90 66.9% 55 1.0 107% 1657 $44,619,290 $782,795 $716,500 86 63.4% 74 1.2 107% 2276 $54,055,093 $711,251 $725,000 104 69.2% 65 0.9 105% 1765 $31,713,001 $487,892 $550,000 106 66.9% 99 1.3 103% 2274 $43,311,176 $585,286 $469,500 92 66.7% 81 1.3 104% 2129 $22,088,186 $761,662 $661,000 30 60.2% 25 1.5 105% 2768 $33,859,128 $497,928 $357,000 104 62.0% 108 1.8 103% 2550 $23,970,287 $479,406 $530,500 62 70.9% 53 1.3 102% 1686 $38,231,587 $444,553 $380,194 119 67.6% 99 1.5 102% 2351 $30,901,200 $605,906 $620,000 75 62.6% 61 1.5 104% 1449 $22,087,900 $450,773 $462,000 75 69.8% 65 1.2 101% 22
1 1 1 2 8 3 9 4 5

Toronto Real Estate Board
Market Watch, February 2016
SUMMARY OF EXISTING HOME TRANSACTIONS ALL HOME TYPES, YEAR-TO-DATE 2016ALL TREB AREAS
5
Number of Sales Dollar Volume Average Price Median Price New Listings Avg. SP / LP Avg. DOMTREB TotalHalton Region
BurlingtonHalton HillsMiltonOakville
Peel RegionBramptonCaledonMississauga
City of TorontoToronto WestToronto CentralToronto East
York RegionAuroraE. GwillimburyGeorginaKingMarkhamNewmarketRichmond HillVaughanWhitchurch-Stouffville
Durham RegionAjaxBrockClaringtonOshawaPickeringScugogUxbridgeWhitby
Dufferin CountyOrangeville
Simcoe CountyAdjala-TosorontioBradford WestGwillimburyEssaInnisfilNew Tecumseth
12,278 $8,159,130,088 $664,533 $550,000 20,194 101% 241,073 $803,939,235 $749,244 $640,000 1,711 99% 23210 $135,034,142 $643,020 $586,000 358 99% 28128 $73,958,121 $577,798 $540,000 188 99% 27291 $172,834,177 $593,932 $556,000 421 100% 16444 $422,112,795 $950,704 $828,500 744 98% 24
2,636 $1,467,122,903 $556,572 $511,000 4,110 99% 211,232 $658,551,530 $534,539 $505,000 1,784 99% 18114 $86,787,957 $761,298 $697,000 205 97% 26
1,290 $721,783,416 $559,522 $505,000 2,121 99% 244,499 $3,095,095,723 $687,952 $530,000 8,218 101% 281,071 $622,926,151 $581,630 $535,000 1,981 100% 292,281 $1,815,767,045 $796,040 $497,000 4,521 101% 301,147 $656,402,527 $572,278 $580,500 1,716 103% 222,344 $1,972,754,718 $841,619 $753,750 3,745 101% 22140 $118,955,389 $849,681 $767,500 206 101% 2242 $28,065,380 $668,223 $598,000 69 99% 27
128 $54,851,289 $428,526 $409,250 183 98% 2653 $60,069,791 $1,133,392 $1,020,000 99 96% 53
651 $559,111,561 $858,850 $783,000 1,041 103% 22180 $126,000,437 $700,002 $659,000 252 102% 14472 $443,992,835 $940,663 $850,000 783 102% 20579 $498,971,741 $861,782 $770,000 969 100% 2299 $82,736,295 $835,720 $736,253 143 98% 25
1,351 $640,048,467 $473,759 $450,000 1,837 101% 19231 $122,857,152 $531,849 $515,000 294 102% 1523 $7,190,900 $312,648 $290,000 47 96% 65
221 $94,358,532 $426,962 $401,000 318 102% 20377 $146,958,963 $389,812 $380,000 460 102% 15175 $96,448,189 $551,133 $500,100 254 101% 2049 $24,204,000 $493,959 $472,500 69 99% 2941 $25,801,776 $629,312 $580,000 65 98% 38
234 $122,228,955 $522,346 $507,500 330 102% 1480 $32,407,400 $405,093 $395,000 122 100% 1880 $32,407,400 $405,093 $395,000 122 100% 18
295 $147,761,642 $500,887 $460,000 451 98% 2919 $10,961,400 $576,916 $550,000 33 97% 61
112 $65,327,429 $583,281 $545,000 153 99% 1935 $13,806,000 $394,457 $355,500 46 98% 4563 $27,353,500 $434,183 $405,000 109 98% 2766 $30,313,313 $459,293 $415,000 110 98% 31
1 1 1 2 4 5

Toronto Real Estate Board
Market Watch, February 2016
SUMMARY OF EXISTING HOME TRANSACTIONS ALL HOME TYPES, YEAR-TO-DATE 2016CITY OF TORONTO MUNICIPAL BREAKDOWN
6
Number of Sales Dollar Volume Average Price Median Price New Listings Avg. SP / LP Avg. DOMTREB TotalCity of Toronto TotalToronto West
Toronto W01Toronto W02Toronto W03Toronto W04Toronto W05Toronto W06Toronto W07Toronto W08Toronto W09Toronto W10
Toronto CentralToronto C01Toronto C02Toronto C03Toronto C04Toronto C06Toronto C07Toronto C08Toronto C09Toronto C10Toronto C11Toronto C12Toronto C13Toronto C14Toronto C15
Toronto EastToronto E01Toronto E02Toronto E03Toronto E04Toronto E05Toronto E06Toronto E07Toronto E08Toronto E09Toronto E10Toronto E11
12,278 $8,159,130,088 $664,533 $550,000 20,194 101% 244,499 $3,095,095,723 $687,952 $530,000 8,218 101% 281,071 $622,926,151 $581,630 $535,000 1,981 100% 29
73 $51,610,412 $706,992 $505,000 125 102% 3293 $67,892,824 $730,030 $666,000 146 103% 1983 $47,015,812 $566,456 $570,000 117 100% 1992 $51,226,063 $556,805 $564,950 193 100% 26
135 $59,973,922 $444,251 $460,000 256 99% 34178 $93,073,424 $522,884 $460,500 382 100% 3640 $33,775,831 $844,396 $824,500 72 103% 25
209 $144,620,926 $691,966 $490,000 409 100% 2959 $31,522,400 $534,278 $625,000 94 100% 24
109 $42,214,537 $387,289 $355,000 187 99% 282,281 $1,815,767,045 $796,040 $497,000 4,521 101% 30708 $368,258,765 $520,139 $427,150 1,533 99% 3198 $118,531,508 $1,209,505 $856,000 242 100% 2769 $85,504,190 $1,239,191 $881,000 144 100% 28
120 $188,755,045 $1,572,959 $1,569,000 215 103% 1966 $43,386,500 $657,371 $442,500 78 102% 42
173 $121,246,707 $700,848 $450,000 329 100% 28219 $111,074,054 $507,187 $440,000 444 99% 3443 $69,432,253 $1,614,704 $1,351,000 80 98% 2974 $55,625,595 $751,697 $567,500 152 102% 2358 $40,705,088 $701,812 $379,000 102 107% 2265 $138,485,899 $2,130,552 $1,850,000 158 99% 34
104 $104,092,088 $1,000,885 $680,500 175 107% 23286 $235,422,383 $823,155 $461,000 494 101% 33198 $135,246,970 $683,066 $466,000 375 103% 28
1,147 $656,402,527 $572,278 $580,500 1,716 103% 22113 $88,929,770 $786,989 $741,000 172 107% 1576 $61,701,590 $811,863 $734,950 130 105% 22
117 $82,069,691 $701,450 $717,500 174 105% 19128 $61,420,201 $479,845 $548,000 203 102% 22109 $60,370,564 $553,858 $452,000 164 103% 2146 $32,727,622 $711,470 $637,500 62 103% 26
131 $63,472,008 $484,519 $359,000 188 101% 3083 $43,573,830 $524,986 $538,000 111 101% 24
154 $65,824,651 $427,433 $351,750 222 102% 2679 $47,417,500 $600,222 $620,000 137 103% 20
111 $48,895,100 $440,496 $450,000 153 100% 21
1 1 1 2 4 5

Toronto Real Estate Board
Market Watch, February 2016
SUMMARY OF EXISTING HOME TRANSACTIONS DETACHED HOUSES, FEBRUARY 2016ALL TREB AREAS
7
Sales Dollar Volume Average Price Median Price New Listings Active Listings Avg. SP / LP Avg. DOMTREB TotalHalton Region
BurlingtonHalton HillsMiltonOakville
Peel RegionBramptonCaledonMississauga
City of TorontoToronto WestToronto CentralToronto East
York RegionAuroraE. GwillimburyGeorginaKingMarkhamNewmarketRichmond HillVaughanWhitchurch-Stouffville
Durham RegionAjaxBrockClaringtonOshawaPickeringScugogUxbridgeWhitby
Dufferin CountyOrangeville
Simcoe CountyAdjala-TosorontioBradford WestGwillimburyEssaInnisfilNew Tecumseth
3,627 $3,299,703,589 $909,761 $748,000 5,165 4,363 101% 18423 $395,783,925 $935,659 $790,000 599 598 99% 2273 $59,315,467 $812,541 $732,000 116 134 98% 2766 $42,333,579 $641,418 $595,000 90 97 99% 3184 $59,820,600 $712,150 $695,500 132 117 101% 18
200 $234,314,279 $1,171,571 $990,000 261 250 99% 18719 $540,326,097 $751,497 $671,000 1,079 881 99% 16402 $260,681,466 $648,461 $592,000 565 378 98% 1558 $49,258,000 $849,276 $777,250 99 135 97% 19
259 $230,386,631 $889,524 $776,800 415 368 99% 17855 $1,035,797,538 $1,211,459 $920,000 1,286 1,039 104% 15256 $228,346,530 $891,979 $767,500 398 367 103% 17312 $583,361,683 $1,869,749 $1,686,944 460 392 103% 14287 $224,089,325 $780,799 $717,500 428 280 105% 14855 $911,966,801 $1,066,628 $975,000 1,245 1,045 102% 1956 $61,611,776 $1,100,210 $961,000 80 59 101% 2322 $15,689,500 $713,159 $672,500 39 43 101% 2368 $30,049,540 $441,905 $409,250 87 95 98% 2733 $40,129,801 $1,216,055 $1,075,000 46 77 96% 48
182 $226,343,079 $1,243,643 $1,147,500 266 187 104% 1987 $70,748,759 $813,204 $788,880 112 68 102% 14
168 $211,875,558 $1,261,164 $1,194,400 255 181 103% 12189 $213,413,735 $1,129,173 $1,030,000 299 253 101% 1450 $42,105,053 $842,101 $760,000 61 82 98% 33
589 $318,587,239 $540,895 $524,900 721 517 102% 18102 $62,637,650 $614,095 $601,450 112 46 103% 1315 $4,414,400 $294,293 $280,000 28 53 96% 6890 $41,724,223 $463,602 $450,000 127 94 102% 22
165 $73,028,476 $442,597 $430,000 175 99 103% 1360 $43,634,901 $727,248 $673,000 77 60 101% 1729 $13,913,300 $479,769 $485,000 37 44 99% 2816 $11,853,901 $740,869 $680,501 25 47 98% 34
112 $67,380,388 $601,611 $575,000 140 74 102% 1431 $14,814,100 $477,874 $448,800 56 46 99% 1531 $14,814,100 $477,874 $448,800 56 46 99% 15
155 $82,427,889 $531,793 $485,000 179 237 98% 2712 $6,447,400 $537,283 $458,500 11 39 97% 5656 $34,997,139 $624,949 $582,500 63 49 98% 1814 $6,517,500 $465,536 $434,500 15 30 97% 6135 $15,221,100 $434,889 $425,000 51 83 98% 2238 $19,244,750 $506,441 $444,000 39 36 98% 24
1 2 3 4 51 1 1

Toronto Real Estate Board
Market Watch, February 2016
SUMMARY OF EXISTING HOME TRANSACTIONS DETACHED HOUSES, FEBRUARY 2016CITY OF TORONTO MUNICIPAL BREAKDOWN
8
Sales Dollar Volume Average Price Median Price New Listings Active Listings Avg. SP / LP Avg. DOMTREB TotalCity of Toronto TotalToronto West
Toronto W01Toronto W02Toronto W03Toronto W04Toronto W05Toronto W06Toronto W07Toronto W08Toronto W09Toronto W10
Toronto CentralToronto C01Toronto C02Toronto C03Toronto C04Toronto C06Toronto C07Toronto C08Toronto C09Toronto C10Toronto C11Toronto C12Toronto C13Toronto C14Toronto C15
Toronto EastToronto E01Toronto E02Toronto E03Toronto E04Toronto E05Toronto E06Toronto E07Toronto E08Toronto E09Toronto E10Toronto E11
3,627 $3,299,703,589 $909,761 $748,000 5,165 4,363 101% 18855 $1,035,797,538 $1,211,459 $920,000 1,286 1,039 104% 15256 $228,346,530 $891,979 $767,500 398 367 103% 1713 $20,255,500 $1,558,115 $1,400,000 21 14 106% 817 $18,647,000 $1,096,882 $1,038,000 25 20 105% 2228 $15,925,600 $568,771 $570,000 33 27 101% 1628 $19,950,500 $712,518 $674,750 62 60 101% 1717 $11,724,900 $689,700 $625,000 26 31 101% 2233 $24,913,576 $754,957 $707,000 40 35 103% 1623 $23,803,331 $1,034,927 $951,000 30 22 104% 2553 $64,063,686 $1,208,749 $1,020,000 95 110 102% 1521 $15,218,400 $724,686 $700,000 30 23 102% 1523 $13,844,037 $601,915 $581,000 36 25 100% 16
312 $583,361,683 $1,869,749 $1,686,944 460 392 103% 147 $9,229,000 $1,318,429 $1,200,000 6 5 107% 58 $13,724,036 $1,715,505 $1,566,000 17 19 100% 1123 $33,880,888 $1,473,082 $1,140,000 33 35 101% 2261 $119,090,445 $1,952,302 $1,840,000 89 65 104% 1311 $12,973,500 $1,179,409 $1,115,000 20 12 107% 1131 $49,237,930 $1,588,320 $1,355,000 48 32 101% 111 $1,399,000 $1,399,000 $1,399,000 2 3 100% 111 $27,840,000 $2,530,909 $2,360,000 14 19 98% 157 $12,085,000 $1,726,429 $1,561,000 10 8 105% 1911 $16,732,100 $1,521,100 $1,460,000 21 18 114% 925 $77,960,699 $3,118,428 $3,010,000 52 76 101% 2431 $58,137,466 $1,875,402 $1,581,000 40 24 112% 1152 $103,657,037 $1,993,405 $1,906,000 58 50 101% 2033 $47,414,582 $1,436,806 $1,370,000 50 26 107% 7
287 $224,089,325 $780,799 $717,500 428 280 105% 1417 $16,651,931 $979,525 $818,500 21 8 107% 616 $17,263,000 $1,078,938 $965,000 26 21 106% 747 $37,053,470 $788,372 $745,000 63 40 104% 1528 $18,970,500 $677,518 $650,000 50 40 106% 1627 $24,274,088 $899,040 $863,800 36 16 107% 1223 $19,758,286 $859,056 $857,500 27 18 105% 2319 $16,061,050 $845,318 $830,000 32 25 105% 1325 $17,553,900 $702,156 $652,000 40 25 102% 1137 $23,548,900 $636,457 $640,000 53 25 104% 1632 $23,527,500 $735,234 $687,500 49 40 104% 1616 $9,426,700 $589,169 $574,500 31 22 103% 16
1 1 1 1 2 3 4 5

Toronto Real Estate Board
Market Watch, February 2016
SUMMARY OF EXISTING HOME TRANSACTIONS SEMI-DETACHED HOUSES, FEBRUARY 2016ALL TREB AREAS
9
Sales Dollar Volume Average Price Median Price New Listings Active Listings Avg. SP / LP Avg. DOMTREB TotalHalton Region
BurlingtonHalton HillsMiltonOakville
Peel RegionBramptonCaledonMississauga
City of TorontoToronto WestToronto CentralToronto East
York RegionAuroraE. GwillimburyGeorginaKingMarkhamNewmarketRichmond HillVaughanWhitchurch-Stouffville
Durham RegionAjaxBrockClaringtonOshawaPickeringScugogUxbridgeWhitby
Dufferin CountyOrangeville
Simcoe CountyAdjala-TosorontioBradford WestGwillimburyEssaInnisfilNew Tecumseth
725 $462,627,170 $638,106 $565,000 888 452 104% 1338 $20,794,884 $547,234 $550,050 50 18 102% 59 $4,931,200 $547,911 $560,000 12 7 103% 45 $2,314,034 $462,807 $477,000 3 1 99% 1219 $10,272,650 $540,666 $550,000 26 6 103% 55 $3,277,000 $655,400 $635,000 9 4 101% 5
281 $145,181,877 $516,661 $515,000 338 161 101% 12158 $76,050,479 $481,332 $481,000 179 86 101% 135 $2,693,007 $538,601 $555,000 6 4 100% 14
118 $66,438,391 $563,037 $565,000 153 71 101% 12239 $202,871,658 $848,835 $735,000 312 189 106% 1668 $42,677,529 $627,611 $599,000 96 78 102% 1977 $89,404,365 $1,161,096 $910,000 102 59 106% 1494 $70,789,764 $753,083 $728,500 114 52 109% 16
102 $68,329,417 $669,896 $676,500 117 51 104% 108 $4,845,888 $605,736 $609,500 10 3 109% 52 $988,000 $494,000 $494,000 2 0 99% 80 - - - 0 0 - -0 - - - 0 0 - -27 $20,422,788 $756,400 $778,000 29 8 106% 1216 $8,399,300 $524,956 $532,500 10 5 103% 1011 $7,780,465 $707,315 $690,000 15 9 106% 933 $22,915,100 $694,397 $690,000 43 23 101% 105 $2,977,876 $595,575 $599,000 8 3 105% 552 $20,716,834 $398,401 $390,000 61 26 105% 912 $5,742,746 $478,562 $495,500 13 3 104% 70 - - - 1 1 - -7 $2,453,000 $350,429 $345,000 7 6 102% 1017 $5,367,788 $315,752 $310,000 23 8 106% 129 $4,438,000 $493,111 $486,500 11 7 104% 81 $300,000 $300,000 $300,000 1 0 100% 00 - - - 0 0 - -6 $2,415,300 $402,550 $397,500 5 1 108% 55 $1,678,000 $335,600 $320,000 4 3 101% 125 $1,678,000 $335,600 $320,000 4 3 101% 128 $3,054,500 $381,813 $347,500 6 4 100% 110 - - - 0 0 - -5 $2,111,000 $422,200 $435,000 2 1 101% 80 - - - 0 0 - -0 - - - 0 0 - -3 $943,500 $314,500 $306,000 4 3 97% 16
1 1 1 1 2 3 4 5

Toronto Real Estate Board
Market Watch, February 2016
SUMMARY OF EXISTING HOME TRANSACTIONS SEMI-DETACHED HOUSES, FEBRUARY 2016CITY OF TORONTO MUNICIPAL BREAKDOWN
10
Sales Dollar Volume Average Price Median Price New Listings Active Listings Avg. SP / LP Avg. DOMTREB TotalCity of Toronto TotalToronto West
Toronto W01Toronto W02Toronto W03Toronto W04Toronto W05Toronto W06Toronto W07Toronto W08Toronto W09Toronto W10
Toronto CentralToronto C01Toronto C02Toronto C03Toronto C04Toronto C06Toronto C07Toronto C08Toronto C09Toronto C10Toronto C11Toronto C12Toronto C13Toronto C14Toronto C15
Toronto EastToronto E01Toronto E02Toronto E03Toronto E04Toronto E05Toronto E06Toronto E07Toronto E08Toronto E09Toronto E10Toronto E11
725 $462,627,170 $638,106 $565,000 888 452 104% 13239 $202,871,658 $848,835 $735,000 312 189 106% 1668 $42,677,529 $627,611 $599,000 96 78 102% 193 $2,902,000 $967,333 $957,000 10 9 109% 813 $9,895,017 $761,155 $760,000 15 6 107% 816 $9,406,812 $587,926 $600,000 27 22 101% 196 $3,442,900 $573,817 $558,450 4 2 102% 1023 $12,741,800 $553,991 $550,000 29 29 100% 300 - - - 3 4 - -1 $591,000 $591,000 $591,000 1 1 114% 132 $1,370,000 $685,000 $685,000 1 0 102% 72 $1,353,000 $676,500 $676,500 1 0 99% 152 $975,000 $487,500 $487,500 5 5 92% 1877 $89,404,365 $1,161,096 $910,000 102 59 106% 1415 $18,055,193 $1,203,680 $1,330,000 28 20 112% 1517 $28,068,372 $1,651,081 $1,651,000 21 14 105% 107 $6,766,000 $966,571 $885,000 10 6 108% 92 $1,918,000 $959,000 $959,000 5 3 120% 72 $1,467,000 $733,500 $733,500 0 0 98% 515 $3,833,000 $766,600 $741,000 4 1 109% 73 $2,960,000 $986,667 $1,023,000 10 6 101% 92 $5,506,500 $2,753,250 $2,753,250 0 0 95% 578 $8,675,000 $1,084,375 $966,500 9 4 106% 71 $1,100,000 $1,100,000 $1,100,000 1 0 120% 60 - - - 0 0 - -6 $4,350,500 $725,083 $701,000 4 2 104% 180 - - - 0 0 - -9 $6,704,800 $744,978 $735,000 10 3 104% 1694 $70,789,764 $753,083 $728,500 114 52 109% 1631 $26,964,540 $869,824 $798,000 33 15 111% 1714 $12,268,500 $876,321 $851,250 30 19 112% 618 $13,823,123 $767,951 $772,500 23 9 108% 185 $2,650,001 $530,000 $528,000 5 1 102% 92 $1,276,000 $638,000 $638,000 1 0 103% 121 $630,000 $630,000 $630,000 0 0 119% 848 $5,421,300 $677,663 $660,250 8 3 108% 151 $502,000 $502,000 $502,000 2 1 101% 11 $525,000 $525,000 $525,000 2 1 100% 95 $2,588,900 $517,780 $515,000 3 0 105% 78 $4,140,400 $517,550 $472,500 7 3 98% 36
1 1 1 1 2 3 4 5

Toronto Real Estate Board
Market Watch, February 2016
SUMMARY OF EXISTING HOME TRANSACTIONS CONDOMINIUM TOWNHOUSES, FEBRUARY 2016ALL TREB AREAS
11
Sales Dollar Volume Average Price Median Price New Listings Active Listings Avg. SP / LP Avg. DOMTREB TotalHalton Region
BurlingtonHalton HillsMiltonOakville
Peel RegionBramptonCaledonMississauga
City of TorontoToronto WestToronto CentralToronto East
York RegionAuroraE. GwillimburyGeorginaKingMarkhamNewmarketRichmond HillVaughanWhitchurch-Stouffville
Durham RegionAjaxBrockClaringtonOshawaPickeringScugogUxbridgeWhitby
Dufferin CountyOrangeville
Simcoe CountyAdjala-TosorontioBradford WestGwillimburyEssaInnisfilNew Tecumseth
511 $225,032,122 $440,376 $415,000 716 638 101% 2145 $18,700,850 $415,574 $409,000 58 50 101% 2118 $7,975,350 $443,075 $437,700 19 16 101% 234 $1,362,600 $340,650 $354,300 4 1 102% 136 $2,037,000 $339,500 $329,000 10 6 101% 2517 $7,325,900 $430,935 $430,000 25 27 100% 20
169 $68,313,307 $404,221 $399,000 241 184 100% 1744 $15,246,085 $346,502 $335,750 75 52 100% 170 - - - 0 1 - -
125 $53,067,222 $424,538 $418,000 166 131 100% 17179 $90,034,232 $502,985 $452,000 266 286 101% 2452 $20,827,321 $400,525 $380,500 79 86 100% 2968 $43,565,712 $640,672 $557,500 112 133 100% 2059 $25,641,199 $434,597 $437,000 75 67 102% 2460 $30,619,301 $510,322 $499,500 80 67 100% 257 $2,393,000 $341,857 $315,000 8 7 103% 490 - - - 0 0 - -0 - - - 1 1 - -0 - - - 1 1 - -27 $14,450,501 $535,204 $545,000 29 24 101% 214 $1,596,000 $399,000 $373,500 8 3 101% 1310 $4,975,000 $497,500 $474,000 17 16 99% 1412 $7,204,800 $600,400 $600,000 16 15 100% 350 - - - 0 0 - -52 $15,833,432 $304,489 $317,500 66 46 102% 189 $3,228,000 $358,667 $367,000 11 5 102% 190 - - - 2 6 - -4 $978,000 $244,500 $217,750 6 3 101% 1319 $4,713,855 $248,098 $230,000 21 10 103% 1311 $3,758,800 $341,709 $330,000 11 10 101% 200 - - - 0 1 - -2 $841,000 $420,500 $420,500 4 3 98% 247 $2,313,777 $330,540 $338,000 11 8 100% 305 $1,294,000 $258,800 $260,000 3 2 100% 175 $1,294,000 $258,800 $260,000 3 2 100% 171 $237,000 $237,000 $237,000 2 3 98% 240 - - - 0 0 - -0 - - - 1 1 - -0 - - - 0 0 - -0 - - - 0 0 - -1 $237,000 $237,000 $237,000 1 2 98% 24
1 1 1 1 2 3 4 5

Toronto Real Estate Board
Market Watch, February 2016
SUMMARY OF EXISTING HOME TRANSACTIONS CONDOMINIUM TOWNHOUSES, FEBRUARY 2016CITY OF TORONTO MUNICIPAL BREAKDOWN
12
Sales Dollar Volume Average Price Median Price New Listings Active Listings Avg. SP / LP Avg. DOMTREB TotalCity of Toronto TotalToronto West
Toronto W01Toronto W02Toronto W03Toronto W04Toronto W05Toronto W06Toronto W07Toronto W08Toronto W09Toronto W10
Toronto CentralToronto C01Toronto C02Toronto C03Toronto C04Toronto C06Toronto C07Toronto C08Toronto C09Toronto C10Toronto C11Toronto C12Toronto C13Toronto C14Toronto C15
Toronto EastToronto E01Toronto E02Toronto E03Toronto E04Toronto E05Toronto E06Toronto E07Toronto E08Toronto E09Toronto E10Toronto E11
511 $225,032,122 $440,376 $415,000 716 638 101% 21179 $90,034,232 $502,985 $452,000 266 286 101% 2452 $20,827,321 $400,525 $380,500 79 86 100% 296 $3,101,922 $516,987 $513,011 10 8 101% 115 $2,751,500 $550,300 $549,000 7 3 100% 172 $876,000 $438,000 $438,000 1 0 101% 102 $685,000 $342,500 $342,500 7 8 98% 921 $6,893,400 $328,257 $330,000 31 31 99% 403 $1,756,900 $585,633 $579,900 7 16 99% 720 - - - 0 0 - -5 $2,363,199 $472,640 $480,000 8 5 107% 81 $497,000 $497,000 $497,000 1 0 98% 67 $1,902,400 $271,771 $274,000 7 15 99% 2868 $43,565,712 $640,672 $557,500 112 133 100% 2021 $14,220,000 $677,143 $593,500 24 27 100% 233 $2,444,000 $814,667 $805,000 5 5 104% 111 $1,075,000 $1,075,000 $1,075,000 3 2 98% 100 - - - 3 3 - -1 $445,000 $445,000 $445,000 2 2 97% 307 $3,915,513 $559,359 $429,000 9 19 99% 264 $2,954,000 $738,500 $790,000 9 7 101% 121 $1,850,000 $1,850,000 $1,850,000 3 2 95% 122 $1,322,999 $661,500 $661,500 3 5 99% 192 $714,000 $357,000 $357,000 5 5 99% 176 $4,564,000 $760,667 $769,600 10 22 99% 272 $855,500 $427,750 $427,750 3 2 117% 47 $3,635,300 $519,329 $494,000 13 13 103% 1211 $5,570,400 $506,400 $508,000 20 19 102% 2559 $25,641,199 $434,597 $437,000 75 67 102% 242 $985,000 $492,500 $492,500 7 8 97% 147 $4,287,800 $612,543 $580,000 7 8 100% 680 - - - 2 2 - -9 $3,816,000 $424,000 $437,000 10 6 102% 1313 $6,017,500 $462,885 $452,000 10 10 101% 290 - - - 0 1 - -5 $2,258,000 $451,600 $450,000 6 4 104% 65 $1,835,999 $367,200 $415,000 3 2 103% 365 $1,563,400 $312,680 $334,400 5 3 102% 158 $2,817,000 $352,125 $347,500 13 10 106% 105 $2,060,500 $412,100 $450,000 12 13 103% 12
1 1 1 1 2 3 4 5

Toronto Real Estate Board
Market Watch, February 2016
SUMMARY OF EXISTING HOME TRANSACTIONS CONDOMINIUM APARTMENT, FEBRUARY 2016ALL TREB AREAS
13
Sales Dollar Volume Average Price Median Price New Listings Active Listings Avg. SP / LP Avg. DOMTREB TotalHalton Region
BurlingtonHalton HillsMiltonOakville
Peel RegionBramptonCaledonMississauga
City of TorontoToronto WestToronto CentralToronto East
York RegionAuroraE. GwillimburyGeorginaKingMarkhamNewmarketRichmond HillVaughanWhitchurch-Stouffville
Durham RegionAjaxBrockClaringtonOshawaPickeringScugogUxbridgeWhitby
Dufferin CountyOrangeville
Simcoe CountyAdjala-TosorontioBradford WestGwillimburyEssaInnisfilNew Tecumseth
2,046 $825,339,347 $403,392 $348,500 3,575 4,948 98% 3258 $20,390,150 $351,554 $312,500 116 192 98% 3717 $6,279,400 $369,376 $345,000 39 55 97% 413 $787,900 $262,633 $250,900 2 5 98% 169 $2,900,750 $322,306 $310,000 13 21 99% 2429 $10,422,100 $359,383 $310,000 62 111 98% 40
291 $82,969,798 $285,120 $270,000 508 624 98% 3253 $12,914,100 $243,662 $240,000 75 93 97% 280 - - - 1 1 - -
238 $70,055,698 $294,352 $276,000 432 530 98% 321,439 $626,798,406 $435,579 $377,500 2,461 3,432 98% 32278 $98,534,540 $354,441 $322,950 483 710 98% 34954 $466,046,123 $488,518 $412,250 1,709 2,372 98% 31207 $62,217,743 $300,569 $275,000 269 350 98% 31219 $84,698,093 $386,749 $354,000 429 626 98% 378 $2,864,888 $358,111 $351,000 18 23 98% 410 - - - 0 0 - -2 $535,500 $267,750 $267,750 0 0 98% 454 $1,620,500 $405,125 $407,750 9 11 98% 11982 $33,734,612 $411,398 $362,500 168 247 98% 356 $2,065,400 $344,233 $348,950 9 6 102% 1355 $18,507,187 $336,494 $316,800 94 150 98% 3462 $25,370,006 $409,194 $386,000 130 182 98% 380 - - - 1 7 - -32 $8,603,900 $268,872 $245,000 54 57 99% 275 $1,337,800 $267,560 $254,500 10 11 101% 160 - - - 0 0 - -4 $866,000 $216,500 $215,750 11 12 99% 566 $1,436,500 $239,417 $212,500 8 5 99% 209 $2,687,600 $298,622 $268,000 15 20 97% 320 - - - 0 0 - -3 $942,000 $314,000 $342,000 1 1 99% 385 $1,334,000 $266,800 $290,000 9 8 100% 92 $591,000 $295,500 $295,500 4 2 100% 92 $591,000 $295,500 $295,500 4 2 100% 95 $1,288,000 $257,600 $219,000 3 15 95% 850 - - - 0 0 - -0 - - - 1 2 - -0 - - - 0 0 - -0 - - - 0 1 - -5 $1,288,000 $257,600 $219,000 2 12 95% 85
1 1 1 1 2 3 4 5

Toronto Real Estate Board
Market Watch, February 2016
SUMMARY OF EXISTING HOME TRANSACTIONS CONDOMINIUM APARTMENT, FEBRUARY 2016CITY OF TORONTO MUNICIPAL BREAKDOWN
14
Sales Dollar Volume Average Price Median Price New Listings Active Listings Avg. SP / LP Avg. DOMTREB TotalCity of Toronto TotalToronto West
Toronto W01Toronto W02Toronto W03Toronto W04Toronto W05Toronto W06Toronto W07Toronto W08Toronto W09Toronto W10
Toronto CentralToronto C01Toronto C02Toronto C03Toronto C04Toronto C06Toronto C07Toronto C08Toronto C09Toronto C10Toronto C11Toronto C12Toronto C13Toronto C14Toronto C15
Toronto EastToronto E01Toronto E02Toronto E03Toronto E04Toronto E05Toronto E06Toronto E07Toronto E08Toronto E09Toronto E10Toronto E11
2,046 $825,339,347 $403,392 $348,500 3,575 4,948 98% 321,439 $626,798,406 $435,579 $377,500 2,461 3,432 98% 32278 $98,534,540 $354,441 $322,950 483 710 98% 3431 $14,182,990 $457,516 $416,000 28 45 99% 3923 $12,202,807 $530,557 $505,000 24 30 100% 196 $1,679,800 $279,967 $280,450 9 7 99% 1416 $4,235,350 $264,709 $250,000 30 40 98% 4022 $4,925,000 $223,864 $216,000 50 95 98% 3864 $25,705,800 $401,653 $355,000 134 222 98% 423 $1,226,000 $408,667 $367,500 9 14 97% 2170 $26,006,693 $371,524 $346,750 132 167 98% 2712 $2,043,500 $170,292 $165,500 17 31 95% 4531 $6,326,600 $204,084 $215,000 50 59 97% 31
954 $466,046,123 $488,518 $412,250 1,709 2,372 98% 31389 $184,816,129 $475,106 $427,000 757 1,032 99% 2935 $38,222,200 $1,092,063 $782,500 83 140 97% 336 $3,749,900 $624,983 $642,500 24 52 104% 3717 $9,783,700 $575,512 $340,000 21 25 99% 3117 $6,054,000 $356,118 $319,000 21 31 98% 4865 $26,866,264 $413,327 $390,000 121 152 98% 34
133 $61,084,166 $459,279 $423,400 191 274 99% 3316 $17,263,600 $1,078,975 $767,000 25 25 97% 3633 $17,153,418 $519,801 $470,000 55 62 99% 2019 $5,347,688 $281,457 $265,000 30 38 98% 3414 $11,499,900 $821,421 $577,500 27 33 98% 3525 $9,679,900 $387,196 $353,000 41 56 99% 27
114 $48,108,770 $422,007 $402,500 180 252 98% 3271 $26,416,488 $372,063 $341,000 133 200 98% 35
207 $62,217,743 $300,569 $275,000 269 350 98% 3119 $10,203,700 $537,037 $520,000 16 18 99% 2513 $5,763,990 $443,384 $433,000 16 24 100% 4010 $2,498,500 $249,850 $209,750 14 13 97% 2220 $4,434,500 $221,725 $212,000 38 50 95% 4028 $8,700,288 $310,725 $305,950 40 52 98% 285 $1,699,900 $339,980 $300,000 3 6 100% 3635 $9,436,890 $269,625 $275,000 51 71 98% 3619 $4,078,388 $214,652 $202,000 15 20 99% 2043 $12,594,287 $292,890 $279,800 58 68 98% 313 $329,000 $109,667 $54,000 5 9 103% 1912 $2,478,300 $206,525 $197,450 13 19 98% 32
1 1 1 1 2 3 4 5

Toronto Real Estate Board
Market Watch, February 2016
SUMMARY OF EXISTING HOME TRANSACTIONS LINK, FEBRUARY 2016ALL TREB AREAS
15
Sales Dollar Volume Average Price Median Price New Listings Active Listings Avg. SP / LP Avg. DOMTREB TotalHalton Region
BurlingtonHalton HillsMiltonOakville
Peel RegionBramptonCaledonMississauga
City of TorontoToronto WestToronto CentralToronto East
York RegionAuroraE. GwillimburyGeorginaKingMarkhamNewmarketRichmond HillVaughanWhitchurch-Stouffville
Durham RegionAjaxBrockClaringtonOshawaPickeringScugogUxbridgeWhitby
Dufferin CountyOrangeville
Simcoe CountyAdjala-TosorontioBradford WestGwillimburyEssaInnisfilNew Tecumseth
103 $63,401,575 $615,549 $610,000 143 68 106% 94 $2,317,900 $579,475 $563,500 8 4 101% 41 $499,900 $499,900 $499,900 3 2 100% 60 - - - 0 0 - -1 $507,000 $507,000 $507,000 3 2 102% 02 $1,311,000 $655,500 $655,500 2 0 102% 617 $9,294,000 $546,706 $537,500 21 6 102% 117 $3,322,500 $474,643 $475,000 8 3 101% 91 $537,500 $537,500 $537,500 2 0 98% 19 $5,434,000 $603,778 $610,000 11 3 103% 137 $4,798,088 $685,441 $720,000 17 12 102% 71 $498,900 $498,900 $498,900 2 1 98% 21 $726,000 $726,000 $726,000 2 1 104% 75 $3,573,188 $714,638 $720,000 13 10 102% 842 $33,227,888 $791,140 $811,000 47 20 109% 104 $2,666,900 $666,725 $648,450 2 0 110% 60 - - - 0 0 - -0 - - - 1 1 - -0 - - - 0 0 - -29 $23,132,988 $797,689 $818,000 35 17 108% 100 - - - 0 0 - -4 $3,152,000 $788,000 $778,000 4 2 108% 155 $4,276,000 $855,200 $831,000 5 0 110% 40 - - - 0 0 - -26 $10,895,199 $419,046 $423,050 45 24 106% 61 $400,000 $400,000 $400,000 2 1 100% 90 - - - 0 0 - -14 $5,588,899 $399,207 $391,900 20 10 107% 62 $765,000 $382,500 $382,500 6 5 101% 34 $1,825,500 $456,375 $470,250 3 0 106% 61 $435,900 $435,900 $435,900 2 1 101% 90 - - - 0 0 - -4 $1,879,900 $469,975 $462,500 12 7 107% 60 - - - 0 0 - -0 - - - 0 0 - -7 $2,868,500 $409,786 $396,000 5 2 102% 150 - - - 0 0 - -4 $1,788,500 $447,125 $448,750 2 0 104% 101 $380,000 $380,000 $380,000 1 1 99% 481 $365,000 $365,000 $365,000 1 1 97% 101 $335,000 $335,000 $335,000 1 0 99% 5
1 1 1 1 2 3 4 5

Toronto Real Estate Board
Market Watch, February 2016
SUMMARY OF EXISTING HOME TRANSACTIONS LINK, FEBRUARY 2016CITY OF TORONTO MUNICIPAL BREAKDOWN
16
Sales Dollar Volume Average Price Median Price New Listings Active Listings Avg. SP / LP Avg. DOMTREB TotalCity of Toronto TotalToronto West
Toronto W01Toronto W02Toronto W03Toronto W04Toronto W05Toronto W06Toronto W07Toronto W08Toronto W09Toronto W10
Toronto CentralToronto C01Toronto C02Toronto C03Toronto C04Toronto C06Toronto C07Toronto C08Toronto C09Toronto C10Toronto C11Toronto C12Toronto C13Toronto C14Toronto C15
Toronto EastToronto E01Toronto E02Toronto E03Toronto E04Toronto E05Toronto E06Toronto E07Toronto E08Toronto E09Toronto E10Toronto E11
103 $63,401,575 $615,549 $610,000 143 68 106% 97 $4,798,088 $685,441 $720,000 17 12 102% 71 $498,900 $498,900 $498,900 2 1 98% 20 - - - 0 0 - -0 - - - 0 0 - -0 - - - 0 0 - -0 - - - 0 0 - -0 - - - 0 0 - -0 - - - 0 0 - -0 - - - 0 0 - -0 - - - 0 0 - -0 - - - 0 0 - -1 $498,900 $498,900 $498,900 2 1 98% 21 $726,000 $726,000 $726,000 2 1 104% 70 - - - 0 0 - -0 - - - 0 0 - -0 - - - 0 0 - -0 - - - 0 0 - -0 - - - 0 0 - -1 $726,000 $726,000 $726,000 1 0 104% 70 - - - 0 0 - -0 - - - 0 0 - -0 - - - 0 0 - -0 - - - 0 0 - -0 - - - 0 0 - -0 - - - 0 0 - -0 - - - 0 0 - -0 - - - 1 1 - -5 $3,573,188 $714,638 $720,000 13 10 102% 80 - - - 0 0 - -0 - - - 0 0 - -0 - - - 0 0 - -0 - - - 0 0 - -3 $2,293,300 $764,433 $728,300 3 2 101% 90 - - - 0 0 - -1 $681,888 $681,888 $681,888 6 4 114% 80 - - - 1 2 - -0 - - - 0 0 - -0 - - - 0 0 - -1 $598,000 $598,000 $598,000 3 2 95% 2
1 1 1 1 2 3 4 5

Toronto Real Estate Board
Market Watch, February 2016
SUMMARY OF EXISTING HOME TRANSACTIONS ATTACHED/ROW/TOWNHOUSE, FEBRUARY 2016ALL TREB AREAS
17
Sales Dollar Volume Average Price Median Price New Listings Active Listings Avg. SP / LP Avg. DOMTREB TotalHalton Region
BurlingtonHalton HillsMiltonOakville
Peel RegionBramptonCaledonMississauga
City of TorontoToronto WestToronto CentralToronto East
York RegionAuroraE. GwillimburyGeorginaKingMarkhamNewmarketRichmond HillVaughanWhitchurch-Stouffville
Durham RegionAjaxBrockClaringtonOshawaPickeringScugogUxbridgeWhitby
Dufferin CountyOrangeville
Simcoe CountyAdjala-TosorontioBradford WestGwillimburyEssaInnisfilNew Tecumseth
591 $340,005,938 $575,306 $525,500 758 385 103% 10110 $59,897,578 $544,523 $499,900 142 65 101% 108 $3,861,675 $482,709 $476,888 20 15 102% 1810 $4,219,353 $421,935 $447,161 8 1 103% 659 $28,110,850 $476,455 $485,000 70 19 101% 933 $23,705,700 $718,355 $680,000 44 30 99% 13
114 $55,940,062 $490,702 $483,500 150 77 102% 974 $33,543,124 $453,285 $459,000 102 58 102% 912 $5,921,150 $493,429 $503,500 16 6 101% 728 $16,475,788 $588,421 $579,950 32 13 102% 974 $56,368,400 $761,735 $720,750 108 72 103% 1119 $13,098,200 $689,379 $706,500 27 16 99% 1524 $22,944,900 $956,038 $893,750 39 32 103% 1231 $20,325,300 $655,655 $660,000 42 24 106% 9
174 $119,281,058 $685,523 $691,000 222 118 104% 910 $6,179,787 $617,979 $619,000 16 7 104% 44 $1,719,900 $429,975 $425,000 6 4 101% 33 $1,299,500 $433,167 $435,000 4 8 101% 51 $645,990 $645,990 $645,990 3 2 94% 7046 $32,893,394 $715,074 $715,000 51 25 106% 119 $5,269,888 $585,543 $600,000 9 3 105% 845 $33,231,871 $738,486 $720,000 64 37 103% 950 $34,694,460 $693,889 $695,150 63 31 104% 96 $3,346,268 $557,711 $561,900 6 1 102% 994 $39,481,649 $420,018 $425,000 106 40 104% 820 $9,001,498 $450,075 $450,000 23 9 103% 90 - - - 0 0 - -16 $5,484,350 $342,772 $345,000 22 10 105% 511 $4,264,801 $387,709 $400,000 12 3 104% 1016 $7,536,900 $471,056 $476,000 18 9 104% 120 - - - 0 0 - -1 $324,800 $324,800 $324,800 2 1 102% 630 $12,869,300 $428,977 $431,500 29 8 105% 78 $2,753,000 $344,125 $351,750 7 1 101% 68 $2,753,000 $344,125 $351,750 7 1 101% 617 $6,284,191 $369,658 $354,000 23 12 100% 190 - - - 0 0 - -5 $2,320,900 $464,180 $475,000 7 3 100% 123 $859,400 $286,467 $287,000 4 2 100% 145 $1,686,000 $337,200 $333,000 3 1 98% 134 $1,417,891 $354,473 $357,000 9 6 100% 38
1 1 1 1 2 3 4 5

Toronto Real Estate Board
Market Watch, February 2016
SUMMARY OF EXISTING HOME TRANSACTIONS ATTACHED/ROW/TOWNHOUSE, FEBRUARY 2016CITY OF TORONTO MUNICIPAL BREAKDOWN
18
Sales Dollar Volume Average Price Median Price New Listings Active Listings Avg. SP / LP Avg. DOMTREB TotalCity of Toronto TotalToronto West
Toronto W01Toronto W02Toronto W03Toronto W04Toronto W05Toronto W06Toronto W07Toronto W08Toronto W09Toronto W10
Toronto CentralToronto C01Toronto C02Toronto C03Toronto C04Toronto C06Toronto C07Toronto C08Toronto C09Toronto C10Toronto C11Toronto C12Toronto C13Toronto C14Toronto C15
Toronto EastToronto E01Toronto E02Toronto E03Toronto E04Toronto E05Toronto E06Toronto E07Toronto E08Toronto E09Toronto E10Toronto E11
591 $340,005,938 $575,306 $525,500 758 385 103% 1074 $56,368,400 $761,735 $720,750 108 72 103% 1119 $13,098,200 $689,379 $706,500 27 16 99% 150 - - - 2 2 - -3 $2,308,000 $769,333 $836,000 4 2 101% 291 $370,000 $370,000 $370,000 2 0 93% 13 $1,796,800 $598,933 $514,800 5 2 103% 73 $1,601,900 $533,967 $543,000 4 1 100% 124 $2,835,500 $708,875 $703,750 5 4 98% 191 $835,000 $835,000 $835,000 1 2 98% 234 $3,351,000 $837,750 $775,500 4 3 98% 110 - - - 0 0 - -0 - - - 0 0 - -24 $22,944,900 $956,038 $893,750 39 32 103% 1210 $9,059,900 $905,990 $871,500 15 11 102% 154 $4,289,000 $1,072,250 $1,096,500 6 7 102% 82 $2,515,000 $1,257,500 $1,257,500 1 1 97% 191 $905,000 $905,000 $905,000 1 0 103% 50 - - - 0 0 - -0 - - - 1 1 - -5 $4,389,000 $877,800 $852,500 10 6 109% 90 - - - 0 0 - -0 - - - 2 3 - -0 - - - 0 0 - -0 - - - 0 0 - -1 $581,000 $581,000 $581,000 2 1 99% 81 $1,206,000 $1,206,000 $1,206,000 1 2 110% 70 - - - 0 0 - -31 $20,325,300 $655,655 $660,000 42 24 106% 99 $6,994,500 $777,167 $820,000 13 6 107% 107 $5,036,000 $719,429 $690,000 7 2 110% 41 $680,000 $680,000 $680,000 2 1 101% 03 $1,842,000 $614,000 $596,000 3 2 100% 81 $750,000 $750,000 $750,000 2 1 112% 80 - - - 0 0 - -0 - - - 1 1 - -0 - - - 1 3 - -0 - - - 1 1 - -3 $1,638,800 $546,267 $560,000 3 1 102% 47 $3,384,000 $483,429 $450,000 9 6 103% 17
1 1 1 1 2 3 4 5

Toronto Real Estate Board
Market Watch, February 2016
SUMMARY OF EXISTING HOME TRANSACTIONS CO-OP APARTMENT, FEBRUARY 2016ALL TREB AREAS
19
Sales Dollar Volume Average Price Median Price New Listings Active Listings Avg. SP / LP Average DOMTREB TotalHalton Region
BurlingtonHalton HillsMiltonOakville
Peel RegionBramptonCaledonMississauga
City of TorontoToronto WestToronto CentralToronto East
York RegionAuroraE. GwillimburyGeorginaKingMarkhamNewmarketRichmond HillVaughanWhitchurch-Stouffville
Durham RegionAjaxBrockClaringtonOshawaPickeringScugogUxbridgeWhitby
Dufferin CountyOrangeville
Simcoe CountyAdjala-TosorontioBradford WestGwillimburyEssaInnisfilNew Tecumseth
7 $2,797,500 $399,643 $390,000 13 20 99% 220 - - - 0 0 - -0 - - - 0 0 - -0 - - - 0 0 - -0 - - - 0 0 - -0 - - - 0 0 - -0 - - - 0 0 - -0 - - - 0 0 - -0 - - - 0 0 - -0 - - - 0 0 - -7 $2,797,500 $399,643 $390,000 12 18 99% 223 $702,500 $234,167 $212,500 2 4 96% 384 $2,095,000 $523,750 $455,000 8 12 100% 110 - - - 2 2 - -0 - - - 0 1 - -0 - - - 0 0 - -0 - - - 0 0 - -0 - - - 0 0 - -0 - - - 0 0 - -0 - - - 0 0 - -0 - - - 0 0 - -0 - - - 0 1 - -0 - - - 0 0 - -0 - - - 0 0 - -0 - - - 0 0 - -0 - - - 0 0 - -0 - - - 0 0 - -0 - - - 0 0 - -0 - - - 0 0 - -0 - - - 0 0 - -0 - - - 0 0 - -0 - - - 0 0 - -0 - - - 0 0 - -0 - - - 0 0 - -0 - - - 0 0 - -0 - - - 1 1 - -0 - - - 0 0 - -0 - - - 1 1 - -0 - - - 0 0 - -0 - - - 0 0 - -0 - - - 0 0 - -
1 1 1 1 2 3 4 5

Toronto Real Estate Board
Market Watch, February 2016
SUMMARY OF EXISTING HOME TRANSACTIONS CO-OP APARTMENT, FEBRUARY 2016CITY OF TORONTO MUNICIPAL BREAKDOWN
20
Sales Dollar Volume Average Price Median Price New Listings Active Listings Avg. SP / LP Avg. DOMTREB TotalCity of Toronto TotalToronto West
Toronto W01Toronto W02Toronto W03Toronto W04Toronto W05Toronto W06Toronto W07Toronto W08Toronto W09Toronto W10
Toronto CentralToronto C01Toronto C02Toronto C03Toronto C04Toronto C06Toronto C07Toronto C08Toronto C09Toronto C10Toronto C11Toronto C12Toronto C13Toronto C14Toronto C15
Toronto EastToronto E01Toronto E02Toronto E03Toronto E04Toronto E05Toronto E06Toronto E07Toronto E08Toronto E09Toronto E10Toronto E11
7 $2,797,500 $399,643 $390,000 13 20 99% 227 $2,797,500 $399,643 $390,000 12 18 99% 223 $702,500 $234,167 $212,500 2 4 96% 380 - - - 0 0 - -0 - - - 0 0 - -0 - - - 0 0 - -0 - - - 0 0 - -0 - - - 0 0 - -1 $195,000 $195,000 $195,000 0 1 98% 82 $507,500 $253,750 $253,750 0 0 96% 530 - - - 2 3 - -0 - - - 0 0 - -0 - - - 0 0 - -4 $2,095,000 $523,750 $455,000 8 12 100% 110 - - - 0 1 - -0 - - - 0 1 - -1 $390,000 $390,000 $390,000 4 4 103% 100 - - - 0 0 - -0 - - - 0 0 - -0 - - - 0 0 - -0 - - - 0 0 - -3 $1,705,000 $568,333 $470,000 4 5 99% 110 - - - 0 0 - -0 - - - 0 0 - -0 - - - 0 0 - -0 - - - 0 0 - -0 - - - 0 0 - -0 - - - 0 1 - -0 - - - 2 2 - -0 - - - 0 0 - -0 - - - 0 0 - -0 - - - 0 0 - -0 - - - 0 0 - -0 - - - 0 0 - -0 - - - 0 0 - -0 - - - 0 0 - -0 - - - 0 0 - -0 - - - 0 1 - -0 - - - 2 1 - -0 - - - 0 0 - -
1 1 1 1 2 3 4 5

Toronto Real Estate Board
Market Watch, February 2016
SUMMARY OF EXISTING HOME TRANSACTIONS DETACHED CONDOMINIUM, FEBRUARY 2016ALL TREB AREAS
21
Sales Dollar Volume Average Price Median Price New Listings Active Listings Avg. SP / LP Avg. DOMTREB TotalHalton Region
BurlingtonHalton HillsMiltonOakville
Peel RegionBramptonCaledonMississauga
City of TorontoToronto WestToronto CentralToronto East
York RegionAuroraE. GwillimburyGeorginaKingMarkhamNewmarketRichmond HillVaughanWhitchurch-Stouffville
Durham RegionAjaxBrockClaringtonOshawaPickeringScugogUxbridgeWhitby
Dufferin CountyOrangeville
Simcoe CountyAdjala-TosorontioBradford WestGwillimburyEssaInnisfilNew Tecumseth
3 $1,293,000 $431,000 $465,000 3 6 98% 460 - - - 1 1 - -0 - - - 0 0 - -0 - - - 0 0 - -0 - - - 0 0 - -0 - - - 1 1 - -0 - - - 0 0 - -0 - - - 0 0 - -0 - - - 0 0 - -0 - - - 0 0 - -1 $272,000 $272,000 $272,000 0 0 97% 740 - - - 0 0 - -1 $272,000 $272,000 $272,000 0 0 97% 740 - - - 0 0 - -0 - - - 1 1 - -0 - - - 0 0 - -0 - - - 0 0 - -0 - - - 0 0 - -0 - - - 1 1 - -0 - - - 0 0 - -0 - - - 0 0 - -0 - - - 0 0 - -0 - - - 0 0 - -0 - - - 0 0 - -0 - - - 0 0 - -0 - - - 0 0 - -0 - - - 0 0 - -0 - - - 0 0 - -0 - - - 0 0 - -0 - - - 0 0 - -0 - - - 0 0 - -0 - - - 0 0 - -0 - - - 0 0 - -0 - - - 0 0 - -0 - - - 0 0 - -2 $1,021,000 $510,500 $510,500 1 4 98% 320 - - - 0 0 - -0 - - - 0 0 - -0 - - - 0 0 - -0 - - - 0 0 - -2 $1,021,000 $510,500 $510,500 1 4 98% 32
1 1 1 1 2 3 4 5

Toronto Real Estate Board
Market Watch, February 2016
SUMMARY OF EXISTING HOME TRANSACTIONS DETACHED CONDOMINIUM, FEBRUARY 2016CITY OF TORONTO MUNICIPAL BREAKDOWN
22
Sales Dollar Volume Average Price Median Price New Listings Active Listings Avg. SP / LP Avg. DOMTREB TotalCity of Toronto TotalToronto West
Toronto W01Toronto W02Toronto W03Toronto W04Toronto W05Toronto W06Toronto W07Toronto W08Toronto W09Toronto W10
Toronto CentralToronto C01Toronto C02Toronto C03Toronto C04Toronto C06Toronto C07Toronto C08Toronto C09Toronto C10Toronto C11Toronto C12Toronto C13Toronto C14Toronto C15
Toronto EastToronto E01Toronto E02Toronto E03Toronto E04Toronto E05Toronto E06Toronto E07Toronto E08Toronto E09Toronto E10Toronto E11
3 $1,293,000 $431,000 $465,000 3 6 98% 461 $272,000 $272,000 $272,000 0 0 97% 740 - - - 0 0 - -0 - - - 0 0 - -0 - - - 0 0 - -0 - - - 0 0 - -0 - - - 0 0 - -0 - - - 0 0 - -0 - - - 0 0 - -0 - - - 0 0 - -0 - - - 0 0 - -0 - - - 0 0 - -0 - - - 0 0 - -1 $272,000 $272,000 $272,000 0 0 97% 740 - - - 0 0 - -0 - - - 0 0 - -0 - - - 0 0 - -0 - - - 0 0 - -1 $272,000 $272,000 $272,000 0 0 97% 740 - - - 0 0 - -0 - - - 0 0 - -0 - - - 0 0 - -0 - - - 0 0 - -0 - - - 0 0 - -0 - - - 0 0 - -0 - - - 0 0 - -0 - - - 0 0 - -0 - - - 0 0 - -0 - - - 0 0 - -0 - - - 0 0 - -0 - - - 0 0 - -0 - - - 0 0 - -0 - - - 0 0 - -0 - - - 0 0 - -0 - - - 0 0 - -0 - - - 0 0 - -0 - - - 0 0 - -0 - - - 0 0 - -0 - - - 0 0 - -0 - - - 0 0 - -
1 1 1 1 2 3 4 5
Toronto Real Estate Board
Market Watch, February 2016
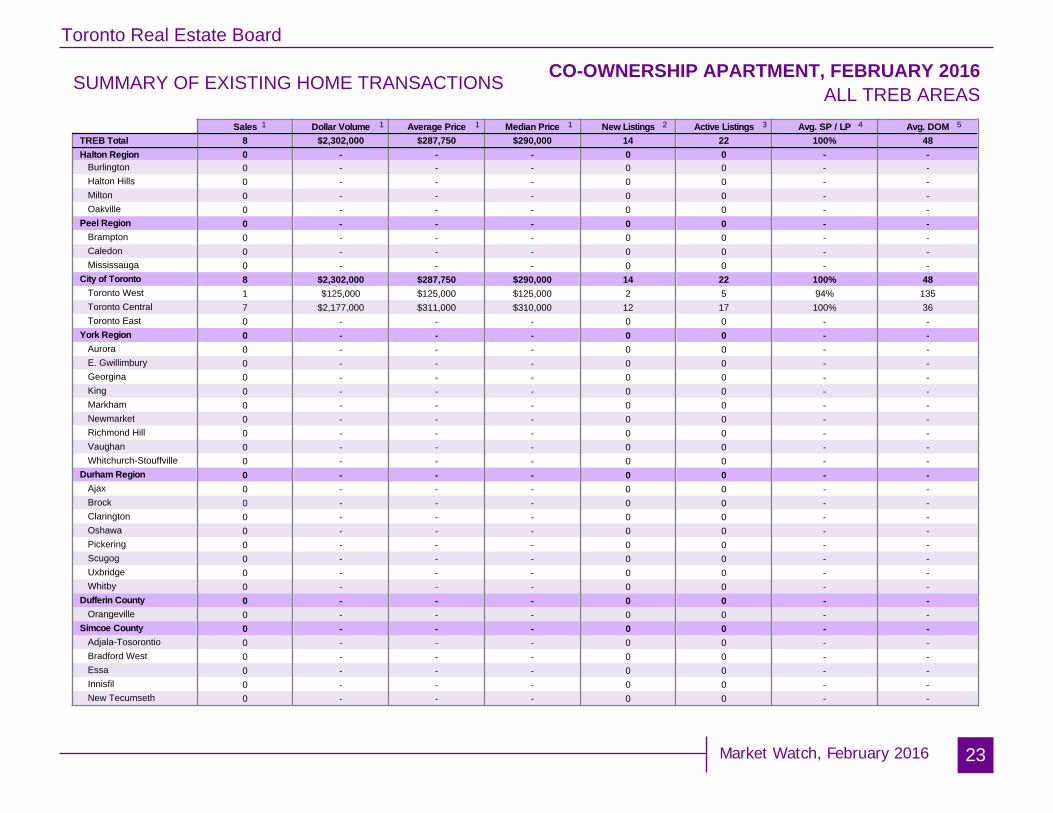
SUMMARY OF EXISTING HOME TRANSACTIONS CO-OWNERSHIP APARTMENT, FEBRUARY 2016ALL TREB AREAS
23
Sales Dollar Volume Average Price Median Price New Listings Active Listings Avg. SP / LP Avg. DOMTREB TotalHalton Region
BurlingtonHalton HillsMiltonOakville
Peel RegionBramptonCaledonMississauga
City of TorontoToronto WestToronto CentralToronto East
York RegionAuroraE. GwillimburyGeorginaKingMarkhamNewmarketRichmond HillVaughanWhitchurch-Stouffville
Durham RegionAjaxBrockClaringtonOshawaPickeringScugogUxbridgeWhitby
Dufferin CountyOrangeville
Simcoe CountyAdjala-TosorontioBradford WestGwillimburyEssaInnisfilNew Tecumseth
8 $2,302,000 $287,750 $290,000 14 22 100% 480 - - - 0 0 - -0 - - - 0 0 - -0 - - - 0 0 - -0 - - - 0 0 - -0 - - - 0 0 - -0 - - - 0 0 - -0 - - - 0 0 - -0 - - - 0 0 - -0 - - - 0 0 - -8 $2,302,000 $287,750 $290,000 14 22 100% 481 $125,000 $125,000 $125,000 2 5 94% 1357 $2,177,000 $311,000 $310,000 12 17 100% 360 - - - 0 0 - -0 - - - 0 0 - -0 - - - 0 0 - -0 - - - 0 0 - -0 - - - 0 0 - -0 - - - 0 0 - -0 - - - 0 0 - -0 - - - 0 0 - -0 - - - 0 0 - -0 - - - 0 0 - -0 - - - 0 0 - -0 - - - 0 0 - -0 - - - 0 0 - -0 - - - 0 0 - -0 - - - 0 0 - -0 - - - 0 0 - -0 - - - 0 0 - -0 - - - 0 0 - -0 - - - 0 0 - -0 - - - 0 0 - -0 - - - 0 0 - -0 - - - 0 0 - -0 - - - 0 0 - -0 - - - 0 0 - -0 - - - 0 0 - -0 - - - 0 0 - -0 - - - 0 0 - -0 - - - 0 0 - -
1 1 1 1 2 3 4 5

Toronto Real Estate Board
Market Watch, February 2016
SUMMARY OF EXISTING HOME TRANSACTIONS CO-OWNERSHIP APARTMENT, FEBRUARY 2016CITY OF TORONTO MUNICIPAL BREAKDOWN
24
Sales Dollar Volume Average Price Median Price New Listings Active Listings Avg. SP / LP Avg. DOMTREB TotalCity of Toronto TotalToronto West
Toronto W01Toronto W02Toronto W03Toronto W04Toronto W05Toronto W06Toronto W07Toronto W08Toronto W09Toronto W10
Toronto CentralToronto C01Toronto C02Toronto C03Toronto C04Toronto C06Toronto C07Toronto C08Toronto C09Toronto C10Toronto C11Toronto C12Toronto C13Toronto C14Toronto C15
Toronto EastToronto E01Toronto E02Toronto E03Toronto E04Toronto E05Toronto E06Toronto E07Toronto E08Toronto E09Toronto E10Toronto E11
8 $2,302,000 $287,750 $290,000 14 22 100% 488 $2,302,000 $287,750 $290,000 14 22 100% 481 $125,000 $125,000 $125,000 2 5 94% 1350 - - - 1 2 - -0 - - - 0 0 - -0 - - - 0 0 - -0 - - - 0 0 - -1 $125,000 $125,000 $125,000 1 2 94% 1350 - - - 0 0 - -0 - - - 0 0 - -0 - - - 0 1 - -0 - - - 0 0 - -0 - - - 0 0 - -7 $2,177,000 $311,000 $310,000 12 17 100% 360 - - - 0 0 - -2 $850,000 $425,000 $425,000 1 0 104% 160 - - - 1 4 - -1 $224,000 $224,000 $224,000 3 5 100% 00 - - - 0 0 - -0 - - - 0 0 - -0 - - - 0 1 - -0 - - - 0 0 - -2 $623,000 $311,500 $311,500 0 1 98% 930 - - - 0 0 - -0 - - - 0 0 - -1 $270,000 $270,000 $270,000 5 5 98% 61 $210,000 $210,000 $210,000 2 1 95% 290 - - - 0 0 - -0 - - - 0 0 - -0 - - - 0 0 - -0 - - - 0 0 - -0 - - - 0 0 - -0 - - - 0 0 - -0 - - - 0 0 - -0 - - - 0 0 - -0 - - - 0 0 - -0 - - - 0 0 - -0 - - - 0 0 - -0 - - - 0 0 - -0 - - - 0 0 - -
1 1 1 1 2 3 4 5

Toronto Real Estate Board
Market Watch, February 2016
FOCUS ON THE MLS HOME PRICE INDEX INDEX AND BENCHMARK PRICE, FEBRUARY 2016ALL TREB AREAS
25
Composite Single-Family Detached Single-Family Attached Townhouse ApartmentIndex Benchmark Yr./Yr. % Chg. Index Benchmark Yr./Yr. % Chg. Index Benchmark Yr./Yr. % Chg. Index Benchmark Yr./Yr. % Chg. Index Benchmark Yr./Yr. % Chg.
TREB TotalHalton RegionBurlingtonHalton HillsMiltonOakvillePeel RegionBramptonCaledonMississaugaCity of TorontoYork RegionAuroraEast GwillimburyGeorginaKingMarkhamNewmarketRichmond HillVaughanWhitchurch-StouffvilleDurham RegionAjaxBrockClaringtonOshawaPickeringScugogUxbridgeWhitbyDufferin CountyOrangevilleSimcoe CountyAdjala-TosorontioBradford WestGwillimburyEssaInnisfilNew Tecumseth
193.0 $589,000 11.30% 198.6 $739,000 12.78% 202.5 $572,500 11.51% 184.4 $403,100 9.70% 166.7 $335,100 6.11%216.9 $709,500 17.62% 211.2 $783,600 16.17% 203.3 $527,600 10.61% 183.3 $361,800 7.07% - - -200.8 $595,000 9.49% 197.5 $695,800 8.76% 196.3 $468,000 5.94% 185.8 $371,000 7.09% - - -180.9 $526,800 8.58% 184.3 $589,600 11.76% 200.1 $492,800 12.80% 167.9 $302,700 3.71% - - -254.5 $702,200 41.00% 245.3 $849,000 42.62% 200.7 $501,100 12.88% 173.7 $318,400 8.09% - - -208.3 $768,200 8.43% 208.0 $862,200 8.79% 209.6 $567,400 8.38% 188.0 $415,100 7.61% - - -182.9 $500,600 10.65% 185.7 $629,300 11.60% 189.7 $483,900 11.85% 184.4 $381,500 8.15% 154.0 $265,300 5.70%180.0 $459,400 12.57% 179.2 $524,200 12.49% 183.3 $431,900 13.15% 170.8 $317,200 9.07% 142.1 $222,400 4.79%166.5 $594,200 10.78% 166.5 $612,600 10.19% 184.6 $456,300 11.68% - - - - - -186.7 $522,400 9.25% 197.2 $736,100 10.91% 197.8 $540,400 10.63% 189.0 $406,000 8.00% 156.2 $274,000 5.83%189.5 $621,400 8.60% 202.5 $878,000 10.53% 207.2 $688,500 9.34% 187.6 $453,400 9.52% 169.0 $349,200 5.89%215.5 $740,000 14.08% 218.7 $859,900 14.80% 220.9 $640,200 13.69% 195.1 $496,100 14.56% 170.1 $368,900 9.81%207.5 $667,900 17.10% 206.9 $768,600 16.63% 213.1 $551,100 16.70% 171.1 $433,400 18.41% 172.7 $357,100 12.95%181.5 $588,200 13.94% 186.3 $614,000 17.10% 191.8 $406,000 11.64% - - - - - -179.9 $373,500 13.36% 190.7 $393,000 14.67% 194.1 $382,600 12.26% - - - - - -188.8 $800,300 8.38% 189.9 $801,400 8.21% 201.6 $472,100 2.65% - - - - - -224.6 $774,600 13.78% 233.5 $959,900 15.02% 229.5 $683,500 13.50% 204.6 $510,100 16.51% 169.6 $390,900 7.68%195.6 $576,800 13.72% 198.0 $666,500 16.40% 202.9 $478,400 13.80% 198.8 $401,400 15.38% 176.6 $297,400 14.38%228.1 $827,100 14.74% 244.4 $1,038,900 15.83% 230.5 $698,900 13.10% 182.1 $509,900 9.76% 162.7 $338,900 8.03%210.4 $760,800 13.55% 202.6 $843,400 13.12% 217.6 $662,200 13.39% 197.6 $537,500 11.76% 177.2 $393,200 13.52%216.5 $816,200 13.23% 215.3 $826,100 13.32% 195.9 $538,100 13.43% - - - - - -178.9 $421,000 13.08% 177.8 $463,500 13.25% 187.7 $376,200 13.62% 164.4 $268,600 13.77% 157.9 $283,900 3.81%189.5 $468,300 14.23% 188.1 $503,700 13.04% 198.6 $427,200 14.53% 177.1 $323,700 22.73% 149.6 $254,000 2.05%145.8 $275,600 12.07% 146.6 $277,700 11.91% - - - - - - - - -177.4 $375,400 14.45% 172.8 $415,200 16.99% 186.3 $355,600 16.07% 162.1 $290,200 -3.97% 156.7 $221,700 3.77%175.6 $336,300 15.53% 175.3 $373,400 16.40% 184.0 $308,200 15.94% 145.1 $194,100 7.72% 154.2 $208,000 4.05%180.8 $488,900 9.98% 180.4 $563,800 8.54% 186.6 $435,000 9.06% 181.9 $326,500 22.74% 165.4 $323,900 4.29%161.8 $422,100 5.68% 166.2 $430,300 5.59% 156.9 $328,400 11.99% - - - - - -171.4 $524,100 16.12% 171.3 $530,500 15.67% 161.8 $397,100 15.90% - - - - - -177.4 $463,700 10.74% 178.8 $513,700 10.85% 182.9 $402,900 10.65% 163.0 $296,000 9.54% 153.7 $299,900 3.85%181.7 $416,500 16.55% 189.5 $431,900 16.69% 176.9 $331,500 15.32% - - - - - -181.7 $416,500 16.55% 189.5 $431,900 16.69% 176.9 $331,500 15.32% - - - - - -174.6 $372,200 15.94% 168.5 $373,400 16.21% 184.5 $354,100 15.67% - - - - - -146.1 $518,500 13.52% 146.1 $518,500 13.52% - - - - - - - - -203.2 $505,000 19.04% 185.4 $567,900 20.62% 207.7 $431,800 19.16% - - - - - -170.8 $400,000 13.87% 166.4 $420,800 13.74% 170.4 $290,400 12.40% - - - - - -166.9 $308,800 15.66% 166.7 $308,900 15.52% 184.1 $286,500 15.86% - - - - - -158.5 $366,100 12.33% 154.0 $396,700 12.33% 166.4 $317,700 12.28% - - - - - -

Toronto Real Estate Board
Market Watch, February 2016
FOCUS ON THE MLS HOME PRICE INDEX INDEX AND BENCHMARK PRICE, FEBRUARY 2016CITY OF TORONTO
26
Composite Single-Family Detached Single-Family Attached Townhouse ApartmentIndex Benchmark Yr./Yr. % Chg. Index Benchmark Yr./Yr. % Chg. Index Benchmark Yr./Yr. % Chg. Index Benchmark Yr./Yr. % Chg. Index Benchmark Yr./Yr. % Chg.
TREB TotalCity of TorontoToronto W01Toronto W02Toronto W03Toronto W04Toronto W05Toronto W06Toronto W07Toronto W08Toronto W09Toronto W10Toronto C01Toronto C02Toronto C03Toronto C04Toronto C06Toronto C07Toronto C08Toronto C09Toronto C10Toronto C11Toronto C12Toronto C13Toronto C14Toronto C15Toronto E01Toronto E02Toronto E03Toronto E04Toronto E05Toronto E06Toronto E07Toronto E08Toronto E09Toronto E10Toronto E11
193.0 $589,000 11.30% 198.6 $739,000 12.78% 202.5 $572,500 11.51% 184.4 $403,100 9.70% 166.7 $335,100 6.11%189.5 $621,400 8.60% 202.5 $878,000 10.53% 207.2 $688,500 9.34% 187.6 $453,400 9.52% 169.0 $349,200 5.89%173.3 $707,100 10.73% 181.9 $937,500 7.57% 196.7 $758,900 11.19% 195.2 $401,900 14.62% 153.2 $357,300 15.02%205.4 $740,300 6.92% 210.9 $865,700 5.61% 242.3 $742,200 9.00% 166.7 $459,600 13.56% 146.9 $595,800 8.33%206.7 $536,000 11.37% 211.8 $576,100 11.77% 214.6 $549,800 10.62% 135.5 $328,500 7.63% 148.8 $283,800 13.76%182.7 $478,500 11.81% 190.6 $601,500 11.01% 192.3 $559,200 12.92% 183.9 $446,700 13.59% 155.9 $229,600 10.65%172.0 $409,200 14.97% 185.5 $618,500 11.28% 172.3 $503,600 11.52% 177.7 $292,300 21.96% 149.4 $196,200 25.65%160.5 $467,900 5.11% 203.2 $645,000 9.90% 169.9 $515,100 9.75% 175.9 $518,200 14.00% 123.2 $307,800 -1.12%178.7 $761,600 7.33% 188.8 $816,000 9.45% 175.7 $720,400 9.06% 127.1 $467,200 -0.94% 108.2 $438,800 -3.57%158.1 $643,200 5.68% 172.4 $901,800 7.21% 174.4 $662,000 7.06% 150.6 $368,200 8.11% 143.7 $289,300 3.60%177.2 $455,800 9.38% 184.9 $691,700 8.64% 170.6 $478,200 4.22% 190.5 $492,400 12.72% 159.8 $204,900 9.75%171.5 $398,100 9.51% 188.5 $554,800 10.88% 180.4 $487,800 11.56% 163.9 $295,300 13.66% 141.3 $215,800 4.43%194.8 $482,700 4.00% 198.0 $698,900 -1.05% 217.9 $758,700 3.32% 186.7 $556,200 2.08% 190.6 $396,800 4.21%197.6 $938,200 5.61% 182.5 $1,446,500 3.93% 211.0 $1,110,300 7.22% 201.0 $939,900 8.83% 189.2 $527,700 3.56%211.9 $1,090,600 8.28% 205.3 $1,237,300 7.77% 220.8 $817,400 10.62% - - - 218.4 $577,000 5.81%194.1 $1,202,600 13.44% 200.8 $1,403,600 13.32% 204.1 $975,800 14.66% 168.8 $630,600 3.94% 157.7 $374,900 11.37%201.0 $801,800 10.56% 215.3 $921,500 13.98% 193.9 $724,200 18.59% - - - 183.7 $406,200 5.03%193.3 $664,000 13.57% 236.8 $1,084,100 18.16% 187.2 $668,900 12.10% 159.1 $467,100 8.53% 160.0 $377,000 8.55%179.4 $462,000 2.75% 157.2 $488,300 -0.95% 191.9 $800,200 1.43% 181.1 $549,300 1.34% 179.9 $396,900 3.45%143.2 $1,063,400 11.88% 130.9 $1,644,400 9.82% 148.1 $1,205,100 8.02% 160.0 $825,900 -3.73% 153.5 $508,500 15.15%205.2 $800,500 10.50% 209.2 $1,283,900 16.16% 205.4 $1,014,500 13.54% 239.5 $549,200 6.07% 202.0 $484,000 7.28%189.1 $677,500 6.96% 185.3 $1,242,600 11.43% 211.0 $935,200 12.83% 117.8 $187,900 0.86% 193.7 $275,600 3.36%177.5 $1,521,200 7.84% 169.6 $1,822,700 7.89% 203.3 $872,600 12.63% 203.7 $689,900 10.35% 188.0 $591,300 5.44%184.8 $681,700 10.53% 203.0 $1,087,700 11.85% 190.6 $611,400 12.32% 182.0 $518,300 5.94% 160.6 $317,800 7.57%188.1 $639,200 6.88% 237.1 $1,286,300 10.59% 205.9 $1,004,400 6.19% 227.1 $767,400 6.82% 164.5 $413,700 4.64%192.4 $643,200 8.39% 237.0 $1,111,100 13.34% 214.3 $697,800 12.20% 199.2 $490,800 6.24% 148.6 $347,300 4.50%232.8 $723,500 9.71% 235.5 $795,500 12.14% 243.2 $766,800 7.71% 210.7 $426,000 2.53% 200.1 $474,600 10.43%212.6 $792,600 12.73% 191.8 $844,700 11.51% 223.6 $747,500 13.16% 208.2 $667,100 5.58% 209.7 $574,600 10.95%210.1 $647,100 15.06% 217.7 $731,500 16.92% 207.2 $674,600 13.78% - - - 158.8 $237,600 11.36%193.1 $484,700 7.16% 200.8 $593,000 7.84% 194.6 $472,100 12.03% 190.7 $412,100 9.10% 182.8 $276,900 1.73%192.7 $515,300 11.07% 213.9 $755,300 8.47% 208.9 $575,300 9.03% 201.0 $437,000 15.25% 159.8 $314,000 9.98%208.5 $588,800 13.38% 210.4 $601,300 14.04% 210.0 $499,600 13.27% 201.7 $498,800 12.74% 192.3 $424,000 8.40%204.0 $503,300 8.51% 234.9 $768,800 11.17% 222.6 $581,900 9.60% 208.9 $452,700 10.01% 169.5 $290,200 4.69%190.0 $466,600 12.29% 202.7 $632,800 12.80% 182.2 $468,100 14.09% 189.1 $386,000 11.56% 160.4 $256,200 6.44%183.1 $442,200 8.22% 203.5 $579,200 9.82% 187.2 $459,400 11.56% 185.7 $342,200 12.27% 159.2 $298,500 5.22%201.3 $569,900 8.05% 202.8 $649,200 8.33% 194.8 $506,700 5.75% 205.1 $359,100 7.78% 146.4 $236,000 1.10%187.8 $414,100 11.59% 204.7 $568,500 8.14% 199.2 $451,600 8.50% 155.9 $306,300 10.25% 167.0 $249,300 26.80%

Toronto Real Estate Board
Market Watch, February 2016
HISTORIC ANNUAL STATISTICS
27
Year Sales Average Price20042005200620072008200920102011201220132014
83,501 $315,23184,145 $335,90783,084 $351,94193,193 $376,23674,552 $379,34787,308 $395,46085,545 $431,27689,096 $465,01485,496 $497,13087,049 $522,95892,782 $566,624
2015 MONTHLY STATISTICS
NOTES1 - Sales, dollar volume, average sale prices and median sale prices are based on firm transactions entered into the TREB MLS® system between thefirst and last day of the month/period being reported.2 - New listings entered into the TREB MLS® system between the first and last day of the month/period being reported.3 - Active listings at the end of the last day of the month/period being reported.4 - Ratio of the average selling price to the average listing price for firm transactions entered into the TREB MLS® system between the first and last dayof the month/period being reported.5 - Average number of days on the market for firm transactions entered into the TREB MLS® system between the first and last day of the month/periodbeing reported.6 - Due to past changes to TREB's service area, caution should be exercised when making historical comparisons.7 - Past monthly and year-to-date figures are revised on a monthly basis.8 - SNLR = Sales-to-New Listings Ratio. Calculated using a 12-month moving average (sales/new listings).9 - Mos. Inv. = Months of Inventory. Calculated using a 12-month moving average (active listings/sales).
2016 MONTHLY STATISTICS
*For historic annual sales and average price data over a longer time frame go to:
JanuaryFebruary
MarchAprilMayJuneJuly
AugustSeptember
OctoberNovemberDecember
Year to Date
4,657 $630,5847,621 $685,278
- -- -- -- -- -- -- -- -- -- -
12,278 $657,931
JanuaryFebruaryMarchAprilMayJuneJuly
AugustSeptember
OctoberNovemberDecemberAnnual
4,318 $552,9256,294 $596,3208,888 $613,87511,255 $636,08911,640 $649,64811,907 $639,3009,813 $608,8757,946 $603,4518,149 $627,8188,760 $630,2137,339 $632,9084,921 $608,644
101,230 $622,116
1,6,7
1,7
1,7
http://www.torontorealestateboard.com/market_news/market_watch/historic_stats/pdf/TREB_historic_statistics.pdf
Copyright® 2016 Toronto Real Estate Board
$664,53312,278