Embed Size (px)
Citation preview

December 2014 Phoenix Market Report
December 2014
Phoenix Real Estate
Market Report
December 2014 Phoenix Market Report
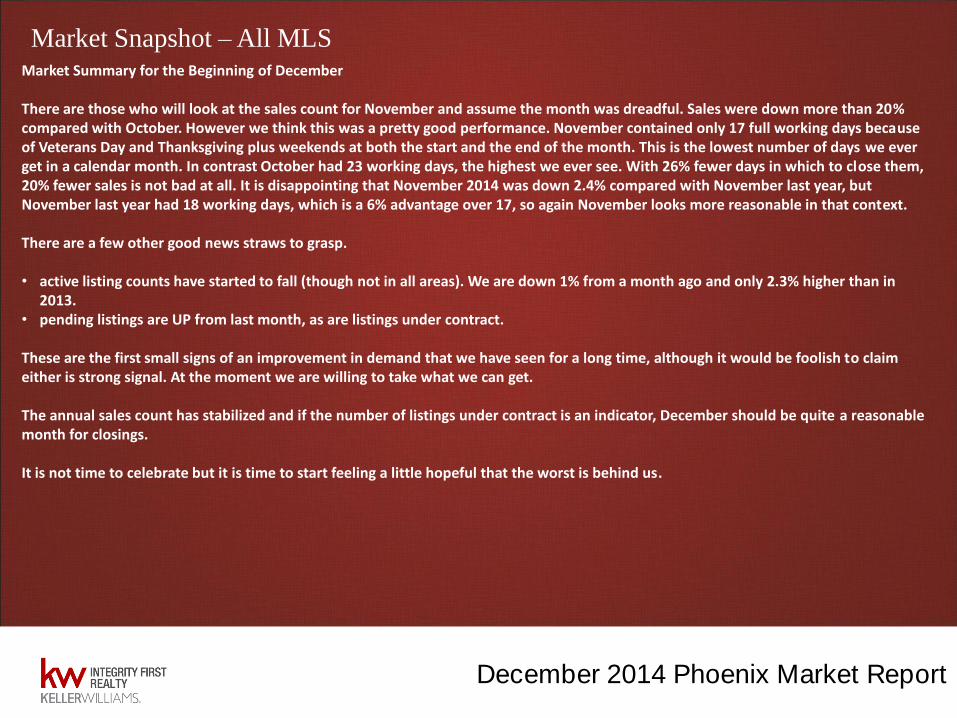
Market Snapshot – All MLS Market Summary for the Beginning of December There are those who will look at the sales count for November and assume the month was dreadful. Sales were down more than 20% compared with October. However we think this was a pretty good performance. November contained only 17 full working days because of Veterans Day and Thanksgiving plus weekends at both the start and the end of the month. This is the lowest number of days we ever get in a calendar month. In contrast October had 23 working days, the highest we ever see. With 26% fewer days in which to close them, 20% fewer sales is not bad at all. It is disappointing that November 2014 was down 2.4% compared with November last year, but November last year had 18 working days, which is a 6% advantage over 17, so again November looks more reasonable in that context. There are a few other good news straws to grasp. • active listing counts have started to fall (though not in all areas). We are down 1% from a month ago and only 2.3% higher than in
2013. • pending listings are UP from last month, as are listings under contract. These are the first small signs of an improvement in demand that we have seen for a long time, although it would be foolish to claim either is strong signal. At the moment we are willing to take what we can get. The annual sales count has stabilized and if the number of listings under contract is an indicator, December should be quite a reasonable month for closings. It is not time to celebrate but it is time to start feeling a little hopeful that the worst is behind us.
December 2014 Phoenix Market Report
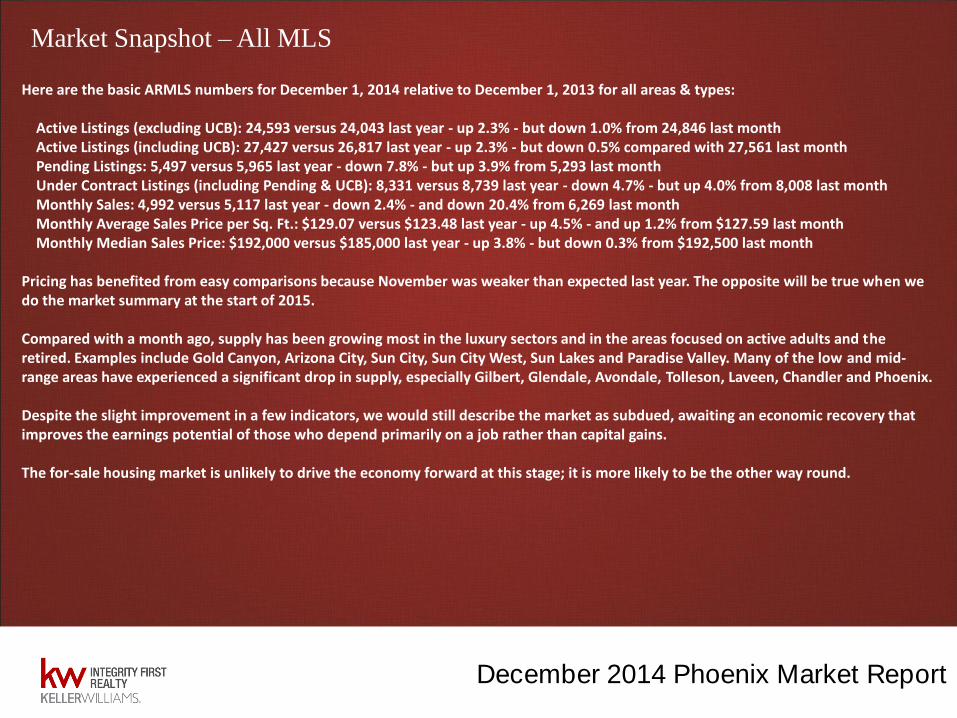
Market Snapshot – All MLS Here are the basic ARMLS numbers for December 1, 2014 relative to December 1, 2013 for all areas & types: Active Listings (excluding UCB): 24,593 versus 24,043 last year - up 2.3% - but down 1.0% from 24,846 last month Active Listings (including UCB): 27,427 versus 26,817 last year - up 2.3% - but down 0.5% compared with 27,561 last month Pending Listings: 5,497 versus 5,965 last year - down 7.8% - but up 3.9% from 5,293 last month Under Contract Listings (including Pending & UCB): 8,331 versus 8,739 last year - down 4.7% - but up 4.0% from 8,008 last month Monthly Sales: 4,992 versus 5,117 last year - down 2.4% - and down 20.4% from 6,269 last month Monthly Average Sales Price per Sq. Ft.: $129.07 versus $123.48 last year - up 4.5% - and up 1.2% from $127.59 last month Monthly Median Sales Price: $192,000 versus $185,000 last year - up 3.8% - but down 0.3% from $192,500 last month Pricing has benefited from easy comparisons because November was weaker than expected last year. The opposite will be true when we do the market summary at the start of 2015. Compared with a month ago, supply has been growing most in the luxury sectors and in the areas focused on active adults and the retired. Examples include Gold Canyon, Arizona City, Sun City, Sun City West, Sun Lakes and Paradise Valley. Many of the low and mid-range areas have experienced a significant drop in supply, especially Gilbert, Glendale, Avondale, Tolleson, Laveen, Chandler and Phoenix. Despite the slight improvement in a few indicators, we would still describe the market as subdued, awaiting an economic recovery that improves the earnings potential of those who depend primarily on a job rather than capital gains. The for-sale housing market is unlikely to drive the economy forward at this stage; it is more likely to be the other way round.

December 2014 Phoenix Market Report
Market Snapshot – All MLS
Cromford Demand Index™ is a value that provides a short term forecast for the demand for resale homes in the market. It is derived from the trends in pending and sold listings compared with historical data over the previous four years. Values above 100 indicate more demand than usual, while values below 100 indicate less demand than usual. A value of 100 indicates the demand is close to normal. Cromford Market Index™ is a value that provides a short term forecast for the balance of the market. It is derived from the trends in pending, active and sold listings compared with historical data over the previous four years. Values below 100 indicate a buyer's market, while values above 100 indicate a seller's market. A value of 100 indicates a balanced market. Cromford Supply Index™ is a value that provides a short term forecast for the supply of resale homes to the market. It is derived from the trends in active listings compared with historical data over the previous four years. Values above 100 indicate more supply than usual, while values below 100 indicate less supply than usual. A value of 100 indicates the supply is close to normal.

December 2014 Phoenix Market Report
Market Snapshot – All MLS

December 2014 Phoenix Market Report
Cromford Index – All MLS

December 2014 Phoenix Market Report
Active Listings – All MLS
December 2014 Phoenix Market Report
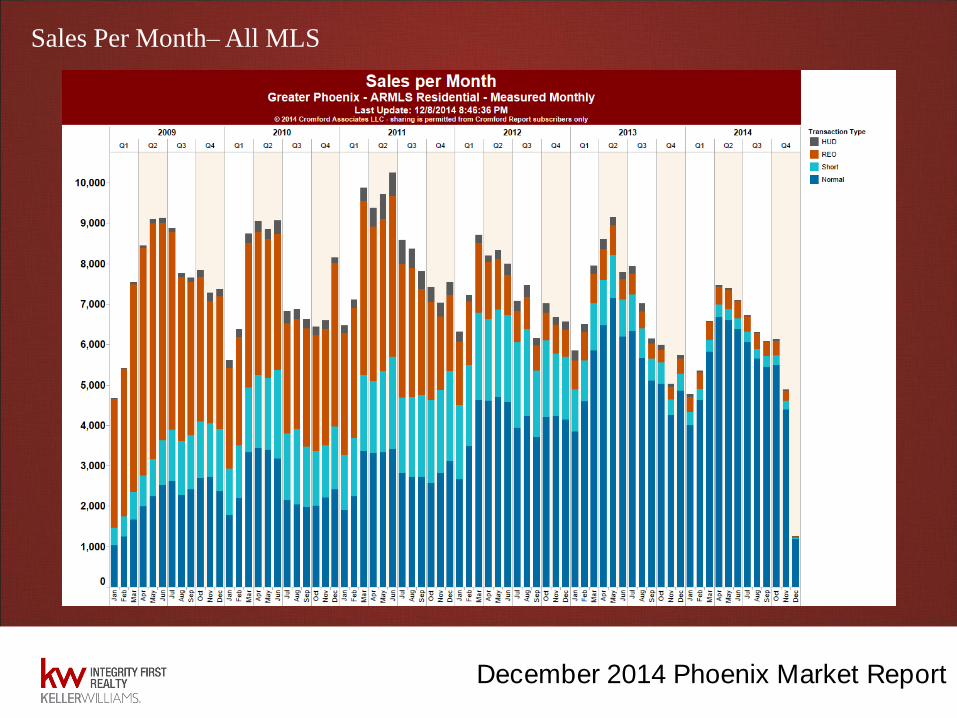
Sales Per Month– All MLS
December 2014 Phoenix Market Report
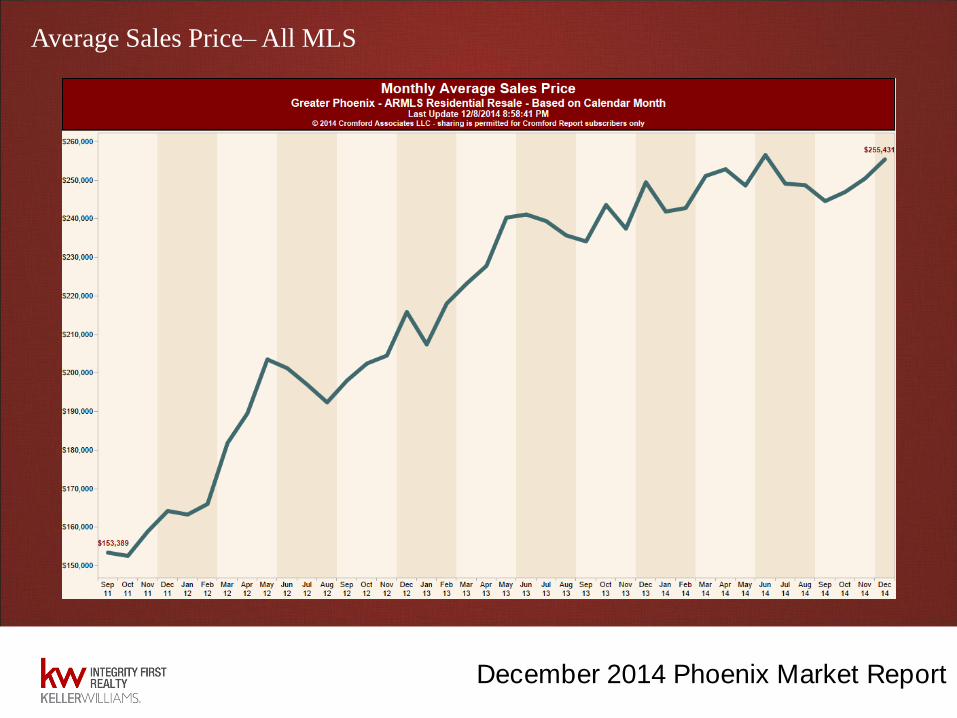
Average Sales Price– All MLS

December 2014 Phoenix Market Report
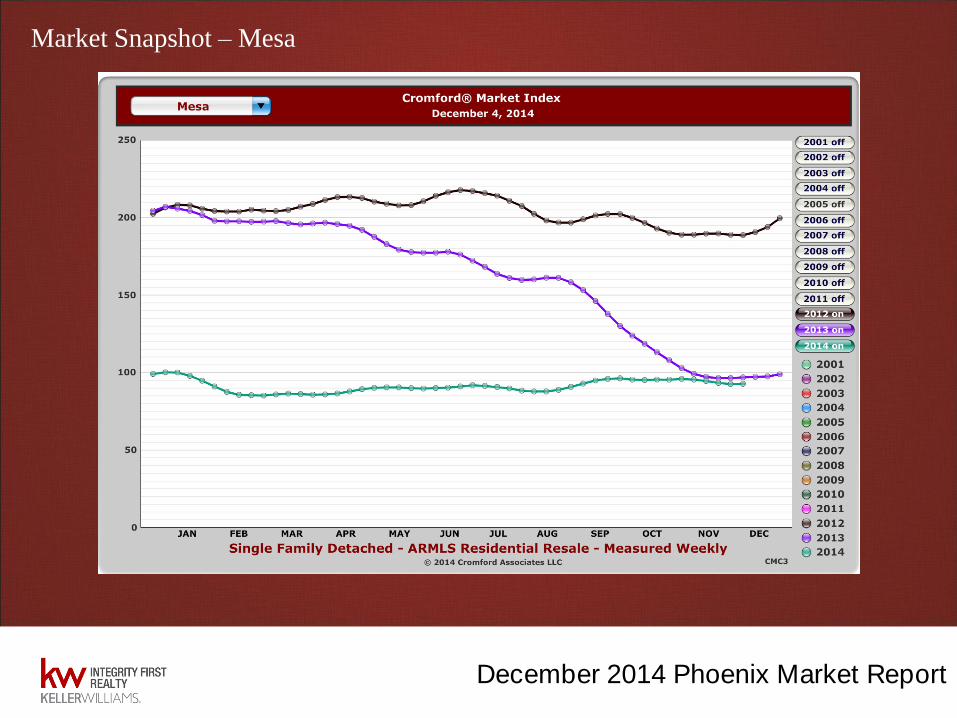
Market Snapshot – Mesa
December 2014 Phoenix Market Report
Market Snapshot – Mesa

December 2014 Phoenix Market Report
Active Listings – Mesa
December 2014 Phoenix Market Report
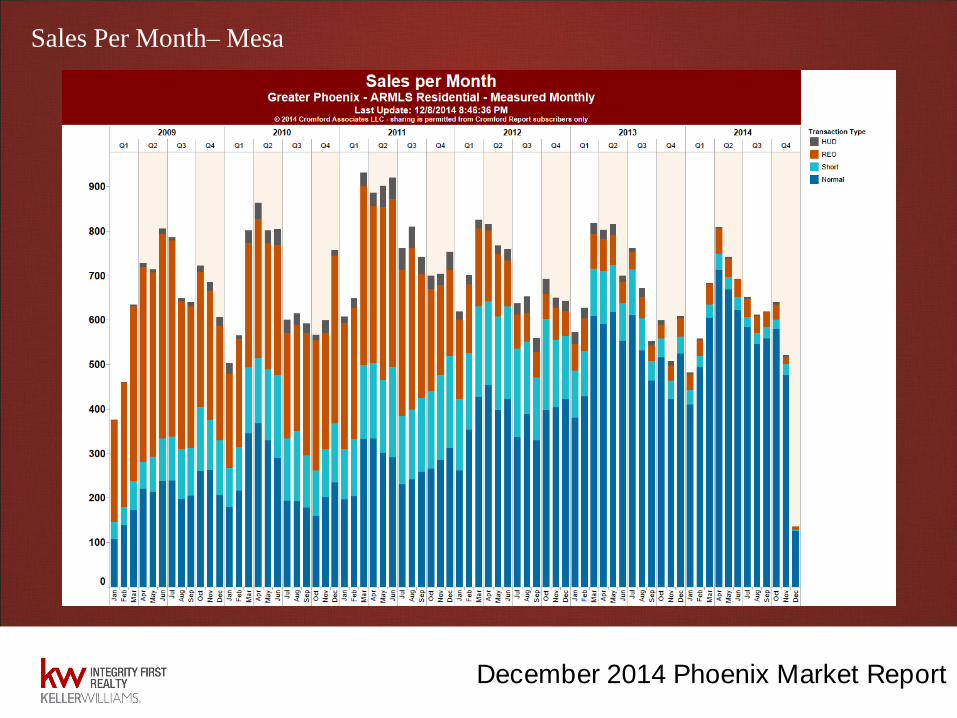
Sales Per Month– Mesa

December 2014 Phoenix Market Report
Average Sales Price– Mesa

December 2014 Phoenix Market Report
Market Snapshot – Gilbert

December 2014 Phoenix Market Report
Market Snapshot – Gilbert

December 2014 Phoenix Market Report
Active Listings – Gilbert

December 2014 Phoenix Market Report
Sales Per Month– Gilbert
December 2014 Phoenix Market Report
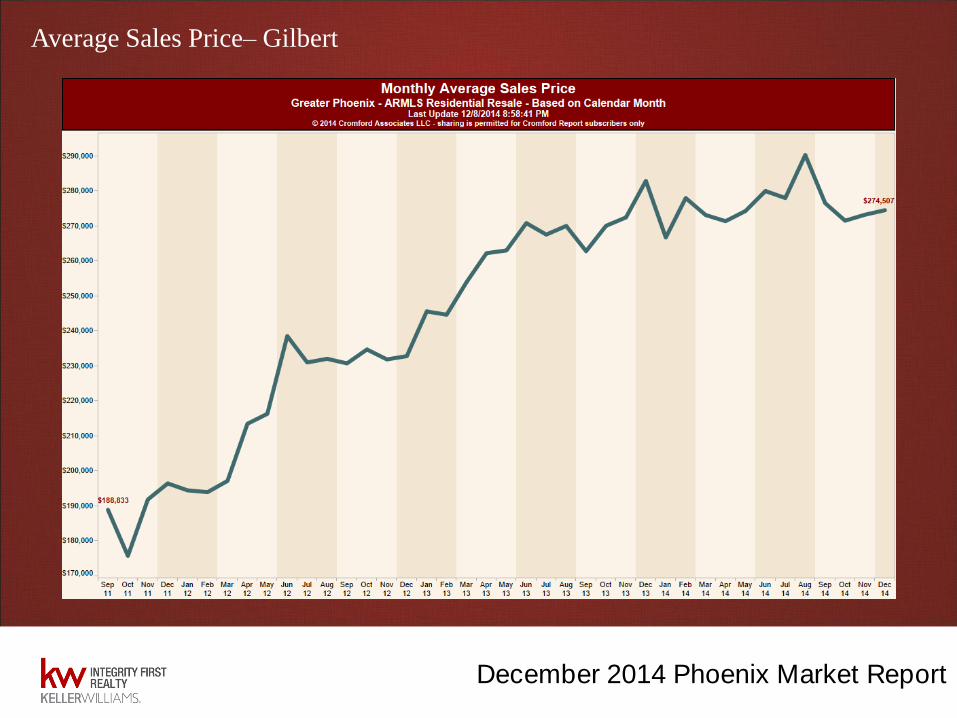
Average Sales Price– Gilbert

December 2014 Phoenix Market Report
Market Snapshot – Chandler

December 2014 Phoenix Market Report
Market Snapshot – Chandler

December 2014 Phoenix Market Report
Active Listings – Chandler

December 2014 Phoenix Market Report
Sales Per Month– Chandler
December 2014 Phoenix Market Report
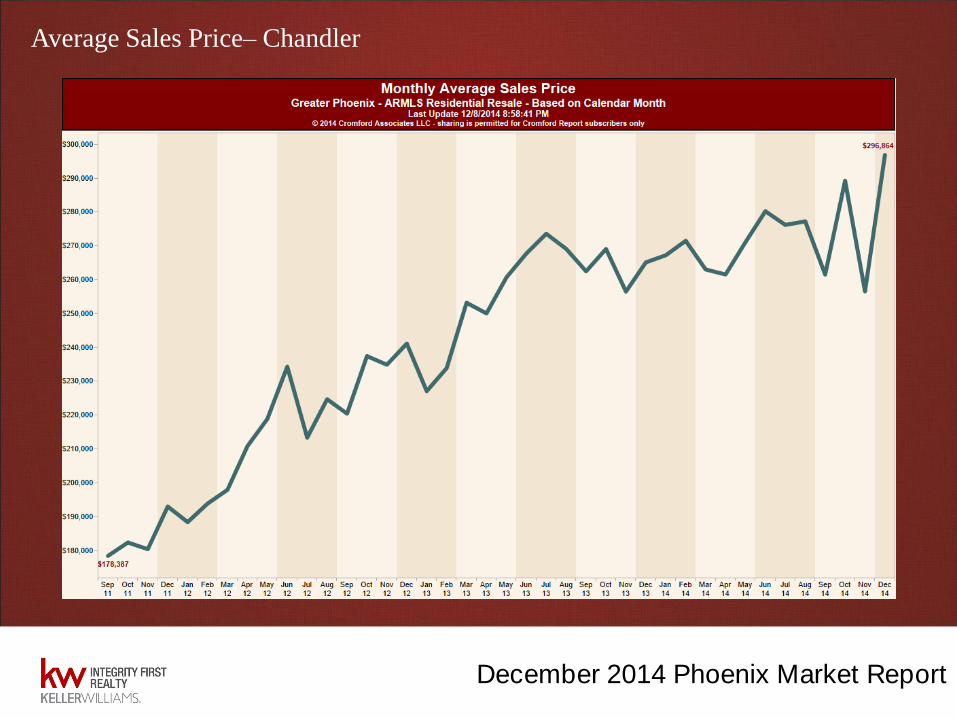
Average Sales Price– Chandler

December 2014 Phoenix Market Report
Market Snapshot – Tempe

December 2014 Phoenix Market Report
Market Snapshot – Tempe

December 2014 Phoenix Market Report
Active Listings – Tempe

December 2014 Phoenix Market Report
Sales Per Month– Tempe
December 2014 Phoenix Market Report
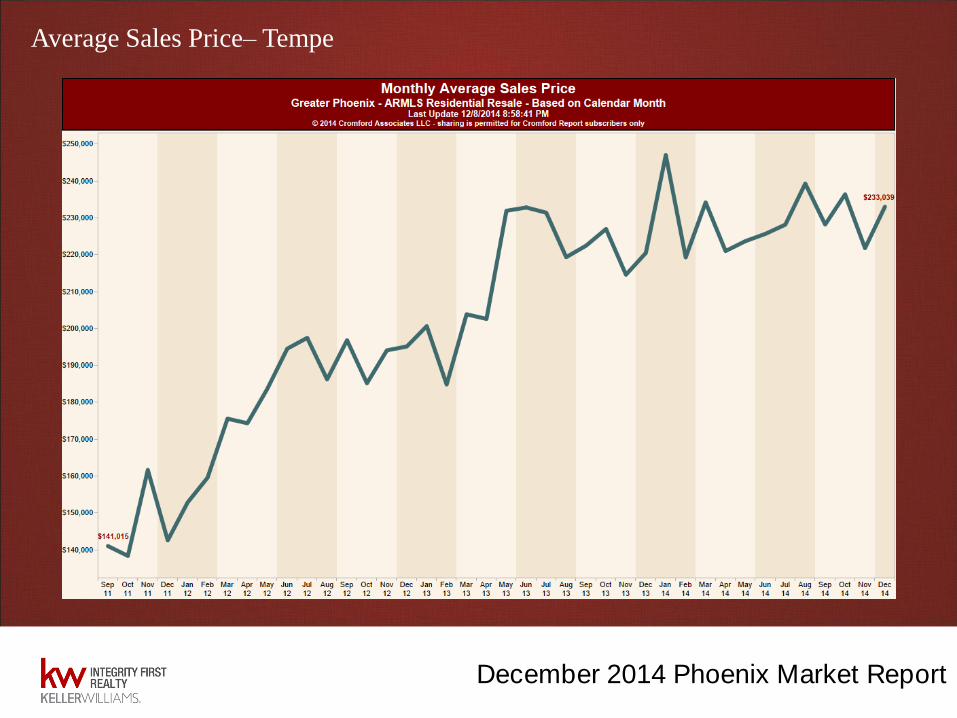
Average Sales Price– Tempe

December 2014 Phoenix Market Report
Market Snapshot – Queen Creek

December 2014 Phoenix Market Report
Market Snapshot – Queen Creek

December 2014 Phoenix Market Report
Active Listings – Queen Creek
December 2014 Phoenix Market Report
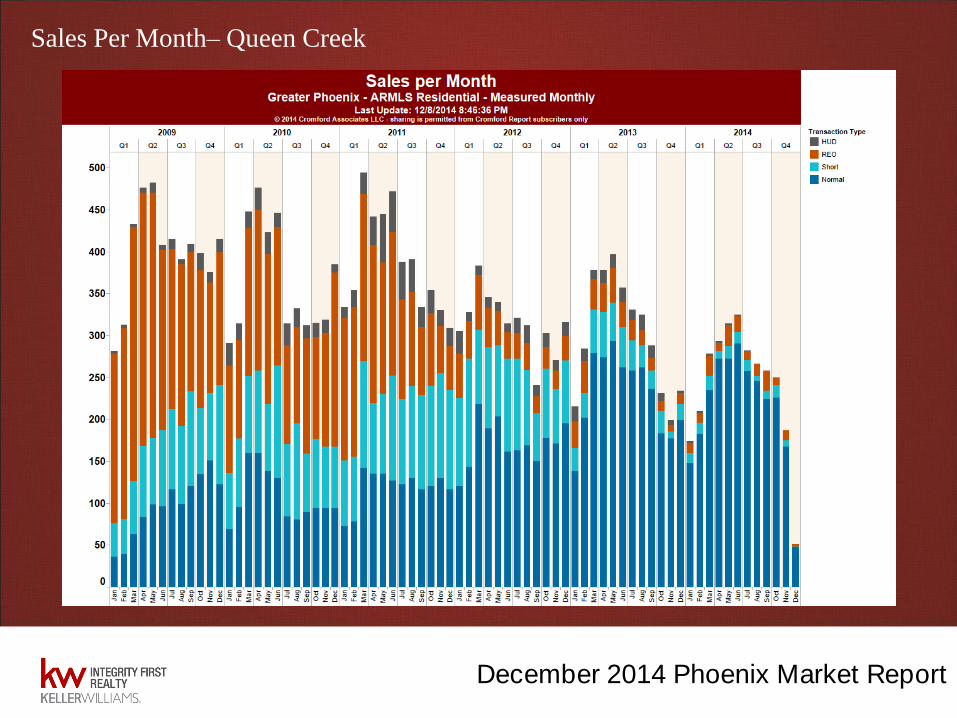
Sales Per Month– Queen Creek

December 2014 Phoenix Market Report
Average Sales Price– Queen Creek

December 2014 Phoenix Market Report
Market Snapshot – Scottsdale

December 2014 Phoenix Market Report
Market Snapshot – Scottsdale
December 2014 Phoenix Market Report
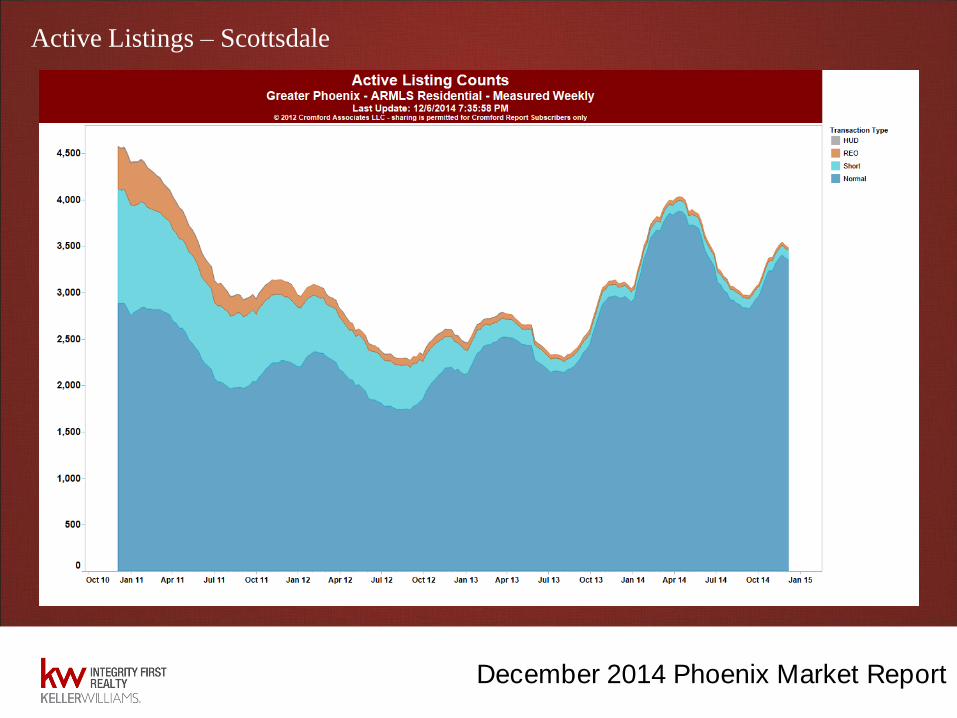
Active Listings – Scottsdale

December 2014 Phoenix Market Report
Sales Per Month– Scottsdale
December 2014 Phoenix Market Report
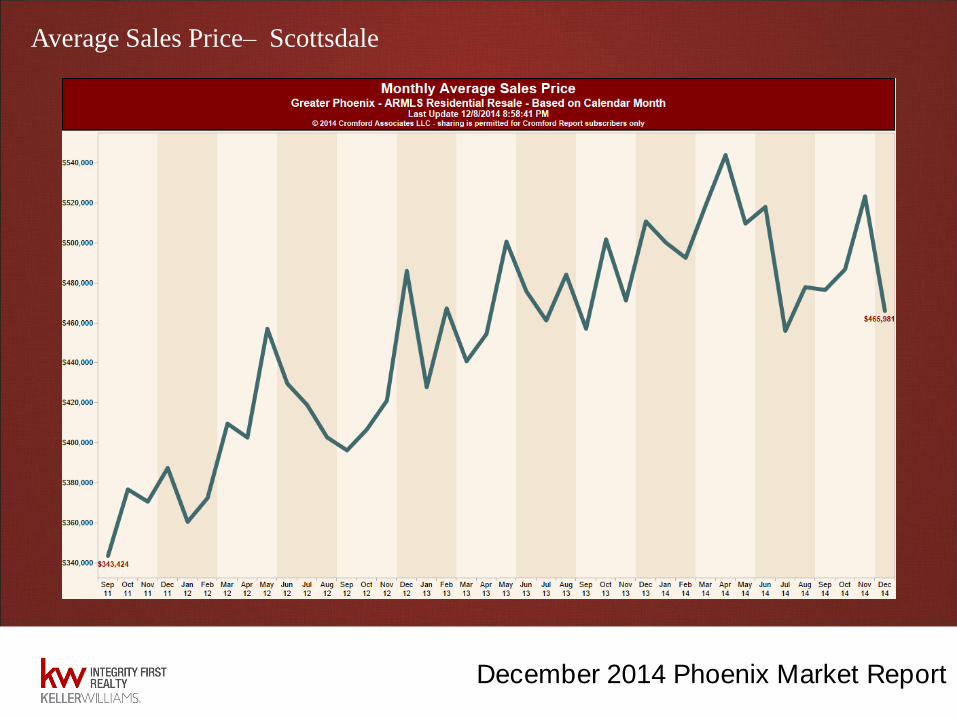
Average Sales Price– Scottsdale

December 2014 Phoenix Market Report
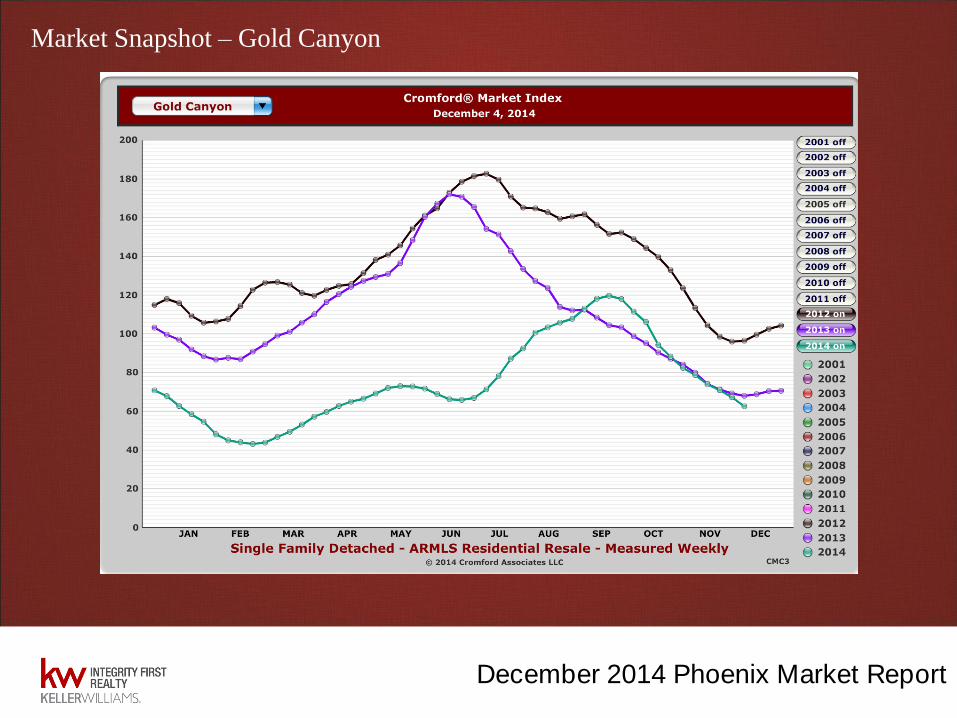
Market Snapshot – Gold Canyon
December 2014 Phoenix Market Report
Market Snapshot – Gold Canyon
December 2014 Phoenix Market Report
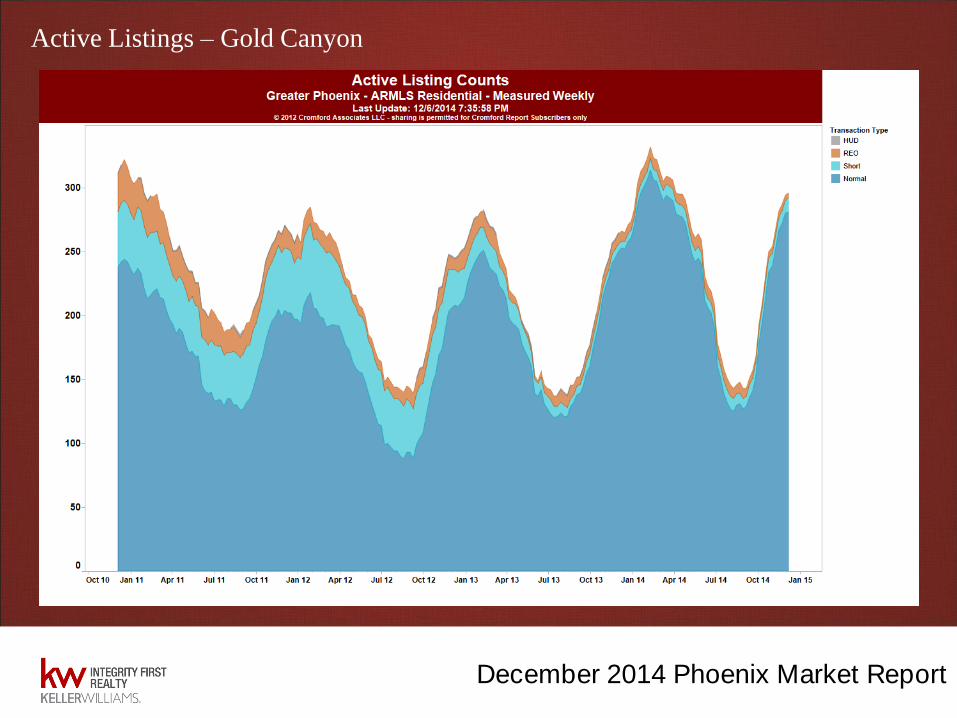
Active Listings – Gold Canyon
December 2014 Phoenix Market Report
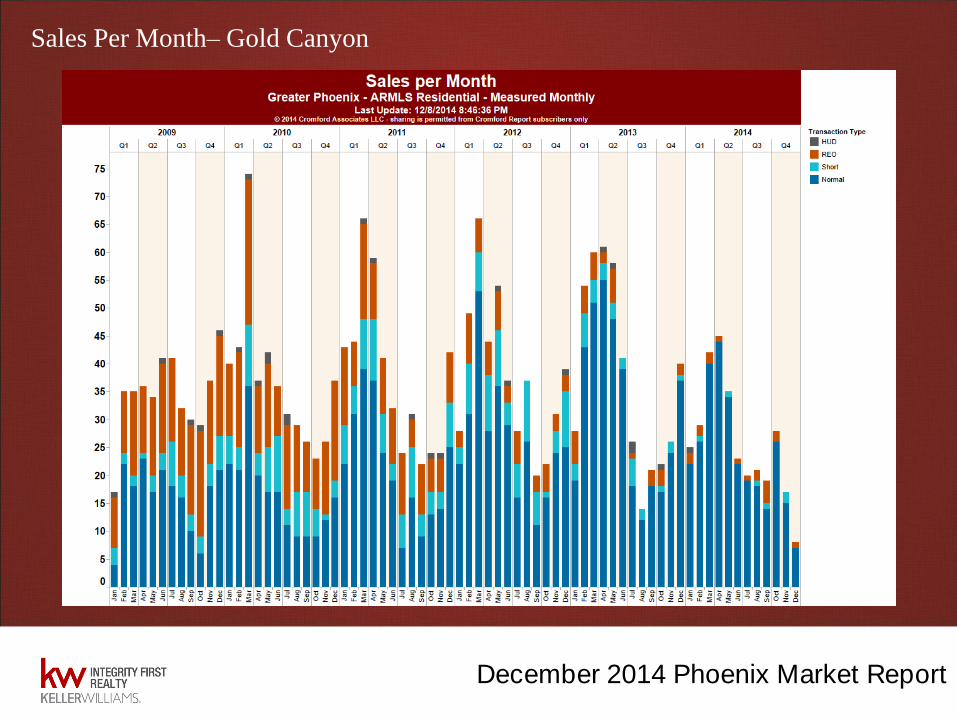
Sales Per Month– Gold Canyon

December 2014 Phoenix Market Report
Average Sales Price– Gold Canyon
December 2014 Phoenix Market Report
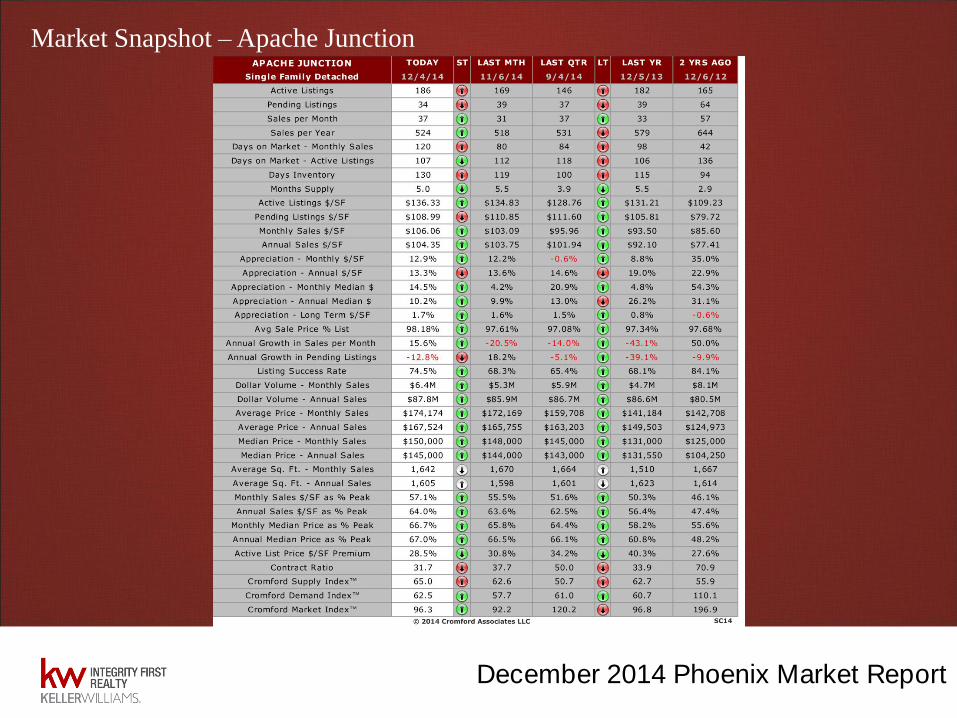
Market Snapshot – Apache Junction

December 2014 Phoenix Market Report
Market Snapshot – Apache Junction
December 2014 Phoenix Market Report
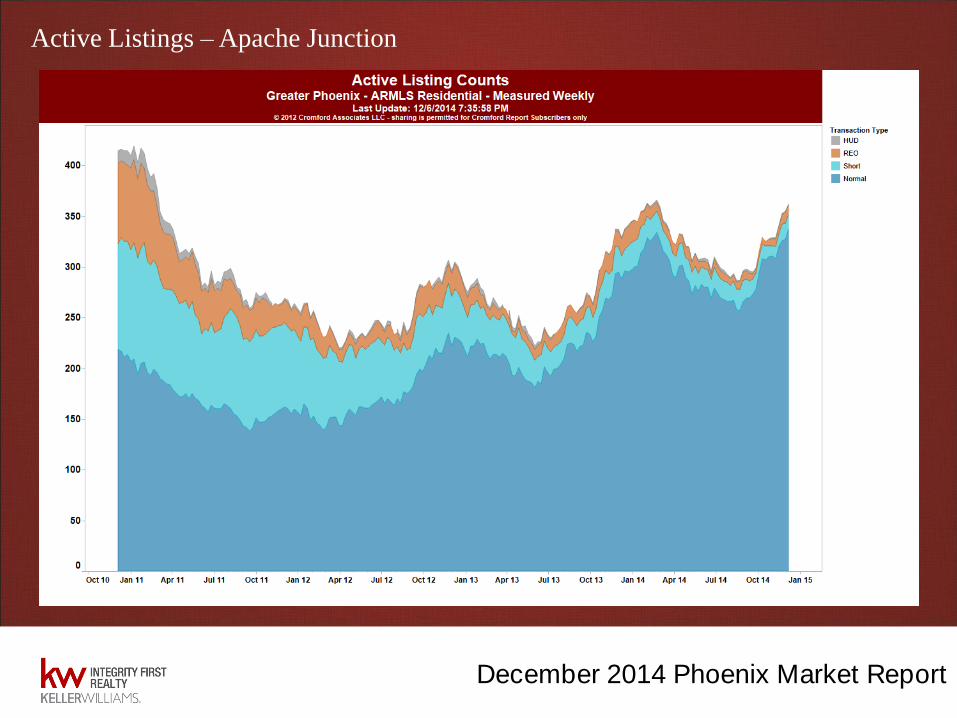
Active Listings – Apache Junction
December 2014 Phoenix Market Report
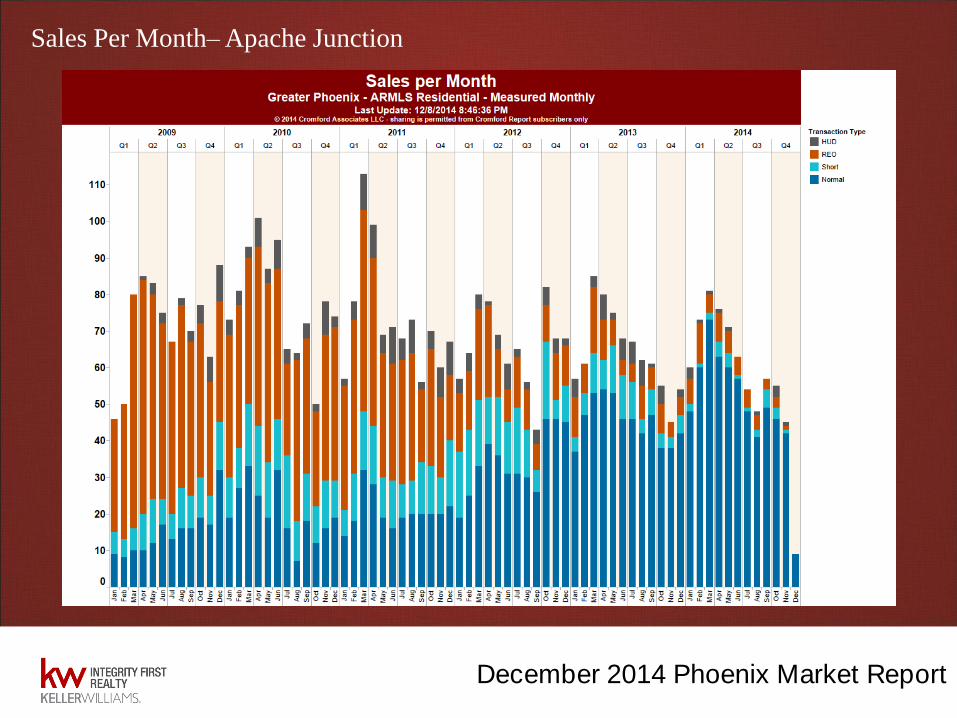
Sales Per Month– Apache Junction

December 2014 Phoenix Market Report
Average Sales Price– Apache Junction