Embed Size (px)
Citation preview

March 2015 Phoenix Market Report
March 2015 Phoenix Real Estate Market Report

March 2015 Phoenix Market Report
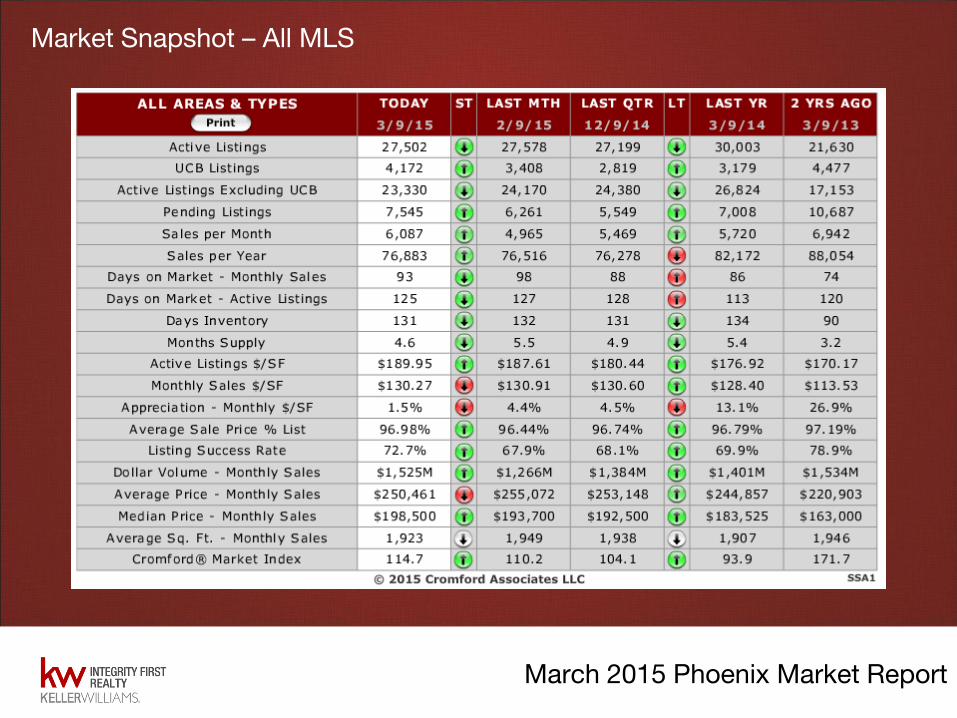
Market Snapshot – All MLS Market Summary for the Beginning of March February was an excellent month for the optimists with improvements for sellers across the majority of price ranges and geographic areas. The main exception was the luxury end of the market, where supply has been growing and demand diminishing. Here are the basic ARMLS numbers for March 1, 2015 relative to March 1, 2014 for all areas & types: • Active Listings (excluding UCB): 23,541 versus 26,589 last year - down 11.5% - and down 1.7% from 23,950 last month • Active Listings (including UCB): 27,315 versus 29,613 last year - down 7.8% - but up 0.8% compared with 27,095 last month • Pending Listings: 6,709 versus 6,462 last year - up 3.8% - and up 25.1% from 5,631 last month • Under Contract Listings (including Pending & UCB): 10,483 versus 9,486 last year - up 10.5% - and up 30.5% from 8,776 last month • Monthly Sales: 5,982 versus 5,444 last year - up 9.9% - and up 24.9% from 4,790 last month • Monthly Average Sales Price per Sq. Ft.: $130.08 versus $127.38 last year - up 2.1% - but down 0.6% from $130.86 last month • Monthly Median Sales Price: $195,000 versus $182,000 last year - up 7.1% - and the same as last month The rise in the under contract count over last year - up 10.5% - understates the magnitude of the improvement because it includes all areas & types. The balance between supply and demand has altered the most for the price ranges between $75,000 and $800,000. Outside that wide and important price range, things don't look like they are improving much at all. The luxury market has certainly weakened, but then it has had a very good run for the past 2 years while the rest of the market has floundered. Everything in real estate is cyclical, so it is probably time for the luxury market to rest for a while and let the lower and mid range markets have their turn. Sales in January were slightly below January 2014, but in February more than made up for that and we saw an increase of almost 10% over February 2014.

March 2015 Phoenix Market Report
Market Snapshot – All MLS The most encouraging development is the return of the entry level home buyer and this can be seen in the places where demand is clearly outstripping supply. Specific examples include Mesa 85202, 85203, 85204, Phoenix 85017, 85019, 85027, 85029, 85031, 85033, 85035, 85037, 85040, 85043, 85053, El Mirage 85335, Avondale 85323, Glendale 85302, 85304, 85306, Chandler 85224, Youngtown 85363, Tolleson 85353 and Tempe 85283. All of these have a Contract Ratio over 90, qualifying them as "hot spots". Last year at this time only 2 ZIP codes - Youngtown 85363 and Mesa 85210 were higher than 90 across the entire valley. Last month we commented that the first time home buyer is critical to the next stage of the recovery. It looks like we finally got what we have been waiting for. Now we have to hope that February was not a one-time blip and that the trend will continue through the spring.

March 2015 Phoenix Market Report
Market Snapshot – All MLS Cromford Demand Index™ is a value that provides a short term forecast for the demand for resale homes in the market. It is derived from the trends in pending and sold listings compared with historical data over the previous four years. Values above 100 indicate more demand than usual, while values below 100 indicate less demand than usual. A value of 100 indicates the demand is close to normal. Cromford Market Index™ is a value that provides a short term forecast for the balance of the market. It is derived from the trends in pending, active and sold listings compared with historical data over the previous four years. Values below 100 indicate a buyer's market, while values above 100 indicate a seller's market. A value of 100 indicates a balanced market. Cromford Supply Index™ is a value that provides a short term forecast for the supply of resale homes to the market. It is derived from the trends in active listings compared with historical data over the previous four years. Values above 100 indicate more supply than usual, while values below 100 indicate less supply than usual. A value of 100 indicates the supply is close to normal.
March 2015 Phoenix Market Report
Market Snapshot – All MLS

March 2015 Phoenix Market Report
Cromford Index – All MLS

March 2015 Phoenix Market Report
Active Listings – All MLS

March 2015 Phoenix Market Report
Sales Per Month– All MLS
March 2015 Phoenix Market Report
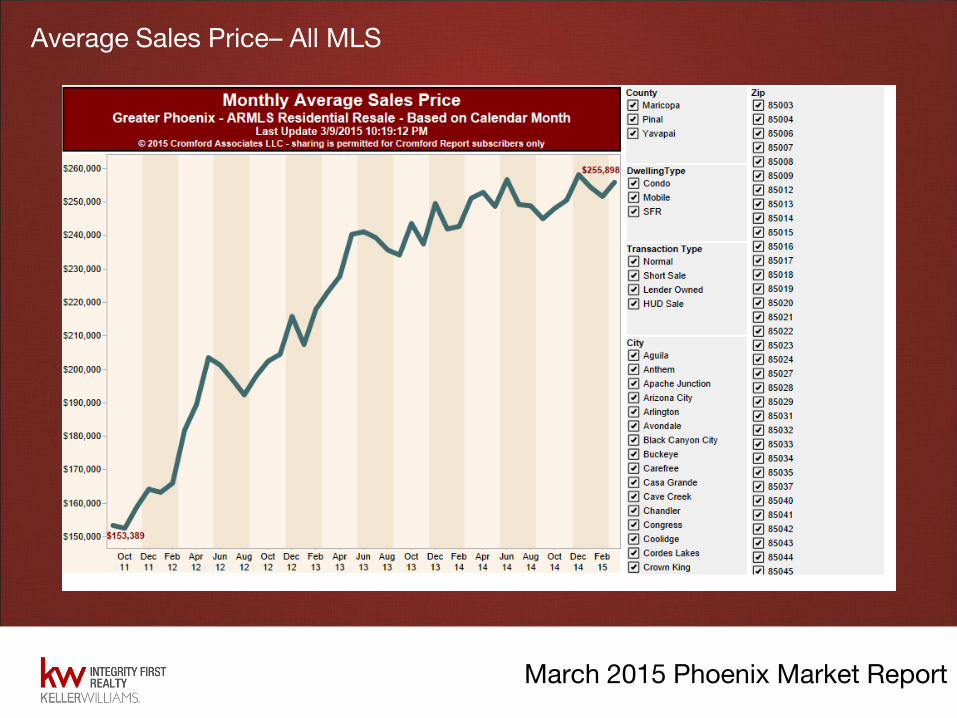
Average Sales Price– All MLS
March 2015 Phoenix Market Report
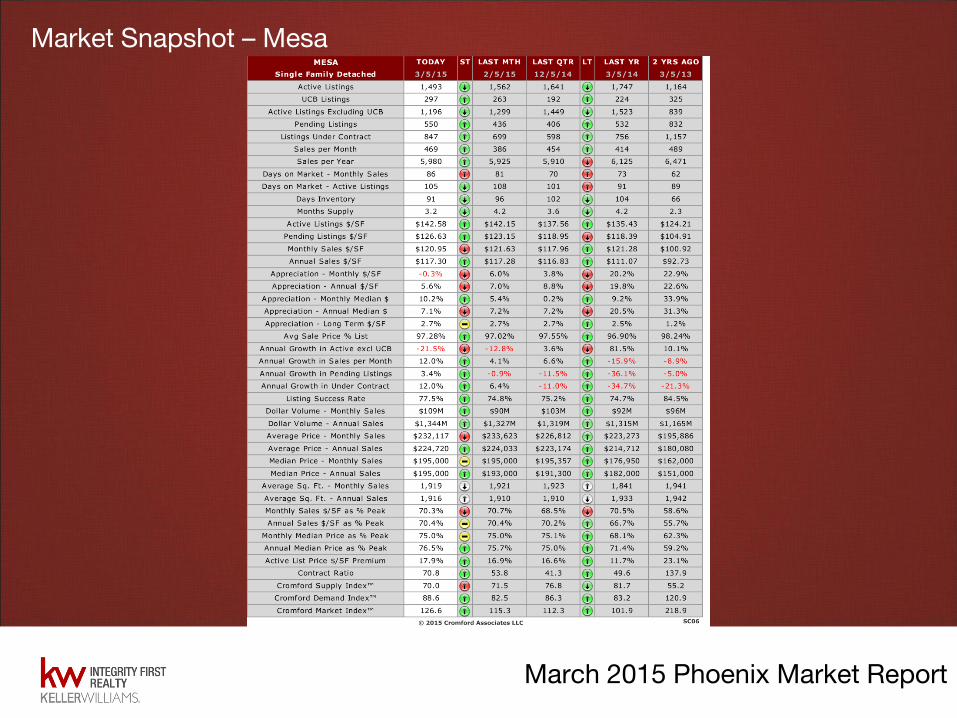
Market Snapshot – Mesa

March 2015 Phoenix Market Report
Market Snapshot – Mesa

March 2015 Phoenix Market Report
Active Listings – Mesa
March 2015 Phoenix Market Report
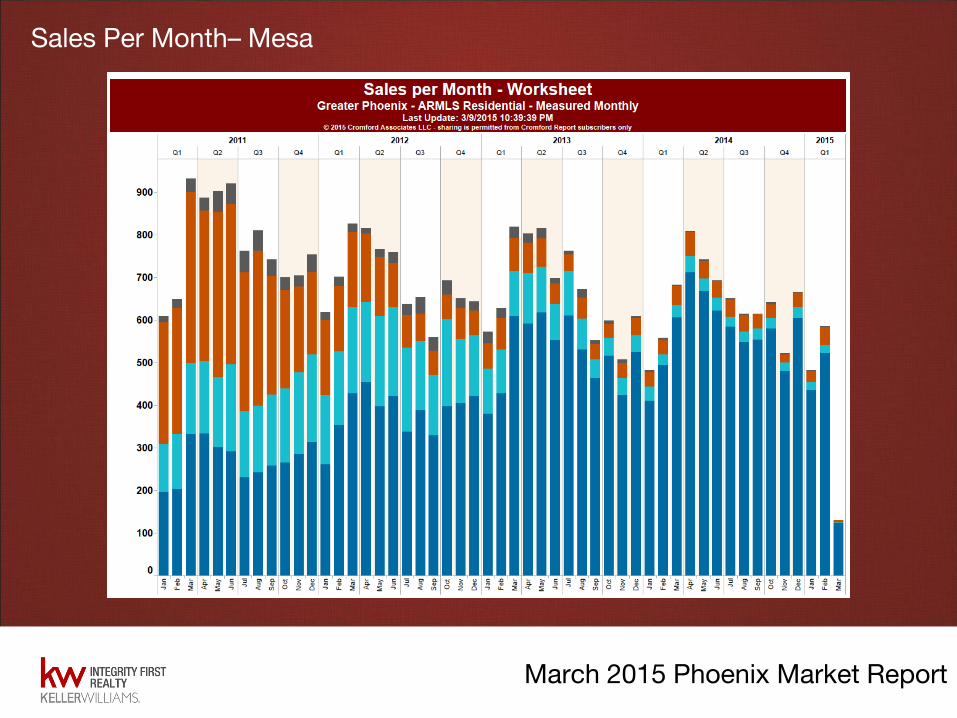
Sales Per Month– Mesa

March 2015 Phoenix Market Report
Average Sales Price– Mesa

March 2015 Phoenix Market Report
Market Snapshot – Gilbert

March 2015 Phoenix Market Report
Market Snapshot – Gilbert

March 2015 Phoenix Market Report
Active Listings – Gilbert

March 2015 Phoenix Market Report
Sales Per Month– Gilbert

March 2015 Phoenix Market Report
Average Sales Price– Gilbert

March 2015 Phoenix Market Report
Market Snapshot – Chandler

March 2015 Phoenix Market Report
Market Snapshot – Chandler

March 2015 Phoenix Market Report
Active Listings – Chandler
March 2015 Phoenix Market Report
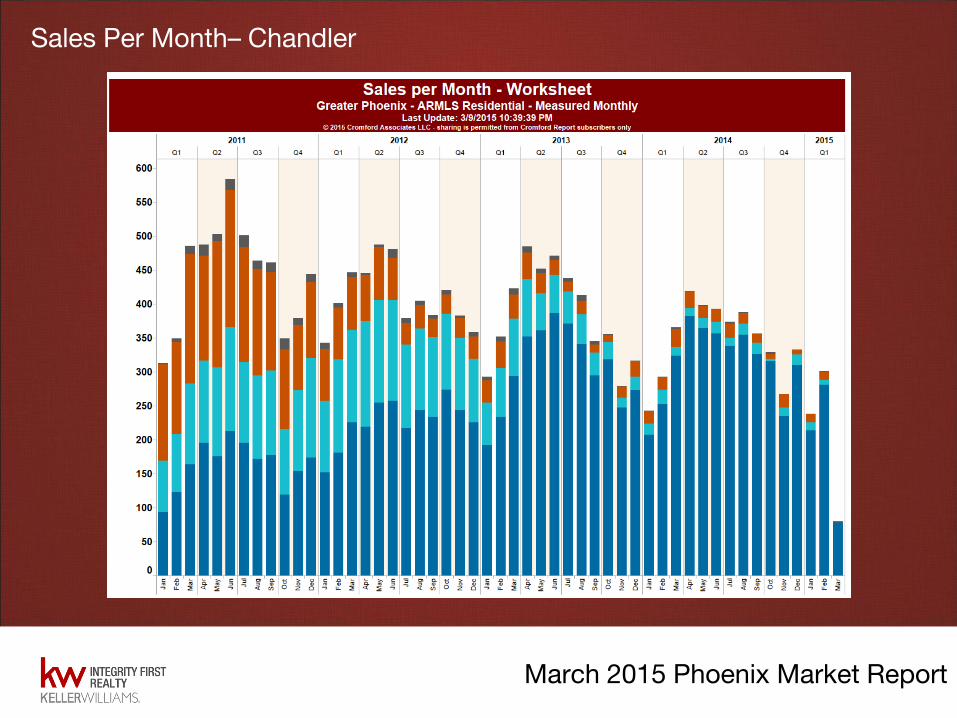
Sales Per Month– Chandler
March 2015 Phoenix Market Report
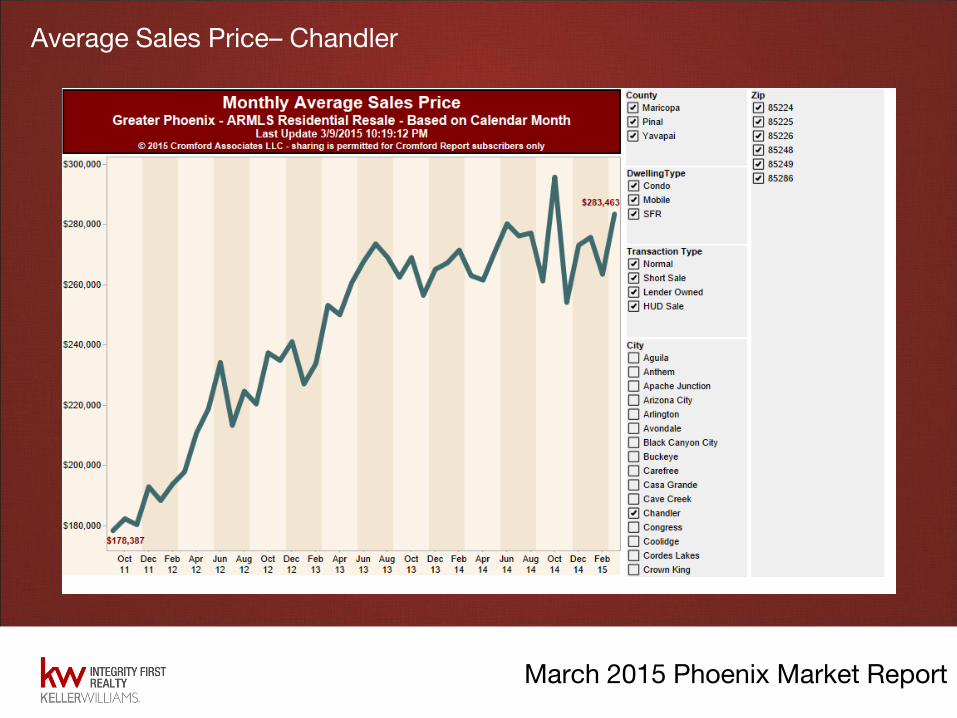
Average Sales Price– Chandler

March 2015 Phoenix Market Report
Market Snapshot – Tempe

March 2015 Phoenix Market Report
Market Snapshot – Tempe

March 2015 Phoenix Market Report
Active Listings – Tempe

March 2015 Phoenix Market Report
Sales Per Month– Tempe

March 2015 Phoenix Market Report
Average Sales Price– Tempe

March 2015 Phoenix Market Report
Market Snapshot – Queen Creek

March 2015 Phoenix Market Report
Market Snapshot – Queen Creek
March 2015 Phoenix Market Report
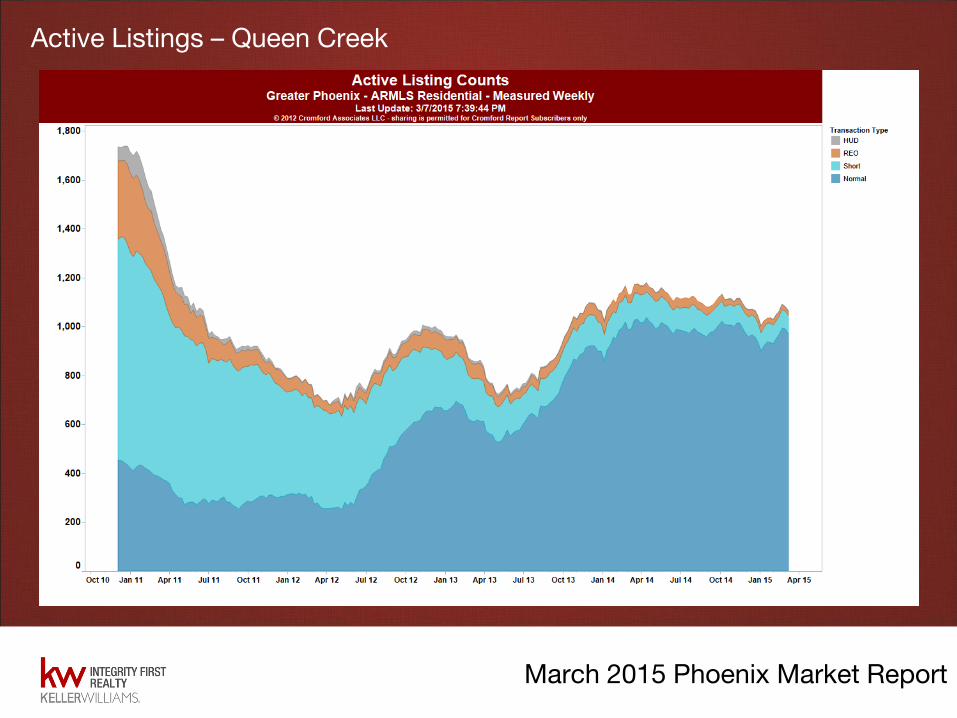
Active Listings – Queen Creek

March 2015 Phoenix Market Report
Sales Per Month– Queen Creek

March 2015 Phoenix Market Report
Average Sales Price– Queen Creek
March 2015 Phoenix Market Report
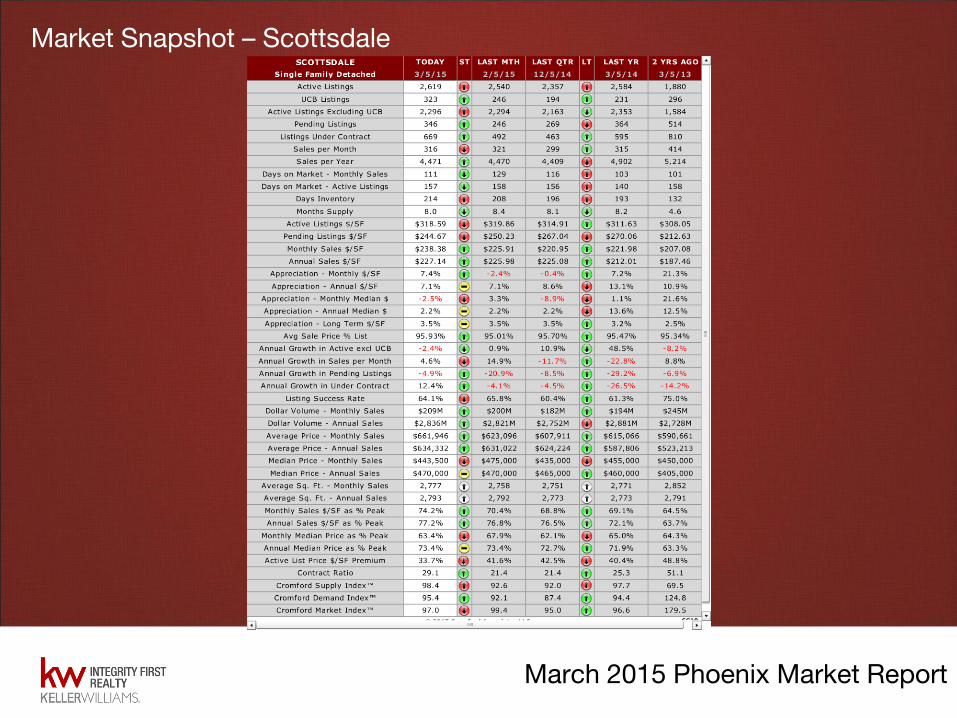
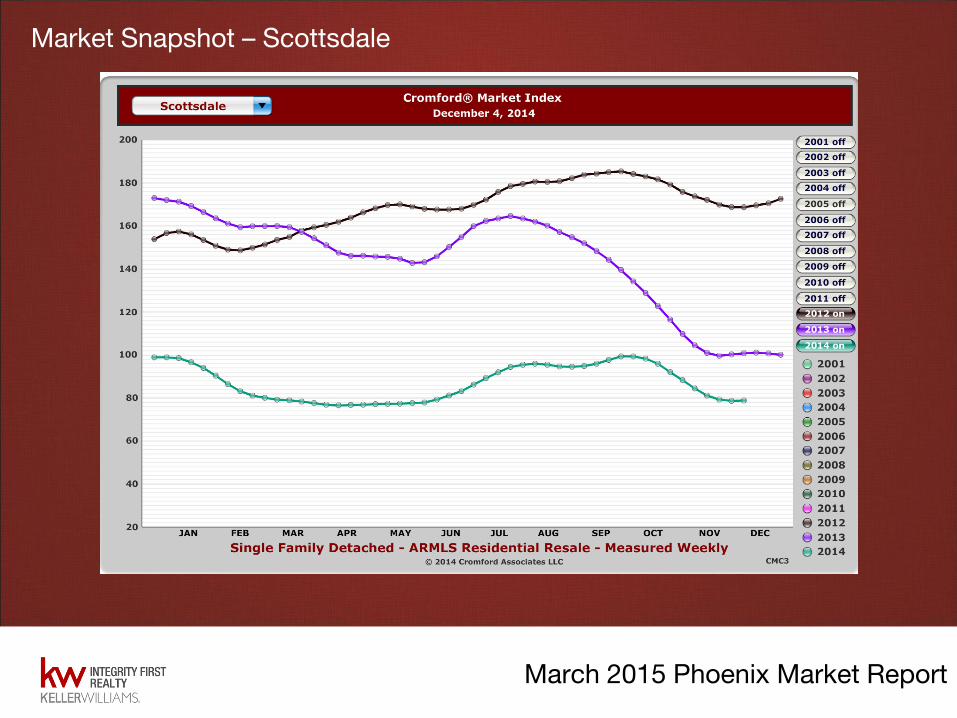
Market Snapshot – Scottsdale
March 2015 Phoenix Market Report
Market Snapshot – Scottsdale

March 2015 Phoenix Market Report
Active Listings – Scottsdale

March 2015 Phoenix Market Report
Sales Per Month– Scottsdale

March 2015 Phoenix Market Report
Average Sales Price– Scottsdale

March 2015 Phoenix Market Report
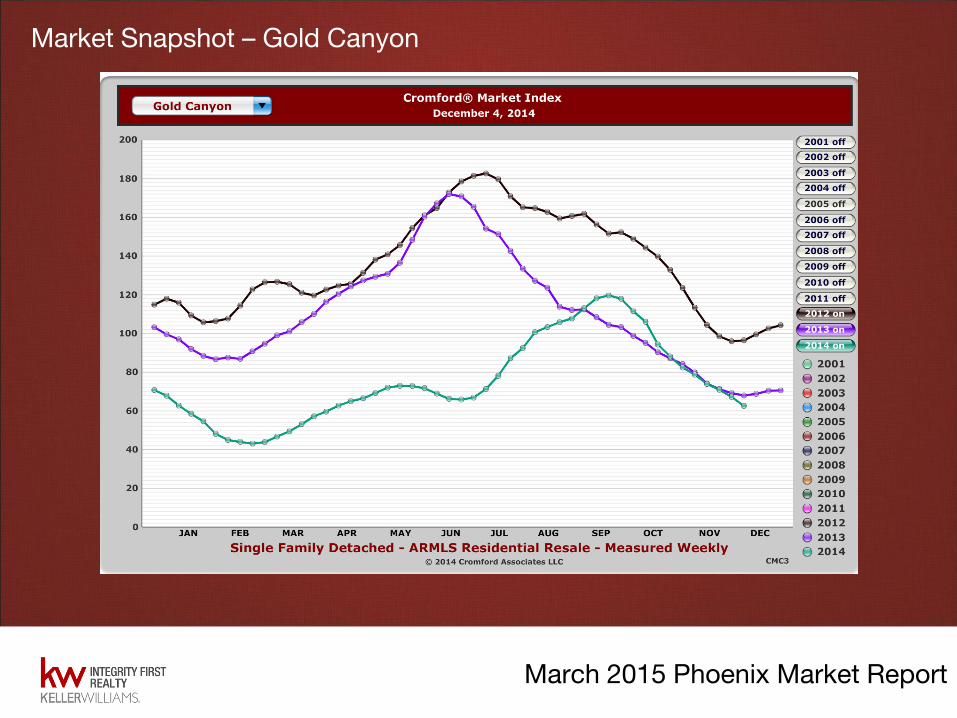
Market Snapshot – Gold Canyon
March 2015 Phoenix Market Report
Market Snapshot – Gold Canyon
March 2015 Phoenix Market Report
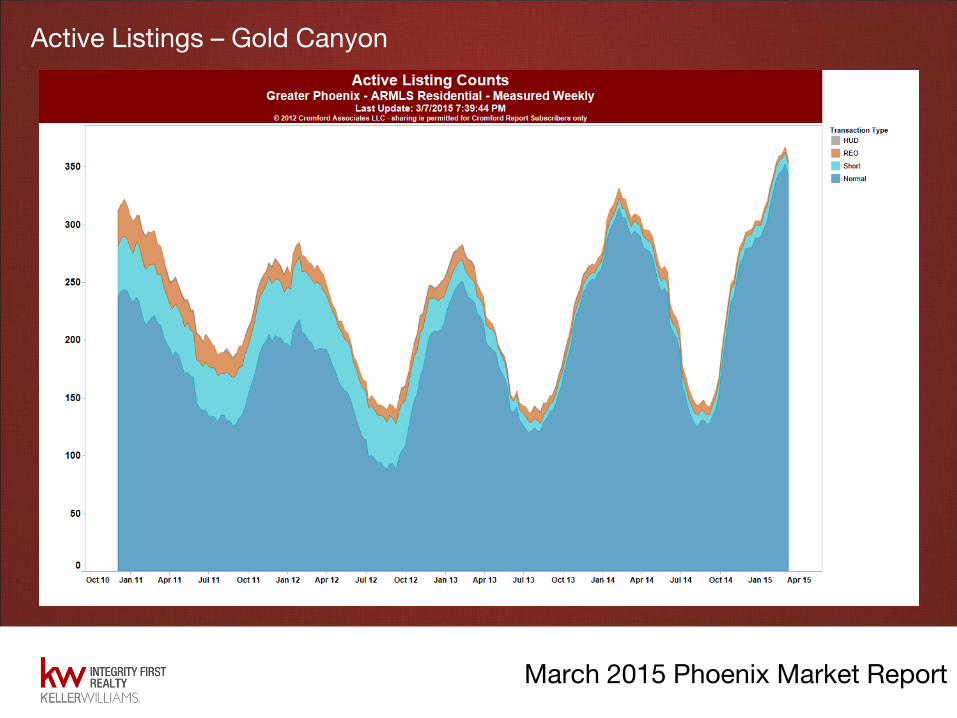
Active Listings – Gold Canyon

March 2015 Phoenix Market Report
Sales Per Month– Gold Canyon

March 2015 Phoenix Market Report
Average Sales Price– Gold Canyon

March 2015 Phoenix Market Report
Market Snapshot – Apache Junction

March 2015 Phoenix Market Report
Market Snapshot – Apache Junction
March 2015 Phoenix Market Report
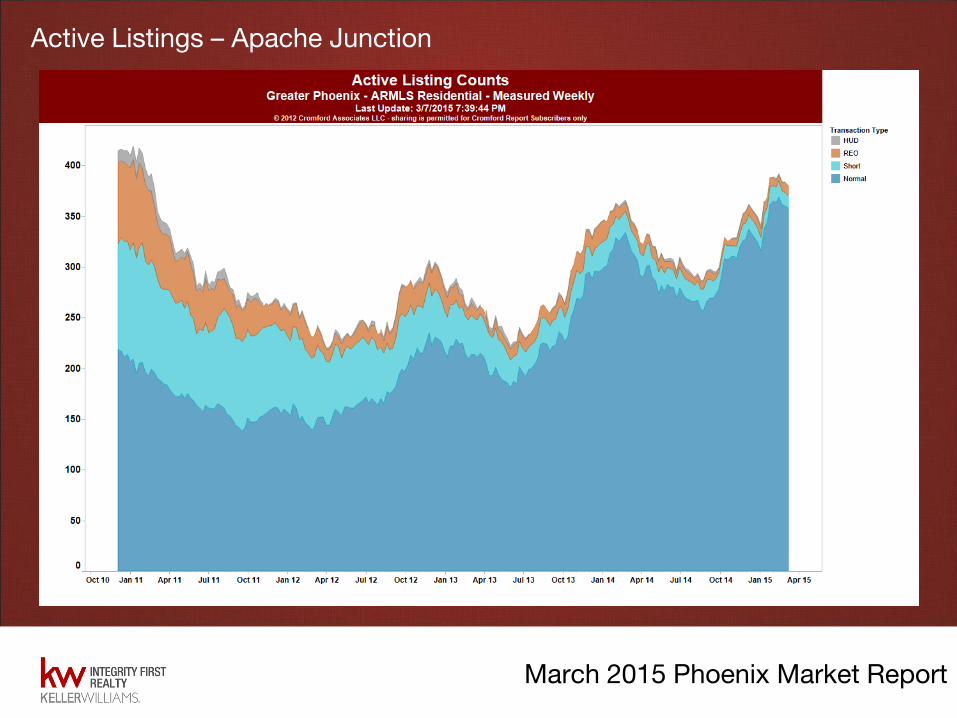
Active Listings – Apache Junction
March 2015 Phoenix Market Report
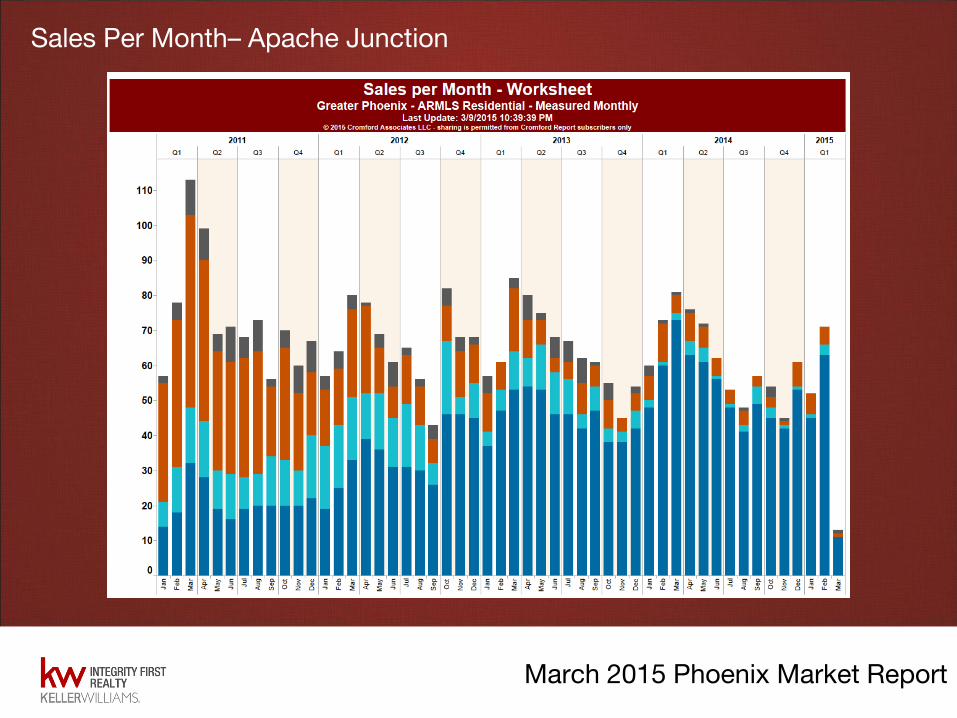
Sales Per Month– Apache Junction
March 2015 Phoenix Market Report
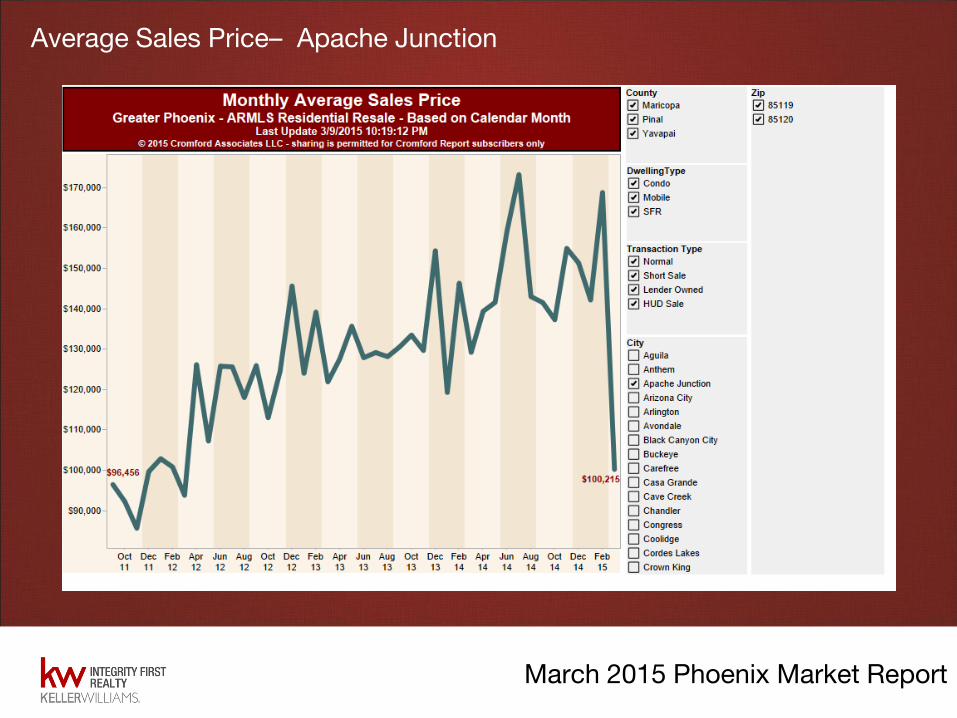
Average Sales Price– Apache Junction