Embed Size (px)
Citation preview

1
www.yaichegroup.com
LTE Network In Africa
A revenue enabler in the mobile data era.
LTE offers mobile-network operators in Africa a profitable business proposition through service differentiation, new revenue opportunities, and more efficient distribution of live and other digital services.
3
Table of Content
Introduction about the 4G LTE Network in the World
Executive Summary
Overview of Africa Market.
LTE and 3G Market trends in Africa.
LTE Strategy.
4
Table of Content
Introduction about the 4G LTE Network in the World
Executive Summary
Overview of Africa Market.
LTE and 3G Market trends in Africa.
LTE Strategy.

5
Mobile operators face a decision: Their 3G networks will soon be overwhelmed by the amount of data traffic they’re
handling. And demand is growing faster and faster as customers become accustomed to “anywhere, anytime” access
to the Internet. How can operators expand capacity while continuing to lower operating costs to maintain their
margins and keep customers happy?
We believe that the future of mobile data services lies with Long-Term Evolution technology, or LTE. Offering vastly
improved network performance at just a fraction of the cost of 3G technology, LTE has the capabilities to greatly
expand network capacity and offer a large number of customers the ability to access a wide range of high-speed
services such as video-on-demand, peer-to-peer file sharing, and complex Web services. At the same time,
additional spectrum is becoming available that will enable operators to manage their networks more flexibly,
offering greater coverage and better performance for less money.
The decision operators face is not whether to shift from 3G to LTE, but when. How operators time the transition will
depend on how soon their networks will reach capacity limitations—and on when they can afford the
implementation. Those looking to position themselves as technology leaders may decide to move as early as
possible; others may prefer to wait until the increasing demands on their networks require them to switch.
Introduction

6
LTE Networks across 79 countries worldwide – August, 2013
Americas7.6%
Europe13%
Africa0.05%
LTE Connection Penetration Rate
Asia 13%
Oceans 12.6%
(*) Source: GSMA Intelligence – YSTRAT Analysis
Overview of LTE Network in the World
3G network build outs are continuing across the region, and will play an important role in bringing higher speed internet access to the population. MTN in South Africa recently announced that it covered 68% of the population with its 3G network by the middle of 2013, while 2G coverage is already at 98%. Vodacom has stated that its own 3G network coverage was around 83% of the population at the end of 2012.
In contrast, LTE deployments across SSA are still in their early stages, with only nine countries across the region having commercial LTE networks in operation as of August 2013. This leaves SSA trailing the other regions in the world in terms of active LTE networks

7
Table of Content
Introduction about the 4G LTE Network in the World
Executive Summary
Overview of Africa Market.
LTE and 3G Market trends in Africa.
LTE Strategy.
8
Executive Summary
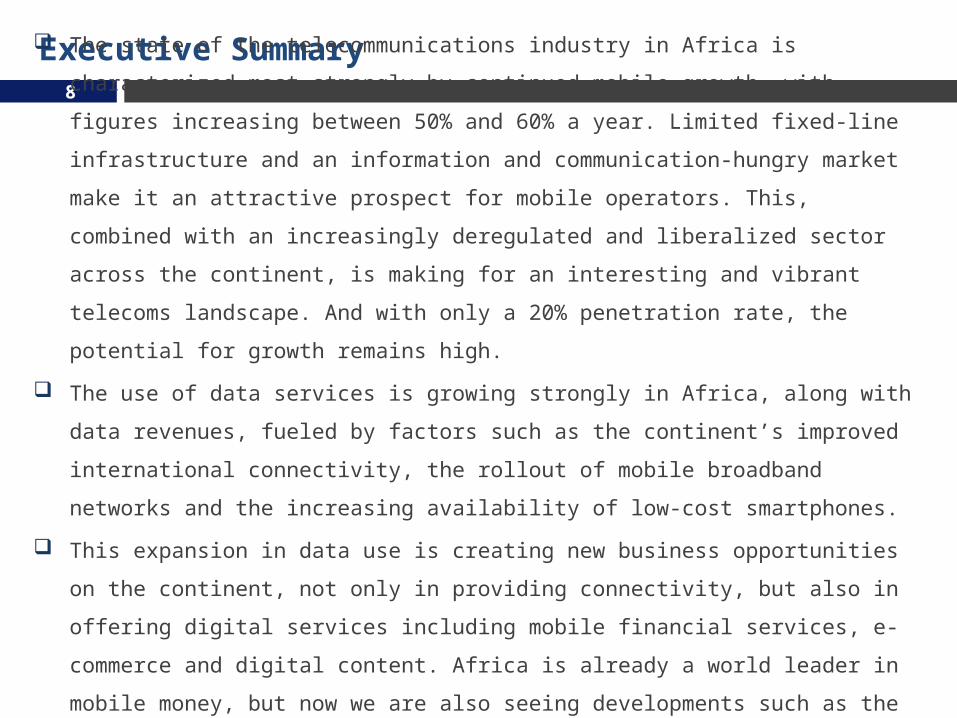
The state of the telecommunications industry in Africa is characterized most strongly by continued
mobile growth, with figures increasing between 50% and 60% a year. Limited fixed-line
infrastructure and an information and communication-hungry market make it an attractive
prospect for mobile operators. This, combined with an increasingly deregulated and liberalized
sector across the continent, is making for an interesting and vibrant telecoms landscape. And with
only a 20% penetration rate, the potential for growth remains high.
The use of data services is growing strongly in Africa, along with data revenues, fueled by factors
such as the continent’s improved international connectivity, the rollout of mobile broadband
networks and the increasing availability of low-cost smartphones.
This expansion in data use is creating new business opportunities on the continent, not only in
providing connectivity, but also in offering digital services including mobile financial services, e-
commerce and digital content. Africa is already a world leader in mobile money, but now we are
also seeing developments such as the rapid growth in online shopping in Nigeria, and a
proliferation of digital ventures and services.

9
Table of Content
Introduction about the 4G LTE Network in the World
Executive Summary
Overview of Africa Market.
LTE and 3G Market trends in Africa.
LTE Strategy.

10
• Population: 17.2 Million,• Penetration 29.5%• GDP is 1,452 US$ /Capital
• Population: 17.4 Million,• Penetration 20%• GDP is 364 US$ /Capital
• Population: 49.5 Million,• Penetration 30%• GDP is 529 US$ /Capital
• Population: 44.2 Million,• Penetration 31%• GDP is 808 US$ /Capital
• Population: 13.5 Million,• Penetration 47.6%• GDP is 1,119 US$ /Capital
• Population: 51 Million,• Penetration 65.7%• GDP is 8,070 US$ /Capital
• Population: 20.8 Million,• Penetration 34.5%• GDP is 5,148 US$ /Capital
• Population: 21.2 Million,• Penetration 45%• GDP is 1,195 US$ /Capital
346 Million unique subscriber in Africa 2017
Penetration, GDP and Population for Selected Countries - 2012
(*) Source: GSMA Intelligence

11
Unique Subscribers & Connection SIM In Africa
2007 2008 2009 2010 2011 20120
50
100
150
200
250
300
350
400
450
500
105.2136.4
158.2184.3
211.5241.4
165.6
233.8279.6
337.9
400.5473.3
Unique Subs Active SIM
+7% CAGR
Analysis by YSTRAT Intelligence found that on average subscribers in developing markets had close to two SIM cards each, more than in developed markets. As a result, and to better understand the “addressable” population and the scope for future growth, increasingly focuses on unique subscribers rather than SIM connections. By the middle of 2013, there were 253 million unique mobile subscribers in the region, a figure that has grown by 18% per annum over the last five years, and making SSA by some distance the fastest growing region globally.
Mobile has benefited from the economic development across SSA, with economic growth particularly robust in some of the lower income countries in the region, where penetration rates historically have been lowest. Rising mobile penetration rates are themselves a positive contributor to economic growth in the region.
(*) Source: GSMA Intelligence

12
Unique Subscribers Penetration by Country – Q2, 2013
(*) Source: GSMA Intelligence
Sub-Saharan Africa is very diverse in terms of the range of subscriber penetration rates at the country level, with subscriber penetration
ranging from a low of 17% in Ethiopia to over 70% in countries such as Botswana, Mauritius and Gabon. Income levels are a key driver of
differing penetration rates, though other factors including market structure, geography and regulatory environments also play a role.
There can also be significant variations within individual countries, such as South Africa which has some segments with income levels
similar to those in developed markets, but also a large population with low income levels.
EthiopiaBruno
Djibouti
CongoNiger
Comoros
Central A
frica
Republic
Mozambique
UgandaTogo
Nigeria
Burkina Faso
Liberia
RuandaKenya
Sub Saharan Africa
Tanzania
Lesotho
Guinea
Angola
Cameron
Swaziland
ZambiaBenin
Cote O'lv
oire
Senegal
Zimbabwe
Ghana
mambaMali
South Africa
Botswana
Gabon
Mauritius
0%
10%
20%
30%
40%
50%
60%
70%
80%

13
SENEGAL NIGERIA TANZANIA GHANA KENYA South Africa0.0%
50.0%
100.0%
150.0%
200.0%
250.0%
300.0%
350.0%
400.0%
450.0% 420.0%
139.0%
32.3%
190.9%
120.7%
228.5%
25.7%1.2% 1.9% 4.3% 2.3% 28.0%
Mobile Penetration Rate Fixed Penetration Rate
In a region that has the lowest fixed line penetration globally, and where many countries have fixed line household penetration rates of
less than 5%, mobile services have helped address the pent up demand for voice services, and increasingly are addressing the demand for
internet access.
While fixed line penetration is limited, almost every household across SSA has access to a mobile phone. This highlights the importance of
shared access to a phone in many communities, as several family members may make use of a single mobile subscription.
As a result, mobile services can have a broader reach than a simple analysis of subscriber penetration rates would indicate.
(*) Source: GSMA Intelligence
Mobile & Fixed Penetration Rate for Selected Countries - 2012
14
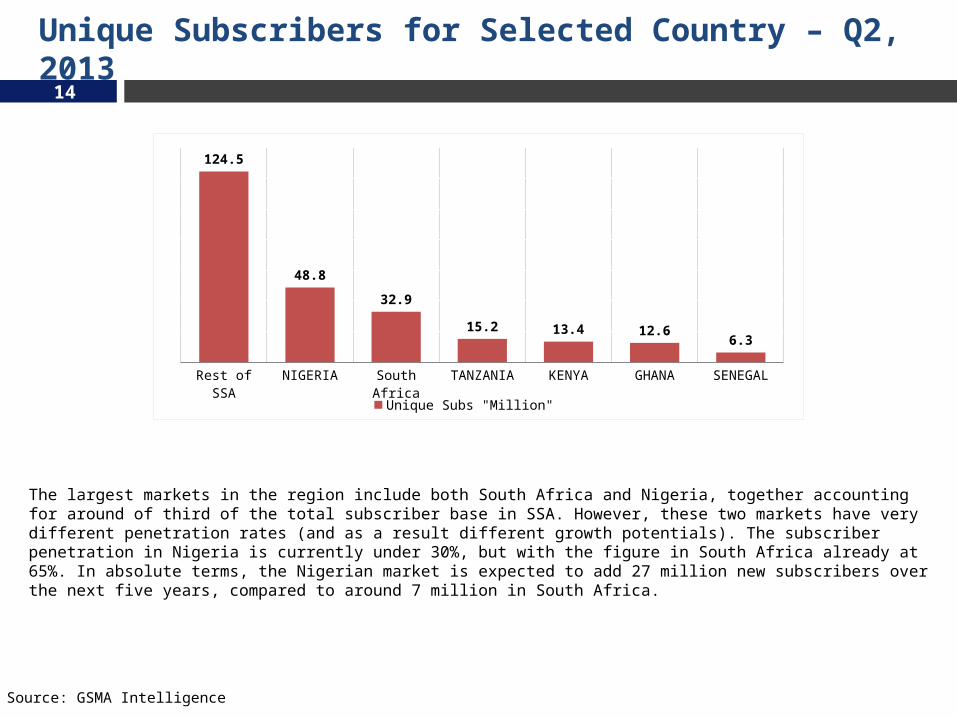
Unique Subscribers for Selected Country – Q2, 2013
(*) Source: GSMA Intelligence
The largest markets in the region include both South Africa and Nigeria, together accounting for around of third of the total subscriber base in SSA. However, these two markets have very different penetration rates (and as a result different growth potentials). The subscriber penetration in Nigeria is currently under 30%, but with the figure in South Africa already at 65%. In absolute terms, the Nigerian market is expected to add 27 million new subscribers over the next five years, compared to around 7 million in South Africa.
Rest of SSA NIGERIA South Africa TANZANIA KENYA GHANA SENEGAL
124.5
48.8
32.9
15.2 13.4 12.66.3
Unique Subs "Million"

15
Senegal Nigeria Tanzania Ghana Kenya South Africa0.0%
20.0%
40.0%
60.0%
80.0%
100.0%
120.0%
140.0%
160.0%
46.7%
28.6% 31.0%
48.3%
30.5%
64.6%
90.7%
69.2%57.1%
96.7%
70.2%
134.7%
Unique Subscriber Penetration SIM Penetration
As is common in other developing markets, many mobile subscribers in SSA have multiple SIM cards in order to take advantage of low cost offers, and also to use the best available tariffs for particular types of calls (such as “on-net “ tariffs that offer significantly lower rates for calls between SIM cards from the same network operator). As we have already highlighted, we believe any debate about the future growth rates need to focus on subscriber and not SIM penetration rates.
A number of markets have introduced mandatory SIM registration schemes over the last year (including for example Ghana, Uganda and Ivory Coast) which in some cases has led to large scale disconnections of unregistered SIMs. This has impacted reported connection growth rates, at least in the short term. South Africa has one of the largest gaps between subscriber and active SIM penetration rates, although Nigeria, Senegal and Ghana all have gaps in the 40-50 percentage point range.
(*) Source: GSMA Intelligence
Subscriber VS. SIM Penetration Rate in Selected Market - JUNE, 2013

16
Senegal Nigeria SSA AVG. Tanzania Ghana Kenya South Africa Developing Market Average
Global Average
$0.0
$5.0
$10.0
$15.0
$20.0
$25.0
$30.0
$10.9
$16.4$13.6
$5.5
$11.8 $12.4
$25.4
$15.0
$25.0
ARPU “Per Subscriber” Per Month – Q1, 2013 (US $)
Average revenue per subscriber (ARPU) also varies significantly across the region, largely driven by differing GDP per capita and income levels. On the whole, ARPU levels in SSA are in line with the developing market average, while only South Africa of the larger markets has ARPUs above the global average level (reflecting mainly high average income levels in the country).
While the average APRU for the region is US$ 14, there are many subscribers in SSA who generate much lower ARPU levels, mainly reflecting lower income levels. Indeed, there are over 250 million people in the region living in countries where the average ARPU is currently US$ 8 or less. This is a key consideration when it comes to the discussion about future growth potential in the region, as many of the incremental subscribers going forward will come increasingly from rural and often lower income parts of the region, which are likely to generate relatively low ARPUs. This raises particular challenges for operators in terms of the need to generate adequate returns on their investments.
ARPU for Selected Countries
(*) Source: GSMA Intelligence
17
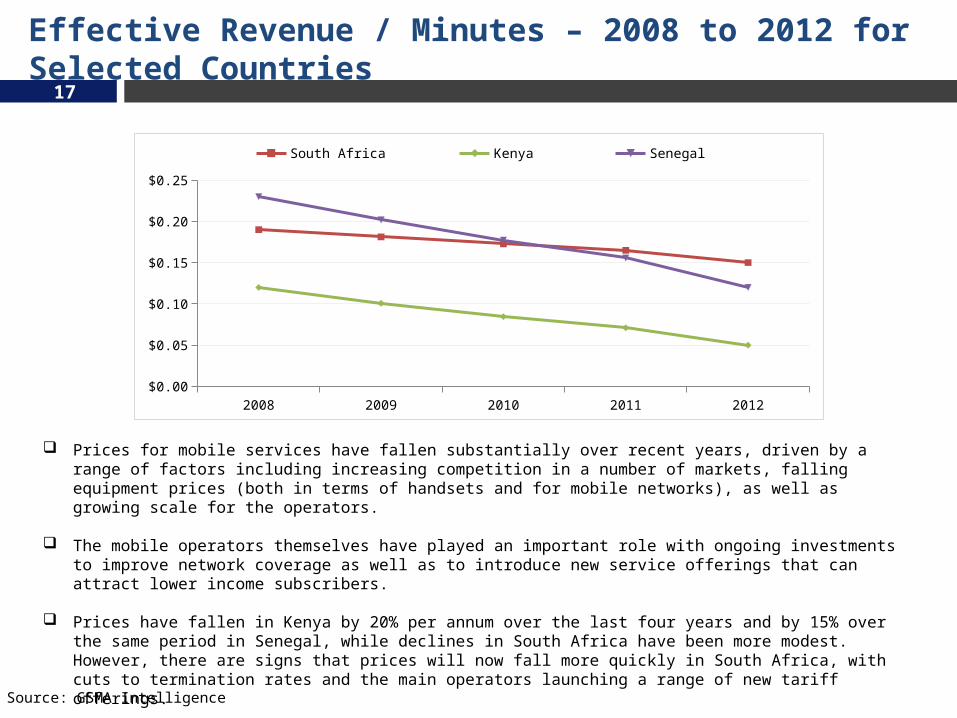
Prices for mobile services have fallen substantially over recent years, driven by a range of factors including increasing competition in a number of markets, falling equipment prices (both in terms of handsets and for mobile networks), as well as growing scale for the operators.
The mobile operators themselves have played an important role with ongoing investments to improve network coverage as well as to introduce new service offerings that can attract lower income subscribers.
Prices have fallen in Kenya by 20% per annum over the last four years and by 15% over the same period in Senegal, while declines in South Africa have been more modest. However, there are signs that prices will now fall more quickly in South Africa, with cuts to termination rates and the main operators launching a range of new tariff offerings.
(*) Source: GSMA Intelligence
2008 2009 2010 2011 2012$0.00
$0.05
$0.10
$0.15
$0.20
$0.25South Africa Kenya Senegal
Effective Revenue / Minutes – 2008 to 2012 for Selected Countries

18
2010 2011 2012 2013 2014 2015 2016 2017North Africa Nigeria Kenya Tanzania
Smart Phone Penetration – Selected Countries
Smartphone adoption will be helped by ongoing declines in handset pricing. The sub-US$ 100 smartphone has already become a reality, and more recently a number of emerging market operators have been calling for a sub-US$ 50 device, which Gartner has suggested could be available.
in 2013. It is also important not to overlook the role of more basic “feature phones” in accessing the internet, often running on lower speed 2G networks, even if they do not support the same range of services and content as smartphones and other more advanced devices.
(*) Source: GSMA Intelligence
Smart Phone Penetration for Selected Countries

19
Table of Content
Introduction about the 4G LTE Network in the World
Executive Summary
Overview of Africa Market.
LTE and 3G Market trends in Africa.
LTE Strategy.

20
The Features of each Generation

21
Currently there are nine “9” countries in sub-Saharan Africa that where LTE networks have been launched, a total of eighteen operators in total. Here’s how it breaks down.
Country Company Frequency Launch Date
AngolaUnitel 2100MHz (Band 1) Dec 2012
Movicel 1800MHz (Band 3) Apr 2012
MauritiusOrange Mauritius 1800MHz (Band 3) Jun 2012
Emtel 1800MHz (Band 3) May 2012
NamibiaMTC 1800MHz (Band 3) May 2012
TN Mobile 1800MHz (Band 3) Nov 2013
NigeriaSmile Telecom 800MHz (Band 20) Mar 2013
Spectranet 2300MHz (Band 40) Aug 2013
South Africa
MTN 1800MHz (Band 3) Dec 2012
Vodacom 1800MHz (Band 3) Oct 2012
Neotel 1800MHz (Band 3) Aug 2013
Telkom / 8ta 2300MHz (Band 40) Apr 2013
Tanzania Smile Telecom 800MHz (Band 20) Aug 2012
Uganda
Smile Telecom 800MHz (Band 20) June 2013
MTN Uganda 2600MHz (Band 38) Apr 2013
Orange Uganda 800MHz (Band 20) Jul 2013
Zambia MTN 1800MHz (Band 3)? Jan 2014
Zimbabwe Econet 1800MHz (Band 3) Aug 2013
LTE in Africa - 2014
(*) Source: 4G Americas Global Deployment Status – January, 2014

22
Mobile broadband: on the cusp of the next wave of developmentin Africa
The lack of fixed line infrastructure for broadband access, and the relatively high cost of such services where they exist*,
means that mobile has emerged as the main medium for accessing the internet across SSA. Other factors include the high
cost of PC ownership and the availability of a range of innovative pricing models for mobile broadband access (including a
range of low cost prepaid options) that can prove more attractive than longer term fixed line contracts.
A recent survey found that 87% of the respondents across Africa indicated that mobile devices were the main means
through which they connected to the internet**, in bringing internet access to new sections of the population.
Mobile internet access will be facilitated by the increasing uptake of more advanced devices, including smartphones.
Overall smartphone penetration rates are still relatively low in SSA, although affordability and access to internet capable
devices is growing rapidly. At the end of 2012 smartphone penetration in SSA stood at 4%, well below the global average
figure of 17%. However, there are significant differences at the country level, with South Africa already having smartphone
adoption levels that are slightly ahead of global averages, with the penetration rate forecast to exceed 45% by 2017.
* http://www.itu.int/en/ITU-D/Regulatory - Market/Documents/IIC_Africa_Final-en.pdf **http://www.analysysmason.com/Templates/Pages/KnowledgeCentreArticle1.aspx?id=13066

23
3G Penetration Rate – Q2,2013
Senegal Nigeria SSA AVG. Tanzania Ghana Kenya South Africa
Developing Market Average
Global Average
0.0%
20.0%
40.0%
60.0%
80.0%
100.0%
120.0%
95.4% 94.1% 92.4% 90.4% 88.0% 85.8%
60.7%
82.7%74.2%
4.6% 5.9% 7.6% 9.6% 12.0% 14.2%
39.3%
17.3%
25.8%
2G 3G
3G and 4G connections are today concentrated in a limited number of markets, as shown in the following chart. Only South Africa, of the larger markets in the region, has a 3G penetration rate ahead of the developing market (or indeed global) average figure. Most of the rest of the SSA region trails behind the rest of the developing world, highlighting the significant growth potential still to come.
(*) Source: GSMA Intelligence s
24
(*) Source: GSMA Intelligence
2007 2008 2009 2010 2011 2012 2013 2014 2015 2016 20170
100
200
300
400
500
600
700
800
900
170.4 236.4 279.9 330.2 382.4 442.7 486.8 514.4 519.5 510.5 491.12.4
7.712.4
19.332.7
51.177
114 160.7 212.4 266.5
0.010.11
0.711.7
3.87.5 13.6
2G 3G 4G
Conn
ectio
n “M
illio
n”
86%
14%
2013
2G
3G
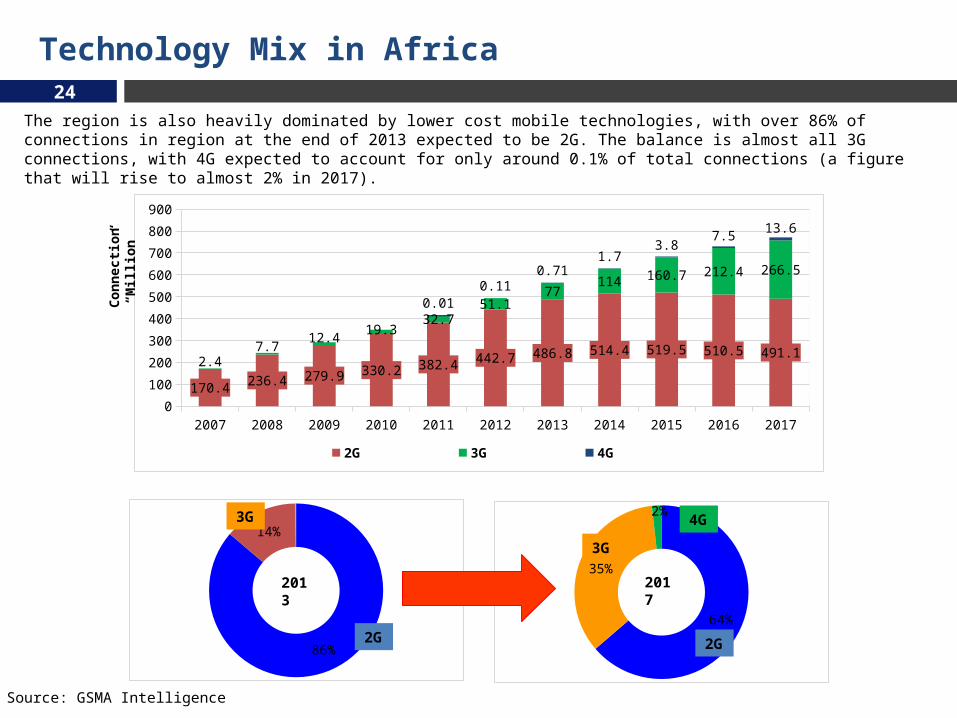
The region is also heavily dominated by lower cost mobile technologies, with over 86% of connections in region at the end of 2013 expected to be 2G. The balance is almost all 3G connections, with 4G expected to account for only around 0.1% of total connections (a figure that will rise to almost 2% in 2017).
64%
35%
2%
2017
3G
4G
2G
Technology Mix in Africa

25
Data Speed in Africa
(*) Source: CISCO VNI
2013
2017
Africa
63K
588K
South Africa has already seen material LTE adoption, despite networks only being launched in late 2012 or early 2013. Three of the four mobile operators in the country have now launched LTE networks. However, operators face challenges with the delays in the planned spectrum auctions (for both the 2.6 GHz and 3.5 GHz bands), obliging the operators to use reframed spectrum for their LTE deployments.
Similarly in Nigeria operators are trialing LTE at 1800 MHz whilst they await the availability of the 2.6 GHz and 800 MHz bands. The total number of LTE connections in South Africa is forecast to reach 6.5 million by 2017, although at that point this will still account for only 8% of total connections in the market at that time.
Data speeds are forecast to increase steadily over the next few years across SSA, with speeds on average in the mid-range for developing markets. While data is not available at a country level, it is likely to follow a similar pattern to smartphone and mobile broadband adoption, with much higher speeds in higher income countries such as South Africa (which are already leading on LTE build outs), with many lower income countries still more focused on improving 3G coverage.

26
South Africa
Nigeria
Ivory Coast
Cameron
GHANA
Uganda
0% 10% 20% 30% 40% 50% 60% 70%
15%
36%
41%
45%
56%
58%
While feature phones and increasingly, smartphones, are opening up internet access to the masses, mobile broadband (MBB) includes a range of other devices that are capable of offering higher speed mobile broadband access. MBB penetration rates also vary sharply across SSA, with a number of countries having penetration rates below 1% as of the middle of 2013 (these include Cameroon, Niger and Ethiopia). At the other end of the scale, South Africa already has a MBB penetration rate approaching 30%, well ahead of the global average and meaning that almost one in three people in the country have a mobile broadband subscription.
Although we are still at the early stages of mobile broadband and smartphone penetration in SSA, we are already seeing strong data growth in many markets. For example, MTN reported 63% growth in data volumes in its South African operations in the first half of 2013. Users are also tending to consume more data over time, reflecting both the increasing familiarity with data services as well as the likely impact of upgrading to more advanced handsets including smartphones which tend to generate higher data volumes.
Vodacom reported in its H1 2013 results that users in South Africa were on average generating 75% more data traffic per device than a year ago, while the price per MB of data had fallen 25% in the six months since December 2012.
While South Africa is one of the most advanced markets in SSA for mobile data usage, there is a similar pattern of strong data growth across most of the region. Indeed, coming from a lower base, data volumes and revenues are growing more quickly in other countries. MTN saw data revenues grow by between 35% and almost 60% in five markets in the first half of 2013.
MTN Data Revenue Growth – H1, 2013 “YoY”

27
Table of Content
Introduction about the 4G LTE Network in the World
Executive Summary
Overview of Africa Market.
LTE and 3G Market trends in Africa.
LTE Strategy.
28
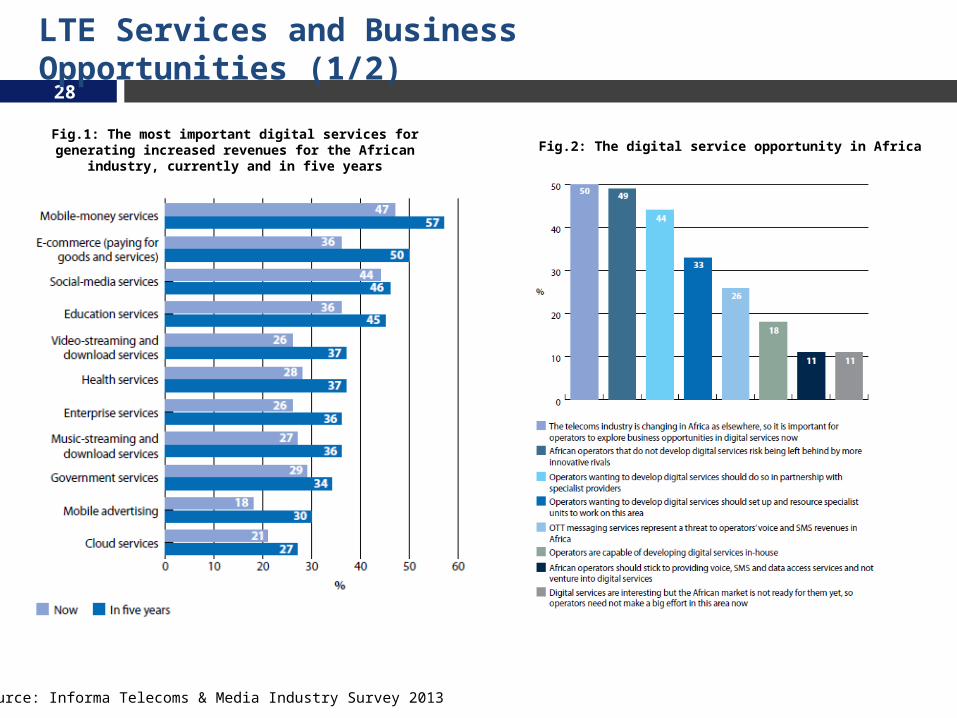
LTE Services and Business Opportunities (1/2)
Fig.1: The most important digital services for generating increased revenues for the African industry, currently and in five years
Fig.2: The digital service opportunity in Africa
(*) Source: Informa Telecoms & Media Industry Survey 2013

29
LTE Services and Business Opportunities (2/2)
Whether it is mobile financial services – where most MNOs in Africa are advanced in their strategies – e-commerce or
entertainment services, such as music or video services, digital services are at the center of MNO business models today. Half
the respondents to our survey strongly agreed that it is important for MNOs to seize new digital opportunities now (see fig. 2)
and a similar proportion agreed those that do not risk their very survival at the hands of more innovative competitors.
But what does this opportunity consist of? Given the relative sophistication of mobile-money services in Africa, it is perhaps
little surprise that nearly half the survey’s respondents thought that mobile money was the most important type of digital
service as a revenue generator currently (see fig. 1). It is perhaps a little surprising, however, that over half of the respondents
believe these services will still form the greatest digital business opportunity in five years time.
There is a general recognition that e-commerce can also become a big revenue opportunity: Another indication that MNOs
are expecting an increased wallet share from an emerging middle class able to spend more of its disposable income on
consumer electronics and brands. Social media is also growing in popularity, as discussed previously, but so too are “utility”
services for education, health and government services, according to our survey. Finally, 37% of our respondents point to
video streaming and downloading growing as a revenue source over the next five years: This will depend on the take-up rate
of LTE technology.
(*) Source: Informa Telecoms & Media Industry Survey 2013

30
Africa, smartphone connection forecasts, 2012-2018
Low-cost smartphones are the key enabler of mobile data access in Africa
(*) Source: Informa Telecoms & Media Industry Survey 2013
Smartphone penetration in Africa is low at present, with smartphones accounting for just 11% of mobile connections at end-2012, compared with an average of 21% globally.
However, smartphones and other data-capable devices are becoming increasingly affordable as a result of competition, technological developments and economies of scale in the device business, as well as the marketing efforts of operators and others. As a result, the number of smartphone connections in Africa will rise from about 79 million at end-2012 to 412 million by 2018, according to forecasts.
The arrival in the African market of low-cost smartphones, many of which are made by Chinese manufacturers and typically use the Android OS, is one of the key factors driving the increase in smartphone penetration on the continent.
Many African operators are also striving to make smartphones and other data devices more widely available and affordable, by forming partnerships with device manufacturers and, in some cases, by setting up device payment plans with finance companies.
Ex. Kenya’s Safaricom has been active in its promotion of smartphones, especially lower-priced devices that are likely to be affordable in the local market. Safaricom set the tone for its smartphone strategy with its launch in January 2011 of the Huawei Ideos, an Android-based smartphone that Safaricom offered at a retail price of KES8,500, equivalent to aboutUS$100). The Ideos launch was regarded as a majorsuccess and Safaricom has followed it up with other similarsmartphone initiatives.
31
Unless a multi-band, affordable LTE smartphone appears on the horizon, LTE phones are going to be irrelevant to
the vast majority of people on the continent. However, the potential for LTE data is huge. Data dongles, which are
much more affordable (about ~US$ 70), can be used to backhaul data to a community and serve a variety of
consumers. This is what makes WiFi such an important complementary technology as WiFi-enabled phones and
tablets tethered to an LTE-powered hotspot are a much higher high-value proposition than a single smartphone. A
challenge remains in the economics of bringing LTE to sparsely populated rural areas but what hopefully we are
beginning to see now is the emergence of a much more interesting and potentially resilient ecosystem of
communication access where a variety of technologies can serve the last mile: LTE, WiFi, whitespaces, and
inevitably some things we haven’t imagined yet
How Africa’s LTE Future Might Be Different

32