Embed Size (px)
Citation preview


Intro:Loyalty 3.0
Part 1: 7 Steps to Build Your Case
Part 2: The Top Ten Metrics

BIG DATA GAMIFICATIONLOYALTY
3.0+ =MOTIVATION +
The 5 Intrinsic
Motivators:
Autonomy
Mastery
Purpose
Progress
Social
Gartner’s
3Vs:
Volume
Velocity
Variety
The 10 Key
Gamification
Mechanics:
Fast Feedback
Transparency
Goals
Badges
Leveling Up
Onboarding
Competition
Collaboration
Community
Points

Part 1:
7 Steps to Build Your Case

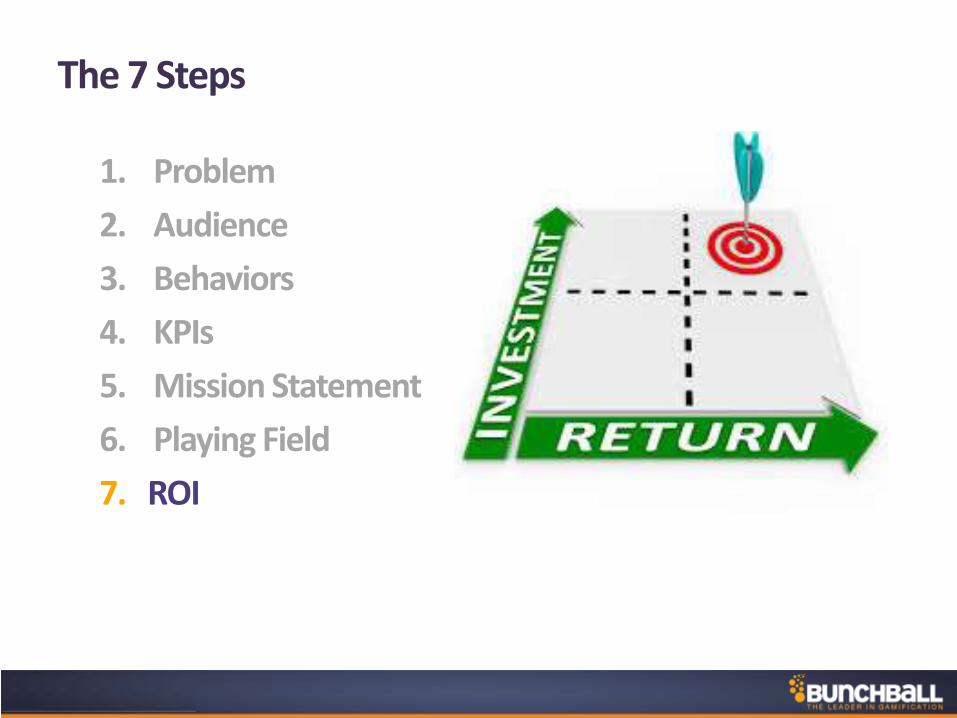
The 7 Steps
1. Problem
2. Audience
3. Behaviors
4. KPIs
5. Mission Statement
6. Playing Field
7. ROI
Workshop 1: 7 Steps
The 7 Steps
1. Problem
2. Audience
3. Behaviors
4. KPIs
5. Mission Statement
6. Playing Field
7. ROI

The 7 Steps
1. Problem
2. Audience
3. Behaviors
4. KPIs
5. Mission Statement
6. Playing Field
7. ROI
The 7 Steps
1. Problem
2. Audience
3. Behaviors
4. KPIs
5. Mission Statement
6. Playing Field
7. ROI
The 7 Steps
1. Problem
2. Audience
3. Behaviors
4. KPIs
5. Mission Statement
6. Playing Field
7. ROI

KPI Definition
1. Increased Adoption & Continuous Engagement of business tools
2. Influence and motivate specific behaviors impacting enterprise success
• Increased activity
• Faster on-boarding
Short-term adoption (Quick wins) Long-term engagement
• Better data for management decision-making (CRM)
• Increased compliance (HCM)
Significantly different business outcomes are driven by these measures…
• Points, Goals, Competition
• Mastery, Leveling up
+ Game Mechanics*
*Most if not all of the 10 game mechanics can lead to increases in long term engagement when applied correctly, specifically Fast Feedback, Transparency & Goals.
• Increased pipeline• Increased User-Generated Content• Productivity Increase• Proficiency Increase
• Goals related to leads & sharing• Newsfeeds, Community• Progress, Goals, Competition• Leveling Up
• Increase Sales (CRM)• Increased call deflection (Social Collaboration)• Decreased time to resolution(CRM)• Higher customer satisfaction (CRM)

The 7 Steps
1. Problem
2. Audience
3. Behaviors
4. KPIs
5. Mission Statement
6. Playing Field
7. ROI
gamification + KPIs = goal attainment
The 7 Steps
1. Problem
2. Audience
3. Behaviors
4. KPIs
5. Mission Statement
6. Playing Field
7. ROI
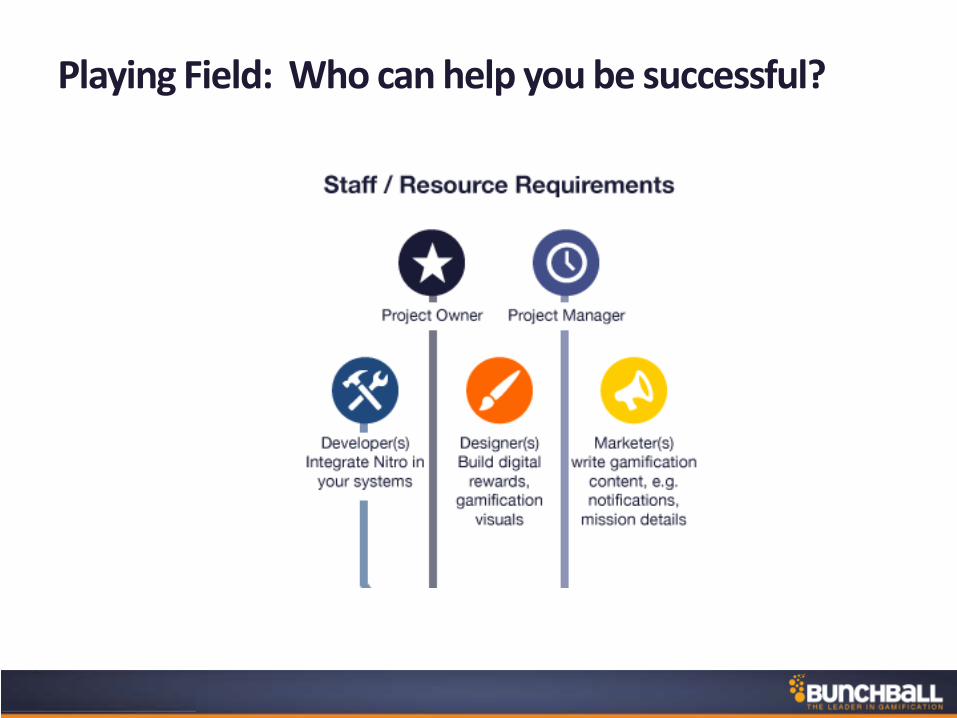
Playing Field: Who can help you be successful?
The 7 Steps
1. Problem
2. Audience
3. Behaviors
4. KPIs
5. Mission Statement
6. Playing Field
7. ROI

The 7 Steps – Complete!
1. Problem
2. Audience
3. Behaviors
4. KPIs
5. Mission Statement
6. Playing Field
7. ROI

The 7 Steps Become Your Business Case
5. Mission Statement
4. KPIs
7. ROI
6. Playing Field
1. Problem
2. Audience
3. Behaviors
This will empower you to sell to internal stakeholders.
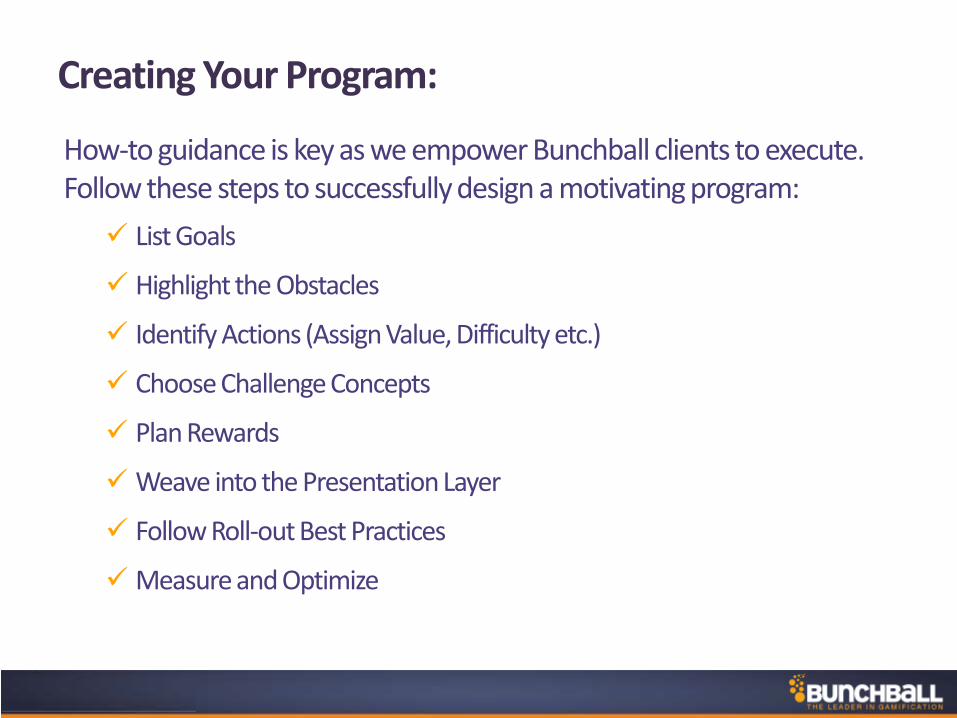
Creating Your Program:
How-to guidance is key as we empower Bunchball clients to execute. Follow these steps to successfully design a motivating program:
List Goals
Highlight the Obstacles
Identify Actions (Assign Value, Difficulty etc.)
Choose Challenge Concepts
Plan Rewards
Weave into the Presentation Layer
Follow Roll-out Best Practices
Measure and Optimize
Part 2
Top 10 Metrics
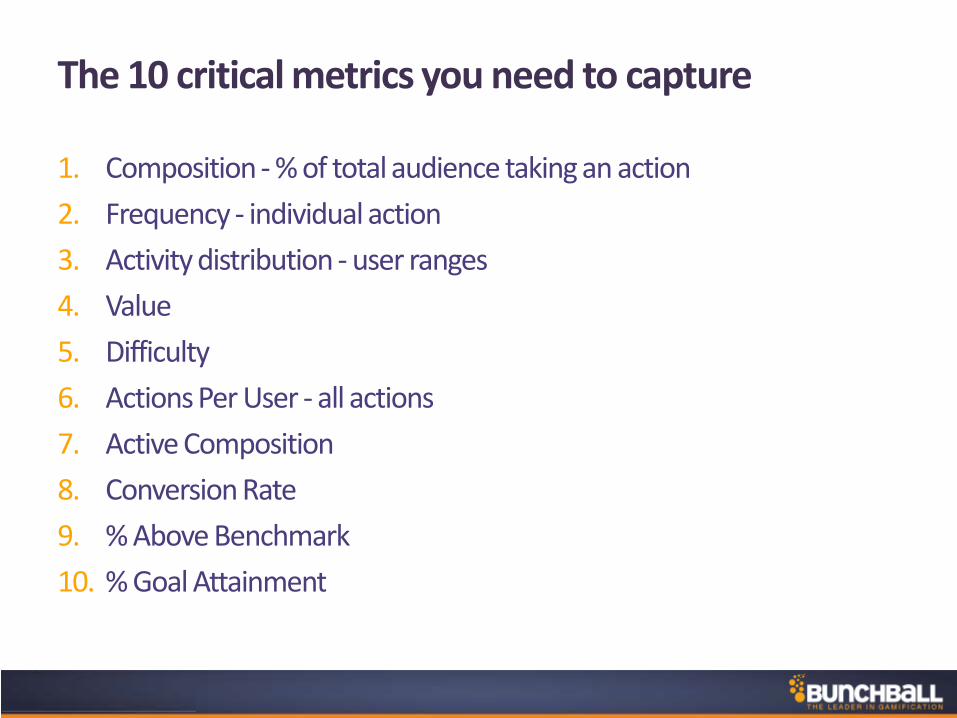
The 10 critical metrics you need to capture
1. Composition - % of total audience taking an action
2. Frequency - individual action
3. Activity distribution - user ranges
4. Value
5. Difficulty
6. Actions Per User - all actions
7. Active Composition
8. Conversion Rate
9. % Above Benchmark
10. % Goal Attainment

Easy ways to make those metrics actionable
Benchmarks: comp, fqcy
• Create your points economy using: Vol, Diff, Fq, Comp
• Create challenges using: activity distribution
• Monitoring: APU, Active Composition
• Goal Attainment: % increase, conversion rate, thermometer
General Optimization:
• If APU/%Active Comp is low: Introduce new challenges to focus on areas that need add'l motivation
• If drop off between levels: adjust levels to be more attainable,
• When introducing new (above) creating proactive feedback with Notifications (either alerts or reminders)
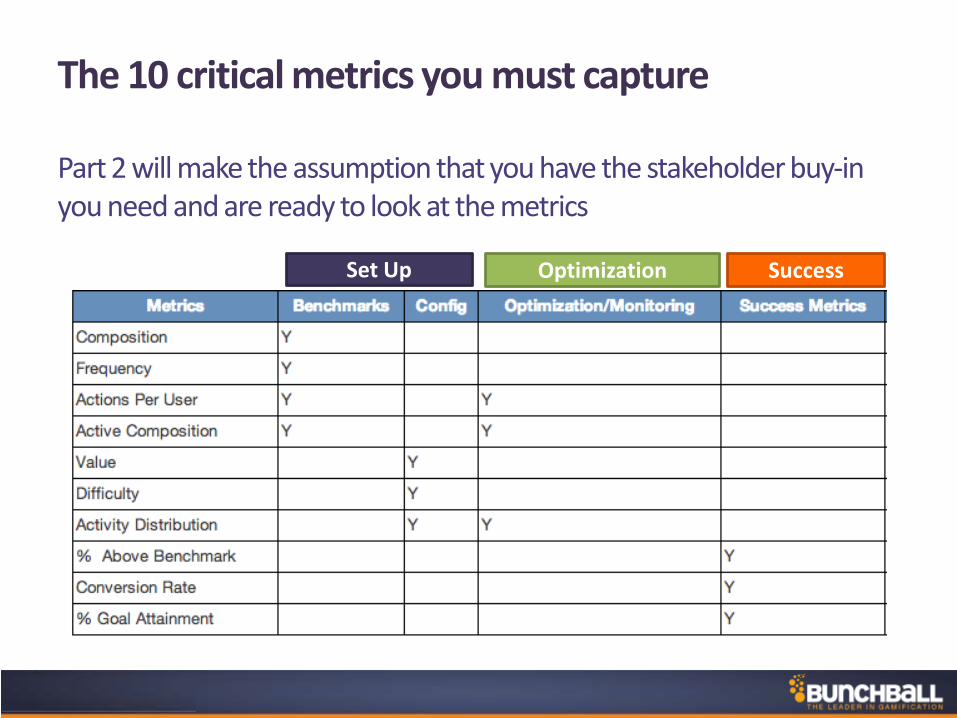
The 10 critical metrics you must capture
Part 2 will make the assumption that you have the stakeholder buy-in you need and are ready to look at the metrics
Set-upSet Up Optimization Success
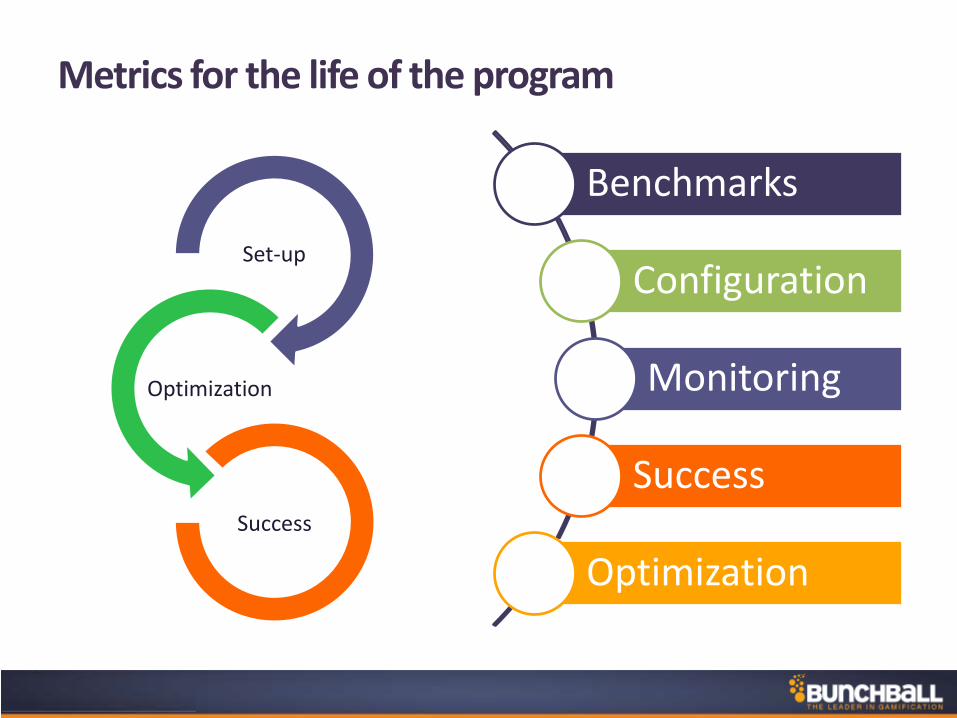
Metrics for the life of the program
Benchmarks
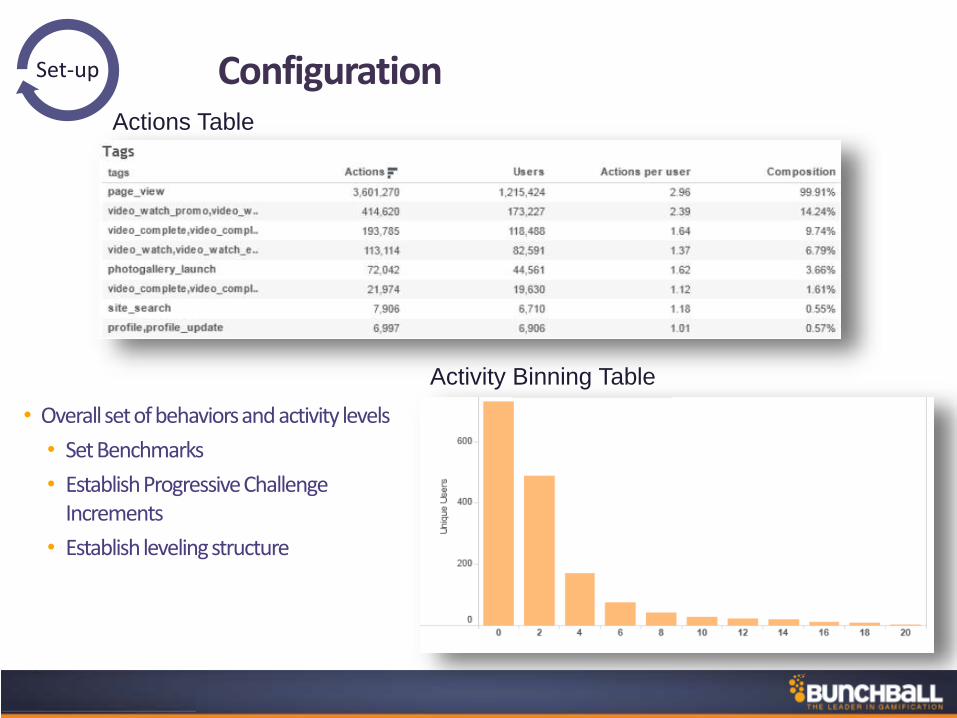
Configuration
Monitoring
Success
Optimization
Set-up
Optimization
Success
Configuration
• Overall set of behaviors and activity levels
• Set Benchmarks
• Establish Progressive Challenge Increments
• Establish leveling structure
Actions Table
Activity Binning Table
Set-up

Squishy Metrics
• Subjective metrics aid in the nuanced components
• Value: How important is the activity to the business
• Difficulty: How difficult is the activity for the audience?
• 3 ways to be more confident
• Survey
• Composition data
• Panel of experts
Set-up

Identify Actions, Assign Value, DifficultySet-up
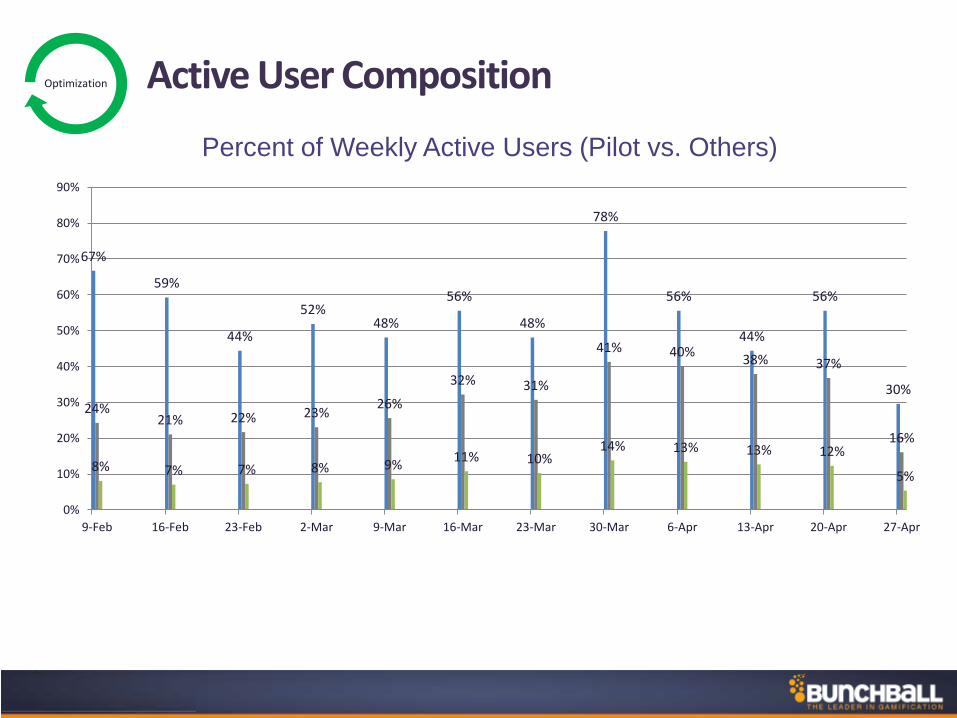
Active User Composition
Percent of Weekly Active Users (Pilot vs. Others)
67%
59%
44%
52%48%
56%
48%
78%
56%
44%
56%
30%
24%21% 22% 23%
26%
32% 31%
41% 40%38% 37%
16%
8% 7% 7% 8% 9%11% 10%
14% 13% 13% 12%
5%
0%
10%
20%
30%
40%
50%
60%
70%
80%
90%
9-Feb 16-Feb 23-Feb 2-Mar 9-Mar 16-Mar 23-Mar 30-Mar 6-Apr 13-Apr 20-Apr 27-Apr
Optimization

Usage over time (Actions)
• Actions for Access System and Content View remained stable to slightly lower over the course of the pilot.
Optimization

Leveling Analysis
0%
10%
20%
30%
40%
50%
60%
70%
80%
90%
Level 1 Level 2 Level 3
Current Adobe Level-up 2011 Results Other Nitro Products
• Users see value \as denoted by the high matriculation rates of current users.
• 42% of all users completed level 3 of the program. A 5% increase since the early 2012 beta.
• Overall matriculation is high when compared to benchmarks from other Nitro instances.
Source: ww.slideshare.net/gzicherm/mira-dontcheva-learning-how-to-use-adobe-photoshop-through-
gamification. “Other Nitro Products” a compilation of 7 Enterprise clients with Level-Based on-boarding
programs.
Optimization

User In/Out Points
1 Out 57,035
2 Out 53,410
3 Out 50,615
4 Out 45,500
5 Out 41,010
6 Out 40,870
7 Out 37,200
8 Out 34,435
9 Out 34,185
10 Out 32,000
11 Out 28,130
12 Out 26,825
13 Out 26,295
14 Out 25,980
15 Out 25,690
16 Out 25,080
17 Out 24,395
18 Out 22,925
19 Out 19,830
20 Out 19,100
21 In 5,450
22 In 5,080
23 In 3,905
24 In 3,450
25 In 3,210
26 In 3,200
27 In 3,110
The Economy
• On prem users appear to
have an inequitable
stake in the gamification
efforts.
Optimization

Persona Recognition
• Base ideal state of behaviors on various scenarios
Pareto Analysis
Optimization

Benchmark Comparisons - Setup
• More users answering questions instead of employees• Customers engaged in the community more likely to renew• Vibrant community attracts customers• 40% increase in support call deflection
Success

• Relating activity to Sales performance shows a strong, statistically significant relationship.
Business Impact: High value actions are correlated to sales performance
Success

Creating Your Program:
How-to guidance is key as we empower Bunchball clients to execute. Follow these steps to successfully design a motivating program:
List Goals
Highlight the Obstacles
Identify Actions (Assign Value, Difficulty etc.)
Choose Challenge Concepts
Plan Rewards
Weave into the Presentation Layer
Follow Roll-out Best Practices
Measure and Optimize