Embed Size (px)
Citation preview

Reimagining South Asia in 2030
Parallel Session B3Fostering Connectivity and Economic Integration in South Asia: Role of Private Sector
Presentation by
Mr Ahmad Shah MobarizResearch Board Member, Porsesh Research and Studies Organization (PRSO)
Afghanistan
16 October 2016

Ninth South Asia Economic Summit
by:
Ahmad Shah Mobariz
Research Board Member, Porsesh Research and Studies Organization (PRSO)
Lecture, Faculty of Economics, Ibn-e-Sina (Avicenna) University, Kabul
Trade complimentarity in South Asia
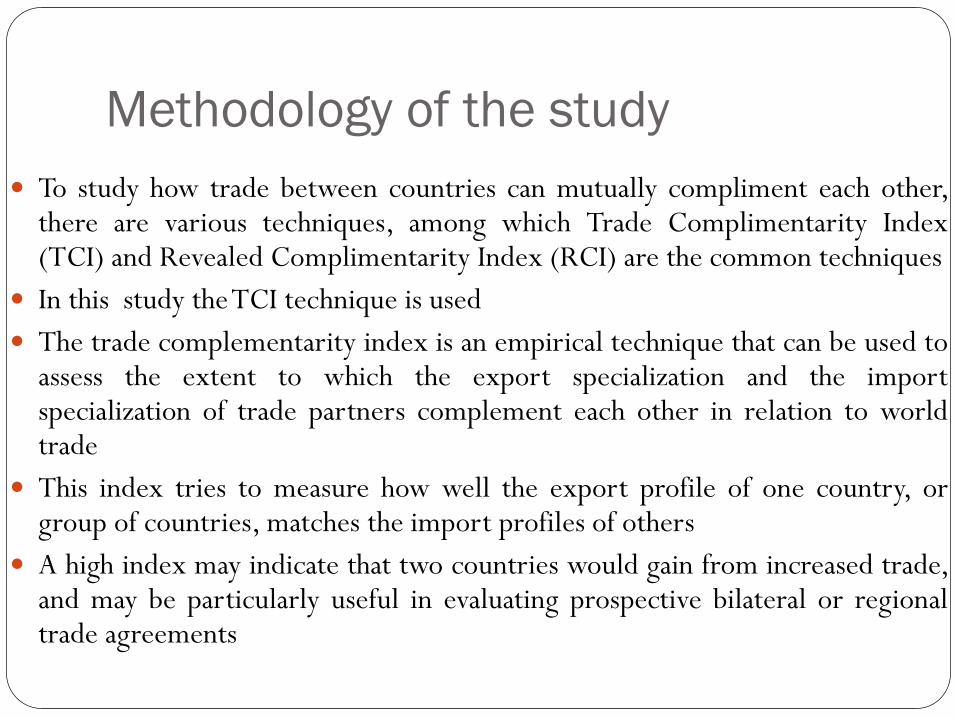
Methodology of the study
To study how trade between countries can mutually compliment each other,there are various techniques, among which Trade Complimentarity Index(TCI) and Revealed Complimentarity Index (RCI) are the common techniques
In this study theTCI technique is used
The trade complementarity index is an empirical technique that can be used toassess the extent to which the export specialization and the importspecialization of trade partners complement each other in relation to worldtrade
This index tries to measure how well the export profile of one country, orgroup of countries, matches the import profiles of others
A high index may indicate that two countries would gain from increased trade,and may be particularly useful in evaluating prospective bilateral or regionaltrade agreements

TCI in South AsiaTrade Complimentarity Index in South Asia
Countries Year Afghanista
n
Bangladesh Bhutan India Nepal Maldives Pakistan Sri Lanka
Afghanistan 2003 47.58 41.15 51.77 54.78 45.82 52.42 47.85
2008 47.62 44.81 47.33 49.11 49.53 49.92 47.87
2013 45.37 32.69 28.49 31.41 24.69 30.71 31.86
Bangladesh 2003 3.8 31.74 6.4 32.67 10.04 6.66 8.68
2008 18.4 8.23 8.50 34.54 9.55 9.11 10.91
2013 20.14 22.51 17.57 53.47 22.05 17.83 17.98
Bhutan 2003 42.3 42.39 46.86 47.82 35.4 41.74 42.51
2008 21.59 23.57 42.59 39.57 42.46 45.93 41.64
2013 21.46 22.69 20.55 17.17 21.02 22.61 19.01

TCI in South Asia (cont’d)
Countries Year Afghanista
n
Bangladesh Bhutan India Nepal Maldives Pakistan Sri Lanka
India 2003 54.57 51.93 48.19 53.03 46.02 17.35 54.24
2008 53.34 49.67 54.24 63.74 53.51 27.27 64.53
2013 56.41 55.87 59.48 66.89 52.11 21.49 66.94
Maldives 2003 37.08 40.34 31.45 41.97 39.51 36.82 43.19
2008 90.63 36.58 33.23 28.67 32.32 27.84 34.9
2013 85.58 34.5 30.95 74.01 33.05 34.11 33.62
Nepal 2003 51 46.34 43.34 23.29 33.33 36.19 34.4
2008 45.85 52.69 48.25 44.24 51.91 54.1 52.92
2013 30.87 38.46 39.87 32.53 39.01 40.25 33.62
Pakistan 2003 43.47 37.79 38.39 14.09 23.18 24.8 27.2
2008 25.72 44.11 27.22 21.25 48.17 27.01 32.89
2013 35.66 47.54 35.45 18.37 48.06 34.66 31.04
Sri Lanka 2003 46.28 36.18 36.01 18.02 21.98 21.56 18.38

0
10
20
30
40
50
60
Bangladesh Bhutan India Maldives Pakistan Sri Lanka
Trade Complementarity Index between Afghanistan and other South Asian Countries
2003 2008 2013
Ind
exin
Per
cen
tata
ge

0
10
20
30
40
50
60
Afghanistan Bhutan India Nepal Maldives Pakistan Sri Lanka
Trade Complementarity Index between Bangladesh and other South Asian Countries
2003 2008 2013
Inde
xin
Per
cent
atag
e

0
10
20
30
40
50
60
Afghanistan Bangladesh India Nepal Maldives Pakistan Sri Lanka
Trade Complementarity Index between Bhutan and other South Asian Countries
2003 2008 2013
Inde
xin
Per
cent
age

0
10
20
30
40
50
60
70
80
Afghanistan Bangladesh Bhutan Nepal Maldives Pakistan Sri Lanka
Trade Complementarity Index between India and other South Asian Countries
2003 2008 2013
Inde
x in
Per
cent
age

0
10
20
30
40
50
60
70
80
90
100
Afghanistan Bangladesh Bhutan India Nepal Pakistan Sri Lanka
Trade Complementarity Index between Maldives and other South Asian Countries
2003 2008 2013
Inde
x in
Per
cent
age

0
10
20
30
40
50
60
Afghanistan Bangladesh Bhutan India Maldives Pakistan Sri Lanka
Trade Complementarity Index between Nepal and other South Asian Countries
2003 2008 2013
Inde
x in
Per
cent
age

0
10
20
30
40
50
60
Afghanistan Bangladesh Bhutan India Nepal Maldives Pakistan
Trade Complementarity Index between Sri Lanka and other South Asian Countries
2003 2008 2013
Inde
x in
Per
cent
age

0
10
20
30
40
50
60
Afghanistan Bangladesh Bhutan India Nepal Maldives Sri Lanka
Trade Complementarity Index between Pakistan and other South Asian Countries
2003 2008 2013
Inde
x in
Per
cent
age

Results The evidence of trade complementarity in the South Asian region is mixed
The observed pattern implies that trade complementarities in the region haveincreased over time, although they are still at comparatively low levels.
The rise in complementarities together with increasing comparative advantagesuggests that intraregional trade in South Asia certainly has a potential to growover time.
The South Asian region is characterized by an almost identical pattern ofcomparative advantage in a relatively narrow range of products, and that there isa lack of strong complementarity in the bilateral trade structures of South Asiancountries.
Similarities in the trade structures, together with absence of comparativeadvantage in capital intensive and high value-added products (the products thatare normally imported by countries in the region) may have played a role inconstraining the growth of intra regional trade in South Asia.

0
2
4
6
8
10
12
14
16
18
20
2007 2008 2009 2010 2011 2012 2013 2014 2015
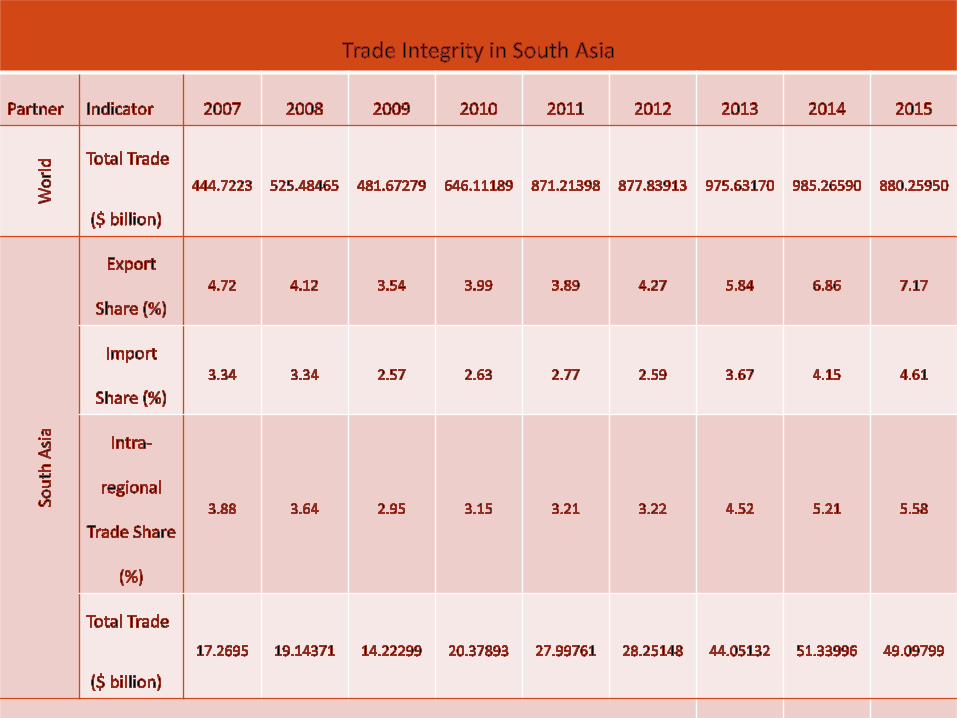
Trade Integrity Trend in South Asia
Export Share (%) Import Share (%) Intra-regional Trade Share (%)
% s
hare

Why failure? lack of political will among member states, border disputes
and terrorism.
High transaction costs between countries and withincountries, despite geographic proximity
The South Asian region scores poorly in surveys such as“Doing Business”
In particular for a country like Afghanistan in whichbusinesses are mainly small scale and if at all they produce forexports, infrastructural facilities in the form of public goodsand financing opportunities is vital both for encouragingdomestic trade and trade with the regional partners.

Infrastructural problems: special case of
Afghanistan
Conclusions and findings South Asian countries are at different stages of production
within an industry, and the exports of one countrycomplements reasonably well with the imports of othercountry, which results in strengthening the potential of intra-regional trade in South-Asia in future.
The values of the trade complementarity indices for the threedifferent points of time indicate that exportcomplementarities of Bangladesh, Pakistan and Sri Lanka, vis-à-vis each other, have improved during the past two decades,although not significantly. As illustrated by the SAFTA,regional cooperation and integration in South Asia continuesto progress but it must be accelerated.

Recommendations Success stories at the sector level will serve as building blocks for further regional
cooperation and integration.
Research and policy work in support of this must be deepened and expanded, and theinstitutional links strengthened.
Greater regional cooperation and integration offers immense opportunities for SAARCmember countries.
Since, mega regional connectivity may waste opportunities due to trust deficit anddifficulty in managing conflicting interests, the potential of sub-regional connectivitymay be explored.
Inclusive and sustainable rapid growth is conditional on continued reduction ofimpediments to doing business together.
With a majority of South Asian countries being trade dependent, trade facilitation can beused to promote trade and investment.
Against the backdrop of low levels of trade complementarity between the major tradingcountries in South Asia, in which India’s exports complement the imports of othercountries reasonably well but the exports of those countries do not complement Indianimports, it is imperative to think of specific means through which intraregional tradecould be expanded in South Asia.

Thank You
تشکر
(tashakor)