Embed Size (px)
Citation preview

Energy trade and connectivity in Asia and the Pacific
Vladimir Krasnogorskiy

0.00
2,000,000.00
4,000,000.00
6,000,000.00
8,000,000.00
10,000,000.00
12,000,000.00
14,000,000.00
16,000,000.00
18,000,000.00
20,000,000.00
Traded Volume (toe)
ENEA major trade flows

ENEA major trade flows 22 of 31 shown
Traded Good Direction
Traded Volume (toe)
Traded value ($million)
1 Oil Russian Federation to China Oil trade 19 724 509 $16 322,98 2 Coal Mongolia to China Coal trade 14 108 273 $1 594,58 3 Coal Russian Federation to Rep. of Korea Coal trade 8 912 604 $1 788,90 4 LNG Russian Federation to Japan LNG trade 8 721 192 $4 733,57 5 Coal Russian Federation to Japan Coal trade 7 962 179 $1 918,55 6 Coal Dem. People's Rep. of Korea to China Coal trade 7 818 368 $1 153,81 7 Coal Russian Federation to China Coal trade 7 401 397 $1 578,21 8 Oil Russian Federation to Japan Oil trade 6 938 958 $5 682,87 9 Oil Russian Federation to Rep. of Korea Oil trade 4 333 659 $3 662,41 10 Coal China to Rep. of Korea Coal trade 3 687 985 $1 014,13 11 Coal China to Japan Coal trade 3 559 595 $1 013,42 12 LNG Russian Federation to Rep. of Korea LNG trade 3 488 536 $1 053,24 13 Oil China to Rep. of Korea Oil trade 314 002 $232,76 14 LNG Russian Federation to China LNG trade 308 357 $195,88 15 Oil Mongolia to China Oil trade 289 862 $225,77 16 Electricity Russian Federation to China Electricity trade 105 048 $51,30 17 Coal Rep. of Korea to China Coal trade 69 426 $7,47 18 Oil China to Japan Oil trade 59 259 $48,94 19 Coal Mongolia to Rep. of Korea Coal trade 44 956 $18,39 20 Electricity Dem. People's Rep. of Korea to China Electricity trade 14 363 $5,65 21 Coal Mongolia to Russian Federation Coal trade 5 444 $0,43 22 Electricity Mongolia to Russian Federation Electricity trade 610 $0,43
TOTAL: 97 868 584,48 $42 303,70

NCA major trade flows
0
1,000,000
2,000,000
3,000,000
4,000,000
5,000,000
6,000,000
7,000,000
Traded Volume (toe)

NCA major trade flows 19 of 23 shown Traded Good Direction
Traded Volume (toe)
Traded value ($million)
1 Oil Russian Federation to Kazakhstan Oil trade 6 579 496 $2 502,42 2 Natural gas Uzbekistan to Kazakhstan Natural gas trade 1 404 199 $177,34 3 Natural gas Russian Federation to Armenia Natural gas trade 1 046 664 $325,97 4 Natural gas Russian Federation to Kazakhstan Natural gas trade 840 020 $65,49 5 Coal Kazakhstan to Kyrgyzstan Coal trade 716 371 $32,46 6 Natural gas Turkmenistan to Kazakhstan Natural gas trade 246 985 $58,42 7 Electricity Kyrgyzstan to Kazakhstan Electricity trade 211 324 $77,23 8 Coal Russian Federation to Kazakhstan Coal trade 154 977 $29,19 9 Natural gas Uzbekistan to Kyrgyzstan Natural gas trade 105 011 $48,62 10 Natural gas Kazakhstan to Kyrgyzstan Natural gas trade 44 283 $20,50 11 Electricity Russian Federation to Kazakhstan Electricity trade 35 758 $99,45 12 Electricity Azerbaijan to Russian Federation Electricity trade 35 562 $24,98 13 Electricity Georgia to Russian Federation Electricity trade 25 606 $17,98 14 Electricity Georgia to Armenia Electricity trade 10 103 $4,70 15 Coal Georgia to Armenia Coal trade 1 750 $0,19 16 Electricity Georgia to Azerbaijan Electricity trade 1 743 $0,61 17 Electricity Russian Federation to Azerbaijan Electricity trade 828 $0,50 18 LNG Kazakhstan to Kyrgyzstan LNG trade 29 $0,08 19 Electricity Uzbekistan to Kyrgyzstan Electricity trade 9 $0,00
11 460 717,95 $3 486,21


SSWA major trade flows
0
2,000,000
4,000,000
6,000,000
8,000,000
10,000,000
12,000,000
14,000,000
Iran to India Oil trade
Iran to Sri Lanka Oil trade
Afghanistan to Pakistan Coal
trade
Turkey to India Oil trade
Traded Volume (toe)

SSWA major trade flows Traded Good Direction Traded Volume (toe) Traded value ($million)
1 Oil Iran to India 13 107 405 $9 488,81
2 Oil Iran to Sri Lanka 1 655 062 $1 354,03
3 Coal Afghanistan to Pakistan 205 834 $36,53
4 Oil Turkey to India 127 114 $85,72
5 Coal Iran to India 60 131 $14,63
6 Electricity Iran to Turkey 26 924 $18,91
7 Electricity Iran to Pakistan 12 025 $8,45
8 Coal Turkey to India 5 250 $0,80
9 Coal Iran to Pakistan 959 $0,18
10 Natural gas Iran to Pakistan 16 $0,01
11 Oil India to Sri Lanka 6 $0,01
15 200 726,82 $11 008,14


0
2,000,000
4,000,000
6,000,000
8,000,000
10,000,000
12,000,000
Traded Volume (toe)
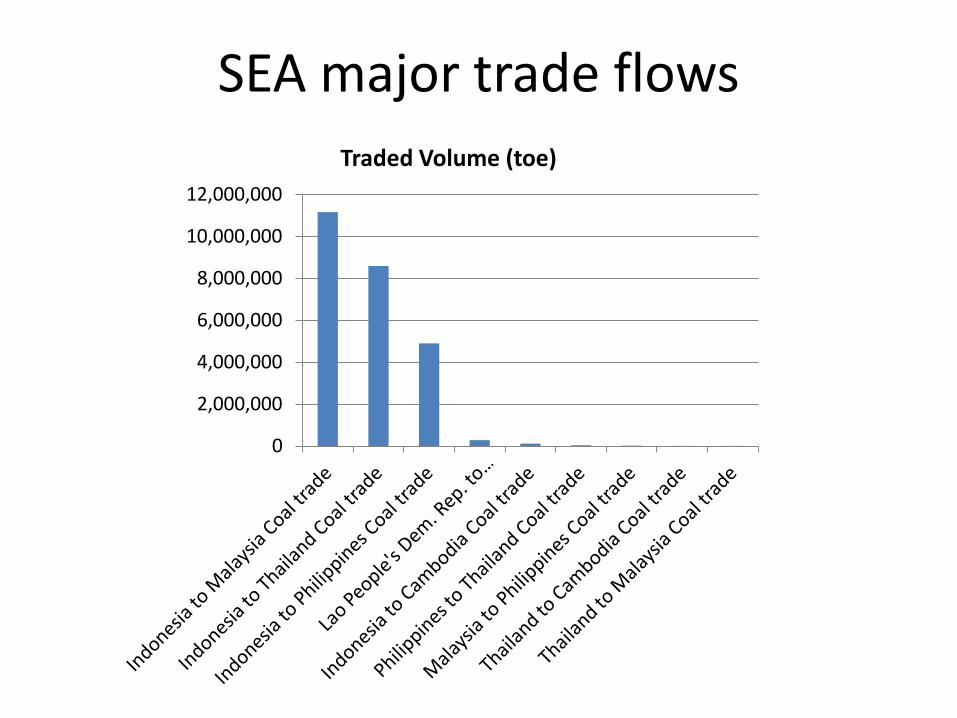
SEA major trade flows

SEA major trade flows 22 of 57 shown Traded Good Direction Traded Volume (toe)
Traded value ($million)
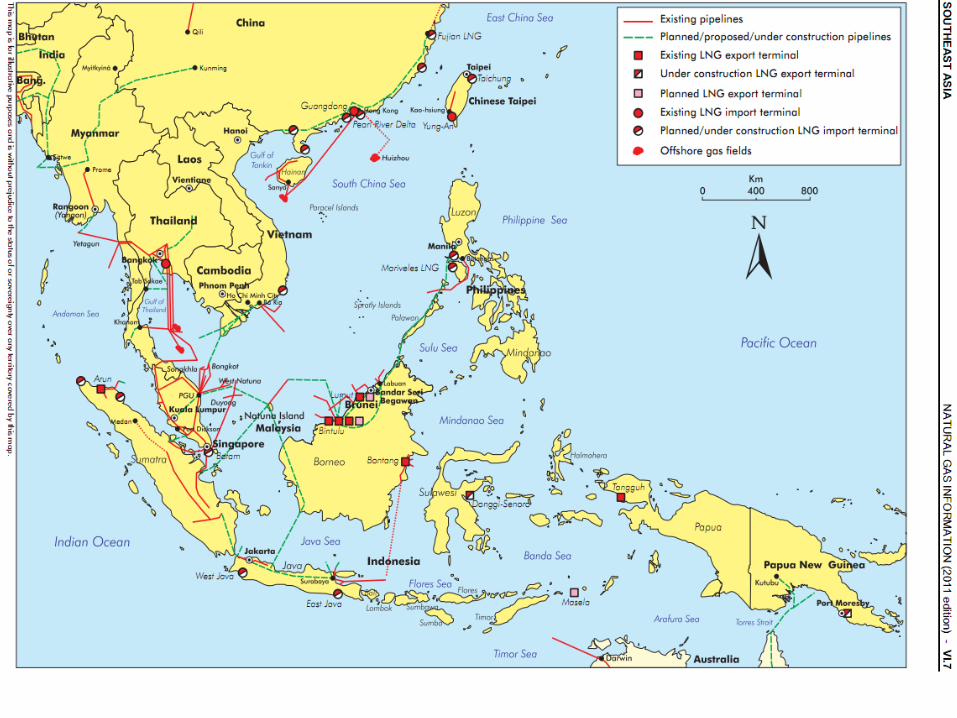
1 Coal Indonesia to Malaysia 11 165 192 $1 638,73 2 Coal Indonesia to Thailand 8 585 981 $1 014,26 3 Natural gas Myanmar to Thailand Natural 8 095 218 $3 074,83 4 Natural gas Indonesia to Singapore Natural 5 250 535 $4 603,86 5 Coal Indonesia to Philippines 4 896 170 $661,08 6 Oil Malaysia to Thailand 2 386 256 $2 192,03 7 Oil Malaysia to Indonesia 1 598 052 $1 361,73 8 Natural gas Indonesia to Malaysia Natural 1 321 084 $296,06 9 Oil Brunei Darussalam to Indonesia 1 207 889 $1 004,93 10 Oil Indonesia to Singapore 715 032 $665,17 11 Electricity Lao People's Dem. Rep. to Thailand 644 052 $452,36 12 Oil Indonesia to Thailand 518 837 $441,99 13 Natural gas Malaysia to Singapore Natural 335 437 $247,36 14 Oil Malaysia to Philippines 293 643 $240,29 15 Oil Indonesia to Malaysia 287 971 $204,20 16 Coal Lao People's Dem. Rep. to Thailand 284 200 $12,38 17 Oil Thailand to Singapore 175 278 $150,43 18 Oil Philippines to Thailand 170 565 $161,55 19 Oil Malaysia to Singapore 164 458 $140,15 20 Oil Singapore to Philippines 148 809 $149,70 21 Oil Brunei Darussalam to Thailand 123 223 $104,87 22 Coal Indonesia to Cambodia 116 566 $15,65
TOTAL: 48 848 620,04 $19 139,20


Subregional trade indices summary Number of flows Traded volume (toe) Value ($million)
ENEA 31 97 868 584,48 $42 303,70 NCA 23 11 460 717,95 $3 486,21 SSWA 11 15 200 726,82 $11 008,14 SEA 57 48 848 620,04 $19 139,20
32%
57%
98%
16%
32%
31%
13% 55%
2%
51%
3%
1%
0% 20% 40% 60% 80% 100%
ENEA
NCA
SSWA
SEA
Oil
Pipeline gas
LNG
Coal
Electricity
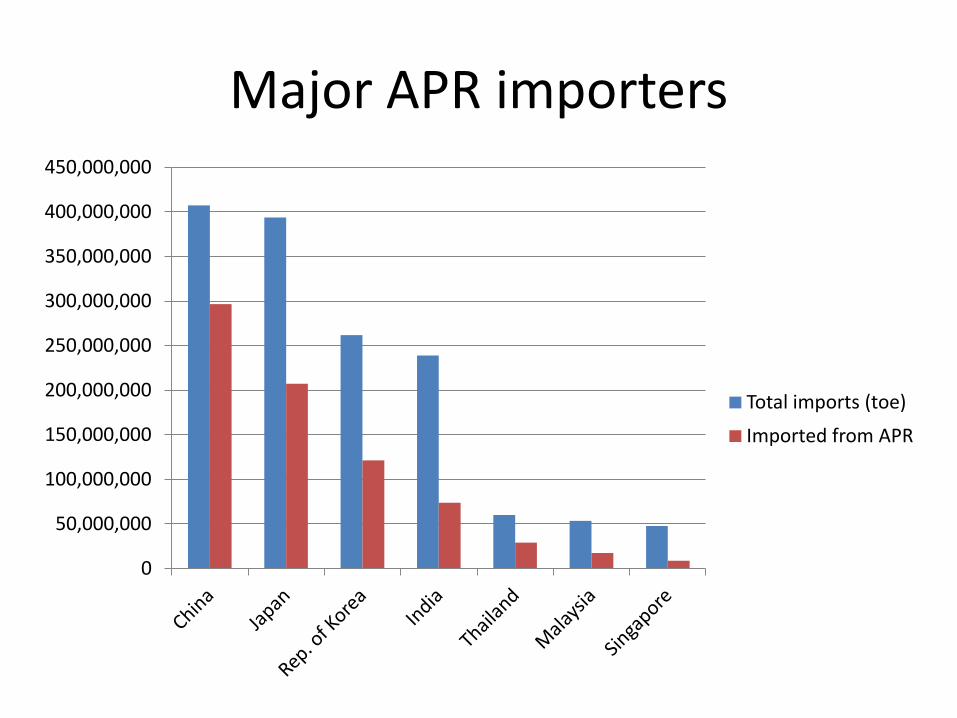
Major APR importers
0
50,000,000
100,000,000
150,000,000
200,000,000
250,000,000
300,000,000
350,000,000
400,000,000
450,000,000
Total imports (toe)
Imported from APR

Major APR exporters
0
50,000,000
100,000,000
150,000,000
200,000,000
250,000,000
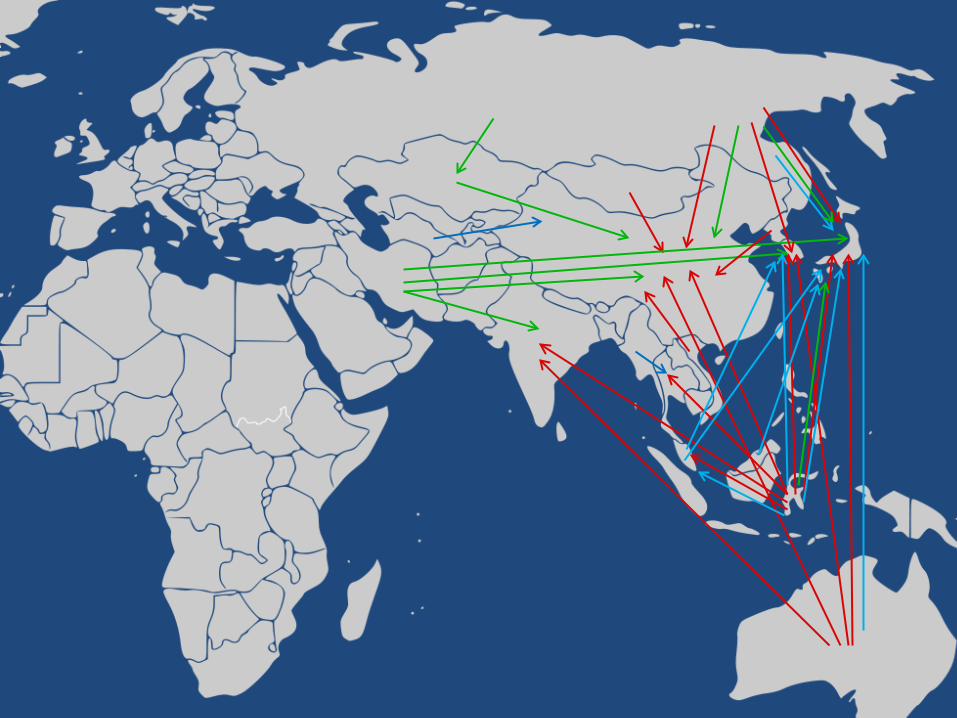
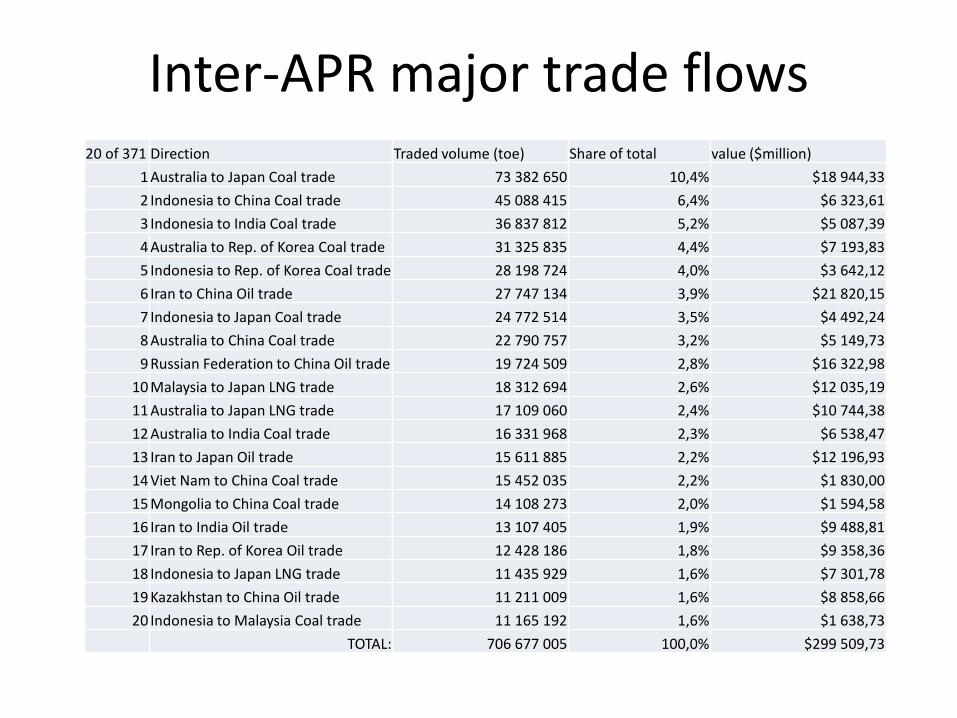
20 of 371 Direction Traded volume (toe) Share of total value ($million) 1 Australia to Japan Coal trade 73 382 650 10,4% $18 944,33 2 Indonesia to China Coal trade 45 088 415 6,4% $6 323,61 3 Indonesia to India Coal trade 36 837 812 5,2% $5 087,39 4 Australia to Rep. of Korea Coal trade 31 325 835 4,4% $7 193,83 5 Indonesia to Rep. of Korea Coal trade 28 198 724 4,0% $3 642,12 6 Iran to China Oil trade 27 747 134 3,9% $21 820,15 7 Indonesia to Japan Coal trade 24 772 514 3,5% $4 492,24 8 Australia to China Coal trade 22 790 757 3,2% $5 149,73 9 Russian Federation to China Oil trade 19 724 509 2,8% $16 322,98
10 Malaysia to Japan LNG trade 18 312 694 2,6% $12 035,19 11 Australia to Japan LNG trade 17 109 060 2,4% $10 744,38 12 Australia to India Coal trade 16 331 968 2,3% $6 538,47 13 Iran to Japan Oil trade 15 611 885 2,2% $12 196,93 14 Viet Nam to China Coal trade 15 452 035 2,2% $1 830,00 15 Mongolia to China Coal trade 14 108 273 2,0% $1 594,58 16 Iran to India Oil trade 13 107 405 1,9% $9 488,81 17 Iran to Rep. of Korea Oil trade 12 428 186 1,8% $9 358,36 18 Indonesia to Japan LNG trade 11 435 929 1,6% $7 301,78 19 Kazakhstan to China Oil trade 11 211 009 1,6% $8 858,66 20 Indonesia to Malaysia Coal trade 11 165 192 1,6% $1 638,73
TOTAL: 706 677 005 100,0% $299 509,73
Inter-APR major trade flows

Trade indices summary Number of flows Traded volume (toe) Value ($million)
ENEA 31 97 868 584 $42 303,70 NCA 23 11 460 717 $3 486,21 SSWA 11 15 200 726 $11 008,14 SEA 57 48 848 620 $19 139,20 APR 371 706 677 005 $299 509,73
32%
57%
98%
16%
28%
32%
31%
4%
13%
13%
55%
2%
51%
55%
3%
1%
0%
0% 20% 40% 60% 80% 100%
ENEA
NCA
SSWA
SEA
APR
Oil Pipeline gas LNG Coal Electricity

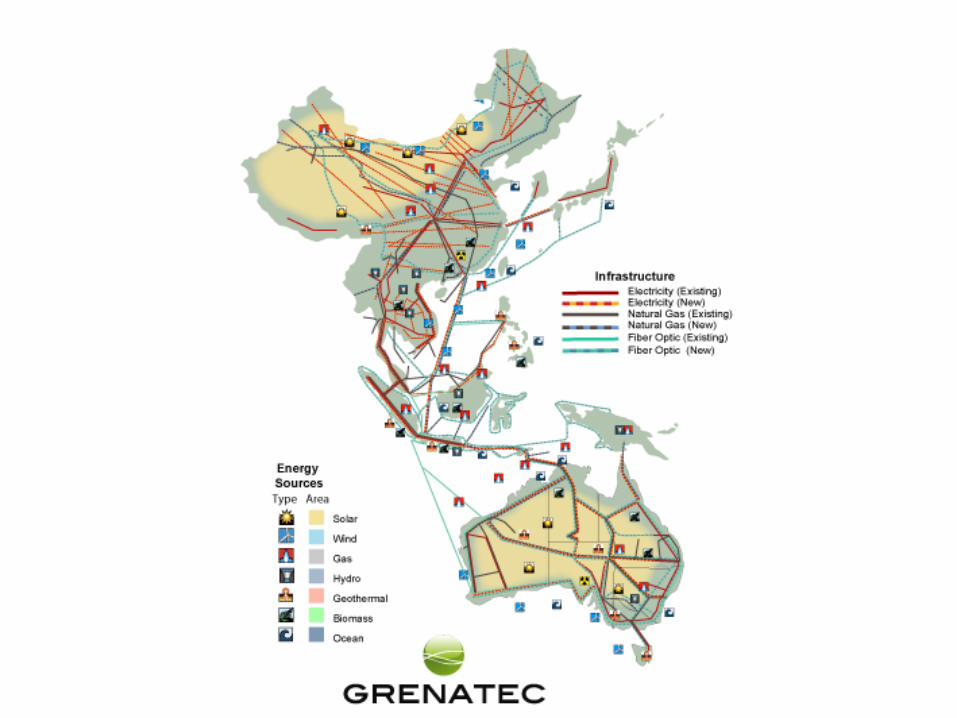
Asian Energy Highway?

Benefits of a large intergrated grid
1. Creation of a vast market resulting in competition and more stable prices (and energy security)
2. Wider opportunities for mitigating peak-loads and more efficient use of existing and new generating capacities (including renewable)

What is needed for creating a region-wide grid
Raw estimates of feasibility
direct implementation suspended implementation

What is needed for creating a region-wide grid
1. Profound feasibility study 2. Investments 3. Implementation management 4. Regulatory frameworks
direct implementation

What is needed for creating a region-wide grid
1. Making sure that the future interconnection is
facilitated 2. Technical consultations between regulators 3. Regulatory consultations between regulators 4. Providing for recommendations for
subregionally interconnected grids
Suspended implementation (development at the subregional level with a view to interconnect in the future)

Source: Global Energy Network Institute

Thank you for your attention!