Embed Size (px)
Citation preview

Retirement BenefitsRetirement BenefitsPresentation by: David Smith & Rhonda PetrPresentation by: David Smith & Rhonda Petr
MSBC 611 * Spalding UniversityMSBC 611 * Spalding University
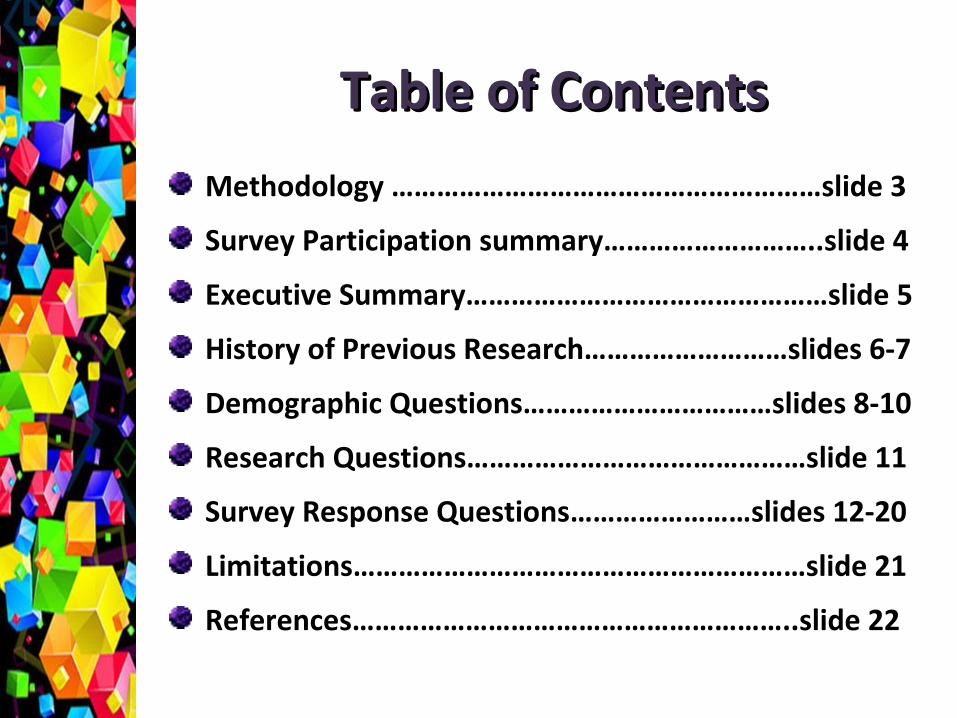
Table of ContentsTable of Contents
Methodology …………………………………………………slide 3
Survey Participation summary………………………..slide 4
Executive Summary…………………………………………slide 5
History of Previous Research………………………slides 6-7
Demographic Questions……………………………slides 8-10
Research Questions………………………………………slide 11
Survey Response Questions……………………slides 12-20
Limitations……………………………………………………slide 21
References…………………………………………………..slide 22
MethodologyMethodology
Self-completed 17 question survey provided to each response taker via the Questionpro.com questionnaire database program. A link to the survey was provided to the respondents via email and social media.
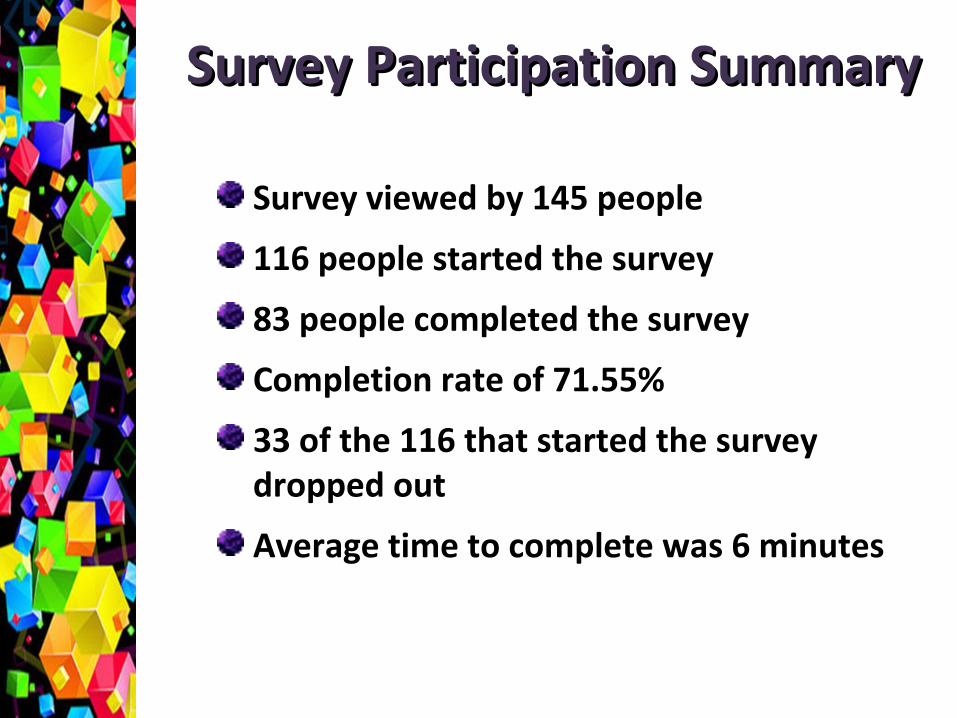
Survey Participation SummarySurvey Participation Summary
Survey viewed by 145 people
116 people started the survey
83 people completed the survey
Completion rate of 71.55%
33 of the 116 that started the survey dropped out
Average time to complete was 6 minutes

Executive SummaryExecutive Summary83 people completed the survey; of that, 78 responded to the gender question. Results were 16 males and 62 females took the survey. Over 79% of people who took the survey were female.
28 out of 78 (35%) total respondents identified themselves as working in the private sector; 46 (59%) work in the public sector; 2 (3%) work in the non-profit sector; and 2 (3%) answered n/a.
N=78 for total respondents who had employers that offered retirement benefits. 81% answered yes, 17% answered no, and 3% answered not sure.
N=77 for total respondents answering as to how satisfied are you with the retirement benefits offered by your employer. 12% were strongly satisfied, 51% were satisfied, 10% were dissatisfied, 5% were strongly dissatisfied, and 22% were neither.

Executive Summary, ContinuedExecutive Summary, Continued
Five (5) possible choices were offered as solutions to remedy the underfunded retirement liability. One (1) being the most favorite choice, and five (5) being the least favorite.
The following were ranked as their overall 1st choice.
Require new employees to enroll in a 401K – 58% (37)
Raise current property taxes – 20% (13)
Change current benefits calculation – 17% (11)
Eliminate retiree healthcare benefits – 3% (2)
Eliminate retirement benefits for current employees – 2% (1)

History of Previous History of Previous ResearchResearch
Karl and Sutton (1998) conducted a survey of 217 full time employees who were employed in various jobs, including the public and private sector. Their results indicated: “Employers need to keep in touch with current employee values in order to design jobs, reward systems, and human resource policies that will result in maximum job satisfaction and productivity.” These results also suggest that the reward systems may not be equally effective in the public verses the private sectors.

History of Previous History of Previous ResearchResearch
According to Yau-De, Chyan, & Kuei-Ying (2012), numerous studies have compared job satisfaction in the public versus the private sector that indicate mixed results. Overall these studies reviewed by Yau-De, et al (2012) found that public employees have an increased satisfaction in their career/employment over employees in the private sector.

DemographicsDemographics

Demographic QuestionsDemographic Questions
What is your age?
What is your gender?
What is the highest level of education you have achieved?
What is annual household income?
Are you in the Private, Public or Non-Profit Sector?
Indicate the type of retirement benefits your employer offers.
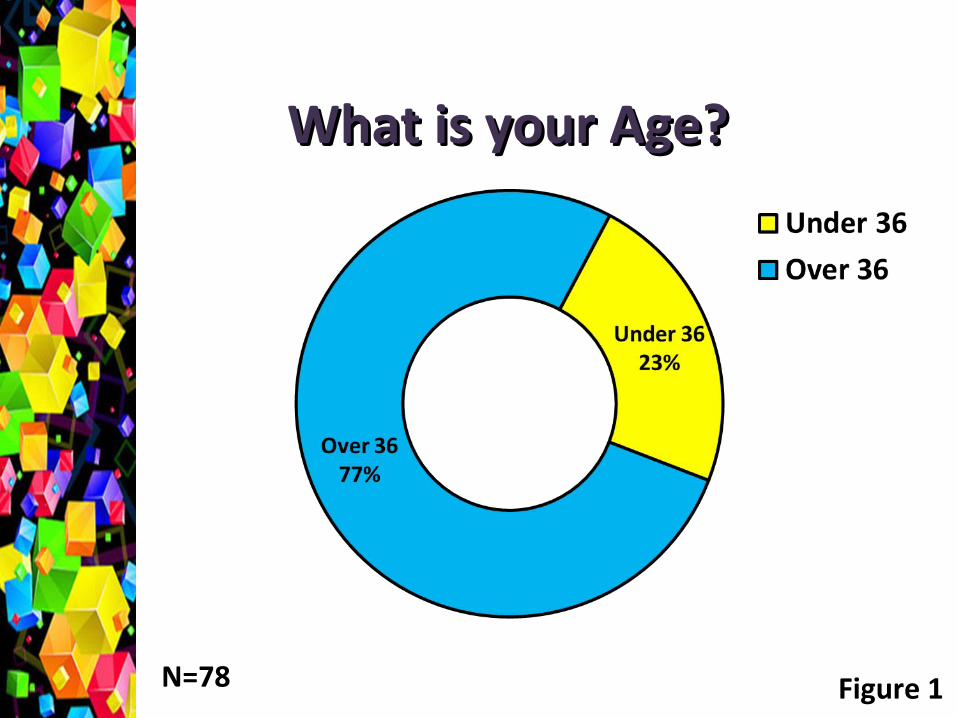
What is your Age?What is your Age?
N=78 Figure 1

What is your gender?What is your gender?
N=78 Figure 2

N=78
Highest Level of EducationHighest Level of Education
Figure 3
N=78
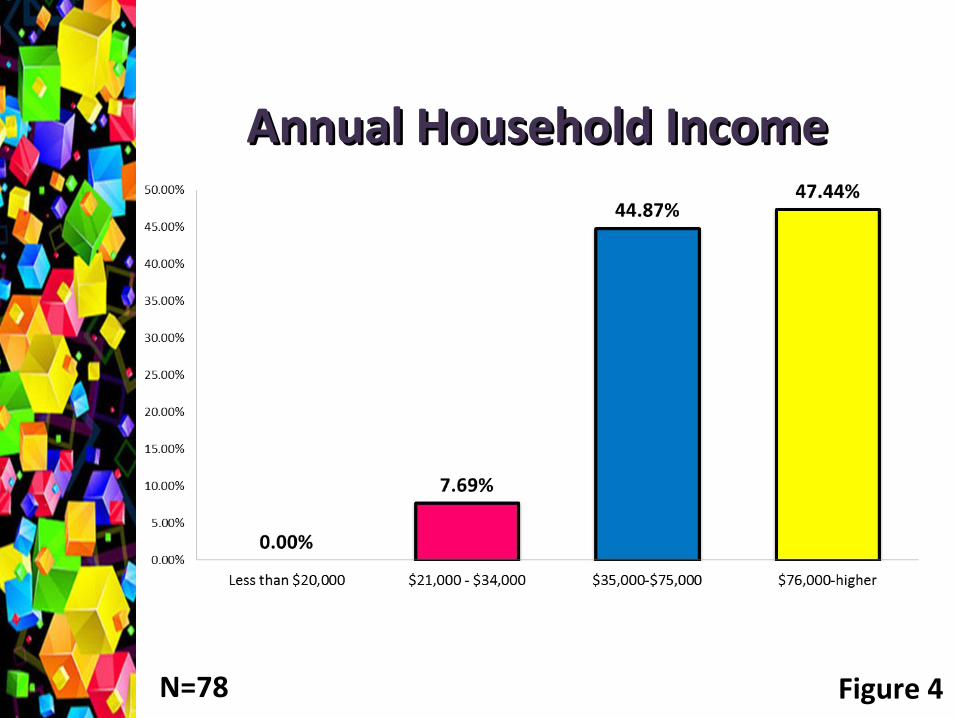
Annual Household IncomeAnnual Household Income
Figure 4

N=78
Indicate if you Work in the Private, Indicate if you Work in the Private, Public or Non-Profit SectorPublic or Non-Profit Sector
Figure 5

Indicate the type of retirement benefits Indicate the type of retirement benefits your employer offersyour employer offers
N=78 Figure 6

Research QuestionsResearch Questions
RQ 1: What is the level of satisfaction amongst public and private sector employees with respect to their retirement benefits?
RQ 2: What is the level of awareness of the Commonwealth of Kentucky’s pension plan funding situation among Kentucky Residents?
RQ 3: What is your attitude toward different solutions to address the Commonwealth of Kentucky’s pension fund shortfall?

Survey Response QuestionsSurvey Response Questions

Does your employer offer Does your employer offer retirement benefits?retirement benefits?
N=78 Figure 7

How satisfied are you with the retirement How satisfied are you with the retirement benefits offered by your current benefits offered by your current
employer?employer?
N=77 Figure 8

Where do you believe the retirement funding Where do you believe the retirement funding levels are for city, county, and Commonwealth of levels are for city, county, and Commonwealth of
Kentucky state employees?Kentucky state employees?
N=78 Figure 9

N=78 Figure 10
How confident are you that the Commonwealth How confident are you that the Commonwealth of Kentucky’s employee’s retirement benefits of Kentucky’s employee’s retirement benefits funds for city, county, and state employees have funds for city, county, and state employees have been properly managed?been properly managed?

Assuming the Commonwealth of Kentucky employee’s Assuming the Commonwealth of Kentucky employee’s pension is underfunded, please indicate which order you pension is underfunded, please indicate which order you would prefer to resolve the issue. Please rank your would prefer to resolve the issue. Please rank your choices from 1-5 (1 being your first choice and 5 being choices from 1-5 (1 being your first choice and 5 being your last.)your last.)
N=none due to ranking question Figure 11

LimitationsLimitations
Time constraints
Inability to reach total population of Kentucky due to budget and accessibility
Electronic survey forum (created problems for survey takers to successfully complete survey)
ReferencesReferences
Karl, K. A., & Sutton, C. L. (1998). Job values in today’s workforce: A comparison of public and private sector employees. Public Personnel Management, 27(4), 515.
Yau-De, W., Chyan, Y., & Kuei-Ying, W. (2012). Comparing public and private employees’ job satisfaction and turnover. Public Personnel Management, 42(3), 557-573.