Embed Size (px)
Citation preview

1 Copyright © 2012, Oracle and/or its affiliates. All rights
reserved. Oracle Proprietary and Confidential.
Running Dry: Smart Water
and Leak Detection
Steven Windsor
March 2013

2 Copyright © 2012, Oracle and/or its affiliates. All rights
reserved. Oracle Proprietary and Confidential.
Agenda
Global Survey: Water stress, barriers & answers
Defining ―smart water‖
The analytical foundation
Detecting leaks – reducing losses
The business case

3 Copyright © 2012, Oracle and/or its affiliates. All rights
reserved. Oracle Proprietary and Confidential.
Survey Details
The Economist Intelligence Unit conducted a survey of 244 senior
water utility executives across the ten countries under review.
All respondents hailed from the management function of their
businesses, with close to one-half (45%) consisting of C-suite
executives.
Organizations of all sizes were polled: 13% have annual revenue in
excess of US$1bn, while 40% are firms with under US$250m in
revenue.
Nearly one-half (48%) are owned by either the state or a local
municipality; the balance are privately owned, barring 6% which
operate as public-private partnerships.

4 Copyright © 2012, Oracle and/or its affiliates. All rights
reserved. Oracle Proprietary and Confidential.
Increased water stress is a foregone conclusion
For most water utilities, increased water stress by 2030 is
a foregone conclusion.
About four in ten executives (39%) polled for this report
think that, given current trends, national water demand
in their countries will outstrip supply by 2030.
A further 54% think such a risk is moderately likely. But
the nature of such stress varies hugely, depending on
local circumstances. •

5 Copyright © 2012, Oracle and/or its affiliates. All rights
reserved. Oracle Proprietary and Confidential.
Increased water productivity is the core
To ensure sufficient supplies, utilities are making wide-
ranging productivity improvements—everything from
plugging leaks to recycling more water.
Investments are rising as well.
Across the ten countries polled, 93% of respondents say
they are increasing their investment in water production
facilities.
More than one in five (22%) utilities surveyed will increase
investment by 15% or more in the next three years.

6 Copyright © 2012, Oracle and/or its affiliates. All rights
reserved. Oracle Proprietary and Confidential.
Wasteful consumer behavior is largest barrier
Across much of the world, water flows out of taps at almost no cost to
the user.
Nearly half (45%) of utilities—especially in developed markets—see
this as their biggest barrier to progress, while a further 33% believe
that tariffs are too low to stimulate greater investment..
In developing countries, a lack of capital for investment tops the list of
concerns (selected by 41%), while worries over climate change are
close behind (38%).
Regulatory difficulties, along with persistent difficulties in attracting the
right skills, further deepen the challenge.

7 Copyright © 2012, Oracle and/or its affiliates. All rights
reserved. Oracle Proprietary and Confidential.
A far greater focus on demand management is
expected
The historical response to rising water demand has been
to build up supply and distribution networks, but much
more emphasis is now being put on cutting water use.
From both a strategic and technological perspective, new
metering and usage awareness programmes top the
measures utilities believe will help reduce use.
Such measures are effective: research suggests a 10-
15% average drop in usage once a meter is installed.

8 Copyright © 2012, Oracle and/or its affiliates. All rights
reserved. Oracle Proprietary and Confidential.
The water industry is experiencing a quiet
boom in innovation
Worldwide, utilities are experimenting with new
techniques, such as improved desalination and aquifer
recharging methods.
Desalination innovations are appearing in far-flung
locations, from California to Queensland.
Network sensors and smart meters, which often link back
to consumers’ smart phones, are helping utilities both to
moderate demand and to find costly leaks more
accurately.
Nonetheless, more than one in three (36%) utilities
surveyed say they are generally unaware of the
innovation options available to them.

9 Copyright © 2012, Oracle and/or its affiliates. All rights
reserved. Oracle Proprietary and Confidential.
Growing
Population density
Growing
Energy needs
Growing
Personal Mobility
Growing
Urbanization
Uncertain
Fuel Supply
Growing
Aging Society
Growing
Commodity Prices
Growing
Resource needs
Growing
Global Warming
Sustainability & Climate
• Water & Waste Cycle
• Energy conservation
• Emissions
management
Urbanization & Mobility
• Smart Homes
• Smart Transport
• Always connected
Energy & Resources
• Smart Grid & Meters
• Renewable energy
• Demand management
Water Interdependencies

10 Copyright © 2012, Oracle and/or its affiliates. All rights
reserved. Oracle Proprietary and Confidential.
The history of smart water
For the past 20 years, water monitoring has included real-
time control and supervision, and advanced hydrological
modelling.
But technology, and needs, have grown. We now have:
• Ubiquitous availability of IT and Communication resources
• Continous deployment of advanced sensing and actuators
• More data enabling new services and actionable insights
• Constantly increasing demand and expansion of distribution
• Regulatory compliance of water quality and sustainability and CO2
emissions,
• Need CAPEX/OPEX balancing and long-term investment & maintenance
planning

11 Copyright © 2012, Oracle and/or its affiliates. All rights
reserved. Oracle Proprietary and Confidential.
Network: Sensors, Meters and actuators deployed throughout the grid
Communication: Low latency, Multi-Modal, real-time communication links
Data Acquisition: Validation, supervision and complex event processing
Information: Dashboards of Key Performance Indicators, Trackers
Asset & Service: Maintenance strategies, field service and schedule optimization
Simulation: What-If scenario analysis, weather, network planning
Defining Smart Water: A System of Systems
Sense Data Inform Act

12 Copyright © 2012, Oracle and/or its affiliates. All rights
reserved. Oracle Proprietary and Confidential.
Setting The Analytical Foundation
Integrated
Analytic
Applications
Any Data,
Any Source
Full Range of
Analytics
On Tablet
On Mobile
On Device

13 Copyright © 2012, Oracle and/or its affiliates. All rights
reserved. Oracle Proprietary and Confidential.
Defining the dashboard for the different lines of business:
• Customer: Interactions, satisfaction, revenue, days sales outstanding
• Service: Number of complaints, issue resolution, escalations
• Finance: Cost recovery, plan/actual deviation, project performance
• Operation: Response time, schedule adherence, service complaints
• Maintenance: Availability, pipe breaks, Unaccounted for Water, order completion
Defining The Analytical Objectives
Customer
AssetsOperation
Customer Satisfaction
Reduced CostStructures
Compliance & Growth
EmployeeEngagement
SustainableBusiness
Business Performance
Network Performance

14 Copyright © 2012, Oracle and/or its affiliates. All rights
reserved. Oracle Proprietary and Confidential.
Leveraging the
full Range of
Water Utility
Data SourcesPerformance
Planed / actual
Devices
Events &ExceptionsNetwork
Model
Measurements
Activities
Unreported usage?
Installation status?
Timely Interval Reads?
What? Activity type
What % normal reads?
How much?
Avg completion time?
What % without measurements?
SCADAReal-Time
Most frequent exceptions?Event type distribution?
Relational Multi-Dimensional Unstructured
Technologies
Reference Model(Simplified example)
Defining The Reference Model

15 Copyright © 2012, Oracle and/or its affiliates. All rights
reserved. Oracle Proprietary and Confidential.
Leveraging the
full Range of
Water Utility
Data Sources
Tools
Unstructured
Analytics
Reporting &
Analysis
Modeling &
Planning
Predictive
Analytics
Content
Moving from Insights to Action

16 Copyright © 2012, Oracle and/or its affiliates. All rights
reserved. Oracle Proprietary and Confidential.
Understanding the Water Balance
SystemInput
Volume
AuthorizedConsumption
Billed Authorized
Consumption
Billed Metered Consumption RevenueWaterBilled Unmetered Consumption
Unbilled Authorized
Consumption
Unbilled Metered Consumption
Non-RevenueWater
Unbilled Unmetered Consumption
Water Losses
Commercial / Apparent
Losses
Unauthorized Consumption
Customer Meter Inaccuracies,Data, Billing and Accounting Errors
Physical / Real
Losses
Leakage on Transmission and Distribution Mains
Leakage and Overflows at Reservoirs
Leakage on service connections up to metering
Non-Revenue Water = System Input Volume – Billed Authorized Consumption

17 Copyright © 2012, Oracle and/or its affiliates. All rights
reserved. Oracle Proprietary and Confidential.
Reasons for Apparent Losses
Current Annual Apparent Losses
Economical Level
Unavoidable Apparent
Losses
• Customer meter inaccuracies
• Unauthorized consumption and illegal connections, theft and fraud
• Data analysis errors between historical, actual and billing data
• Data collection and transfer errors between meter and billing system
Analytical Insight Transforming Data into Reduction of Apparent Losses

18 Copyright © 2012, Oracle and/or its affiliates. All rights
reserved. Oracle Proprietary and Confidential.
Managing Real Losses
Potentially Recoverable Real Losses
Economical Level of Real Losses
Unavoidable Real Losses
• Active leakage management
• Improving speed and quality of ALRAwareness, Location, Repair
• Optimization of the pressure management in the system
• Increased asset reliability and economical maintenance strategy
Analytical Insight Transforming Data into Reduction of Real Losses

19 Copyright © 2012, Oracle and/or its affiliates. All rights
reserved. Oracle Proprietary and Confidential.
Strategies for Reducing Losses
EconomicLevel of NRW
Total Cost = Cost of Water lost +Cost of NRW Management
Cost of water lost
Cost of NRWManagement
NRW
Costs
Awareness Location Repair
Cumulative water lost over time
Vo
lum
e o
f W
ate
r L
os
t
Time
Rationalizing the criteria and priorities toward a NRW reduction strategy:
• Economics: Determining the cost of NRW versus the cost of water
• Process: Assessment and analysis of business processes and best practices
• Integration: Integration of business, engineering and operational areas
• Data Analytics: Transforming data silos into actionable business insights
NRW – Cost Assessment ALR – Process Assessment
20 Copyright © 2012, Oracle and/or its affiliates. All rights
reserved. Oracle Proprietary and Confidential.
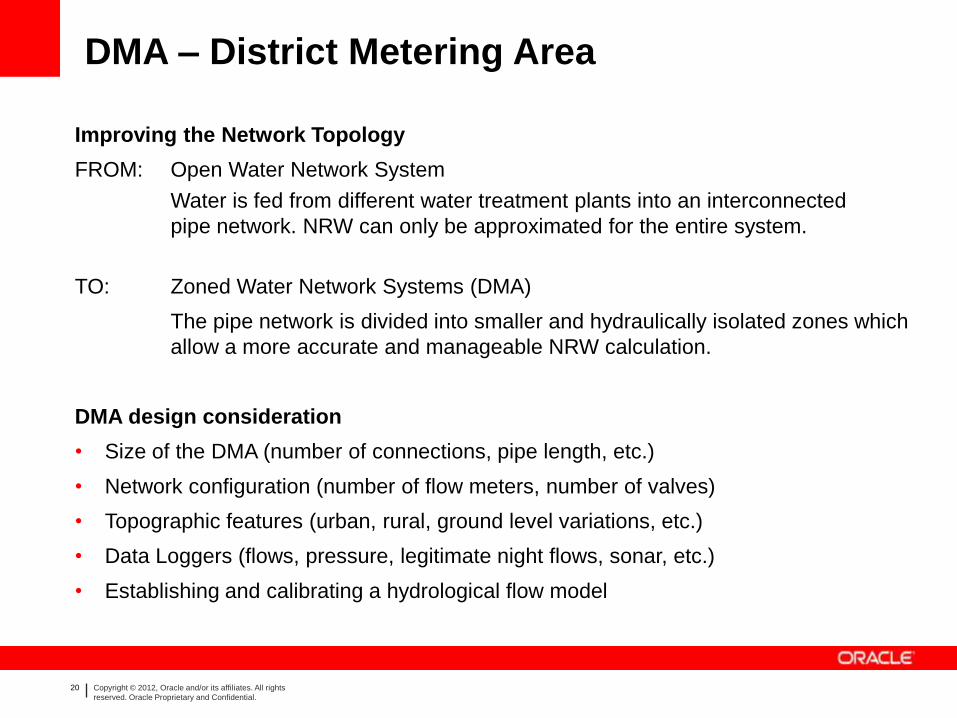
DMA – District Metering Area
Improving the Network Topology
FROM: Open Water Network System
Water is fed from different water treatment plants into an interconnected
pipe network. NRW can only be approximated for the entire system.
TO: Zoned Water Network Systems (DMA)
The pipe network is divided into smaller and hydraulically isolated zones which
allow a more accurate and manageable NRW calculation.
DMA design consideration
• Size of the DMA (number of connections, pipe length, etc.)
• Network configuration (number of flow meters, number of valves)
• Topographic features (urban, rural, ground level variations, etc.)
• Data Loggers (flows, pressure, legitimate night flows, sonar, etc.)
• Establishing and calibrating a hydrological flow model

21 Copyright © 2012, Oracle and/or its affiliates. All rights
reserved. Oracle Proprietary and Confidential.
Water Cycle and Water Balance Insight
GIS
CAD
Planning System
Manual / One-Lines
SCADA / Weather
Field Operations & Mobile
Enterprise Asset Performance
Grid Sensors / Valve Controls
Customer Information System
Model
UpdatesReal-Time
SCADA / GISTelemetry Feeds
Dispatch Tracking
Storm and Weather
Hydrologic / Pressure Data
Sanitation levels
Valve/Pump/Reservoir Feeds
NETWORKWork & Service Performance
Grid Model / Geo-Coding
Hydrological/Pressure Model
District Metering Area
Loggers & Asset conditions
Meter testing & Certification
ERP / EAM/ CISCustomer Billing Records
Meter Data and Location
Link Consumption & Address
Financial & Tariff Information
Asset History & Performance
NRW: Active Management

22 Copyright © 2012, Oracle and/or its affiliates. All rights
reserved. Oracle Proprietary and Confidential.
Resource Planning and Scheduling Common Dispatching Functionality
• Real-time scheduling for optimal assignments and routing
• Takes into account complex factors and rules such as skills, timing, location, cost goals, etc
• Scheduling without boundaries
• Web browser based Dispatcher interface
• Context driven KPI’s and alerts to allow for exception based Dispatching
• Map Viewer to show crews, their activities, their routes
• Best practice workflows for field resources using a wide variety of mobile devices
• Secure asynchronous communication
• Store and forward for disconnected completions when necessary
Mobile Communication Platform
ALR: Awareness – Location – Repair

23 Copyright © 2012, Oracle and/or its affiliates. All rights
reserved. Oracle Proprietary and Confidential.
Net
wo
rkM
ete
rin
gB
illin
gDistrict Metering Area: Analytical Approach
Data Inform Act
Actionable insight:
• Reducing NRW
Levels
• From leak detection
to pipe rehabilitation
• Prioritization of
budgets and
investments
• Improved asset life
via pressure
management
• Safeguarding
continuous supply
and water quality

24 Copyright © 2012, Oracle and/or its affiliates. All rights
reserved. Oracle Proprietary and Confidential.
First Step:
• Establishing high level
cost / benefit matrix
• Technical assessment of current
situation and performance
• Organized processes for
collecting, normalizing, geo-tagging
and associating data
Second Step:
• Validating /adjusting data with
real measurements
• Calibrating network model
• Reviewing analytical approach and integrity of NRW-calculations
• Improving ALR and billing processes
Third Step: Monitoring and institutionalizing continuous improvement process
Implementation Costs
High Medium Low
NR
W V
olu
me
Imp
act
Hig
h •Leakage on mains•Leakage on service connections
•Unauthorizedconsumption
•Unbilled metered consumption
Med
ium
•Customer meter replacement
•Customer metering inaccuracies and data handling errors
•Pressure Management
Low
•Reservoir leakage•Unbilled unmetered consumption
•Reservoir overflows
Suggestions on Where to Start

25 Copyright © 2012, Oracle and/or its affiliates. All rights
reserved. Oracle Proprietary and Confidential.
Key figures for business justification
Water – Loss Reduction
• Reduced costs from water loss and increase revenues
• Reducing energy and chemical consumption
• Increase billing accuracy
Increased Asset Performance
• Increase asset longevity and lower cost of
maintenance
• Improved Infrastructure leakage Index (ILI)
• Reduced pipe breaks / faster ALR turnaround time
Better Service
• Guaranteeing continuous quality water supply
• Reduction of waterborne diseases (biological, mineral, chemical
contamination)
• Improved water service quality (pressure, coloration, odor, salination, etc.)
NRWdecreases
Investments are made in further NRW
reduction programs
Expenditure is increased to include
operational improvement
Revenue increase and operational
Cost decrease

26 Copyright © 2012, Oracle and/or its affiliates. All rights
reserved. Oracle Proprietary and Confidential.
t = 0 Future TimePast Time
Analysis &
Decisions
Objectives
Timeframe
• Quality Incidents
• Leakage
Prevention
• Reducing ALR-
Time
• DMA Monitoring
Current
Conditions
• Preventive Asset planning
• Network & Pressure
Modeling
• Optimizing DMA setups
Historical
Assessment
Reactive
Decision
Making
Proactive
Decision
Making
Predictive
Assessment
Moving from Reactive to Proactive
• Asset Integrity
• Grid Performance
• Financial Results

27 Copyright © 2012, Oracle and/or its affiliates. All rights
reserved. Oracle Proprietary and Confidential.
• Smart Water Networks exist, but still need to become standard and widely adopted
• AquaEconomics – investments into intelligence are understood & largely ROI positive
• Communication and communication links are becoming part of Smart City platforms
• Data acquisition is benefitting from IoT, electricity and ICT innovations
• Analytics has evolved from a passive data holder into a new business resource
BUT
A Solid ICT Platform and high fidelity Data Analytics are needed to achieve sustained
NRW reductions, active leakage prevention and real-time Water Balance insight.
Moving beyond 2013
Sense Data Inform Act

28 Copyright © 2012, Oracle and/or its affiliates. All rights
reserved. Oracle Proprietary and Confidential.
Questions
When the well
is dry, we know
the worth of
water.
Benjamin Franklin
(1706-90)

29 Copyright © 2012, Oracle and/or its affiliates. All rights
reserved. Oracle Proprietary and Confidential.