Embed Size (px)
Citation preview
The Right Road to
Clean Power
The U.S. Environmental Protection Agency (EPA)
describes President Obama’s Clean Power Plan
(CPP) as a “historic” step forward in reducing
carbon emissions from power plants. However,
a closer look reveals yet another government
preference for renewable power that ignores the
current contributions and future potential for
natural gas, nuclear and hydroelectric power.
In many ways, it’s as if the administration has
charted a path forward that completely ignores the
energy superhighway that is built on the back of
traditional zero- and low-emissions power sources.
Instead, the CPP quietly steers the American
electricity sector toward an off-roading adventure
down an uncertain path with an unclear future.
The plan places a premium on the development of new renewable power resources (classified as wind, solar and energy efficiency), offering significant incentives to states that invest heavily in renewables to meet CPP targets. Renewable power shows great potential for the future, but favoring it over other low- and non-emitting sources doesn’t make sense if the goal is really to reduce carbon. There is another way if we follow the signs pointing toward a strong economy and environmental future.
Let Markets WorkAmerica’s energy revolution continues to deliver broad economic benefits while helping to reduce emissions of carbon dioxide (CO2) from energy production to near 27-year lows.1 These reductions are the result of market forces. They have nothing to do with government programs and everything to do with the fact that the United States is the world’s leading producer of natural gas. With such an abundant supply of affordable fuel on hand, power plants already have an incentive to use cleaner-burning natural gas without government interference.
CT
ID ME
RI
CA MA
OR
NJ
NV
NH
NY
MSFLDE
VA
AL AZ GA
LA
OK
WA
TX
HYD
ROCO
ALN
ATU
RAL
GAS
NU
CLEA
R CTNHNJVA
CADEFLLA
MAMSNVNYOK
RITX
ALAZGA
IDMEORWA
36.47% 28.18% 37.58% 28.79%
53.42% 74.14% 61.42% 61.97%42.79% 65.27%
41.28%66.61% 39.99%
29.43% 22.01% 28.23%
44.68%
9.91% 29.96% 15.10% 4.01%
97.81%
Nuclear
STATES WITH BELOWAVERAGE EMISSION RATES
Wind Other
Hydro Coal
Natural Gas
PRIM
ARY
FUEL
SO
URC
ES
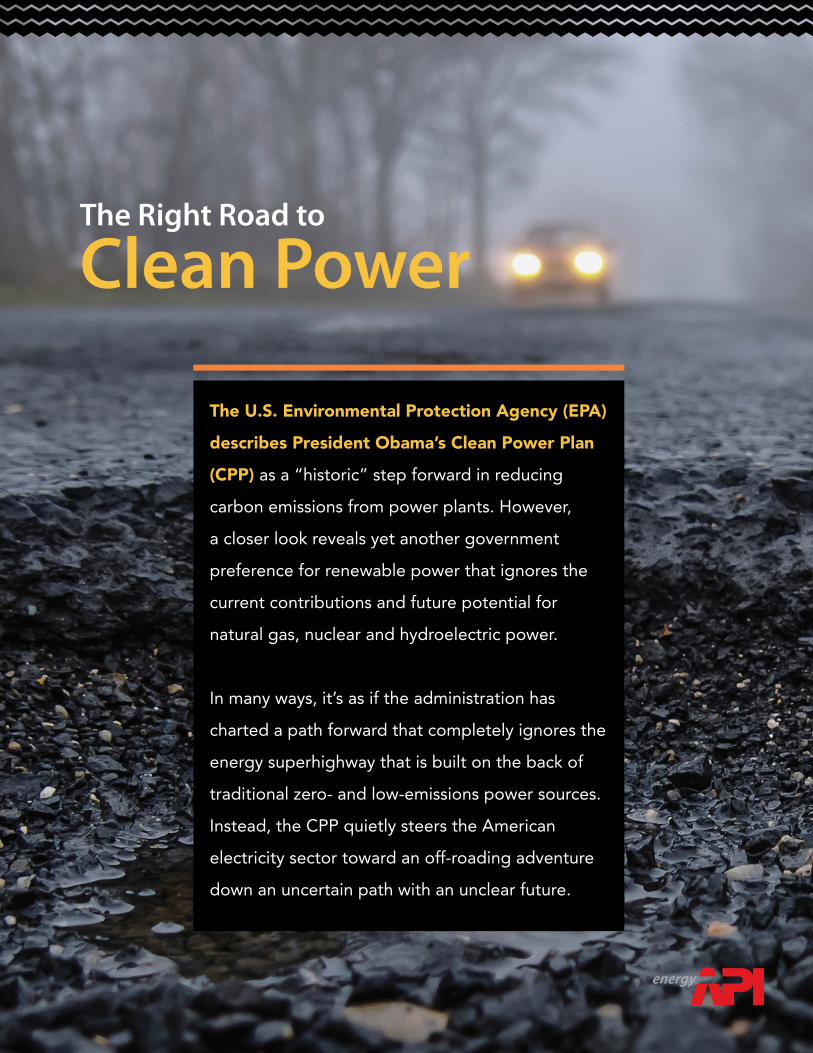
The EPA ignores the strong performance of current low- and no-emission generation leaders (nuclear, hydro and natural gas) in favor of a segment of the power industry that represents less than 7 percent2 of current electricity generation. This interference with the market could have dire economic consequences. All energy sources have a role to play in supplying America’s energy needs. But using regulatory authority to benefit one power source over another in electricity generation could stifle innovation, destroy jobs and raise energy bills for those who can least afford it.
EPA’s own data shows that natural gas is the prime power source in 11 of the 22 states with below average emission rates. An additional eight states in this group rely on natural gas to deliver more than 20 percent of electricity consumed.
EPA’s own data shows that natural
gas is the prime power source in 11
of the 22 states with below average
emission rates.
Source: U.S. Energy Information Administration, State Energy Data System - http://www.eia.gov/state/seds/
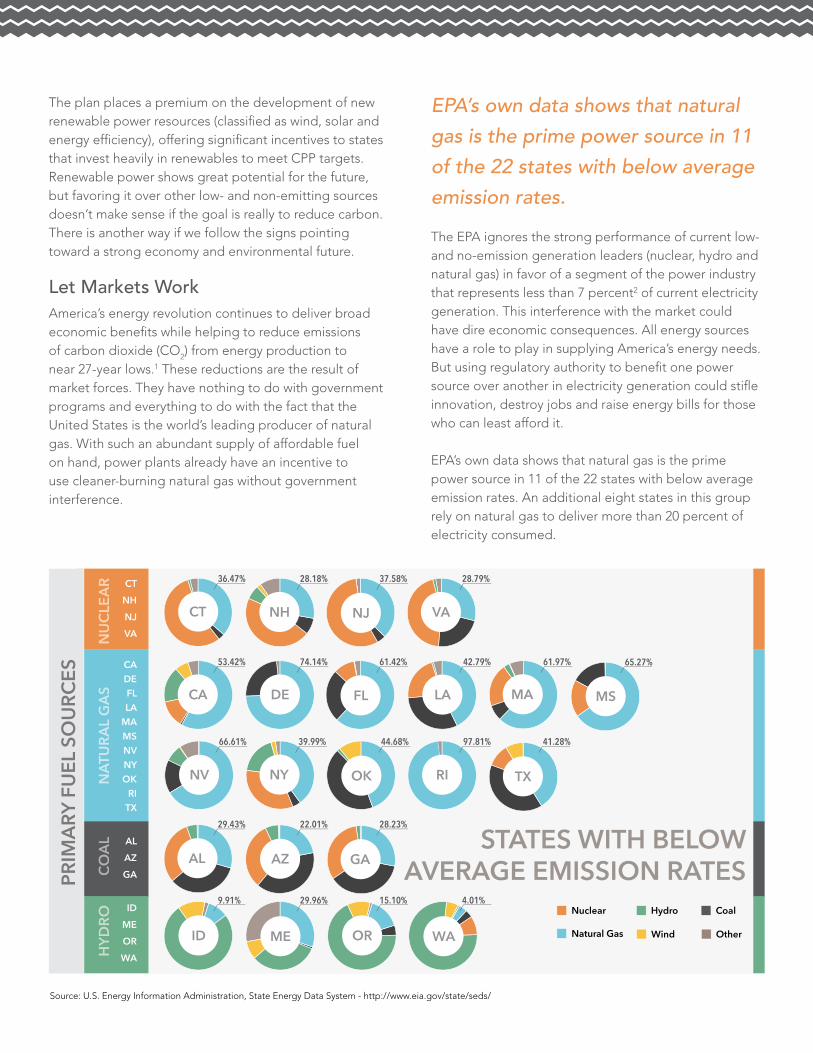
In the 25 states with above average emission rates, targeted switching to natural gas could reduce emissions below EPA goals. Yet EPA seeks to downplay natural gas use. This is what happens when ideology and politics trump science.
It is not only natural gas that suffers from the government’s decision to use the CPP to advantage only certain energy sources. New solar technologies3 can’t compete when the government dictates energy sources. The same is true for advanced biofuels4 and new technologies5 and services that could challenge and transform the electric utility industry.
Look no further than California to see how this has played out. After passing its own directive global warming legislation back in 2006, which could be considered Clean Power Plan light, the state has removed twice6 as much energy from hydroelectric and nuclear sources than has been replaced by wind and solar.
In a country with an abundance of rushing rivers, there is an estimated 65 GW7 (enough power to light up nearly 50 million homes) of available power that could be developed through non-powered dams and new resources that suffer from regulatory and legal obstacles.
1,400
1,200
1,200
800
600
400
200
EPA Emissions Targets
Fuel Switching to Combined Cycle Natural Gas
Arkansa
sColorado
Illinois
IndianaIowa
Kansas
Kentucky
Maryland
Michigan
Minnesota
Missouri
MontanaNebraska
New Mexic
o
North Carolin
aSouth D
akota
OhioPe
nnsylva
nia
South Carolina
South Dako
taTe
nnessee
UtahWest
Virginia
Wyoming
Wisc
onsin
CO2 RATE (LBS/NET MWH)CPP 2020 to 2030 Baseline
Source: API calculation based on EPA Clean Power Plan data - http://1.usa.gov/1MMpplL
3,0002,7502,5002,2502,0001,7501,5001,2501,000
750500250
0-250-500-750
United States
Italy
United Kingdom
SpainCanadaFra
nceGerm
anyNetherla
ndsSwitz
erland
Australia
Japan
Mexico
Turke
yBrazil
IndonesiaSouth KoreaSaudi A
rabiaRussi
aIndia
China
TOP 20 ECONOMIESChange in Carbon Emissions from Energy: 2005 - 2012
MIL
LIO
N M
ETRI
C TO
NS
-728
.72
-86.
07
-84.
19
-70.
48
-58.
77
-49.
43
-45.
27
-11.
44
-2.7
8
11.4
5
17.8
0
56.0
3
66.0
3
129.
47
130.
07
163.
29
180.
74
194.
19
649.
54
2,99
0.08
Sources: U.S. Energy Information Administration, Emissions DataWorld Bank, GDP Data
120%
100%
80%
60%
40%
20%
0%
-20%-10%-20%-30% 0% 10% 20% 30% 40% 50% 60% 70%
Worse on Emissions, Better on Growth
Worse on Emissions, Worse on Growth
None of the world’stop 20 economiesare better on emissionsand better on growth.
Better on Emissions,Worse on Growth
CHANGE IN CARBONEMISSIONS VS. GDP2005 - 2012
GD
P
Emissions from Energyon
China
India
Saudi ArabiaIndonesia
BrazilSouth KoreaTurkey
Mexico
Russia
Japan
GermanyNetherlands
U.S.Canada
UK
SwitzerlandAustralia
FranceSpainItaly
Sources: U.S. Energy Information Administration, Emissions DataWorld Bank, GDP Data
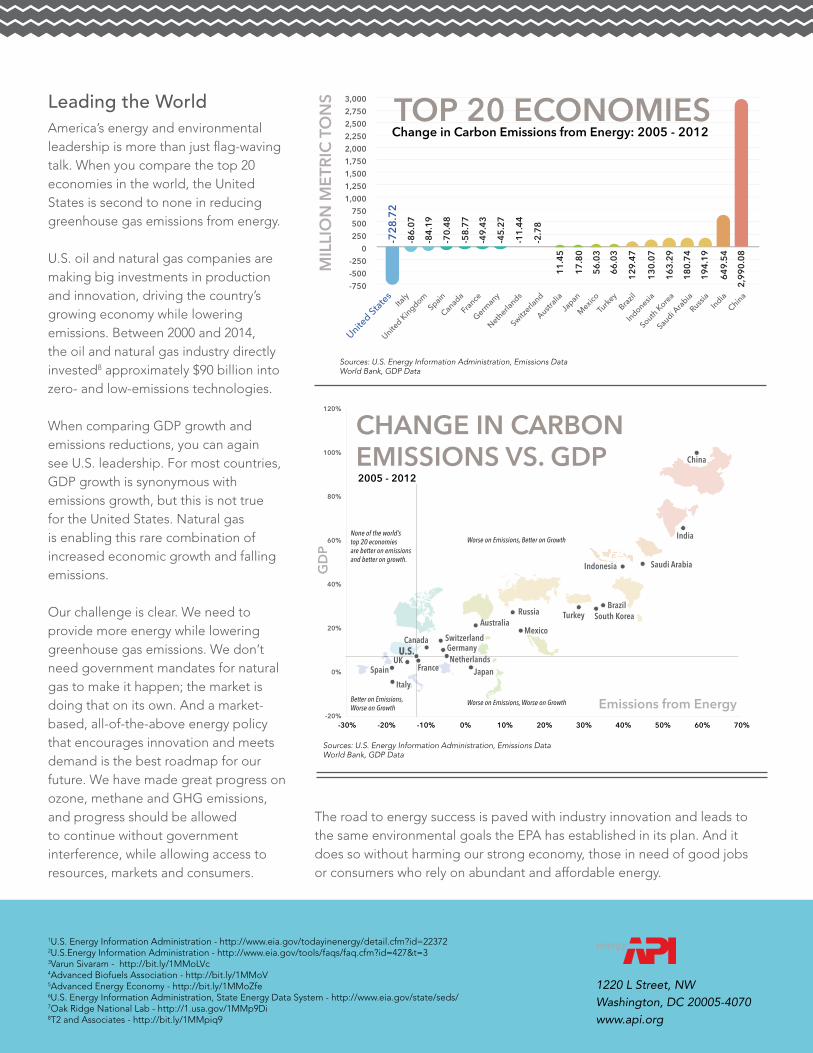
Leading the World America’s energy and environmental leadership is more than just flag-waving talk. When you compare the top 20 economies in the world, the United States is second to none in reducing greenhouse gas emissions from energy. U.S. oil and natural gas companies are making big investments in production and innovation, driving the country’s growing economy while lowering emissions. Between 2000 and 2014, the oil and natural gas industry directly invested8 approximately $90 billion into zero- and low-emissions technologies.
When comparing GDP growth and emissions reductions, you can again see U.S. leadership. For most countries, GDP growth is synonymous with emissions growth, but this is not true for the United States. Natural gas is enabling this rare combination of increased economic growth and falling emissions.
Our challenge is clear. We need to provide more energy while lowering greenhouse gas emissions. We don’t need government mandates for natural gas to make it happen; the market is doing that on its own. And a market-based, all-of-the-above energy policy that encourages innovation and meets demand is the best roadmap for our future. We have made great progress on ozone, methane and GHG emissions, and progress should be allowed to continue without government interference, while allowing access to resources, markets and consumers.
The road to energy success is paved with industry innovation and leads to the same environmental goals the EPA has established in its plan. And it does so without harming our strong economy, those in need of good jobs or consumers who rely on abundant and affordable energy.
1220 L Street, NWWashington, DC 20005-4070www.api.org
1 U.S. Energy Information Administration - http://www.eia.gov/todayinenergy/detail.cfm?id=223722U.S.Energy Information Administration - http://www.eia.gov/tools/faqs/faq.cfm?id=427&t=33Varun Sivaram - http://bit.ly/1MMoLVc4Advanced Biofuels Association - http://bit.ly/1MMoV5Advanced Energy Economy - http://bit.ly/1MMoZfe6 U.S. Energy Information Administration, State Energy Data System - http://www.eia.gov/state/seds/7 Oak Ridge National Lab - http://1.usa.gov/1MMp9Di8 T2 and Associates - http://bit.ly/1MMpiq9