Embed Size (px)
Citation preview


45%
22%
11%
10%
7%
4%1%
Asia
Europe
North America
Latin America/ Carribian
Africa
Middle East
Oceania/Australia
Source: http://www.internetworldstats.com/stats.htm, ITU World Telecommunication /ICT Indicators database
In 2013, over 2.7 billion people are using the Internet, which corresponds to 39% of the world’s population
Internet User (%)Base:World Population

538.0
137.0101.2
74.540.3 33.6 31.0 29.1 20.1 17.7
40.1
11.4
79.5
30.1
82.5
32.4 33.9
15.3
30.0
60.7
0.0
10.0
20.0
30.0
40.0
50.0
60.0
70.0
80.0
90.0
100.0
-50.0
50.0
150.0
250.0
350.0
450.0
550.0
internet users (mio) internet penetration (%)
Source: http://www.internetworldstats.com/stats.htm, ITU World Telecommunication /ICT Indicators Database, MarkPlus Insight Analysis
In the developing world, 31% of the population is online, compared with 77% in the developed world
Internet User (mio)Base:World Population

74
29
37
80
33
41
developed country (%) developing country (%) world (%)
Women
Men
Globally, 37% of all women are online, compared with 41% of all men; it corresponds to 1.3 billion women and 1.5 billion men
Source: ITU World Telecommunication /ICT Indicators Database
Internet User (mio)Base:World Population

42.2
55.261.1
74.6
2010 2011 2012 2013In million 2010 2011 2012 2013
Urban Population 121.16 123.24 123.57 133.73
Urban Internet User 37.56 50.53 56.38 62.19
Internet User 42.16 55.23 61.08 74.57
Internet Penetration (Mio)Base: Indonesia Population
The number of Internet users grow significantly from 2010 to 2013; it has been grew by 13.5 million in 2013
Source: MarkPlus Insight, published on Marketeers Magazine Nov 2013 edition

42.2
55.2
61.1
74.6
8.0
13.8
24.2
31.7
18.98
24.99
39.6242.49
2010 2011 2012 2013
Internet Users Netizen (Access more than three hours per day) Netizen proportion (%)
Netizen Penetration (Mio)Base: Indonesia Population
The number of internet users in 2013 grew by 22% but the netizenpenetration growth is only 3% y-o-y
%
%
%%
Source: MarkPlus Insight, published on Marketeers Magazine Nov 2013 edition

233.48 236.33 239.14 242.02 244.81 247.57 250.34 253.09 255.79
43.3752.20
62.8474.57
91.04
109.59
131.91
158.79
191.13
8.00 13.8024.20
31.6939.79
47.9456.08
64.2372.38
2010 2011 2012 2013 2014* 2015* 2016* 2017* 2018*
Citizen of Indonesia (mio) Indonesia Internet User (mio) Indonesia Netizen (mio)
In 2013, 6 new internet users were born every a baby birth
*) Projection
Indonesia Population vs Internet User (mio)Base: Indonesia Population
Source: MarkPlus Insight, published on Marketeers Magazine Nov 2013 edition

1
2
3
To explore Netizen online habits and behaviors
To determine Netizen purchase behavior
To determine Netizen anxiety and desire
4 To understand Netizen media habits
This research is aimed to get insightful information for marketers toformulate an appropriate strategy to approach Netizen sub-culture
Source: MarkPlus Insight, published on Marketeers Magazine Nov 2013 edition

AREA RESPONDENTS
Jakarta 500Bandung 200Semarang 150Surabaya 300Medan 250Makassar 150Palembang 150Denpasar 150Pekanbaru 150Banjarmasin 150
Total 2150
*)Margin of error 2,11%
Quantitative Phase
Face to Face Interview
Multi Stage Random Sampling
• SEC A/B/C • Age 15 – 64 years old• Internet and/ or mobile internet users• Use internet for at least 3 hours a day• Not working or having family whose work at
market research company, advertising agency, and mass media.
Respondent Criteria
This survey was conducted by quantitative and qualitative research approach
Qualitative Phase
Focus Group Discussion
• Digital Immigrant (1 group)• Digital Native (1 group)
Source: MarkPlus Insight, published on Marketeers Magazine Nov 2013 edition

Gender (%)Base: All Respondents (n=2150)
49.950.1
Male Female
51.2
50.0
50.7
49.7
50.0
50.0
52.7
50.0
50.0
44.7
48.8
50.0
49.3
50.3
50.0
50.0
47.3
50.0
50.0
55.3
Jakarta (n=500)
Bandung (n=200)
Semarang (n=150)
Surabaya (n=300)
Medan (n=250)
Palembang (n=150)
Pekanbaru (n=150)
Denpasar(n=150)
Banjarmasin (n=150)
Makassar (n=150)
Gender (%)Base: All who live in particular city
The gender composition is balanced for all cities
Source: MarkPlus Insight, published on Marketeers Magazine Nov 2013 edition

27.7
20.916.8
17.9
10.7
6.0
15 – 22 y.o 23 – 30 y.o
31 – 35 y.o 36 – 45 y.o
46 – 55 y.o 56 – 64 y.o
Age (%)Base: All Respondents (n=2150)
17.9
21.7
23.6
23.0
13.8
A1 (More than Rp. 4.500.000)A2 (Rp. 3.000.001 - Rp. 4.500.000)B (Rp. 2.000.001 - Rp. 3.000.000)C1 (Rp. 1.500.001 - Rp. 2.000.000)C2 (Rp. 1.000.001 - Rp. 1.500.000)
Monthly Household Expenditure (%)Base: All Respondents (n=2150)
The respondents comes from SEC A – C; and mostly from younger segment (below 45 y.o)
Source: MarkPlus Insight, published on Marketeers Magazine Nov 2013 edition

Single45.5
Married and Have Kids
46.1
Married and have no kid
yet7.2
Marital Status (%)Base: All Respondents (n=2150)
Most of respondents are married and have kids
Source: MarkPlus Insight, published on Marketeers Magazine Nov 2013 edition

Key Findings
• 5 Netizen Species• Spending behavior• Online behavior• Social media• Anxieties & Desires• Media Habit• Netizen Favorite Brand

5 Species of Indonesian Netizens
32,6%
45,1% 5,1% 11,5%
5,5%
Those who has actively write an article, have a blog, upload video,social media buzzer, can’t be separated from the internet
Those passive users who only read other’s status or post in social media but never comment or share their own life
Those who loves to search and collect news for their own shake but don’t have any intention to share – research online, purchase offline
Those who love to chat by instant messaging
Those who are actively posting in social media, commenting other’s status or posts, criticize other’s idea
Source: MarkPlus Insight, published on Marketeers Magazine Nov 2013 edition

Passive Active
User Generation & Content
32,6%
45,1% 5,1% 11,5%
5,5%

Connection Level
Aware Appeal Ask Act Advocate
Active Passive
32,6%45,1% 5,1% 11,5% 5,5%

Currator CatalystCrawler Chatter Commentator
Co
nte
nt
Segmentation
Reading online news on website
“I rarely read newspaper. I’d
rather search news in detik.com”
{ Male, worker, digital immigrant }
Reading status on social media“I frequently
reading my friend’s Facebook comment or status silently”
{ Male, worker, digital immigrant }
Collecting Information
“My friend status always spot where she found a good place to eat and I
always noted down her location.”
{ Female, worker, digital native}
Get connected -chatting
“We’re using chat messenger (as the
main way) to communicate with
friend/family.”
{ Most respondents}
Make a call using Skype
“I am using Skype regulary to stay in
touch with my friend in England (1 am in a morning).”
{ Female, worker, digital native}
Post a comment“I state my
perspective with posting a comment
on one of Kaskus thread”
{ Male, high school student, digital
native }
Buy toys on Ebay
“Recently, i’ve bought McD minion toys on
eBay because I’m too lazy to search in McD
outlet.”
{ Male, first jobber digital native }
Sharing, sharing, sharing
“Tweet our thought, sharing photos of
our food pr activity, sharing music that we listened to or recommend good
place to eat.”{ Most respondents}
I tweet thereforeI am
“I speak my mind through online. I tweet a lot and has so many reply. Sometimes I also create my own meme
jokes on Path”{ Male, first jobber
digital native }
Amplify the enthusiasm
“I love to collect people writing about illuminati on Kaskus, which I am
is an illuminati enthusiast.”
{Male, high school student, digital native}
Digital natives crowds catalyst segment for their role as contentgenerator and also a creative content creator
Aware ShareAppeal Ask Act
Source: MarkPlus Insight, published on Marketeers Magazine Nov 2013 edition

Key Findings
• 5 Netizen Species• Spending behavior• Online behavior• Social media• Anxieties & Desires• Media Habit• Netizen Favorite Brand
7.9
9.3
12.0
15.7
16.8
18.3
36.7
40.0
60.9
61.0
63.3
69.3
Insurance
Ciggarete
Health care
Shopping
Save money for zakat
Education cost
Body care
Savings
Transportation
Telephone communication
Daily food & beverages
Internet
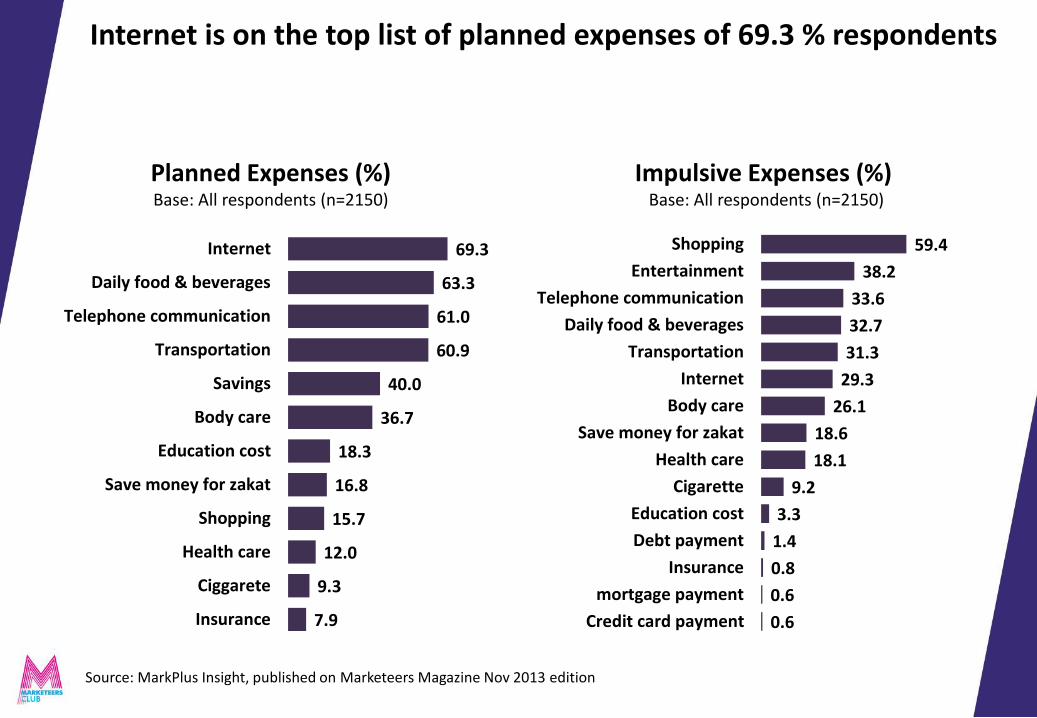
Planned Expenses (%)Base: All respondents (n=2150)
0.6
0.6
0.8
1.4
3.3
9.2
18.1
18.6
26.1
29.3
31.3
32.7
33.6
38.2
59.4
Credit card payment
mortgage payment
Insurance
Debt payment
Education cost
Cigarette
Health care
Save money for zakat
Body care
Internet
Transportation
Daily food & beverages
Telephone communication
Entertainment
Shopping
Impulsive Expenses (%)Base: All respondents (n=2150)
Internet is on the top list of planned expenses of 69.3 % respondents
Source: MarkPlus Insight, published on Marketeers Magazine Nov 2013 edition

Do You Shop Online? (%)Base: Respondents (n=2148)
20.3
79.7
Yes No
The number of netizen who shop online increased by 5% compared to last year
Source: MarkPlus Insight, published on Marketeers Magazine Nov 2013 edition

3.7
4.2
7.6
8.3
9.3
12.1
12.4
17.0
56.4
79.2
Bus/train ticket
Glasses
Handphone accessories
Watch
Handphone
Book
Cinema ticket
Bags
Shoes
Apparel
Offline ShoppingBase: All respondent (n=2105)
1.8
2.3
2.8
3.0
5.1
5.1
7.6
20.0
20.2
67.1
Book
Cosmetic
Handphone accessories
Car accessories
Handphone
Airline ticket
Watch
Bags
Shoes
Apparel
Online ShoppingBase: Respondent ever bought online product (n=435)
Netizen are starting to buy primary items from the internet
Source: MarkPlus Insight, published on Marketeers Magazine Nov 2013 edition

Messenger group 27.0%
Online forum for shopping
26.6%
Social media 26.4%
Online shop20.0%
Online Shopping Channel (%) Base: respondents who shop online (n=434)
Most of respondents choose to do online shopping on messenger group and social media
Source: MarkPlus Insight, published on Marketeers Magazine Nov 2013 edition

Account transfer is the most widely used payment method for online shopping
Payment Methods of Online Shopping (%) Base: All respondents who bought a product/service through internet (n=435)
0.5
0.5
0.9
2.5
27.1
80.7
PayPal
KasPay
Rekening bersama (Rekber)
Credit card
Cash on Delivery (COD)
Account transfer
Source: MarkPlus Insight, published on Marketeers Magazine Nov 2013 edition

Key Findings
• 5 Netizen Species• Spending behavior• Online behavior• Social media• Anxieties & Desires• Media Habit• Netizen Favorite Brand

#1 SPENDING ON INTERNET SERVICE
Feel uneasy without internet
#1 CONTACT PEOPLE BY CHAT MESSENGER
Use chat messenger first (not SMS), make a phone call later
MODEM
UNLIMITED INTERNET PACKAGE
WHATSAPPLINE KAKAO TALK
Smartphone appealing so much not only for youngster; Netizenfirmly embrace hi-tech devices for supporting their online activities
#1 PROVIDER CONSIDERATION: INTERNET CONNECTION SPEED
Most activty rely on internet connection
COVERAGE AREA
INTERNET CONNECTION
SPEED
SIGNAL STRENGTH
Source: MarkPlus Insight, published on Marketeers Magazine Nov 2013 edition

Used Gadget To Access Internet (%)Base: All Respondent (n=2150)
86.0
42.3
15.210.6
Smartphone Own laptop laptop/pc at the office laptop/pc at home
Smartphone is the most widely used gadget to access internet for both men and women
Source: MarkPlus Insight, published on Marketeers Magazine Nov 2013 edition

Average Monthly Spending For Internet Access Through Smartphone/Tablet (%)
Base: All accessed internet through smartphone/tablet (n=1831)
75.544
111.386
85,43595,648 92,118
86,807 90,140
85,81897,184
74,743
91,808
78,924
62,581
80,290 81,620
61,96067,384
82,19176,579
72,618
0
50,000
100,000
150,000
Jakarta Denpasar Makassar Palembang Bandung Semarang Medan Surabaya Pekanbaru Banjarmasin
2012 (n=1831) 2013 (n=1374)
The average Netizen spending tends to be higher in particular cities compared to 2012
Source: MarkPlus Insight, published on Marketeers Magazine Nov 2013 edition

Only 11.5 % of respondents has purchased goods, most of them come from younger age
11.5
88.5
yes no
Have You Ever Bought A Product Because Of Online Ads? (%)Base: All respondents (n=2505)
Source: MarkPlus Insight, published on Marketeers Magazine Nov 2013 edition

82.7
31.8
11.1
4.1
Smartphone
Laptop/Notebook/Netbook
PC/Desktop
Tablet PC
Gadget USed to Access Internet Banking (%)Base: All respondents who have internet banking (n=387)
82.7% Netizen use their smartphone to access internet banking
Source: MarkPlus Insight, published on Marketeers Magazine Nov 2013 edition

For more Insights, please read Marketeers Magazine November 2013
To purchase full report, please email [email protected]