Embed Size (px)
DESCRIPTION
Kathy Macchi, our DemandGen data and analytics expert, will share the six principles and recommendations for marketers who want to become best-in-class. Kathy’s focus on analytics is developing models to bring fact-based assessment to lead management that will help marketers build more effective lead generation and nurturing programs.
Citation preview
Just add Data: The Path to Better Marketing Results
David LewisPresident
Kathy MacchiPractice Manager, Data and Insights
ITSMA Marketing Performance Management Survey

Copyright © 2014 | DemandGen® International, Inc. @demandgenglobal
Strategic Partners & Systems
www.DemandGen.com
Lead Management BookDownload Your Free Copy
www.ManufacturingDemand.com
Who is DemandGen:We create high performance marketing teams by helping you leverage your marketing cloud technologies for driving demand and customer engagement.
Why DemandGen:People |Process | Results

Copyright © 2014 | DemandGen® International, Inc. @demandgenglobal
ITSMA is the leading marketing association for technology, communications, and professional services organizations.
www.itsma.com

Copyright © 2014 | DemandGen® International, Inc. @demandgenglobal
Measuring Marketing’s Value: A Challenge for More Than a DecadeTop Priority:CEOs reveal that "enhanced return on Marketing investment“ is a top priority for Marketing. (ARF)
Lack of Satisfaction:•Only 21% of 319 respondents rate themselves "satisfied" or "very satisfied" with Metrics capabilities (CMO Council)Measurement Challenged:•Over half (51%) say that difficulty in measuring performance a key reason for pressure on Marketing department (ANA and Booz Allen Hamilton)
Still a Priority:•59% consider measuring Marketing performance to be a top-three priority for their company.•Accountability top priority for 66% of senior Marketing executives (ANA)Can’t Get No Satisfaction:•Only 9% somewhat satisfied with their company’s ability to set and monitor Marketing Metrics (VEM)•48% felt that CEOs believe that their organization’s ability to measure marketing performance was only marginally effective. (VEM MPM)
Measurement Challenged:•Marketing is onlymarginally or somewhateffective at measuringEffectiveness (Deloittestudy of over 460 executives)Still a Priority:•54% of survey participants say measuring marketing performance is one of their top 3 priorities
Measurement Challenged:Marketers remain challenged to measure value and ROI, <50% use marketing analytics (Alterian, n=1,545 )
Dissatisfaction With Metrics Continues:•96% of marketers tracking 1-20 metrics and• 76% say metrics are not useful in decision making (Mktg Leadership Roundtable)Top Priority Still:•CMOs under pressure to demonstrate value; ROI major issue in 2008 (B-B Mag)
Still Don’t Make the Grade:• Only22% of CEOs give Marketing an “A” (VEM MPM)•Fewer than 1 in 10 say their organization is completely effective at MPM (Lenskold)
2000 2004 2005 2006 20092007 2008 2011 2012
Measurement Challenged:“Measurement Challenges Stump Marketing Executives” eMarketer, December 2011
Challenged to prove value:To prove their value and justify investment, they (CMOs) must tie marketing closer to business results Forrester, Evolved CMOS, July 2012
Analytics Challenged:• Only 50% of companies surveyed have an analytics program (ITSMA Marketing Analytics Survey)
Challenged to prove value:Less than 10% of C-level executives rely on marketing data to make decisions (ITSMA Data Driven Marketing Survey)Measurement
Challenged:Marketers measure past performance and short term goals with no link to strategy (ITSMA)
2014

Copyright © 2014 | DemandGen® International, Inc. @demandgenglobal
The pressure on marketers to be more accountable is only increasing
“Only 44% of CMOs feel fully prepared to be held accountable for marketing ROI” IBM Global CMO Study
“Over 70% of chief executives believe marketers to be disconnected from business results and focus on the wrong areas…” Global Marketing Effectiveness, Fournaise

Copyright © 2014 | DemandGen® International, Inc. @demandgenglobal
Today, the majority of marketers fail to meet expectations…
How satisfied are you with:
Note: Mean rating is based on a 10-point scale where 1=Not at all satisfied and 10=Extremely satisfied.Source: ITSMA/VEM Marketing Performance Management Survey,
10
9
8
7
6
5
4
3
2
1Not at AllSatisfied
ExtremelySatisfied
5.6Performance Improvement
The marketing organization’s
ability to manage its performance
5.5 5.3Analytics
The marketing organization’s
ability to examine data to create
insights
MetricsThe marketing organization’s
ability to measure its performance
Copyright © 2014 | DemandGen® International, Inc. @demandgenglobal
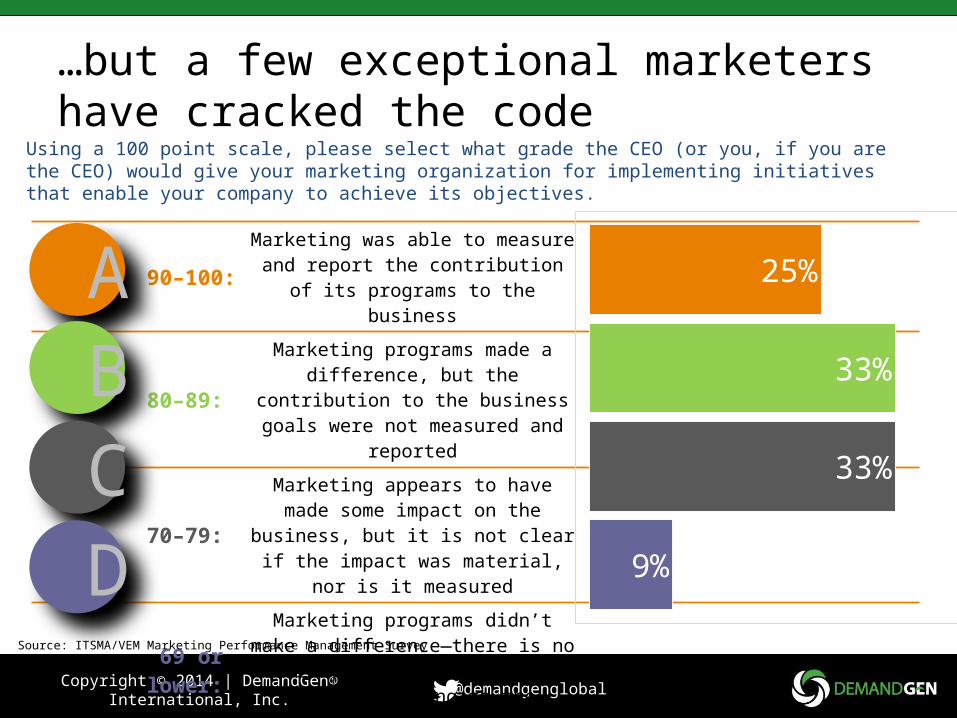
90–100: Marketing was able to measure and report
the contribution of its programs to the business
80–89: Marketing programs made a difference,
but the contribution to the business goals were not measured and reported
70–79: Marketing appears to have made some
impact on the business, but it is not clear if the impact was material, nor is it measured
69 or lower:
Marketing programs didn’t make a difference—there is no clarity as to how marketing is contributing to the business
…but a few exceptional marketers have cracked the code
Using a 100 point scale, please select what grade the CEO (or you, if you are the CEO) would give your marketing organization for implementing initiatives that enable your company to achieve its objectives.
Source: ITSMA/VEM Marketing Performance Management Survey
25%
33%
33%
9%
A B C D
Copyright © 2014 | DemandGen® International, Inc. @demandgenglobal
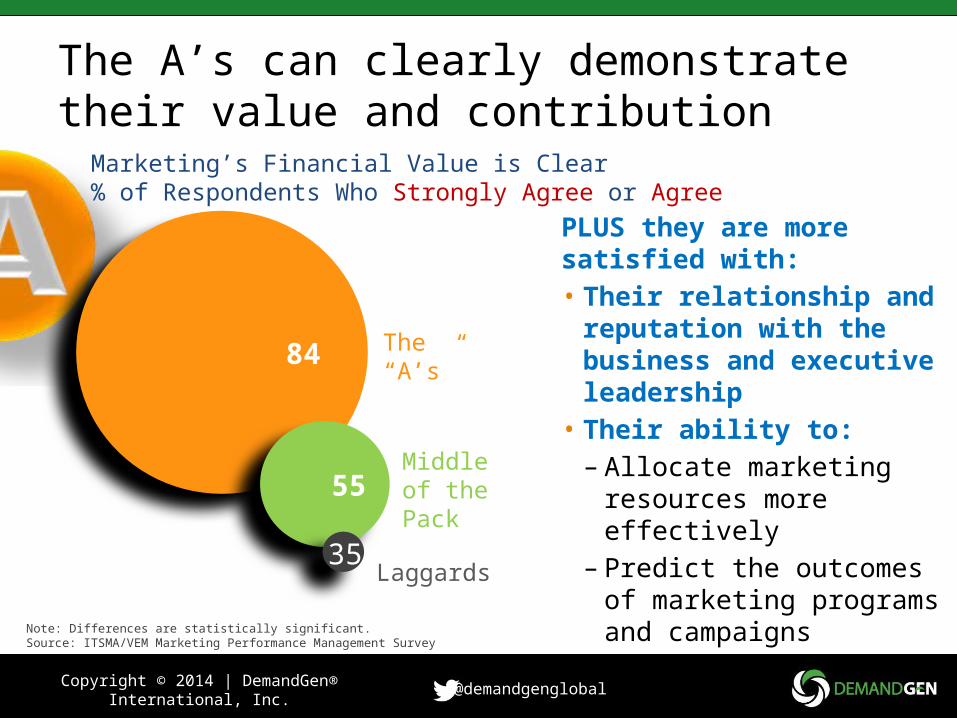
The A’s can clearly demonstrate their value and contribution
PLUS they are more satisfied with:• Their relationship and
reputation with the business and executive leadership
• Their ability to: – Allocate marketing resources
more effectively– Predict the outcomes of
marketing programs and campaigns
Marketing’s Financial Value is Clear% of Respondents Who Strongly Agree or Agree
84
55
35
The “A’s”
Middle of the Pack
Laggards
Note: Differences are statistically significant.Source: ITSMA/VEM Marketing Performance Management Survey

Copyright © 2014 | DemandGen® International, Inc. @demandgenglobal
AWhat do the “A’s” know that the others don’t?

Copyright © 2014 | DemandGen® International, Inc. @demandgenglobal
The A’s have a game plan for performance management
AlignmentAccountability
AnalyticsAutomation
AlliancesAssessment

Copyright © 2014 | DemandGen® International, Inc. @demandgenglobal
Series1
96
91
90
89
70
51
67
50
38
Alignment: The A’s create direct line-of-sight between marketing activities and business results
How strongly do you agree or disagree with each of these statements?% of Respondents Who Strongly Agree or Agree
Note: Differences are statistically significant.Source: ITSMA/VEM Marketing Performance Management Survey,
The link between marketing activities and business goals is clear
It is clear to the leadership team how marketing is impacting the
business
Marketing is good at measuring its contribution
The “A’s”
Middle ofthe Pack
Laggards
Copyright © 2014 | DemandGen® International, Inc. @demandgenglobal
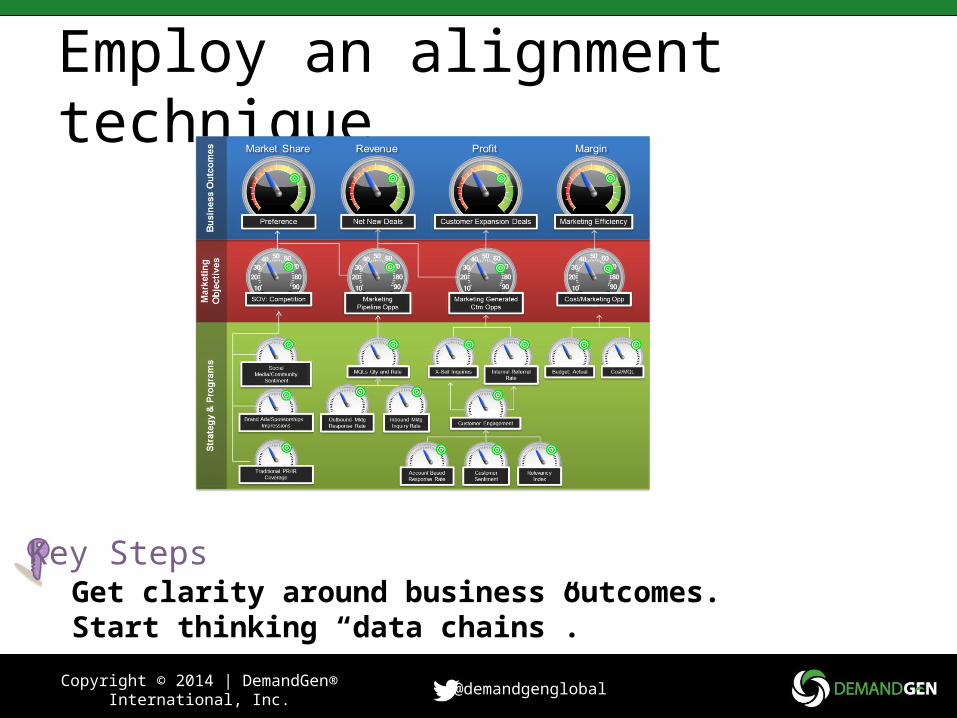
Employ an alignment technique
Key StepsGet clarity around business outcomes.Start thinking “data chains”.

Copyright © 2014 | DemandGen® International, Inc. @demandgenglobal
Data Chains Are Essential

Copyright © 2014 | DemandGen® International, Inc. @demandgenglobal
Accountability: The A’s use metrics and dashboards to make fact-based decisions and strategic recommendations
How strongly do you agree or disagree with each of these statements?% of Respondents Who Strongly Agree or Agree
45
63
84
The “A’s”Middle ofthe Pack Laggards
Marketing is good at using data and analytics to make …
Course adjustments
Strategic recommendations
44
64
82
The “A’s”Middle ofthe Pack Laggards
Note: Differences are statistically significant. Source: ITSMA/VEM Marketing Performance Management Survey

Copyright © 2014 | DemandGen® International, Inc. @demandgenglobal
Adopt a metrics framework
Key StepsMake sure your metrics pass the “so what?” test.Ensure your data capture strategy aligns with your metrics.
Source: Wikipedia; The Marketing Metrics Continuum provides a framework for how to categorize metrics from the tactical to strategic.
Counting Efficiency ImpactLikelihood of Outcomes
Expected Outcomes
• Number of Downloads
• Events Produced• Number of Leads• Click Through
Rates
• Campaign ROI• Program Spend/
Headcount
• Pipeline Contribution
• Market Share• Lifetime Value
• Share of Wallet• Rate of Growth:
Market
• Propensity to Purchase
• Likelihood to Renew
Activity Outcomes
OperationalOutcome-
BasedLeading-
IndicatorsPredictive
Activity Metrics

Copyright © 2014 | DemandGen® International, Inc. @demandgenglobal
Marketing Overview

Copyright © 2014 | DemandGen® International, Inc. @demandgenglobal
Key Metrics
322
June
MQLGoal: 4,000
125
June
SALGoal: 1500
3.9%
June
ConversionGoal: 3%
1,467,322
June
VisitsGoal: 4,323,3625
583,023
June
Unique VisitorsGoal: 4,323,3625
3.75
June
Average TimeGoal: 4min
YTD YTD
YTD YTD

Copyright © 2014 | DemandGen® International, Inc. @demandgenglobal
Demand Funnel SnapshotCurrent Month & Quarter: Created-to-Date vs. Demand Plan
$20M80%
PIPELINE $25M5M REMAINING
56447%
SAL 1200636 REMAINING
87525%
MQL 35003,125 REMAINING
TODAY 55%Q2
$3.1M45%
PIPELINE $7M3.9M REMAINING
31975%
SAL 425106 REMAINING
47668%
MQL 700224 REMAINING
TODAY 71%May
Copyright © 2014 | DemandGen® International, Inc. @demandgenglobal
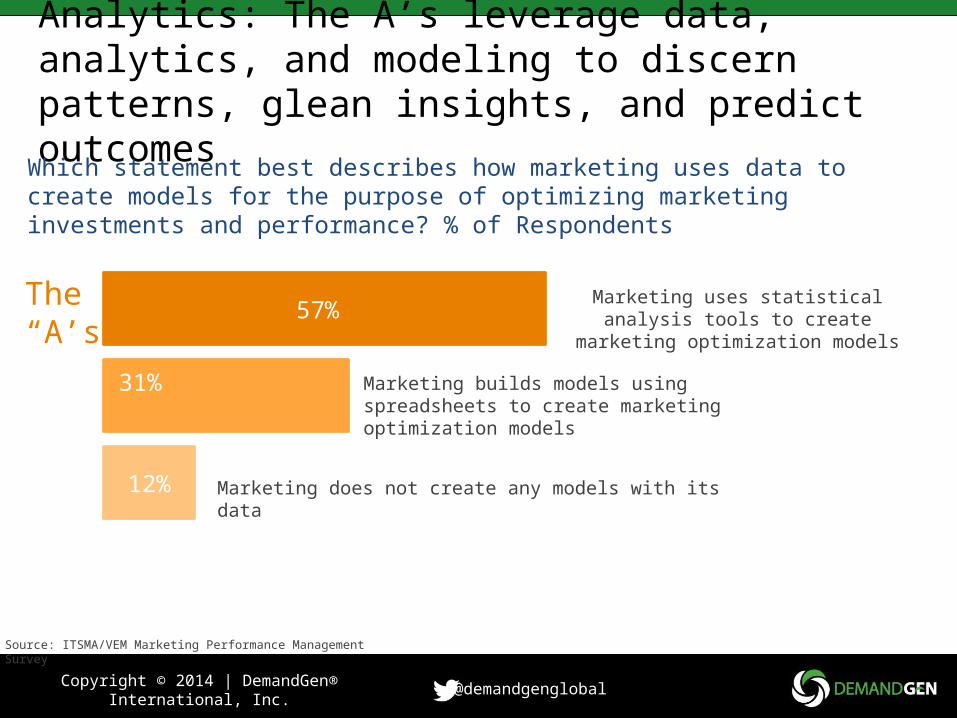
Analytics: The A’s leverage data, analytics, and modeling to discern patterns, glean insights, and predict outcomes
Which statement best describes how marketing uses data to create models for the purpose of optimizing marketing investments and performance? % of Respondents
Marketing uses statistical analysis tools to create marketing optimization models
Marketing builds models using spreadsheets to create marketing optimization models
Marketing does not create any models with its data
The “A’s”
57%
31%
12%
Source: ITSMA/VEM Marketing Performance Management Survey

Copyright © 2014 | DemandGen® International, Inc. @demandgenglobal
Derive actionable insights from data
Key StepsCreate a data inventory.Conduct a data assessment. Review your data processes and policies

Copyright © 2014 | DemandGen® International, Inc. @demandgenglobal
The “A's”
Middle of the Pack
Laggards
Budget management
Data analysis
Data collection
Performance measurement reporting
Database management
Market research
Selection of software tools for marketing
Marketing staff training and professional development
Performance measurement development
Forecasting
Evaluation of software tools for marketing
Performance benchmarking
Management of software tools for marketing
Marketing skills assessment
Predictive modeling
Automation: The A’s invest in systems, processes, and tools to track, measure, and report results
Source: ITSMA/VEM Marketing Performance Management Survey, July 2012
Which of the following responsibilities are included in your company’s/organization’s marketing operations function? Included by 50% or More
LaggardsMiddle ofthe Pack
The“A's”

Copyright © 2014 | DemandGen® International, Inc. @demandgenglobal
Reporting/Dashboard
MetricsAnd
Target Setting
Data Collection Capture
and Analysis
Marketing and Sales Alignment /
Lead Management
Implement marketing measurement, processes, tools, and systems
One Key Step
Invest in tools to automate report generation and dashboard updates.

Copyright © 2014 | DemandGen® International, Inc. @demandgenglobal
Alliances: The A’s formally collaborate with the sales, finance, and IT organizations
Note: Differences are statistically significant.Source: ITSMA/VEM Marketing Performance Management Survey
How would you describe marketing’s relationship with ______?% of Respondents Describing Relationship as Strong or Exceptional
The “A’s” Middle of the Pack (
Laggards
Sales
Finance
IT
65
3730
56
2416 43
299

Copyright © 2014 | DemandGen® International, Inc. @demandgenglobal
Enroll IT, Finance, and Sales in collaborative formal partnerships
Key StepsImplement lead scoring to ensure marketing leads are sales ready. Develop an opportunity analysis report to ensure scoring works.

Copyright © 2014 | DemandGen® International, Inc. @demandgenglobal
Assessment: The A’s benchmark and audit marketing performance with an eye toward continuous improvement
How satisfied are you with: Mean Rating
Note: Mean rating is based on a 10-point scale where 1=Not at all satisfied and 10=Extremely satisfied.abc Indicate a statistically significant difference.Source: ITSMA/VEM Marketing Performance Management Survey,
6.9ab
5.8ac
4.7bc
Performance Improvement: The marketing organization’s
ability to manage its performance
The “A’s” (N=88)
Middle of the Pack(N=118)
Laggards(N=137)
Not at all satisfied Extremely satisfied
Copyright © 2014 | DemandGen® International, Inc. @demandgenglobal
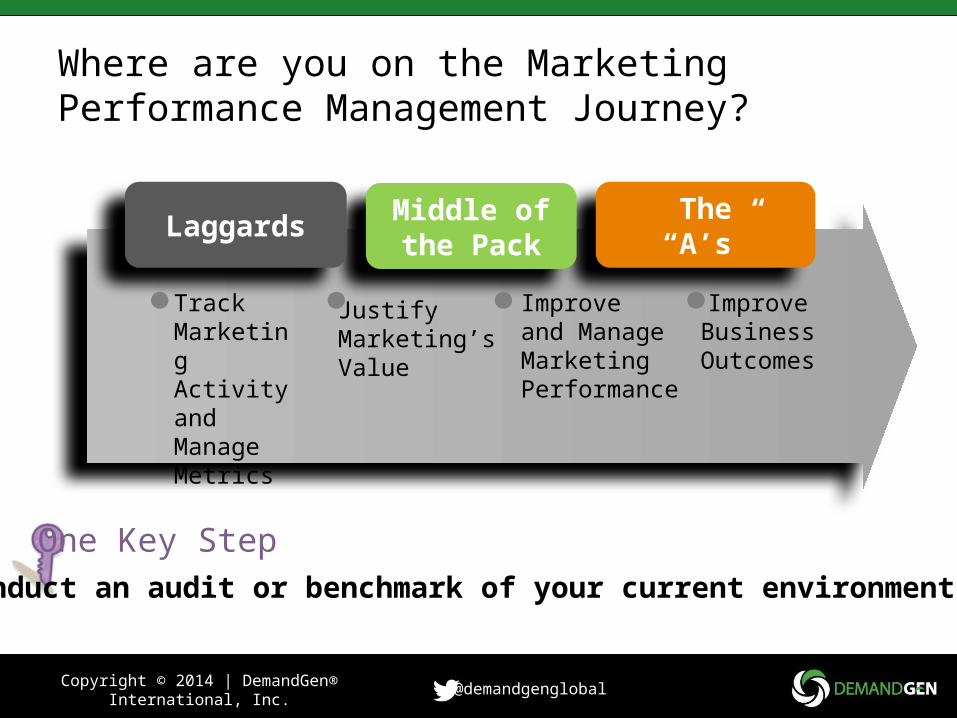
Where are you on the Marketing Performance Management Journey?
Track Marketing Activity andManage Metrics
JustifyMarketing’sValue
Improve and ManageMarketingPerformance
ImproveBusiness
Outcomes
The“A’s”
Middle ofthe Pack
Laggards
One Key StepConduct an audit or benchmark of your current environment.

Copyright © 2014 | DemandGen® International, Inc. @demandgenglobal
AThe A’s have a game plan for performance management – What’s your next move?
Alignment
Accountability
Analytics
Automation
Alliances
Assessment
Data

Copyright © 2014 | DemandGen® International, Inc. @demandgenglobal
Summary• Alignment
– Get clarity around business outcomes.
– Start thinking “data chains”.
• Accountability– Make sure your metrics pass the
“so what?” test.– Ensure your data capture strategy
aligns with your metrics.
• Analytics– Create a data inventory.– Conduct a data assessment.– Review your data processes and
policies
• Automation– Invest in tools to automate report
generation and dashboard updates.
• Alliances– Implement lead scoring to ensure
marketing leads are sales ready.– Develop an opportunity analysis
report to ensure scoring works.
• Assessment– Conduct an audit or benchmark of
your current environment.
Copyright © 2014 | DemandGen® International, Inc. @demandgenglobal
Contact me:
Kathy MacchiPractice Manager, Data and [email protected]