Embed Size (px)
Citation preview

Financial Results Year End 2014
March 3rd, 2015
Time: 8:30am MTN Domestic: (877) 201-0168 International: (647) 788-4901 Confirmation Code: 91157337

Safe Harbor Provisions
2
Certain statements made in this presenta/on are forward-‐looking statements under the Private Securi/es Li/ga/on Reform Act of 1995. These can be iden/fied by words such as "intend," "believe," and "expect," and phrases using those or similar terms. Specifically, statements rela/ng to projec/ons of future proceeds, revenue, income, profitability, cash flow, non-‐GAAP financial measures such as Adjusted EBITDA and Es/mated Remaining Proceeds, also known as “ERP”, and our ability to expand and u/lize flexibility under our credit facility are forward-‐looking statements. These forward-‐looking statements are not guarantees of our future performance and are subject to risks and uncertain/es that could cause actual results to differ materially from the results contemplated by the forward-‐looking statements. Factors that could affect our results and cause them to materially differ from those contained in the forward looking statements include those that we discuss in “Risk Factors” or comparable headings in our most recent Annual Report on Form 10-‐K.
Adjusted EBITDA and ERP, as presented today and in our earnings release we issued this morning, are supplemental measures of our performance and purchased debt asset value, respec/vely, that are not required by, or presented in accordance with, accoun/ng principles generally accepted in the U.S., also known as “GAAP.” They are not measurements of our financial performance or asset value under GAAP and should not be considered as alterna/ves to net income, asset value, or any other performance measures derived in accordance with GAAP, or as alterna/ves to cash flows from opera/ng ac/vi/es or a measure of our liquidity.
We believe adjusted EBITDA is representa/ve of our cash flow genera/on that can be used to purchase charged-‐off receivables, pay down or service debt, pay income taxes, and for other uses. ERP represents the expected cash proceeds of our then-‐current purchased debt por[olios over their en/re remaining life. You are, however, cau/oned not to place undue reliance on adjusted EBITDA and ERP.

Our Strategy
Paul A. Larkins, Chief Execu6ve Officer

4
Closed Loop Network

Key Strategic Goals
5
Our People • Inspire a culture of leadership by living our core values Opera6onal and Compliance Excellence • Pursue systemic opera/onal and compliance excellence Growth • Grow and diversify Partners • Create an outstanding network of Partners Financial Performance • Deliver solid financial results

6
• Fresh View Solu/ons Expands
• eAGLE Enhancements = Efficiency + Returns
• Deep Customer Data Improves Experience
Operational and Compliance Excellence Pursue systemic operational and compliance excellence

Growth Grow and diversify
7
• Disciplined Capital Deployment Strategy
• Recent Bank Visits = Op/mism
• Diversifica/on Posi/ves Con/nue

Partners Create an outstanding network of Partners
8
• Partner Investment Con/nues
• Integrated Account Management and Compliance
• Consistency Drives Uniform Customer Experience

Financial Performance Deliver solid financial results
9
• Performance Meets Expecta/ons
• Lower Volumes = Lower Adjusted EBITDA & ERP
• Purchasing Discipline Con/nues

Financial Results
John D. Lowe, Chief Financial Officer

ERP and Adjusted EBITDA
11
• Consolidated ERP of $655 million
• Adjusted EBITDA of $198 million
(1)
(1)
(1) Domes/c only
$-‐ $50
$100 $150 $200 $250 $300 $350 $400
2010 2011 2012 2013 2014
Adjusted EBITDA Trending ($ million)
Company Debt ÷ TTM Adjusted EBITDA 2010 2.08x
2011 1.65x
2012 1.22x
2013 1.42x
2014 2.18x
Company Debt as a % of Consolidated ERP
2010 68.8%
2011 57.7%
2012 45.8%
2013 52.0%
2014 65.7%
$0
$200
$400
$600
$800
$1,000
2010 2011 2012 2013 2014
Consolidated ERP -‐ Trending ($ million)
CAN
US
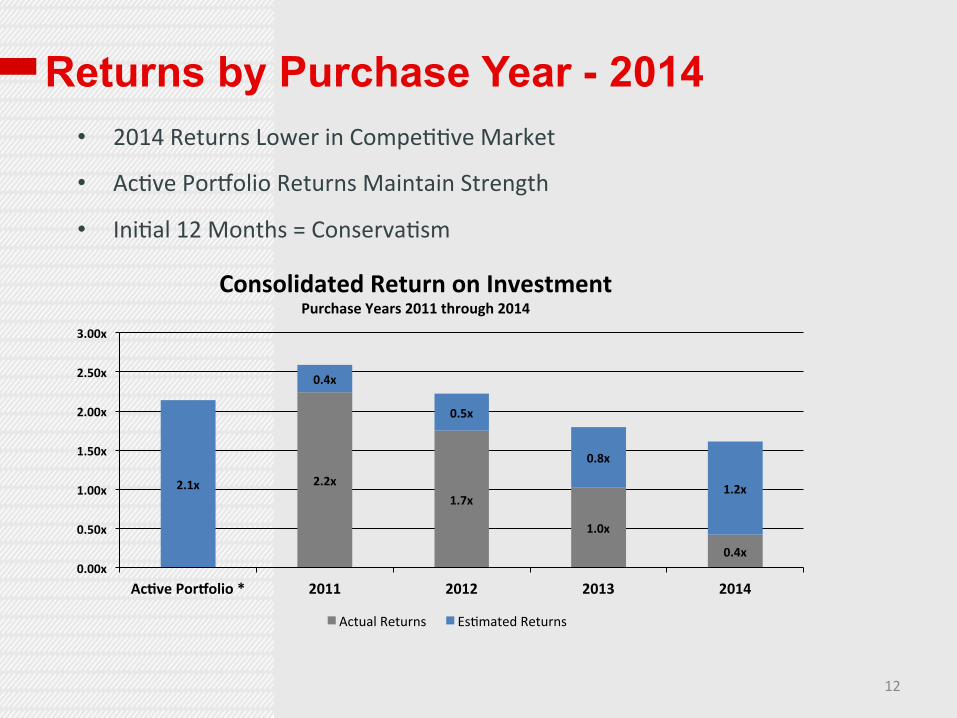
Returns by Purchase Year - 2014
12
• 2014 Returns Lower in Compe//ve Market
• Ac/ve Por[olio Returns Maintain Strength
• Ini/al 12 Months = Conserva/sm
2.2x 1.7x
1.0x
0.4x
2.1x
0.4x
0.5x
0.8x
1.2x
0.00x
0.50x
1.00x
1.50x
2.00x
2.50x
3.00x
Ac6ve Por[olio * 2011 2012 2013 2014
Consolidated Return on Investment Purchase Years 2011 through 2014
Actual Returns Es/mated Returns

Purchasing – Q4 2014
13
• Long-‐Term Investment Strategy = $29M Purchased
• Diversifica/on Con/nues
2014 2013 $ Variance % VarianceCredit Card/Consumer Loan -‐ Fresh*Face $157,411 $159,923 ($2,512) -‐1.6%Price 19,693 22,824 (3,131) -‐13.7%Price (%) 12.5% 14.3%
Credit Card/Consumer Loan -‐ Non-‐Fresh*Face 83,089 6,459 76,630 NMPrice 4,067 498 3,569 NMPrice (%) 4.9% 7.7%
Other**Face 79,641 147,810 (68,169) -‐46.1%Price 5,505 3,793 1,712 45.1%Price (%) 6.9% 2.6%
TOTALFace $320,141 $314,192 $5,949 1.9%Price 29,265 27,115 2,150 7.9%Price (%) 9.1% 8.6%
* Includes both Domestic and Canadian purchases. ** Other includes commercial, student loan, and medical purchased debt assets.NM Not meaningful.
Purchasing (in thousands)
Quarter Ended December 31,

Purchasing - 2014
14
• Disciplined Inves/ng Results in Scale-‐Back
• 80% = Fresh Consumer Debt
2014 2013 $ Variance % VarianceCredit Card/Consumer Loan -‐ FreshFace $714,681 $1,572,612 ($857,931) -‐54.6%Price 101,102 197,420 (96,318) -‐48.8%Price (%) 14.1% 12.6%
Credit Card/Consumer Loan -‐ Non-‐FreshFace 284,554 800,694 (516,140) -‐64.5%Price 14,346 40,912 (26,566) -‐64.9%Price (%) 5.0% 5.1%
Other*Face 224,625 450,368 (225,743) -‐50.1%Price 11,299 19,778 (8,479) -‐42.9%Price (%) 5.0% 4.4%
TOTALFace $1,223,860 $2,823,674 ($1,599,814) -‐56.7%Price 126,747 258,110 (131,363) -‐50.9%Price (%) 10.4% 9.1%
* Other includes commercial, student loan, and medical purchased debt assets.
Purchasing (in thousands)
Year Ended December 31,

Proceeds – Q4 2014
15
• Mix of Legal as % of Total Collec/ons Increased from 43% to 53%
• Legal & Other Collec/ons Maintain Strength
Cash Proceeds (in thousands) 2014 2013 $ Variance % Variance
Credit Card/Consumer Loan CollectionsNon-‐Legal Collections $37,785 $62,588 ($24,803) -‐39.6%Legal Collections 49,099 50,538 (1,439) -‐2.8%
Other Collections* 5,966 5,332 634 11.9%Total Collections 92,850 118,458 (25,608) -‐21.6%
Sales, Recourse & Bankruptcy 1,037 6,103 (5,066) -‐83.0%Total Cash Proceeds on Purchased Debt $93,887 $124,561 ($30,674) -‐24.6%
Quarter Ended December 31,
*Other includes collections and court cost recoveries on commercial, student loan, and medical accounts

Proceeds – 2014
16
• Mix of Legal as % of Total Collec/ons Increased from 39% to 50%
• Non-‐legal Collec/ons Impacted by Lower Purchasing Volumes
Cash Proceeds (in thousands) 2014 2013 $ Variance % Variance
Credit Card/Consumer Loan CollectionsNon-‐Legal Collections $184,974 $306,222 ($121,248) -‐39.6%Legal Collections 207,420 212,529 (5,109) -‐2.4%
Other Collections* 21,385 23,198 (1,813) -‐7.8%Total Collections 413,779 541,949 (128,170) -‐23.6%
Sales, Recourse & Bankruptcy 6,353 21,760 (15,407) -‐70.8%Total Cash Proceeds on Purchased Debt $420,132 $563,709 ($143,577) -‐25.5%
Year Ended December 31,
*Other includes collections and court cost recoveries on commercial, student loan, and medical accounts

Unadjusted Results – Q4 2014
17
• Purchased Debt Revenues, Net: › $52 million, 30% decrease from $74 million in Q4 2013
• Costs to Collect as % of Purchased Debt Collec/ons: › Including Gross Court Costs: 45.3% ; +411bps from Q4 2013
› Excluding Gross Court Costs: 37.3% ; +336bps from Q4 2013
› Non-‐Legal/Legal Mix: 53%/43% (Q4’13), 41%/53% (Q4’14)
• GAAP EBITDA: › -‐$1 million, decrease of $12 million from Q4 2013
• Net Loss: › $15 million net loss, decrease of $11 million from Q4 2013

Unadjusted Results – 2014
18
• Purchased Debt Revenues, Net: › $247 million, 27% decrease from $338 million in 2013
• Costs to Collect as % of Purchased Debt Collec/ons: › Including Gross Court Costs: 44.4% ; +274bps from 2013
› Excluding Gross Court Costs: 35.7% ; +172bps from 2013
› Non-‐Legal/Legal Mix: 57%/39% (2013), 45%/50% (2014)
• GAAP EBITDA: › $19 million, decrease of $45 million from 2013
• Net Loss: › $38 million net loss, decrease of $43 million from 2013

Liquidity Update – Year End 2014
19
• Disciplined Buying Con/nues
• Consolidated ERP of $655 million
• Liquidity = $72 million

Q & A