Embed Size (px)
Citation preview


Highlights
• Sales volume up 13% to 2,860 tonnes (2010: 2,535 tonnes)
• Revenue up 14% to £215.8m (2010: £189.5m)
• Earnings per share up 31% to 85.3p (2010: 65.1p)
• Cash of £72.3m at 30 September 2011 and no debt
• Full year dividend up 30% to 32.5p (2010: 25.0p)
YEAR ENDED 30 SEPTEMBER 2011 2
Record financial performance
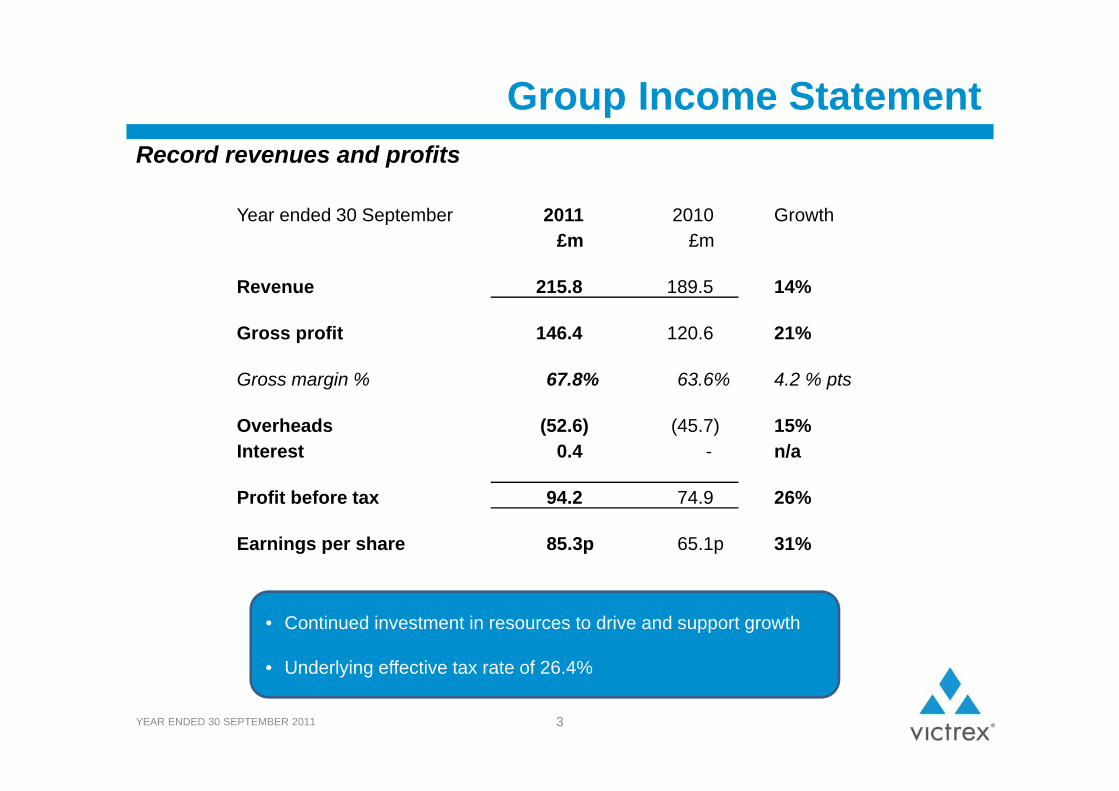
Group Income Statement
Year ended 30 September 2011 2010 Growth£m £m
Revenue 215.8 189.5 14%
Gross profit 146.4 120.6 21%
Gross margin % 67.8% 63.6% 4.2 % pts
Overheads (52.6) (45.7) 15%Interest 0.4 - n/a
Profit before tax 94.2 74.9 26%
Earnings per share 85.3p 65.1p 31%
YEAR ENDED 30 SEPTEMBER 2011 3
Record revenues and profits
• Continued investment in resources to drive and support growth
• Underlying effective tax rate of 26.4%

Group Gross Margin
YEAR ENDED 30 SEPTEMBER 2011 4
Gross margin improved 4.2 % pts over 2010
• Strong ASP maintained
• H2 2011 margin reflects:– Re-investment in
production resources– Increased raw material
prices
£ASP GM%

Currency Exposure
Average exchange rates
2010 2011 2012 Exchange rate sensitivity #
$/£ 1.58 1.57 1.58 £3.8m
€/£ 1.15 1.16 1.16 £3.6m
¥/£ 153 135 124 £0.8m
YEAR ENDED 30 SEPTEMBER 2011 5
2011 currency benefit of £1.7m
2012 estimates based on forecast sales volume, currency hedging already in place and spot exchange rates as at 25 November 2011# Management estimate of impact on PBT from a 5% movement in average exchange rate based on 2011 results

Group Cash Flow Statement
Year ended 30 September 2011 2010 £m £m
Operating profit 93.8 74.9(Increase)/decrease in inventories (9.7) 2.9Increase in trade and other receivables (5.5) (3.2)Increase in trade and other payables 4.5 10.2Depreciation and other 8.1 6.1Cash generated from operations 91.2 90.9 Tax paid (25.7) (13.7)Capital expenditure (9.0) (4.5)Dividends paid (63.8) (16.9)Other financing activities 2.2 2.6 Net (decrease)/increase in cash and cash equivalents (5.1) 58.4
YEAR ENDED 30 SEPTEMBER 2011 6
Strong cash generation from operations
• Capital investment includes:– Invibio® manufacturing and technology facilities– Land for future expansion at Hillhouse
• Dividends paid includes special dividend of 50.0p per share (£41.6m)

Group Balance Sheet
30 September2011
30 September2010
£m £m
PPE and intangible assets 135.6 135.4
Inventories 45.0 34.5
Cash 72.3 77.3
Trade receivables and other assets 34.9 31.8
Retirement benefit obligations (6.2) (9.5)
Trade payables and other liabilities (60.0) (58.2)
Equity shareholders' funds 221.6 211.3
Working capital/sales 28% 26%
YEAR ENDED 30 SEPTEMBER 2011 7
Strong balance sheet including £72.3m cash and no debt
• Capital investment in line with depreciation
• Increased inventory:– Strategic increase to underpin security of supply– Increased cost of production
• Additional deficit funding payment of £2.6m

Capital Investment Programme
YEAR ENDED 30 SEPTEMBER 2011 8
Investment for growth
• Monomer investment commenced
• Polymer investment timing being assessed
• Investment in technical facilities progressing
• Capital investment forecast range # :
2012 2013 2014£25-35m £25-45m £25-50m
# Upper end of range predominantly reflects indicative phasing of investment in an additional polymer plant

Victrex Polymer Solutions
YEAR ENDED 30 SEPTEMBER 2011 9

VPS Highlights
• Record financial performance
• Volume growth across all markets
• Strengthened management team
• Continued investment in commercial resources
• Investment in technical capability in Japan and the UK
YEAR ENDED 30 SEPTEMBER 2011 10
Record results
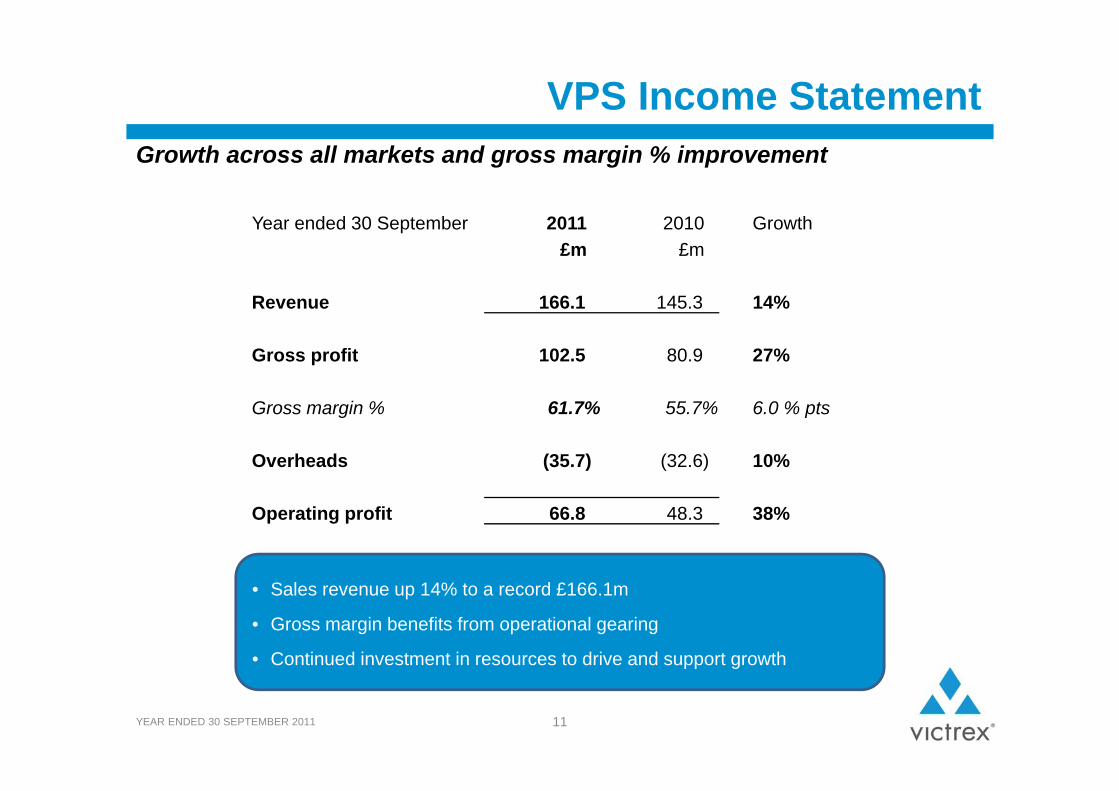
VPS Income Statement
Year ended 30 September 2011 2010 Growth£m £m
Revenue 166.1 145.3 14%
Gross profit 102.5 80.9 27%
Gross margin % 61.7% 55.7% 6.0 % pts
Overheads (35.7) (32.6) 10%
Operating profit 66.8 48.3 38%
YEAR ENDED 30 SEPTEMBER 2011 11
Growth across all markets and gross margin % improvement
• Sales revenue up 14% to a record £166.1m
• Gross margin benefits from operational gearing
• Continued investment in resources to drive and support growth

Group End Markets
YEAR ENDED 30 SEPTEMBER 2011 12
Growth across all geographies and market segments
2011: 2,860 tonnes
+13%
2010: 2,535 tonnes
Industrial+11%

VPS Market Highlights - Industrial
13
• Volume up 11% on 2010
• Oil and gas growth driven by:– Oil price– Capital investment
• Industrial machinery and processing equipment:– Increased demand – Capital investment
1,0281,144
YEAR ENDED 30 SEPTEMBER 2011

VPS Market Highlights - Transport
14
• Volume up 10% on 2010
• Automotive:– Recovery in vehicle production and sales globally– Continued strong sales of luxury cars
• Aerospace:– Demand stable following strong recovery in 2010– Continued delay in 787 production
674741
YEAR ENDED 30 SEPTEMBER 2011

VPS Market Highlights - Electronics
15
• Volume up 16% on 2010
• Semiconductor manufacturing:– Strong investment in H1 in US and Asia– H2 demand softened
• Consumer electronics:– Innovation and product renewals remained strong
558646
YEAR ENDED 30 SEPTEMBER 2011

VPS - Development PipelineStrong pipeline of applications 309 tonnes MAV commercialised
YEAR ENDED 30 SEPTEMBER 2011 16
Medical2%
Sept 2010:
2,271 tonnes
Sept 2011:
2,328 tonnes
Medical3%
Auto-motive32%
Aero-space19%
Auto-motive28%
Aero-space22%
Electronics20%
Industrial26%
Transport51%
Electronics22%
Industrial26%
Transport50%

VPS - Outlook
YEAR ENDED 30 SEPTEMBER 2011 17
Regional view Global market view
Asia Optimistic Oil & gasAerospace
US NeutralAutomotive
Consumer electronics Industrial machinery
Europe Cautious Semiconductor
GrowthMinimal inventory adjustment Optimistic
Growth potentialStrong indicators
Modest growthModest inventory adjustment Neutral
Growth potentialConsumer confidence
Growth challengeQ1 inventory adjustment Cautious
Investment decisionsConsumer confidence

Invibio® Biomaterial Solutions
YEAR ENDED 30 SEPTEMBER 2011 18
Invibio Highlights
YEAR ENDED 30 SEPTEMBER 2011 19
Continued growth in a challenging environment
• Record revenue and profit
• 55 additional long-term supply agreements in Americas (16),
Europe (24) and Asia (15)
• Continued growth and innovation in spine
• Growth in emerging markets
• Additional focus on target markets

Invibio Income Statement
Year ended 30 September 2011 2010 Growth£m £m
Revenue 49.7 44.2 12%
Gross profit 43.9 39.7 11%
Gross margin % 88.4% 89.7% (1.3)% pts
Overheads (13.6) (11.6) 17%
Operating profit 30.3 28.1 8%
YEAR ENDED 30 SEPTEMBER 2011 20
Revenue growth and strong margins
• Sales revenue up 12% to a record of £49.7m
• Underlying gross margins remain strong
• Investment in resources drive future growth with increased market focus

Invibio Key Markets
YEAR ENDED 30 SEPTEMBER 2011 21
Strong growth in Asia-Pacific and target markets
2011: £49.7m
+12%
2010: £44.2m
Spine+9%
Target markets+54%
Market SegmentsGeographical SegmentsAsia-Pacific
+50%Arthroscopy
+4%
£4.6m10%

Invibio Market Highlights - Spine
YEAR ENDED 30 SEPTEMBER 2011 22
Spine revenue £38.6m (up 9% on 2010)
• PEEK-OPTIMA® continues to be the surgeons’ choice in spinal fusion procedures
• Growth in emerging geographies • Focus on fusion innovation• Growth opportunities in cervical applications
35.538.6
GLIF® courtesy of Alphatec Spine CoRoent® XL courtesy of NuVasive® ROI-C® Cervical Cage courtesy of LDR

Invibio Market Highlights - Developing Markets
YEAR ENDED 30 SEPTEMBER 2011 23
Developing markets revenue £11.1m (up 28% on 2010)
• Established use of PEEK-OPTIMA in shoulder arthroscopy
• Continued use of PEEK-OPTIMA in diverse applications• European and US regulatory approval for ENDOLIGN®
trauma implants
8.7
11.1
BIOSURETM SYNC Tibial Fixation Device courtesy of Smith & Nephew
Piccolo CompositeTM Distal Volar Radius Platecourtesy of CARBOFIX Orthopedics Ltd.

Invibio - Market Environment
YEAR ENDED 30 SEPTEMBER 2011 24
• FDA 510k approval process stabilising
• US and Asia-Pacific cost consciousness driving device pricing pressure
• US payer pushback continues to impact procedural coverage
US Europe Asia-Pacific
Regulatory Stabilising Stable Stable
Reimbursement Transition Stable Transition
Procedural coverage Transition Stable Growing

Group Outlook
YEAR ENDED 30 SEPTEMBER 2011 25
• VPS challenge
• Invibio growth
• Market expectations
• Financial strength
• Strong platform for growth