Embed Size (px)
Citation preview

PotashCorp.com
ScotiabankFertilizers & Chemicals Conference
September 22, 2015
Jochen TilkPresident and CEO

This presentation contains “forward-looking statements" (within the meaning of the US Private Securities Litigation Reform Act of 1995) or “forward-looking information” (within the meaning of appropriate Canadian securities legislation) that relate to future events or our future performance. These statements can be identified by expressions of belief, expectation or intention, as well as those statements that are not historical fact. These statements often contain words such as “should,” “could,” “expect,” “may,” “anticipate,” “believe,” “intend,” “estimates,” “plans” and similar expressions. These statements are based on certain factors and assumptions as set forth in this document, including with respect to: foreign exchange rates, expected growth, results of operations, performance, business prospects and opportunities, and effective tax rates. While we consider these factors and assumptions to be reasonable based on information currently available, they may prove to be incorrect. Forward-looking statements are subject to risks and uncertainties that are difficult to predict. The results or events set forth in forward-looking statements may differ materially from actual results or events. Several factors could cause actual results or events to differ materially from those expressed in forward-looking statements including, but not limited to, the following: variations from our assumptions with respect to foreign exchange rates, expected growth, results of operations, performance, business prospects and opportunities, including our proposal to acquire K+S Aktiengesellschaft (K+S) and effective tax rates; fluctuations in supply and demand in the fertilizer, sulfur, transportation and petrochemical markets; changes in competitive pressures, including pricing pressures; costs and availability of transportation and distribution of our raw materials and products, including railcars and ocean freight; risks and uncertainties related to operating and workforce changes made in response to our industry and the markets we serve; risks and uncertainties related to our international operations and assets; failure to prevent or respond to a major safety incident; adverse or uncertain economic conditions and changes in credit and financial markets; the results of sales contract negotiations within major markets; economic and political uncertainty around the world; risks associated with natural gas and other hedging activities; changes in capital markets; unexpected or adverse weather conditions; catastrophic events or malicious acts, including terrorism; changes in currency and exchange rates; imprecision in reserve estimates; adverse developments in new and pending legal proceedings or government investigations; our prospects to reinvest capital in strategic opportunities and acquisitions, including our proposal to acquire K+S; our ownership of non-controlling equity interests in other companies; the impact of further technological innovation; increases in the price or reduced availability of the raw materials that we use; security risks related to our information technology systems; strikes or other forms of work stoppage or slowdowns; timing and impact of capital expenditures; rates of return on, and the risks associated with, our investments and capital expenditures; changes in, and the effects of, government policies and regulations; certain complications that may arise in our mining process, including water inflows; our ability to attract, retain, develop and engage skilled employees; risks related to reputational loss; earnings; and the decisions of taxing authorities, which could affect our effective tax rates. These risks and uncertainties are discussed in more detail under the headings “Risk Factors” and “Management’s Discussion and Analysis of Results and Operations and Financial Condition” in our Annual Report on Form 10-K for the fiscal year ended December 31, 2014 and in other documents and reports subsequently filed by us with the US Securities and Exchange Commission and the Canadian provincial securities commissions. Forward-looking statements are given only as of the date hereof and we disclaim any obligation to update or revise any forward-looking statements in this presentation, whether as a result of new information, future events or otherwise, except as required by law.
Forward-looking Statements
Slide #2

PotashCorp Overview
World’s largest fertilizer producer by capacity; #1 in potash and among the largest in nitrogen and phosphate.
Canadian potash operations and strategic offshore investments position us to benefit from growth markets.
World-class nitrogen and phosphate businesses focused on historically more stable feed and industrial markets.
Slide#3
Heringer

Potash Market

Source: Fertilizer Week, USDA, IPNI, PotashCorp
Slide #5
Despite Macro Uncertainty and FX Volatility, Potash Costs in Line With 5-Yr Average
Potash Costs by Region and Major Crop
China Rice India Wheat Malaysia Oil Palm
Brazil Soybean
US Corn0
2
4
6
8
10 2015E 5-year Avg
Percentage of Revenue

VAT Impact Expected to be Small Part of Total Fertilizer Cost
Chinese Potash Costs
Source: Fertilizer Week, USDA, IPNI, PotashCorp
Slide #6
Pre-VAT (Retail Potash Price US$350)
Post-VAT(Retail Potash Price US$390)
0
2
4
6
8
10
~1.74% ~1.95%
Cost of N and P Cost of Potash
Percentage of Revenue
Chinese Rice Farmer Fertilizer Costs (2015E)

1993
1994
1995
1996
1997
1998
1999
2000
2001
2002
2003
2004
2005
2006
2007
2008
2009
2010
2011
2012
2013
2014
2015
F20
16F20
17F20
18F20
19F20
20F
20
30
40
50
60
70
80
Actual Consumption
Estimated Consumption*
$250/mt FOB
$300/mt FOB
$350/mt FOB
Million Tonnes KCl Equivalent
Potash Consumption Sensitivity to Potash Price
* Estimated historical consumption and 2016-2020 forecast based on regression model of world crop production and FOB Vancouver potash prices.
We estimate a $50/t change in potash price impacts demand
by ~1.1M tonnes
2020 global consumption range
between 70-72M depending on price
Source: CRU, Fertecon, FAO, PotashCorp
Slide #7

Source: Fertecon, CRU, IFA, PotashCorp
2000
2001
2002
2003
2004
2005
2006
2007
2008
2009
2010
2011
2012
2013
2014
2015
F20
16F20
17F20
18F20
19F20
20F
0
10
20
30
40
50
60
70
80 Shipments Shipment Range ~70
Million Tonnes KCl
Encouraging Demand Trends Support Our Long-term Growth Potential
Global Potash Demand
2.7% CAGR
Longer-term growth expected between 2.5% and 3.0%; in line with historical trend
Slide #8

Potash Positioning and Strategic Highlights

Source: PotashCorp
Lower-cost Delivered Supplier Given Geographic Positioning and Logistical Capability
PotashCorp Positioning – North America
Slide#10
1. Saskatchewan Operations• 5 lower-cost potash operations; Q2/15 cash-
related COGS of $83/tonne*• Finalizing Rocanville expansion (our largest and
lowest cost operation), enabling further cost reductions in 2016
• Operational capability aligned with expected near-term demand; maintain flexibility to meet surges
2. North American Production/Distribution• Extensive and highly efficient North American
infrastructure, including:o4,200 specialized potash railcars o>150 owned or leased US distribution
pointsoHammond, IN warehouse/distribution
facility enables by-pass of Chicago rail congestion
• Top-rated North American sales team
* Cash costs refers to total cost of goods sold less depreciation and amortization.

Source: PotashCorp
Lower-cost Delivered Supplier Given Port Access and Logistical Capabilities
PotashCorp Positioning – Offshore
Slide#11
1. New Brunswick Opportunity• Increasing operational capability to 1.8mmt
through new Piccadilly mine• Only East Coast potash port capability in North
America, with flexibility to serve existing and new markets
• Supply agreement with Heringer; more than 1mmt per year to be served from New Brunswick or from Saskatchewan through Canpotex
2. Canpotex Positioning• One of Canada’s premier exporting companies,
serving approximately 35 countries• Economies of scale, efficiencies and superior
customer service through:o5,400 specialized potash railcars and a
state-of-the-art railcar maintenance facilityoTwo deep water ports (Vancouver, BC and
Portland, WA) oFleet of ocean vessels
• Member company distribution investments in key markets, including Brazil, China, etc.

Cash From Operations Supports Dividend
Cash Flow From Operations Sensitivity*
Source: PotashCorp
$200 $250 $273 $300 $350 0.0
1.0
2.0
3.0
4.0
Q2 2015
Maint. CAPEX (2017+) Dividend
US$ - Billions
Slide#12
Average Realized Potash Price
* Estimate assumes potash sales volumes of 10mmt, FX at 1.25 CAD per USD; nitrogen/phosphate earnings, SG&A, finance costs, freight rates and other income in line with 2015E. Does not include working capital changes.
Dividend ~$1.2B
Maint. Capex~$0.7B
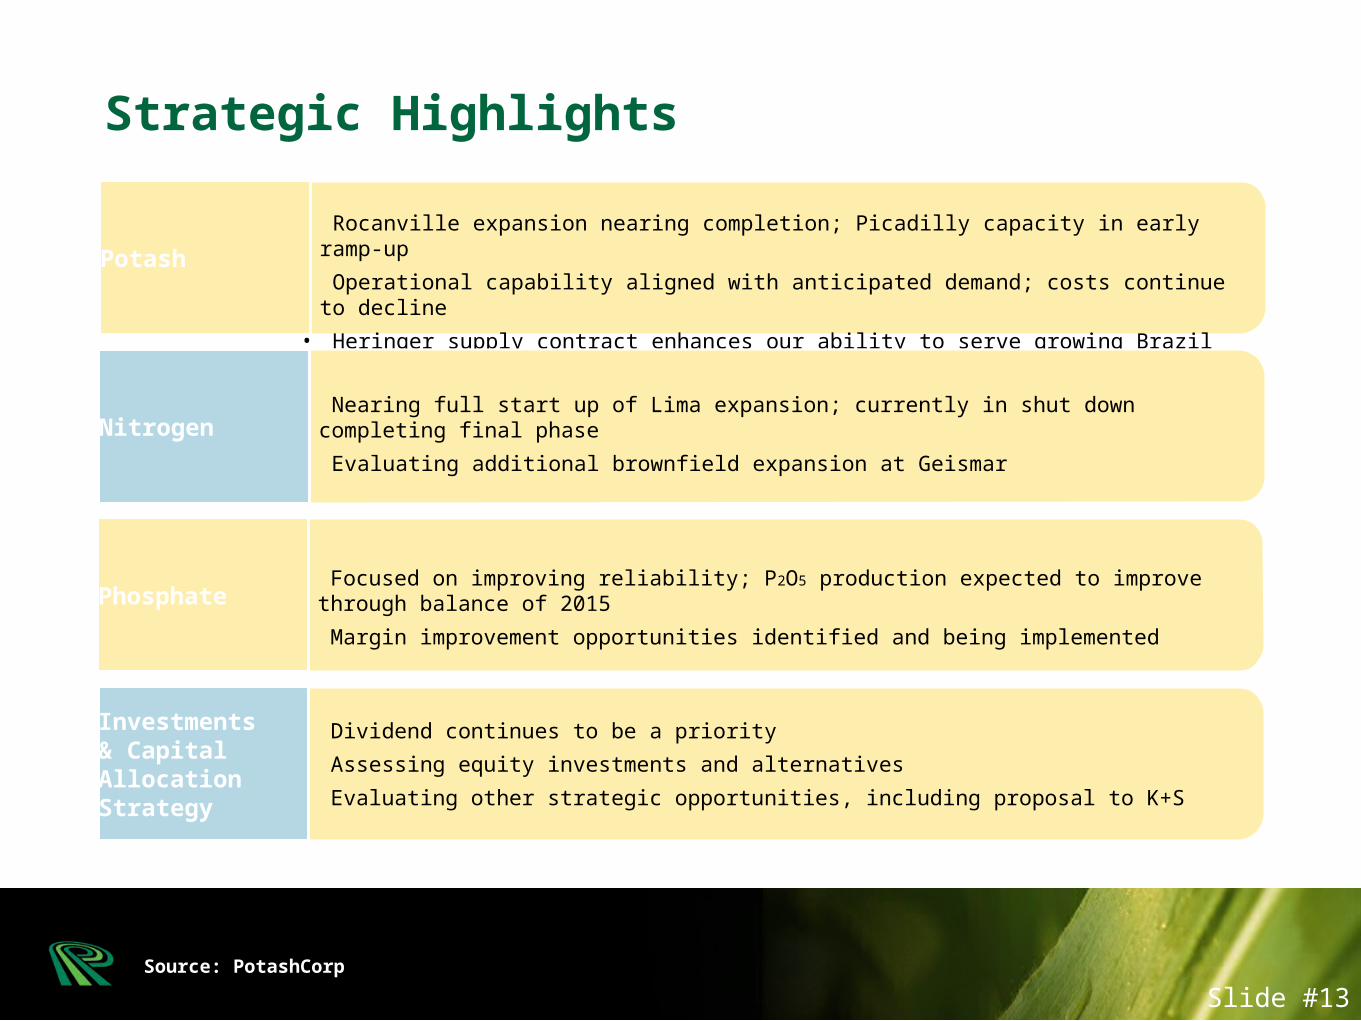
Strategic Highlights
Source: PotashCorp
• Rocanville expansion nearing completion; Picadilly capacity in early ramp-up• Operational capability aligned with anticipated demand; costs continue to decline• Heringer supply contract enhances our ability to serve growing Brazil market
Potash
• Nearing full start up of Lima expansion; currently in shut down completing final phase• Evaluating additional brownfield expansion at GeismarNitrogen
• Focused on improving reliability; P2O5 production expected to improve through
balance of 2015• Margin improvement opportunities identified and being implemented
Phosphate
• Dividend continues to be a priority• Assessing equity investments and alternatives• Evaluating other strategic opportunities, including proposal to K+S
Investments & Capital AllocationStrategy
Slide #13

There’s more online:
PotashCorp.comVisit us online
Facebook.com/PotashCorpFind us on Facebook
Twitter.com/PotashCorpFollow us on Twitter
Thank you