Embed Size (px)
Citation preview
March 14, 2016
Ply Gem Holdings
Fourth Quarter and Full Year 2015 Results
Gary E. Robinette Shawn K. PoeChairman & Chief Executive Officer Chief Financial Officer

LegalDisclaimer
1
These slides and the accompanying oral discussion may contain “forward-looking statements” within the meaning of the PrivateSecurities Litigation Reform Act of 1995. Such statements involve known and unknown risks, uncertainties and other factors that couldcause the actual results of Ply Gem Holdings, Inc. (the “Company”) to differ materially from the results expressed or implied, including:downturns in the home repair and remodeling or the new construction end markets, or the economy or the availability of consumercredit; competition from other exterior building products manufacturers and alternative building materials; inability to successfullydevelop new products or improve existing products; changes in the costs and availability of raw materials; consolidation and furthergrowth of our customers; loss of, or a reduction in orders from, any of our significant customers; inclement weather conditions; increasesin union organizing activity and work stoppages at our facilities or the facilities of our suppliers; our ability to employ, train and retainqualified personnel at a competitive cost; claims arising from the operations of our various businesses prior to our acquisitions; productliability claims, including class action claims, relating to the products we manufacture; litigation outside of product liability claims; loss ofcertain key personnel; interruptions in deliveries of raw materials or finished goods; environmental costs and liabilities; inability to realizeanticipated synergies and cost savings with respect to acquisitions; manufacturing or assembly realignments; threats to, or impairmentsof, our intellectual property rights; increases in fuel costs; changes in foreign currency exchange and interest rates; material non-cashimpairment charges; our significant amount of indebtedness; covenants in the ABL Facility, the credit agreement governing our SeniorSecured Term Loan Facility and the indenture governing the 6.50% Senior Notes; limitations on our net operating losses and paymentsunder the tax receivable agreement to our stockholders; failure to successfully consummate and integrate future acquisitions; actual orperceived security vulnerabilities or cyberattacks on our networks; failure to effectively manage labor inefficiencies associated withincreased productions and new employees added to the Company; failure to generate sufficient cash to service all of our indebtednessand make capital expenditures; control by the CI Partnerships; and the risks set forth in the Company’s filings with the Securities andExchange Commission. Consequently such forward-looking statements should be regarded as the Company’s current plans, estimates andbeliefs. Except as required by law, the Company does not undertake and specifically declines any obligation to publicly release the resultsof any revisions to these forward-looking statements that may be made to reflect any future events or circumstances after the date ofsuch statements or to reflect the occurrence of anticipated or unanticipated events.
In addition, these slides and the accompanying oral discussion reference non-GAAP financial measures, such as adjusted EBITDA. Areconciliation of non-GAAP financial measures to the most directly comparable GAAP financial measure is provided in the Appendix to
these slides and is included in our press release issued on March 14, 2016 and posted on www.plygem.com.

2
41%
55% 45%
2
Fourth Quarter and Full Year 2015 ResultsToday’s Presenters
90%
10%
Agenda
• Fourth Quarter Review Gary Robinette
• Financial Results Shawn Poe
• Acquisition Synergies and Cost Savings Shawn Poe
• Margin Initiatives Gary Robinette
• Economic Outlook Gary Robinette
• Questions and Answers Gary Robinette & Shawn Poe
• Closing Remarks Gary Robinette
3
41%
55% 45%
3
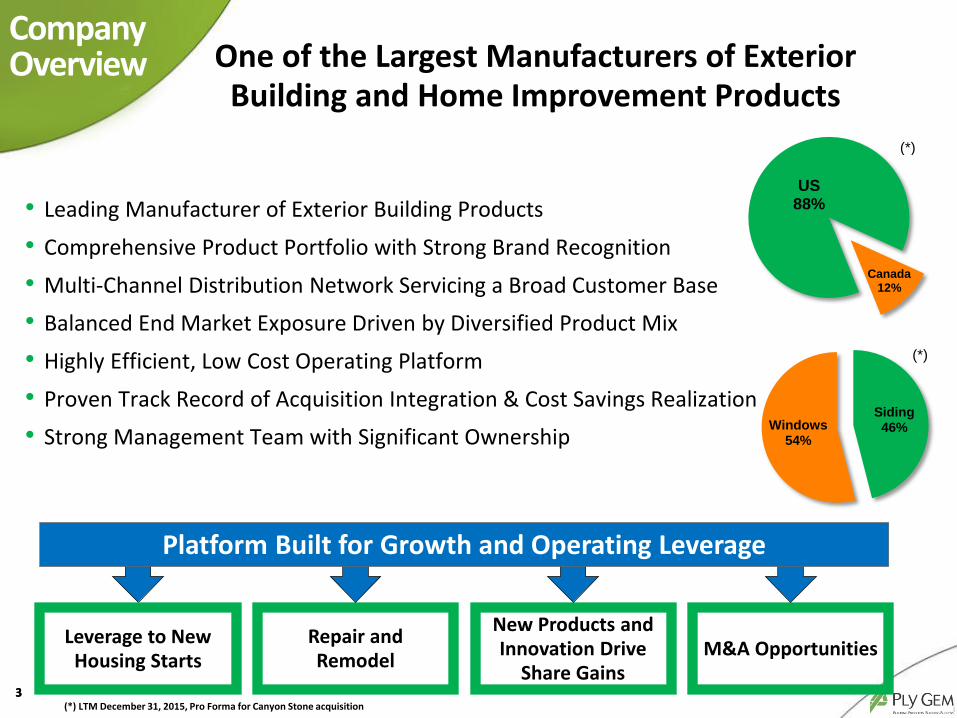
One of the Largest Manufacturers of Exterior Building and Home Improvement Products
90%
10%
CompanyOverview
Repair and Remodel
Leverage to New Housing Starts
New Products and Innovation Drive
Share GainsM&A Opportunities
Platform Built for Growth and Operating Leverage
• Leading Manufacturer of Exterior Building Products
• Comprehensive Product Portfolio with Strong Brand Recognition
• Multi-Channel Distribution Network Servicing a Broad Customer Base
• Balanced End Market Exposure Driven by Diversified Product Mix
• Highly Efficient, Low Cost Operating Platform
• Proven Track Record of Acquisition Integration & Cost Savings Realization
• Strong Management Team with Significant Ownership
US88%
Canada12%
(*)
Siding46%Windows
54%
(*)
(*) LTM December 31, 2015, Pro Forma for Canyon Stone acquisition

4
Ply GemResults
Key Highlights
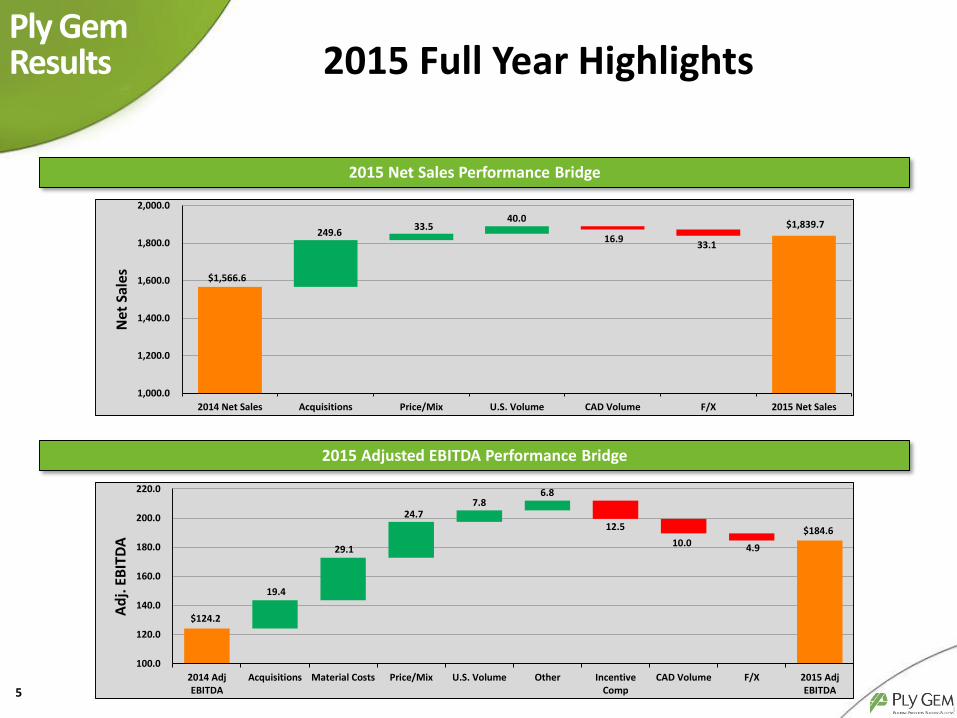
2015 Full Year Highlights
• Sales increase of 17.4% was primarily due to acquisitions and organic growth of 4.7% achieved within the U.S. businesses for each segment as well as increased average selling prices. The growth in the U.S. was partially offset by weaker market conditions in Canada of $16.9 and unfavorable foreign currency exchange rates which negatively impacted sales by $33.1.
• Gross margin expansion of 320 basis points primarily driven by increased average selling prices in our Windows and Doors segment, favorable freight costs, realized acquisition synergies, and favorable commodity costs, partially offset by unfavorable foreign currency impact from a weakening Canadian dollar.
• Operating earnings increased 99.2% driven by acquisitions, margin expansion, continuous improvements, and realized acquisition synergies.
• Adjusted EBITDA as a percent of sales of 10.0% was the highest since 2012. Excluding acquisitions, incremental year-over-year adjusted EBITDA growth of $41.0 or 33.0%.
• Year-end net debt leverage ratio reduced to 5.2x from 8.4x with cash in excess of $109 and available liquidity in excess of $300 million.
($ in Millions) 2015 2014
Net SalesY-O-Y Change
$1,839.717.4%
$1,566.6
Gross ProfitGross Profit %
$419.722.8%
$307.819.6%
Operating EarningsY-O-Y Change
$122.599.2%
$61.5
Adj. EBITDAAs % of Net Sales
$184.610.0%
$124.27.9%
New Construction
53%
Home Repair & Remodel
47%
End Market Exposure
5
Ply GemResults 2015 Full Year Highlights
$184.6 12.5
10.0 4.9
$124.2
19.4
29.1
24.7 7.8
6.8
100.0
120.0
140.0
160.0
180.0
200.0
220.0
2014 AdjEBITDA
Acquisitions Material Costs Price/Mix U.S. Volume Other IncentiveComp
CAD Volume F/X 2015 AdjEBITDA
Ad
j. E
BIT
DA
2015 Adjusted EBITDA Performance Bridge
2015 Net Sales Performance Bridge
$1,839.7
16.9 33.1
$1,566.6
249.6 33.5
40.0
1,000.0
1,200.0
1,400.0
1,600.0
1,800.0
2,000.0
2014 Net Sales Acquisitions Price/Mix U.S. Volume CAD Volume F/X 2015 Net Sales
Net
Sal
es

6
7.4
8.9
7.8
6.7
8.4
5.2
-
2.0
4.0
6.0
8.0
10.0
2010 2011 2012 2013 2014 2015
Leve
rage
Rat
io
Leverage Ratio
($ in Millions) 2010 2011 2012 2013 2014 2015
Senior Notes $875.0 $950.0 $1,000.0 $852.0 $650.0 $650.0
Term Loan Facility - - - - 426.8 422.5
ABL 30.0 55.0 15.0 - - -
Total Debt $905.0 $1,005.0 $1,015.0 $852.0 $1,076.8 $1,072.5
Cash 17.5 11.7 27.2 69.8 33.2 109.4
Net Debt $887.5 $993.3 $987.8 $782.2 $1,043.6 $963.1
Adj. EBITDA $120.6 $112.2 $126.8 $117.5 $124.2 $184.6
Leverage Ratio 7.4 8.9 7.8 6.7 8.4 5.2
Historical Leverage Ratio
Significant De-Leveraging

7
Ply GemResults
Key Highlights
Fourth Quarter 2015 Highlights
• Due to the Company’s fiscal calendar, the fourth quarter of 2015 had 4 fewer ship days than the 2014 fourth quarter, which caused $22.0 of the sales decline. Sales for the U.S. businesses increased 5.0% which included $6.9 related to the Canyon Stone acquisition. The growth in the U.S. was partially offset by weaker market conditions in Canada and unfavorable foreign currency exchange rates which negatively impacted sales by $7.4.
• Gross margin expansion of 500 basis points primarily driven by increased average selling prices in our Windows and Doors segment, favorable freight costs, realized synergies from acquisitions, and favorable commodity costs, partially offset by unfavorable foreign currency impact from a weakening Canadian dollar.
• Seventh consecutive year-over-year quarterly adjusted EBITDA improvement. Excluding acquisitions, incremental year-over-year quarterly adjusted EBITDA growth of 63.7%.
New Construction
53%
Home Repair & Remodel
47%
End Market Exposure
($ in Millions) Q4 2015 Q4 2014
Net SalesY-O-Y Change
$430.5(4.4%)
$450.1
Gross ProfitGross Profit %
$99.923.2%
$82.018.2%
Operating EarningsY-O-Y Change
$28.9265.8%
$7.9
Adj. EBITDAAs % of Net Sales
$43.210.0%
$26.05.8%

8
Ply GemResults Fourth Quarter 2015 Highlights
$43.2
3.3 2.1
1.4
5.1
$26.0 0.6
24.9 2.0 1.6
20.0
30.0
40.0
50.0
60.0
Q4 2014 AdjEBITDA
Acquisitions Material Costs U.S. Volume Other Price/Mix CAD Volume F/X Impact ofShipping Days
Q4 2015 AdjEBITDA
Ad
j. E
BIT
DA
Fourth Quarter Adjusted EBITDA Performance Bridge
Fourth Net Sales Performance Bridge
$430.5 9.7 7.4
22.0
$450.1 6.9 4.3
8.3
300.0
350.0
400.0
450.0
500.0
Q4 2014 Net Sales Acquisitions Price/Mix U.S. Volume CAD Volume F/X Impact ofShipping Days
Q4 2015 Net Sales
Net
Sal
es

9
Windows & Doors (W&D)Segment
Key HighlightsFourth Quarter Results
Leader in Vinyl and Aluminum Windows
$215.6 $217.1
$24.8 $40.8
Q4 2015 Q4 2014
Net Sales
U.S. Canada
$257.9
$240.4
End Market Exposure (*)
• The change in sales for the fourth quarter was mainly due to 4 fewer shipping days in the current quarter. Excluding the 4 fewer shipping days, sales for the U.S. business increased 4.6% due to improvement in U.S. market conditions, higher average selling prices, and improved product mix. Growth in the U.S. was partially offset by weaker market conditions in Western Canada and unfavorable foreign currency exchange rates which negatively impacted sales by $2.2.
• Gross margin improved by 550 basis points driven by a 520 basis point gross margin improvement in our legacy windows businesses due to improved pricing and product mix and realized synergies from the Simonton acquisition, partially offset by unfavorable foreign currency.
• SG&A expense as a percent of net sales decreased from 15.6% to 14.6% or a decrease of $5.1. $1.9 of the decrease relates the elimination of one-time restructuring and integration costs related to our Western Canadian businesses in 2014 and acquisition costs associated with Simonton. The remainder relates to expense reduction initiatives in response to lower market demand in Western Canada as well as the impact of the weakening Canadian dollar.
Q4 2015 Q4 2014
U.S. 18.5% 13.3%
Canada 18.6% 11.8%
W&D Segment 18.5% 13.0%
Gross Margin %
New construction
66%
Home repair & remodel
34%
(*) For the three months ended December 31, 2015

W&D Gross Margin
Less operating leverage due to sales volume decreases driven by weather andpull-back in new construction demand
10
W&D Segment Gross Margin Bridge and Historical Performance
20.9%15.4% 14.0% 15.4% 13.1% 13.8%
9.7%12.9%
18.1%
1,046
622
445 471 431535
618 648715
2007 2008 2009 2010 2011 2012 2013 2014 2015
Historical Gross Margin Performance
Annual Gross Profit % U.S. SFHS (*)
Note: Includes Simonton from date of acquisition
13.0%
18.5%
1.4%
1.6%
4.8% 0.5%
10.0%
12.0%
14.0%
16.0%
18.0%
20.0%
22.0%
Q4 2014 GrossMargin
Selling Price /Product Mix
Commodity Costs Freight Costs Unfavorable FX /Other
Q4 2015 GrossMargin
Quarterly Gross Margin Performance• Selling price/product mix reflect
favorable product mix and impact of selling price increases implemented in January 2015.
• Commodity cost favorability due mainly from PVC resin and aluminum costs, and synergies realized through the Simonton acquisition.
• Favorable freight costs due to decline in fuel pricing partially offset by rising driver and freight insurance costs.

11
Siding, Fencing & Stone (SFS) Segment
Key HighlightsFourth Quarter Results
Market Leader in Vinyl Siding
$166.4 $165.3
$23.6 $26.9
Q4 2015 Q4 2014
Net Sales
U.S. Canada
$192.2
New construction
38%
Home repair & remodel
62%
End Market Exposure (*)
• The fourth quarter of 2016 had 4 less shipping days which resulted in a $9.2 decrease in sales compared to the prior year. The decrease was partially offset by the Canyon Stone acquisition which accounted for $6.9 of sales growth. Excluding Canyon Stone and taking into account the fewer shipping days, sales for the segment increased 5.7% due to favorable market demand for our products. Growth in the segment was partially offset by unfavorable foreign currency exchange rates which negatively impacted sales by $5.2.
• Gross margin expanded by 400 basis points, driven by favorable material cost pricing and favorable freight expense, partially offset by unfavorable foreign currency.
• SG&A expense increased $2.0 which was due largely to the Canyon Stone acquisition which accounted for $1.4 of the SG&A expense increase with the remainder due to incentive compensation included in the current period.
Gross Margin %
Q4 2015 (**) Q4 2014
U.S. 29.8% 25.9%
Canada 25.4% 20.7%
SFS Segment 29.2% 25.2%
$190.0
(*) For the three months ended December 31, 2015(**) Includes the impact of Canyon Stone

SFS Gross Margin
12
SFS Segment Gross Margin Bridge and Historical Performance
20.4% 18.4% 25.9% 25.7% 24.8% 27.4% 26.8% 26.1% 28.4%
.5208
.6200
.5288
.6458.6971 .6975 .7134
.7534.7250
2007 2008 2009 2010 2011 2012 2013 2014 2015
Historical Gross Margin Performance
Annual Gross Profit % PVC Resin Price (*)
25.2%
29.2% 3.3%
0.7%
7.1%
0.9%
20.0%
22.0%
24.0%
26.0%
28.0%
30.0%
32.0%
34.0%
Q4 2014 Gross Margin Commodity Costs Freight Costs Selling Price /Product Mix
Unfavorable FX /Other
Q4 2015 Gross Margin
Quarterly Gross Margin Performance• Commodity cost favorability due
mainly from PVC resin and aluminum costs.
• Favorable freight costs due to decline in fuel pricing partially offset by rising driver and freight insurance costs.
• Selling price/product mix reflects a higher proportion of metal products sold during the quarter compared to the prior year which carry a lower gross margin.

Acquisition Synergies and Cost Savings
AcquisitionSynergies
• 3Q 2014 – $8 million of synergies and cost savings from Simonton acquisition identified through raw material sourcing, manufacturing efficiencies, insourcing products and SG&A
• 1Q 2015 – $2 million of additional incremental synergies and cost savings from Simonton acquisition identified primarily through raw material sourcing
• 2Q 2015 – $1 million of synergies and cost savings from Canyon Stone acquisition identified through manufacturing efficiencies and raw material sourcing
• 4Q 2015 – $8 million of additional incremental synergies and cost savings from Simonton acquisition identified primarily through SG&A leverage scale and raw material sourcing and insourcing products
$19.0
$8.0
$2.0
$8.0 $1.0
$-
$5.0
$10.0
$15.0
$20.0
$25.0
OriginalSimonton Synergies
Incremental 2015Simonton Savings
Incremental 2016Simonton Savings
Canyon Stone Synergies Acquisition Synergies
13

14
Margin Initiatives
The Market Innovator
The Leading Brand
Lean through Technology
Our Future Leaders
New Channels and Markets
Selling Price Increases
Q1 2016 price increases have been announced in October 2015 for the W&D Segment. Selling price increases range from 6% to 12%
Q2 2016 price increases have been announced in January 2016 for the Canadian siding products due to the continued weakening of the Canadian dollar. Selling price increases range from 5% to 8%
Continued Implementation of Enterprise Lean and Sales & Operations Planning (S&OP) System in U.S. Windows and Doors
Enterprise Lean provides product simplification and improves manufacturing flexibility. Realized approximately $4.5 of benefit in 2014 and 2015, and anticipated to provide for an annual savings of approximately $10.0 when fully implemented in 2016
S&OP system provides enhanced capacity and resource planning system which will reduce future ramp-up costs and maximize fixed manufacturing investments
Ply Gem Margin Enhancement Initiatives
Cross Selling Opportunities
Continue to integrate our extensive product categories across our legacy customer base and acquired Simonton customer base

15
$-
$100
$200
$300
$400
2007 Trough 2015 Mid-Cycle
Adjusted EBITDA(in millions)
Previous Mid-
Cycle (2007)
Cycle Trough
(2009-2011)2015 Results
Future Mid-
Cycle
U.S. Single Family Housing Starts (in thousands) 1,036 450 715 (*) 1,000
Net Sales $1.4B $0.9B $1.8B ~$2.8B
Gross Margin 20.6% 21.1% 22.8% >25%
Adj. EBITDA $176M $118M $184.6M ~$350M - $400M
• The U.S. housing market can support approximately 1 million single family housing starts based on current household formation rates
• Gross margin improvement from leverage on volume, regional/custom builders returning to the market, and continued pricing discipline within the window industry
Mid-CycleOutlook Mid-Cycle Outlook
(*) Source: U.S. Census Bureau

16
Ply GemOutlook
The Market Innovator
The Leading Brand
Lean through Technology
Our Future Leaders
New Channels and Markets 1Q 2016 Guidance
Based on the forecasted growth of the U.S. housing market and R&R spend, the impact of our enacted selling price increases and other margin enhancing initiatives, we expect our adjusted EBITDA for 1Q 2016 to be in the range of $11.0 to $16.0 which represents a $9.0 to $14.0 year-over-year improvement.
Economic Outlook & Guidance
Expect Continued Steady Growth in U.S. Housing Starts
Expect continued overall moderate growth of 5% to 10% in U.S. housing recovery in 2016, however we expect the market to experience periods of choppiness
Expect an overall moderate growth rate for big ticket R&R spend of approximately 2% to 3% in 2016
Overall Canadian housing starts expected to moderate relative to 2015 with lower starts in oil-producing regions of Western Canada partially offset by higher starts in other regions

Q&A
17

Appendix:
Non-GAAP Adjusted EBITDA Reconciliation
18

(amounts in thousands) For the three months ended
December 31, 2015For the three months ended
December 31, 2014
Net income (loss) $9,064 ($12,476)
Interest expense, net 18,234 19,185
Provision for income taxes 1,074 15,828
Depreciation and amortization 14,092 14,554
EBITDA $42,464 $37,091
Non cash loss on foreign currency transactions 1,065 475
Acquisition costs 9 477
Customer inventory buybacks 266 767
Restructuring/integration expense (57) 2,287
Tax receivable agreement liability adjustment (520) (15,089)
Adjusted EBITDA $43,227 $26,008
19
Fourth Quarter Adjusted EBITDA ReconciliationAppendix

(amounts in thousands) For the three months ended
December 31, 2015For the three months ended
December 31, 2014
SFS Segment W&D Segment Total SFS Segment W&D Segment Total
Non cash loss on foreign
currency transactions$162 $903 $1,065 $149 $326 $475
Acquisition costs 9 - 9 - 477 477
Customer inventory buybacks 194 72 266 767 - 767
Restructuring/integration
expense(4) (53) (57) 689 1,448 2,137
$361 $922 $1,283 $1,605 $2,251 $3,856
20
Fourth Quarter EBITDA Adjustments By Segment(*)Appendix
(*) Does not reflect unallocated and corporate EBITDA adjustments

(amounts in thousands) For the year ended
December 31, 2015For the year ended
December 31, 2014
Net income (loss) $32,288 ($31,269)
Interest expense, net 74,819 71,186
Benefit for income taxes (688) (105)
Depreciation and amortization 58,400 48,463
EBITDA $164,819 $88,275
Non cash loss on foreign currency transactions 3,166 992
Acquisition costs 656 1,188
Customer inventory buybacks 957 1,555
Restructuring/integration expense 3,221 6,493
Non cash charge of purchase price allocated to inventories 54 38
Litigation settlement, net (1,194) 5,000
Loss on modification or extinguishment of debt - 21,364
Tax receivable agreement liability adjustment 12,947 (670)
Adjusted EBITDA $184,626 $124,235
21
Full Year Adjusted EBITDA ReconciliationAppendix

(amounts in thousands) For the year ended
December 31, 2015For the year ended
December 31, 2014
SFS Segment W&D Segment Total SFS Segment W&D Segment Total
Non cash loss on foreign
currency transactions$954 $2,212 $3,166 $427 $565 $992
Acquisition costs 397 259 656 - 1,188 1,188
Customer inventory buybacks 447 510 957 1,432 123 1,555
Restructuring/integration
expense482 2,739 3,221 723 5,620 6,343
Non cash charge of purchase
price allocated to inventories54 - 54 - 38 38
Litigation settlement, net - (1,194) (1,194) - 5,000 5,000
$2,334 $4,526 $6,860 $2,582 $12,534 $15,116
22
Full Year EBITDA Adjustments By Segment(*)Appendix
(*) Does not reflect unallocated and corporate EBITDA adjustments