Embed Size (px)
Citation preview

EARNINGS 4Q14 & 2014
Conference Call
March 2, 2015

Safe-Harbor Statement
We make forward-looking statements that are subject to risks and uncertainties. These statements
are based on the beliefs and assumptions of our management, and on information currently
available to us. Forward-looking statements include statements regarding our intent, belief or
current expectations or that of our directors or executive officers.
Forward-looking statements also include information concerning our possible or assumed future
results of operations, as well as statements preceded by, followed by, or that include the words
''believes,'' ''may,'' ''will,'' ''continues,'' ''expects,'‘ ''anticipates,'' ''intends,'' ''plans,'' ''estimates'' or
similar expressions. Forward-looking statements are not guarantees of performance. They involve
risks, uncertainties and assumptions because they relate to future events and therefore depend on
circumstances that may or may not occur. Our future results and shareholder values may differ
materially from those expressed in or suggested by these forward-looking statements. Many of the
factors that will determine these results and values are beyond our ability to control or predict..
2

Gafisa Segment
3
▲ The Gafisa segment did not launch new projects in the fourth quarter. Therefore, in 2014, the Gafisa segment reached R$1.0 billion in launches, slightly below the range established in the launch guidance for the year of R$1,100 – R$1,200 million.
▲ Net pre-sales totaled R$177.3 million in 4Q14, down 61.0% y-o-y, and down 9.0% q-o-q. In 2014 net pre-sales amounted to R$811.0 million, compared to R$961.2 million in 2013;
▲ Adjusted gross profit for the quarter was R$150.8 million, with 30.7% adjusted gross margin. In 2014, adjusted gross profit totaled R$560.3 million, with 35.4% adjusted gross margin. Excluding non-recurring events that affected margins this quarter, adjusted gross margin reached 37.1% in 4Q14 and 37.4% in 2014;
▲ In 4Q14 adjusted EBITDA reached R$81.8 million, with a 16.7% margin. In 2014, adjusted EBITDA was R$296.7 million, with a 18.8% margin;
▲ In 4Q14 Gafisa’s net profit was R$36.8 million, while in 2014 it reached R$66.9 million. Excluding AUSA’s equity income, we reached a R$16.1 million profit in 4Q14 and R$34.6 million in 2014.
4Q14 and 2014 Results

Gafisa Segment
4Q14 3Q14 Q/Q (%) 4Q13 Y/Y (%) 2014 2013 Y/Y (%)
Launches - 419,134 - 679,154 - 1,023,012 1,085,341 -6%
Pre-Sales 177,294 194,892 -9% 454,457 -61% 811,032 961,200 -16%
Pre-Sales of Launches 57,770 130,368 -56% 264,049 -78% 342,387 428,102 -20%
Sales over Supply (SoS) 7.2% 7.2% 0 bps 17.8% -1060 bps 26.1% 31.4% -530 bps
Delivered projects, units 1,412 366 286% 1,110 27% 3,806 4,315 -12%
Net Revenue 490,947 365,256 34% 489,853 0% 1,580,860 1,663,751 -5%
Adjusted Gross Profit¹ 150,806 141,462 7% 205,660 -27% 560,254 651,973 -14%
Adjusted Gross Margin¹ 30,7% 38.7% -801 bps 42.0% -1127 bps 35.4% 39.2% -380 bps
Adjusted EBITDA ² 81,843 76,696 7% 85,970 -5% 296,702 309,248 -4%
Adjusted EBITDA Margin² 16.7% 21,0% -433 bps 17,6% -88 bps 18,8% 18,6% 18 bps
Net Income (Loss) 36,819 15,263 141% 908,827 -96% 66,888 985,805 -93%
1) Adjusted for capitalized interest
2) Adjusted for expenses with stock option plans (non-cash) and minority. Does not include AUSA equity income.
(R$ 000 and % Gafisa)
Operational and Financial Highlights
4

Gafisa Segment
Launches
Gross Sales By Market
340
520
453
544
244
291
221
453
235
318 294
213
27 55 46 56 48 63
41 55 33
54 52 49
1Q12 2Q12 3Q12 4Q12 1Q13 2Q13 3Q13 4Q13 1Q14 2Q14 3Q14 4Q14
SP + RJ Other markets
▲ Adjusted gross margin
reached 30.7%, below recent
quarters’ margins, due to non-
recurring events. Excluding non-
recurring events, margin was
37.1% in 4Q14.
▲ Higher revenues related to the
recognition of revenues of
projects launched in 2014. Net Revenues
Stable gross margin and declining G&A
▲ SG&A decreased by 20.0%
compared to previous year.
5
Adjusted Gross Margin
82% 95%
86% 95% 98% 97% 98%
18% 5%
14% 5% 2% 3% 2%
2012 2013 2014 1Q14 2T14 3T14 4T14
SP+RJ Other Markets
227
546
114
814
101
217
107
679
354 315
419
0
1Q12 2Q12 3Q12 4Q12 1Q13 2Q13 3Q13 4Q13 1Q14 2Q14 3Q14 4Q14
27,6%
42,0% 38,7%
30,7%
39,2% 35,4%
4Q12 4Q13 3Q14 4Q14 12M13 12M14

Segmento Tenda
▲ Tenda launches reached R$241.5 million in the quarter. In the12M14 launches reached R$613.3 million;
▲ Net pre-sales totaled R$126.6 million in the quarter and R$396.0 million in the year;
▲ Adjusted gross profit was R$45.3 million, with 28.6% margin compared to adjusted gross profit of R$61.2 million and 28.5% margin in 4Q13. In the 12M14 to adjusted gross profit was R$153.1 million with a margin of 26,9%, compared to R$122.7 million adjusted gross profit and 15.0% margin in 12M13;
▲ Adjusted EBITDA was negative R$30.9 million in 4Q14, compared to positive R$13.8 million last year. For the year, adjusted EBITDA was negative R$67.5 million, compared to negative R$45.6 million last year;
▲ 4Q14 net loss was R$28.8 million, compared to R$12.5 million loss in 4Q13. In the 12M14, Tenda’s net loss was R$109.4 million vs. R$118.4 million last year.
Resultados do 4T14 e 12M14
6

Tenda Segment
4Q14 3Q14 Q/Q (%) 4Q13 Y/Y (%) 2014 2013 Y/Y (%)
Launches 241,549 91,294 165% 88,379 173% 613,299 338,776 81%
Pre-Sales 126,594 35,892 253% 163,626 -23% 395,981 490,403 -19%
Pre-Sales of Launches 92,638 22,490 312% 74,587 24% 176,823 217,435 -19%
Sales over Supply (SoS) 13.3% 4.6% 850 bps 20.9% -760 bps 32.3% 44.2% -1190 bps
Delivered Projects, Units 1,624 1,183 37% 3,487 -53% 6,264 7,027 -11%
Net Revenue 158,329 128,935 23% 214,897 -26% 570,138 817,460 -30%
Adjusted Gross Profit¹ 45,262 38,458 18% 61,214 -26% 153,088 122,683 25%
Adjusted Gross Margin¹ 28.6% 29.8% -124 bps 28.5% 10 bps 26.9% 15.0% 1190 bps
Adjusted EBITDA ² (30,856) (9,828) 214% 13,761 -324% (67,503) (45,585) 48%
Adjusted EBITDA Margin² -19.5% -7.6% -1190 bps 6.4% -2590 bps -11.8% -5.6% 620 bps
Net Income (Loss) (28,774) (25,219) 14% 12,457 -331% (109,437) (118,361) -8%
1) Adjusted for capitalized interest
2) Adjusted for expenses with stock option plans (non-cash) and minority.
(R$ 000 and % Tenda)
Operational and Financial Highlights
7

Tenda Segment
New Project Launches Gross Pre-Sales
0 0 0 0 14
57 60 84 92
116
75
126
249
345
294 288
226
271
224
154 153
183
107
67
1Q12 2Q12 3Q12 4Q12 1Q13 2Q13 3Q13 4Q13 1Q14 2Q14 3Q14 4Q14
New Projects Legacy Projects
▲ The new sales accounting
policy contributed to the
reduction in dissolutions in 4Q14,
allowing for a higher level of
revenue recognition;
▲ The decrease in Legacy Projects
combined with better margins
from New Projects allowed for the
gradual recovery of profitability; Net Revenue by Business Model
▲ Better management of sales,
general and administrative expenses
enabled a y-o-y reduction of 24.7%
in SG&A, despite higher launches in
2014.
114
33
104 88
181
99 91
242
1Q13 2Q13 3Q13 4Q13 1Q14 2Q14 3Q14 4Q14
0% 10%
76%
55% 39%
64%
85% 100%
90%
24%
45% 61%
36%
15%
2012 2013 2014 1Q14 2Q14 3Q14 4Q14
New Projects Legacy
8
1,4%
13,3%
12,3%
28,5%
14,7%
30,4% 29,8%
28,6%
1Q13 2Q13 3Q13 4Q13 1Q14 2Q14 3Q14 4Q14
Adjusted Gross Margin
New Model allows for gradual margin recovery

Launches – New Model
New Projects – Main Indicators
2013 and 2014 launches show good performance to date, with increased operations in the last quarters.
9
Novo
Horizonte Vila Cantuária Itaim Paulista Verde Vida F1 Jaraguá Viva Mais Campo Limpo
Launches mar-13 mar-13 may-13 jul-13 aug-13 nov-13 dec-13 Location SP BA SP BA SP RJ SP Units 580 440 240 339 260 300 300
Total PSV (R$ 000) 67.8 45.9 33.1 37.9 40.9 40.4 48.0
Unit Sales 580 437 240 320 258 234 298
% Sales 100% 99% 100% 94% 99% 78% 99% Average SoS (Month) 14.1% 5.6% 8.3% 6.4% 11.8% 5.8% 9.5% Transferred 580 429 240 304 256 186 290
% Transferred (Sales) 100% 98% 100% 95% 99% 79% 97%
Work Progress 100% 100% 100% 83% 100% 96% 82%
Verde
Vida F2 Pq. Rio
Maravilha Candeias
Parque das Flores
Palácio Imperial
Vila Florida
Rio da Prata
Recanto de
Abrantes
Monte Alegre
Pq. Santo André
Res. das Palmeiras
Terra Brasilis
Vila Atlântica
Reserva das
Árvores
Launches feb-14 mar-14 mar-14 apr-14 may-14 may-14 aug-14 sep-14 oct-14 nov-14 dec/14 dec/14 dec/14 dec/14
Location BA RJ PE SP RJ MG RJ BA SP SP SP BA BA RJ Units 340 440 432 100 259 432 312 340 200 160 260 300 240 500
Total PSV (R$ 000) 42.4 63.8 58.8 16.4 38.6 60.4 49.6 41.7 31.0 28.8 41.6 36.8 30.6 72.8
Unit Sales 223 200 205 92 32 135 101 95 46 15 - - - -
% Sales 66% 45% 47% 92% 12% 35% 32% 30% 15% 5% - - - - Average SoS (Month) 6.1% 4.9% 5.2% 11.3% 1.6% 4.5% 6.6% 9.9% 6.8% 4.0% - - - - Transferred 177 163 157 87 0 102 68 55 25 0 - - - -
% Transferred (Sales) 79% 82% 77% 95% 0% 76% 67% 58% 54% 0% - - - -
Work Progress 83% 78% 26% 79% 3% 2% 26% 22% 33% 17% - - - -

Consolidated Results
1) Adjusted for capitalized interest
2) Adjusted for expenses with stock option plans (non-cash) and minority. Consolidated EBITDA includes AUSA equity income.
(R$ 000 and % Gafisa)
Operational and Financial Highlights
10
4Q14 3Q14 Q/Q (%) 4Q13 Y/Y (%) 2014 2013 Y/Y (%)
Launches 241,549 510,428 -53% 767,534 -69% 1,636,311 1,424,117 15%
Pre-Sales 303,888 230,784 32% 618,083 -51% 1,207,013 1,451,603 -17%
Pre-Sales of Launches 150,409 152,858 -2% 338,636 -56% 519,210 645,537 -20%
Sales over Supply (SoS) 8.9% 6.7% 220 bps 18.5% -960 bps 27.9% 34.8% -690 bps
Delivered projects. units 3,036 1,549 96% 4,597 -34% 10,070 11,342 -11%
Net Revenue 649,276 494,191 31% 704,750 -8% 2,150,998 2,481,211 -13%
Adjusted Gross Profit¹ 196,068 179,920 9% 266,874 -27% 713,342 774,656 -8%
Adjusted Gross Margin¹ 30.2% 36.4% -620 bps 37.9% -770 bps 33.2% 31.2% 200 bps
Adjusted EBITDA² 71,725 73,463 -2% 138,9 -48% 261,498 430,628 -39%
Adjusted EBITDA Margin² 11.0% 14.9% -382 bps 19.7% -867 bps 12.2% 17.4% -520 bps
Net Income (Loss) 8,045 (9,956) 81% 921,284 -99% (42,549) 867,444 -105%

30% 14% 13%
42%
70% 86% 87%
58%
Until Dec/15 Until Dec/16 Until Dec/17 Until Dec/18
Corporate Debt Project Finance
2.598
892
11
269
1.129
297
Total
Investor Obligations
Working Capital
Project Financing SFH
Debentures - Working Capital
Debentures FGTS
Indebtedness (R$ mm) Leverage 4Q14
Debt Maturity as % of Total Debt
Net Debt/ Equity
TR + 9.25% - 9.8205%
CDI + 1.90% - 1.95% / IPCA + 7.96%
TR + 8.30% - 11.00% / 117.0% - 120.0% CDI
CDI + 0.59%
Debt and Leverage
CDI + 2.20% / 117.9% CDI
1.061 886 498 153
R$
▲ In 2014, R$1.6 billion of gross debt was amortized
▲ R$822.0 million in disbursements;
▲ In 2014, net debt amortization was R$783.1 million.
Net Debt / Equity = 47.1%
Average Cost – 11,7%
0.47x Cash Generation
R$81.0MM in 2014
11
94,0% 96,2%
120,2%
36,1% 44,9% 44,9% 44,3% 47,1%
1Q13 2Q13 3Q13 4Q13 1Q14 2Q14 3Q14 4Q14
Recent Events
12
Interest on Own Capital and Dividends
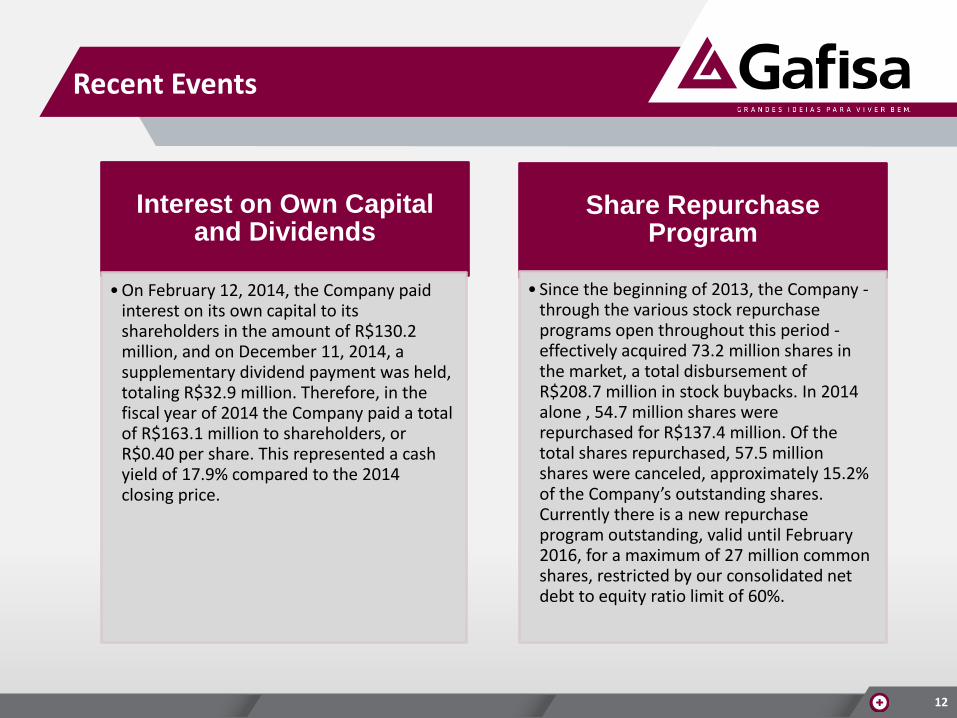
• On February 12, 2014, the Company paid interest on its own capital to its shareholders in the amount of R$130.2 million, and on December 11, 2014, a supplementary dividend payment was held, totaling R$32.9 million. Therefore, in the fiscal year of 2014 the Company paid a total of R$163.1 million to shareholders, or R$0.40 per share. This represented a cash yield of 17.9% compared to the 2014 closing price.
Share Repurchase Program
• Since the beginning of 2013, the Company - through the various stock repurchase programs open throughout this period - effectively acquired 73.2 million shares in the market, a total disbursement of R$208.7 million in stock buybacks. In 2014 alone , 54.7 million shares were repurchased for R$137.4 million. Of the total shares repurchased, 57.5 million shares were canceled, approximately 15.2% of the Company’s outstanding shares. Currently there is a new repurchase program outstanding, valid until February 2016, for a maximum of 27 million common shares, restricted by our consolidated net debt to equity ratio limit of 60%.

Spin Off Process
The Company continued to evaluate the potential separation of the Gafisa and Tenda business units during the fourth quarter. During 2014, several actions were taken in this regard such as: actual separation of several departments including Services, Personnel and Management Center, and Legal among others; the amendment of the registration of Tenda’s category as an issuer with the Brazilian Securities and Exchange Commission (CVM), to Category A; operations with banks and insurance companies for the opening of an independent credit limit for Tenda; and mapping contracts and evaluation of potential impact due to the spin-off. At the same time, the Company continues to evaluate separation alternatives for the two companies. Among the initiatives and studies being undertaken, we highlight: • Evaluation of possible corporate structures; • Evolution of credit facility processes at Tenda; • Evaluation of the future structure of Tenda’s corporate governance; • Evaluation with BM&FBovespa of the necessary procedures for Tenda’s trading, and evaluation of potential Level
1 ADR listing; • Continuation of studies related to the most appropriate capital structure for the business cycle of each company. As stated when we announced the initial studies, we expect that the potential separation, if approved, will be implemented in 2015. The Company will keep its shareholders and the market informed about the progress and developments of this potential spin-off.
Current Status
13