Embed Size (px)
Citation preview

Corporate Presentation
August, 2014

History and Business Model

3
More Than 30 Years of History
48%
Controlling Shareholders ¹ Others
52%
155,298,749 ordinary shares
1. Participation held directly and indirectly by the Controlling Shareholder
2. Data: 05/29/2014
Industrial projects acting
as contractor to third
parties
Important geographic
expansion: Brasília, Rio de
Janeiro and Campinas
Development of projects
focused on the low-income
segment
Beginning of large scale
projects for the low-income
segment
Consolidation of a leading
position in Manaus and
Brasilia
Operations expansion to
PA, RO and ES
IPO 36% annual growth
in PSV launched
(CAGR)
69% annual growth
in net revenue
(CAGR)
Follow-on
MCMV 2
Establishment of
own sales team
1981 - 2005 2006-2007 2008 2009 2010-2011 2012
Record net
revenue of R$ 1.4
Billion, a 28% YoY
growth
More than R$
1 billion on
projects delivered
during 2012
Increasing stock
liquidity
The most relevant
player in the MCMV
2nd phase Level 1
Focus on Cash
Generation and
Construction
Service business
2013
1%
3%
13%
16%
22%
45%
South American
Europe
Brazil
North American
Others
Asian
Free Floating (others 52%)²

Unique Footprint Strong footprint in markets with high growth potential, low
competition and high barriers to entry Low competition in
profitable markets
Track Record in
Operating in the low-
Income segment
Over 30 years of experience
Solid track record in MCMV Level 1 projects
Low equity commitment,
solid margins and high
ROIC
Focus on Large
Scale Projects
Verticalized
Business Model
Strong expertise in large scale ventures
Own work force
Performance-based compensation
Standardized and industrialized production on-site
Large scale operations in
the low-income segments,
with strict cost control and
high margins
4
Direcional: A Unique Business Model
The most profitable
and efficient player in
the low-income sector
‘’’’
High efficiency and profitability
ROE¹ among the highest in the sector LTM ROE¹: 14%
1. LTM ROE: Net Income in the Last Twelve Months / Average Shareholders’ Equity in the Last Twelve Months (net of non-controlling interest in silent partnerships and SPEs)
The best low-income player in Brazil
Industrialization Aluminum panels and concrete walls technology
45 days to develop a five floors building
1
2
3
5
4

Focus on the Low-Income Segment

Launched - Construction Service
(PSV R$ million)
686
924
698523
231
630
2012 2011 2010 2009
CAGR -5%
1H14 2013
Launched - Development
(PSV R$ million)
522772
380
CAGR +91%
1H14 2013
2,041
2012
1,647
2011 2010 2009
154
Construction Service Development
MCMV Level 1
+ Little or no cash burn
+ Higher ROE
+ Lower risk
+ Non-cyclical market
- Lower Margin
Development
- Higher cash burn
- Lower ROE
- Higher risk
- Cyclical market
+ Higher Margin
Total Launched – Track Record
(PSV R$ million)
698924523686630
522380
772
77%80%70%
36%36%
20%
2013 1H14
2,565
2,041
2012
2,345
1,647
2011
1,447
2010
1,067
2009
783
154
1,002
231
% Construction Service
Development
Construction Service
The Growth Coming From The Construction Service (MCMV Level 1)
6

Total Hired % Balance Delivered % %(A) (B) (C) (C/A) (C/B)
Level 1 2.000.000 1.619.400 81% 380.600 552.644 28% 34%
Level 2 1.200.000 1.441.404 100% - 1.040.570 87% 72%
Level 3 400.000 438.836 100% - 142.391 36% 32%
Total 3.600.000 3.499.640 380.600 1.735.605
Results MCMV (Phase 1 & 2) - Up - to Date
MCMV Focus Moving Towards Level 1
Program Challenges ("Ministério das Cidades")
• Hire 381k units in 2H14; (ii) Quality assurance and delivery; (iii) Investments on projects sustainability; (iv) Improvements in the
construction process
Source : Ministério do Planejamento, Orçamento e Gestão 07/2014
Lauch Date Jul/2011 Aug/2012
Level 1 R$48 k - R$65 k R$57 k - R$76 k 17%
Level 2 and 3 R$65 k - R$170 k R$76 k - R$190 k 12%
MCMV 2MCMV 2
(after review)Unit Price D%
+300%
MCMV2
1,600,000
800,000
200,000
MCMV1
1,000,000
400,000
400,000
200,000
2,600,000
Level 1
Level 2
Level 3 The Government increased the price cap of 17% for the units within
the first level of the MCMV Program.
4x
2x
1x
• Brazil’s Federal Government has already shown that its focusing the Level 1 of MCMV, where the BZ housing deficit is heavily
concentrated.
• Such focus is clear when looking the breakdown of the Level 1 from MCMV 1 compared to MCVM 2 and its subsequent update.
7

8
MCMV Level 1 vs Development: Net FCF with no Sales Cancellations
Cash flow (traditional project vs MCMV Level 1 project)
-20%
-10%
0%
10%
20%
0Q -1Q 10Q 9Q 8Q 7Q 6Q 5Q 4Q 3Q 2Q 1Q -2Q -3Q -4Q
Traditional Development
MCMV Level 1 MCMV Level 1 Project Construction
• 100% of units sold to the Federal Government: No delinquency and sales cancelations from this segment, benefiting consolidated figures
• The Fist range of MCMV implies almost no working capital needs.
Land
acquisition Comercial
launch End of
construction
Hired to
Traditional Project Construction
Cash Exposure
MCMV Level 1
Development

9
MCMV: Risk of Discontinuation?
Even considering a potential reduction in the MCMV Level 1 program with a change in political parties, there should be little effect on Direcional.
There are few companies that can deliver high volumes of construction in MCMV Level 1:
MCMV Level 1: 34% of units launched in MCMV Level 1 were delivered
100% 81%
100%
100%
72%
34%
Contracted
100%
100%
Delivered
32%
Program
MCMV Program Phase 1 & 2: Status
(% of Units)
Low Share: Direcional represents 5% of MCMV Level 1 as a whole
Opportunity to increase its share
+500 bps
Source : Ministério do Planejamento, Orçamento e Gestão 07/2014
Level 3
Level 2
Level 1
Level 1 Contracted Units Direcional Share %
MCMV 1 & 2 1.619.400 84.065 5%
MCMV 1 482.741 7.391 2%
MCMV 2 1.136.659 76.674 7%
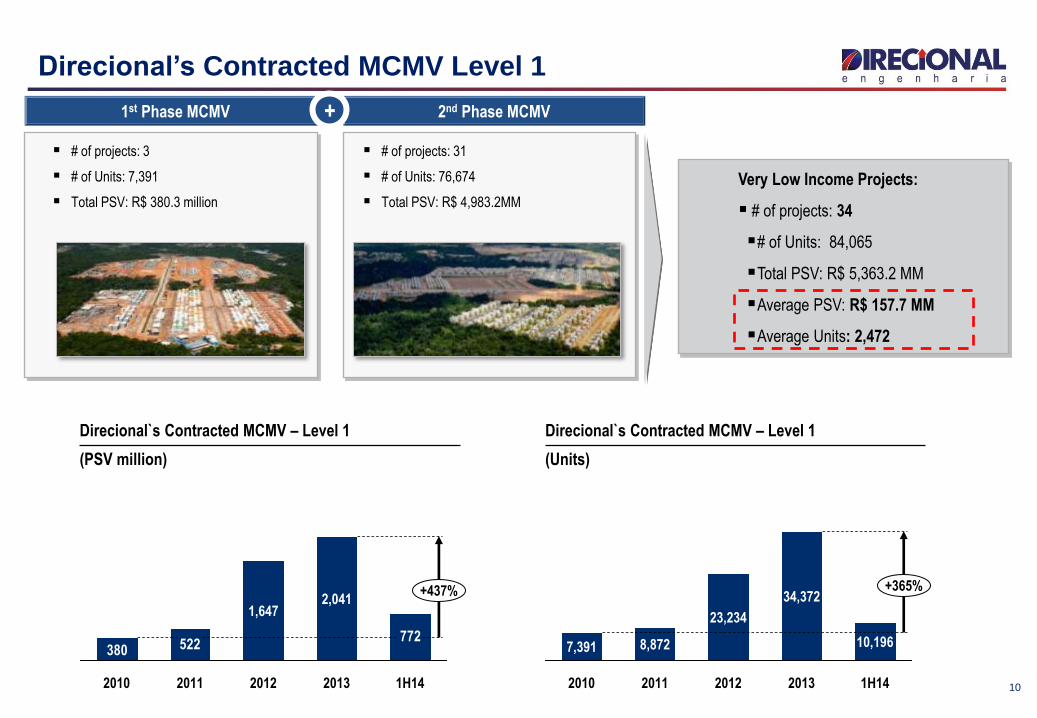
Very Low Income Projects:
# of projects: 34
# of Units: 84,065
Total PSV: R$ 5,363.2 MM
Average PSV: R$ 157.7 MM
Average Units: 2,472
Direcional’s Contracted MCMV Level 1
1st Phase MCMV 2nd Phase MCMV
# of projects: 3
# of Units: 7,391
Total PSV: R$ 380.3 million
# of projects: 31
# of Units: 76,674
Total PSV: R$ 4,983.2MM
+
Direcional`s Contracted MCMV – Level 1
(PSV million)
Direcional`s Contracted MCMV – Level 1
(Units)
772522380
2,041
2010 2012 2011
1,647
+437%
1H14 2013 2012 2010
7,391
+365% 34,372
10,196
2011 1H14
8,872
23,234
2013 10

Focus on Industrialization

Focus on Performance
49% 50% 56% 60% 70% 75% 78% 84% 85% 88%
43% 41% 36% 31%23% 18%
88%
16%5%5% 10%
3Q13 3Q12 2Q12
9% 7%
4Q12 4Q13
7%
1Q13
11% 6%
2Q13
9%
1Q12
8% 4%
2Q14 1Q14
8% 4% 8%
4Q11
7%
Units Under Construction by Construction Method
(% of Units)
1 Aluminum mold and concrete walls method
Industrial Construction¹ Conventional Structure (Concrete Pillars) Concrete Blocks
12
2Q14 2Q13 D %
Units Under Construction 76.211 62.515 22%
% of Industrialization (# of units) 88% 78% 10 p.p.
Construction Sites 58 55 5%
Average # of Units by Construction Sites 1.314 1.137 16%
# of Cities 19 14 36%

Construction Technology
45 days to develop 2 buildings with 5 floors and 4 apartments per floor
Video: http://www.direcional.com.br/ri
Aluminum Panels and Concrete Walls
13

Construction Inflation (INCC) Track Record
Brazilian construction cost index, base 100 = Jan/2003
100
110
120
130
140
150
160
170
180
190
200
210
220
230
240
250
260
jan/03 jan/04 jan/05 jan/06 jan/07 jan/08 jan/09 jan/10 jan/11 jan/12 jan/13
Labor
INCC
(Aggregated Index)
Materials
Source: BACEN and IBGE
14

Operating and Financial Highlights

Launches
82%53%
29%
19%18%
1H14 1H13
Launches by Region - Development
(% PSV)
Launches by Region - MCMV Level 1
(% PSV)
807 772
231
+16%
1H14
1,002
1H13
866
59
Launched PSV
(R$ million)
MCMV Level 1
Development
Launches 1Q14
MG
RS
681,595PSV (R$'000)
Units
Granja Werneck
8,896
89,909PSV (R$'000)
Units
Irmãos Maristas
1,300
16
14%
1H14
12%
88%
1H13
22%
64%
Midwest North Southeast South Northeast

Net Sales and Inventory
Inventory by Region – 1H14
(% PSV)
Inventory
(PSV - R$ million)
807 772
266 237
-6%
1H14 1H13
1,073 1,008
Contracted Net Sales
(PSV - R$ million)
MCMV Level 1
Development
49.6%
2Q13
21.2%
55.1%
4Q13
14.0% 15.4%
3Q13
21.1%
46.9%
1Q14
55.3%
13.5%
2Q14
Without MCMV Level 1 project
With MCMV Level 1 project
Sales-over-supply ratio (VSO)¹
(% Total PSV)
1 - VSO ratio = Sales for the period / (Opening Inventory + Launches in the Period)
41%
40% Southeast
18%
North
Midweast
603
169
-4%
1H14
772
670
130
800
154
2012
571
2013
725
Under Construction
Finished Units
17

18
Deliveries
2Q14
LTM
1,806
1Q14
LTM
4Q13
LTM
1,676
3Q13
LTM
1,237
2Q13
LTM
1,020 1,029
Deliveries – Track Record
(Over the past 12 months: R$ million)
Residencial Macapaba
Parque Carioca
Deliveries by Region and Economic Segment
(Over the past 12 months: % PSV)
Northeast 4%
Midwest
19% North
44%
Southeast
32% 17%
Low-Income
14% Medium
11% Commercial
42%
MCMV Level 1
Upper-Middle 11%
6%
RET 1

Land Bank
72% are large scale projects (over 1,000 units)
56% are eligible for the MCMV Program
82% were acquired by physical or financial Swap
Average acquisition price of 12% over PSV
Land Bank by Segment
(% PSV)
Land Bank Track Record in 1H14
(R$ million in PSV)
Land Bank by Region
(% PSV)
Type of Payment
(% PSV)
Swap 81.8% Cash 18.2%
Low-Income 29%
Upper-Middle
9%
Medium
57%
Commercial
4%
19
ES1%
AM10%
MG44%
RO1%
SP5%
PA6%
DF17%
GO1%
RJ15%
R$ 8 Billion
51.540 units
221
1H14
7,952
Launches
231
Review of
Assumptions
/ Traded and
Cancellation
Acquired
Land Bank
1,021
2013
7,382

60%47%
31%24%
14%
1H14
524
2013
836
2012
457
2011
269
2010
117
% of Gross Revenue
Revenue from Services
(R$ million)
Cash Generation with Growth
1 - Cash Burn: measured by the change in net debt adjusted for dividend payments and shares buyback
2 – Numbers prior to 2012 are not adjusted in accordance with the new consolidation accounting practices (IFRS 11).
1H14
91
2013
76
2012
-183
2011
-176
2010
-283
2009
-95
Cash Burn¹,²
(R$ million)
Net Revenues - Track Record²
(R$ million)
CAGR +47%
1H14
822
2013
1,744
2012
1,449
2011
1,072
2010
782
2009
378
Financing Pass-through (“Repasses”)
(R$ million)
633
+39%
2013
273
360
2012
455
233
222
1H14
282
185
97
"Associativo"
SFH
Service 86%
Development 14%
Revenue to be Recognized
(% Total)
Services
R$ 4,2 Billion
Development
20

Financial Results
1. Adjusted for (non-cash) expenses with the stock option program
Adjusted¹ G&A
(R$ million)
+11% -14%
1H14
56
6.8%
1H13
50
5.8%
2Q14 1Q14
30
7.5%
2Q13
24
5.2% 6.1%
26
Adjusted¹ G&A
% Net revenue
Selling Expenses
(R$ million)
11
2.7%
2Q13
10
2.2%
14
+51% +35%
1H14
25
3.0%
1H13
16
1.9%
2Q14
3.4%
1Q14
Selling Expenses % Net revenue
3,934
+35%
2Q14
3,372
562
2Q13
2,917
2,339
578
MCMV Level 1
Development
Revenues to be Recognized
(R$ million)
Gross Revenue
(R$ million)
179
274
1Q14
409
160
-1%
2Q13
477
235
242
+11%
1H14
863
339
524
1H13
-5%
871
479
392
2Q14
454
250
Development
MCMV Level 1
21

22
Capital Structure
(R$ million)
Loans and Financing – 2Q14
(% of Debt)
642.801
956.347
1Q14
602.814
868.721
2Q13
499.962
944.834
2Q14
Cash
Gross Debt 374
Net Debt
25% 22% 16%
Net Debt / Shareholder's Equity
348 266
Capital Structure
Debt – 2Q14
(R$ million)
13%
CRI
Working Capital
1%
SFH
60%
FINAME and Leasing 5%
Debentures
21%
Net Debt
262
Cash and
Cash
Equivalent
Net Debt
Without SFH
643
Debt
956
SFH
576
381
314

Benchmarking 2013 – Outstanding Results
Direcional: Adjusted for non-cash expenses (Stock-Options Program)
BISA3; -10%
CYRE3; 13%
EVEN3; 15%
EZTC3; 30%
GFSA3; 1%
HBOR3; 26%
MRVE3; 11%
PDGR3; -6%
DIRR3 16%
RDNI3; 12%
RSID3; 2%
TCSA3; 16%
VIVR3; -63%
SETOR; 7%
TRIS3; 6%
22%
27%
32%
37%
42%
47%
52%
-55% -35% -15% 5% 25% 45%
Net
Rev
enu
e LT
M/T
ota
l Ass
ets
Net Margin¹
Slow turnover and margin above averageSlow turnover and margin below average
Fast turnover and margin below average Fast turnover and margin above average
Company; ROE LTMSize: Leverage (Assets/Equity)
Color: Average Prince - Launched Units Last 24 months
Low - up to R$ 200k per unit
Medium - between R$ 200k and R$ 400k per unit
High - above R$ 400k per unit
Setor
18%

24
Contacts
Carlos Wollenweber CFO | IR Officer
Paulo Sousa IR Coordinator
Luiz Felipe Almeida IR Analyst
www.direcional.com.br
(55 31) 3214-6200
(55 31) 3214-6450