Embed Size (px)
Citation preview

August 14 2014
Presentation of Results 2nd quarter 2014

2
Automotive market in 2Q14 had a significant decrease in sales and
production, impacting the Company's results
Tegma entered into a Sale and Purchase Agreement related to the
sale of its subsidiary Direct Express to 8M, a B2W subsidiary
Continued commitment to improving processes Tegma
Highlights
Strategic considerations for positioning the Integrated Logistics
Division

1,032.6
802.2
230.4
978.0
740.8
237.2
Consolidado Automotivo Logística Integrada
565.2
449.7
115.5
504.3
387.7
116.6
Consolidado Automotivo Logística Integrada
Gross Revenue (million of R$)
3
-10.8%
+0.9%
-5.3%
-7.7%
+3.0%
Consolidated Automotive Integrated Logistics
Consolidated Automotive Integrated Logistics
2Q13 2Q14
1H13 1H14
2Q13 2Q14
1H13 1H14
2Q13 2Q14
1H13 1H14
-13.8%

634.9
117.446.6
642.3
80.018.4
Veículos Peças Serviços Logísticos
373.2
64.1
10.9
347.2
36.04.5
Veículos Peças Serviços Logísticos
Gross Revenue | Automotive Division (million of R$)
4
-31.9%
-60.4%
-7.0%
-58.4%
Vehicles Autoparts Logistics Services
Vehicles Autoparts Logistics Services
2Q13 2Q14
1H13 1H14
2Q13 2Q14
1H13 1H14
2Q13 2Q14
1H13 1H14
-43.7%
+1.2%

45.2
11.6
28.2
57.4
16.2
28.2
Leve Armazenagem geral Químicos
8.1
14.0
7.5
2.8
6.0 5.9
Pesado Dedicado Armazenagem alfandegada
Gross Revenue | Integrated Logistics Division (million of R$)
5
+0.1%
-65.4%
-57.3%
-21.4%
2Q13 2Q14
2Q13 2Q14
Lightweight General Warehouse Chemical
Heavy Dedicated Bonded Warehouse
2Q13 2Q14
2Q13 2Q14
2Q13 2Q14
2Q13 2Q14
+27.0%
+39.4%

61.8
94.3
(32.5)
68.877.1
(8.3)
Consolidado Automotivo Logística Integrada
-17.4% -4.4%
14.4%12.9%
7.4%8.8%
41.8
57.0
(15.2)
38.242.8
(4.7)
Consolidado Automotivo Logística Integrada
2Q13 2Q14
-16.2%-5.0%
15.5%13.7%9.1%
9.4%
Adjusted EBITDA (million of R$)
6
+11.3%
-18.2%
-74.4%
-24.9%
-69.4%
2Q13 2Q14 2Q13 2Q14
1H13 1H14 1H13 1H14
Consolidated Automotive Integrated Logistics
Consolidated Automotive Integrated Logistics
EBITDA Mg (%)
1H13 1H14
-8.7%

8.86.3
(4.3) (4.3)
(17.3) (15.2)(10.9)(8.7)
(3.7) (4.7)
8.5%5.5%
-3.3% -3.4%
-18.5% -16.2% -11.6%-8.2%
-3.9% -5.0%-20.0%
-10.0%
0.0 %
10. 0%
20. 0%
30. 0%
40. 0%
50. 0%
60. 0%
70. 0%
80. 0%
-20.0
-15.0
-10.0
-5.0
0.0
5.0
10. 0
1Q12 2Q12 3Q12 4Q12 1Q13 2Q13 3Q13 4Q13 1Q14 2Q14
32.7
39.5
55.6
43.837.3
57.060.1
51.3
34.3
42.8
13.7% 14.6%
17.4%
13.4% 13.1%15.5% 16.1%
14.3%12.1%
13.7%
-2.0%
3.0 %
8.0 %
13. 0%
18. 0%
23. 0%
28. 0%
33. 0%
-8.0
2.0
12. 0
22. 0
32. 0
42. 0
52. 0
62. 0
1Q12 2Q12 3Q12 4Q12 1Q13 2Q13 3Q13 4Q13 1Q14 2Q14
41.5
45.8
51.3
39.5
20.1
41.8
49.3
42.5
30.6
38.2
12.1% 11.9%11.4%
8.7%
5.3%
9.1%
10.5%
9.1%
8.1%
9.4%
-2.0%
3.0 %
8.0 %
13. 0%
18. 0%
23. 0%
28. 0%
33. 0%
-8.0
2.0
12. 0
22. 0
32. 0
42. 0
52. 0
62. 0
72. 0
1Q12 2Q12 3Q12 4Q12 1Q13 2Q13 3Q13 4Q13 1Q14 2Q14
Adjusted EBITDA (million of R$)
7
Consolidated Automotive
Integrated Logistics
EBITDA Mg (%)
4.0 4.88.6 6.4
(4.7) (1.3) (1.3)
1.5
(0.9)
4.8
7.5% 8.0%14.4%
10.6%
-9.7%
-2.6% -3.0%3.1%
-2.1%
10.9%
-20.0%
-10.0%
0.0 %
10. 0%
20. 0%
30. 0%
40. 0%
50. 0%
60. 0%
70. 0%
80. 0%
-20.0
-15.0
-10.0
-5.0
0.0
5.0
10. 0
15. 0
1Q12 2Q12 3Q12 4Q12 1Q13 2Q13 3Q13 4Q13 1Q14 2Q14
32.7
39.5
55.6
43.837.3
57.060.1
51.3
34.3
42.8
13.7% 14.6%
17.4%
13.4% 13.1%15.5% 16.1%
14.3%12.1%
13.7%
-2.0%
3.0 %
8.0 %
13. 0%
18. 0%
23. 0%
28. 0%
33. 0%
-8.0
2.0
12. 0
22. 0
32. 0
42. 0
52. 0
62. 0
1Q12 2Q12 3Q12 4Q12 1Q13 2Q13 3Q13 4Q13 1Q14 2Q14
36.7
44.3
64.2
50.2
32.6
55.7
58.8
52.8
33.4
47.6
12.6%13.4%
16.9%
13.0%
9.8%
13.3%14.1%
12.9%
10.2%
13.4%
-2.0%
3.0 %
8.0 %
13. 0%
18. 0%
23. 0%
28. 0%
33. 0%
-8.0
2.0
12. 0
22. 0
32. 0
42. 0
52. 0
62. 0
72. 0
1Q12 2Q12 3Q12 4Q12 1Q13 2Q13 3Q13 4Q13 1Q14 2Q14
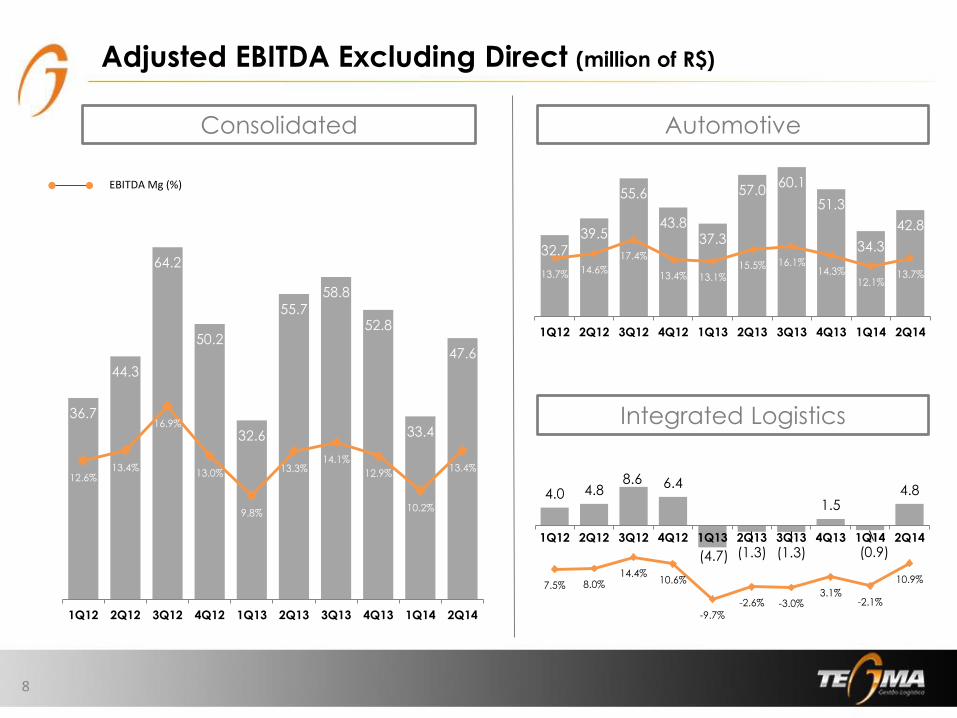
Adjusted EBITDA Excluding Direct (million of R$)
8
Consolidated Automotive
Integrated Logistics
EBITDA Mg (%)

16,2
20,6
1S13 1S14
3,3%
4,8%15,2
19,3
2T13 2T14
1,9%
2,6%
Net Income|(million of R$)
9
2Q14 1S14
before extraordinary effects related to the
sale of Direct Express
15.2
19.3
2.6%
1.9%
16.2
20.6
4.8%
3.3%
2Q14 2Q13 1H14 1H13
26.7 26.9
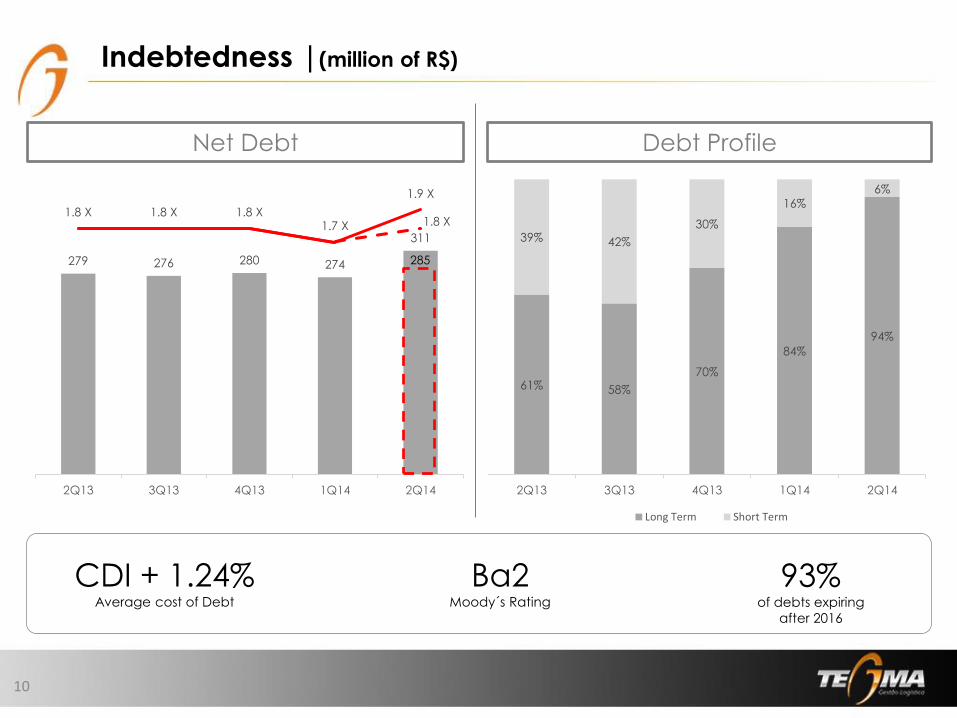
61% 58%
70%
84%
94%
39% 42%
30%
16%6%
2Q13 3Q13 4Q13 1Q14 2Q14
Long Term Short Term
279 276 280 274
311
1.8 X 1.8 X 1.8 X1.7 X
1.9 X
1.8 X
0
50
100
150
200
250
300
350
2Q13 3Q13 4Q13 1Q14 2Q14
0
0.2
0.4
0.6
0.8
1
1.2
1.4
1.6
1.8
2
Net Debt Debt Profile
10
Indebtedness |(million of R$)
285
CDI + 1.24% Average cost of Debt
Ba2 Moody´s Rating
93% of debts expiring
after 2016

20.7
8.2
14.8
9.3
12.0
7.7
16.2
3.85.0
6.8
6.1%
2.1%
3.3%
2.1%
3.2%
1.7%
3.5%
0.8%
1.4%
1.7%
0.0 0%
1.0 0%
2.0 0%
3.0 0%
4.0 0%
5.0 0%
6.0 0%
1Q12 2Q12 3Q12 4Q12 1Q13 2Q13 3Q13 4Q13 1Q14 2Q14
0.0
5.0
10. 0
15. 0
20. 0
25. 0
30. 0
35. 0
40. 0
45. 0
CAPEX % Net Revenue
11
Capital Expenditure|(million of R$)
Contatos de RI
Fabio Carvalho – CEO DRI
+55 (11) 4346-2532
Ian Nunes - GRI
+55 (11) 4397-9423
12
August 14 2014
Presentation of Results 2nd quarter 2014