Embed Size (px)
Citation preview

Telemedicine ServicesP “Improving Operational and Clinical Outcomes”

2

April 2, 2015 3
Pro Forma
SummaryChallenges
Opportunity
Analysis
ROI
Solutions

4

CASE 1: Acute Care ROI Desired Services: TeleIntensivist Services
• 150 Bed Acute Care Hospital (For Profit Entity in Underserved Area)
• 25-35% Annual Transfer Reduction Opportunity (550 patients)
• Increase in Case Mix (Ventilator Patients/Critical Care Dx)
• Increase in Retained Admissions-(Avg. $4000 net per admission)
• Opportunity of 550 patients annually………….$2,200,000 revenue (Hired an intensivist 2 years after ROI completed-Able to recruit an intensivist based on the Telemedicine ROI & Call Coverage)
• ROI excludes financial impact from “Value Based Care” outcomes, “Readmission Reduction”, cmi improvement, improved community image, OP telemedicine consults, employee and provider satisfaction, reduced transfer costs
• Currently the hospital is encouraging utilization of services to realize full potential. The hospital intensivist is currently utilizing telemedicine to improve productivity and efficiency in his practice.
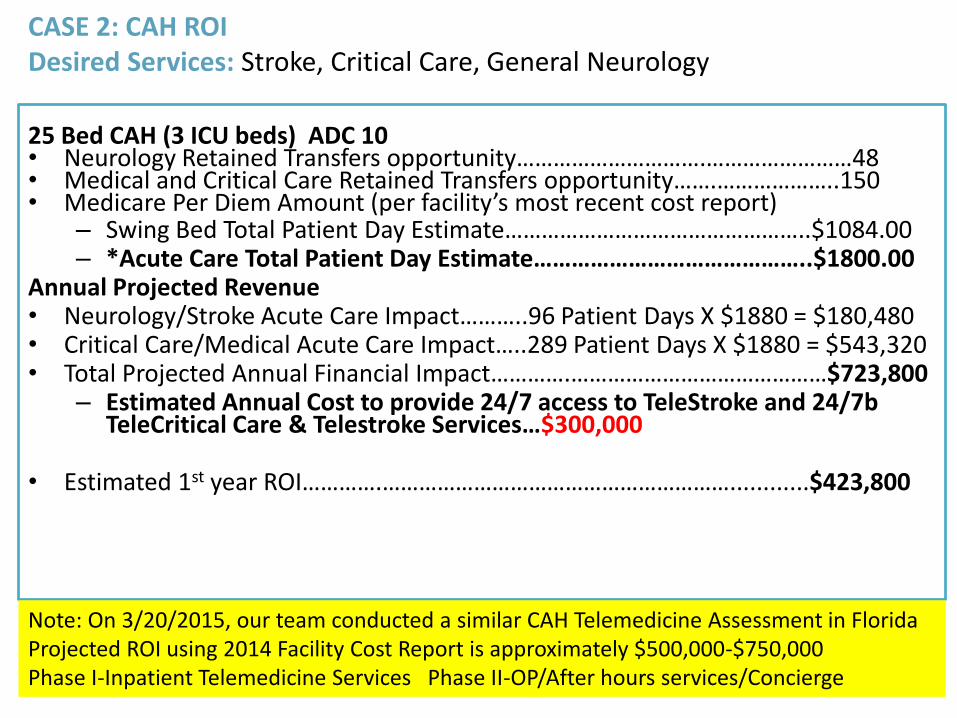
CASE 2: CAH ROIDesired Services: Stroke, Critical Care, General Neurology
25 Bed CAH (3 ICU beds) ADC 10• Neurology Retained Transfers opportunity………………………….……………………48• Medical and Critical Care Retained Transfers opportunity…….………………..150• Medicare Per Diem Amount (per facility’s most recent cost report)
– Swing Bed Total Patient Day Estimate…………………………………………..$1084.00– *Acute Care Total Patient Day Estimate……………………………………..$1800.00
Annual Projected Revenue • Neurology/Stroke Acute Care Impact………..96 Patient Days X $1880 = $180,480 • Critical Care/Medical Acute Care Impact…..289 Patient Days X $1880 = $543,320 • Total Projected Annual Financial Impact………….……………………………………$723,800
– Estimated Annual Cost to provide 24/7 access to TeleStroke and 24/7b TeleCritical Care & Telestroke Services…$300,000
• Estimated 1st year ROI………….…………………………………………………............$423,800
Note: On 3/20/2015, our team conducted a similar CAH Telemedicine Assessment in FloridaProjected ROI using 2014 Facility Cost Report is approximately $500,000-$750,000Phase I-Inpatient Telemedicine Services Phase II-OP/After hours services/Concierge
April 2, 2015 7
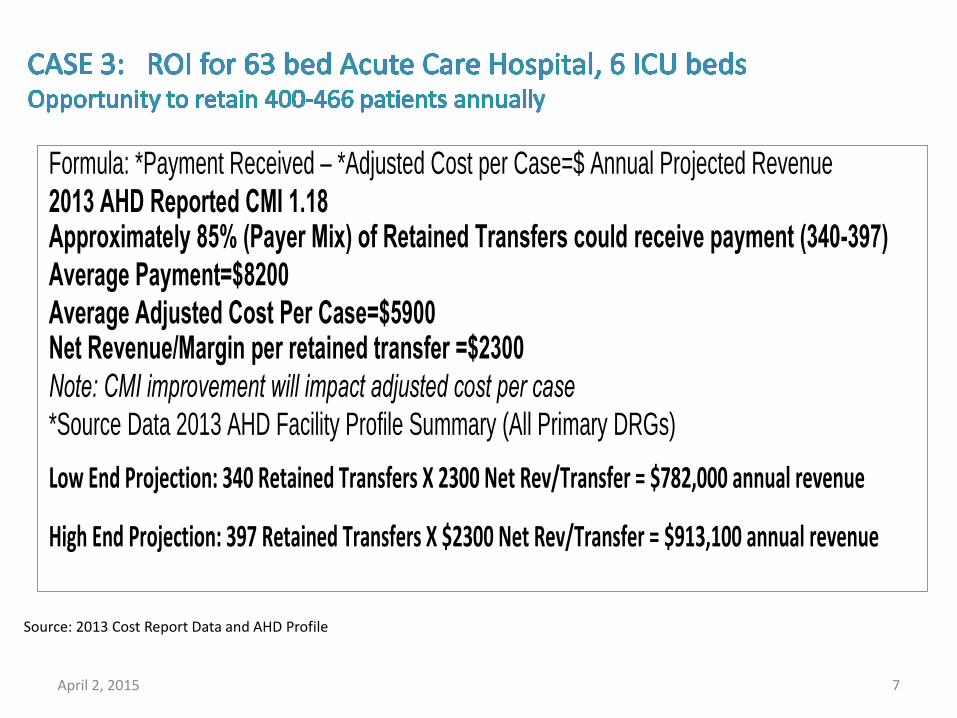
Formula: *Payment Received – *Adjusted Cost per Case=$ Annual Projected Revenue
2013 AHD Reported CMI 1.18 Approximately 85% (Payer Mix) of Retained Transfers could receive payment (340-397)
Average Payment=$8200
Average Adjusted Cost Per Case=$5900 Net Revenue/Margin per retained transfer =$2300
Note: CMI improvement will impact adjusted cost per case
*Source Data 2013 AHD Facility Profile Summary (All Primary DRGs)
LowEndProjection:340RetainedTransfersX2300NetRev/Transfer=$782,000annualrevenue
HighEndProjection:397RetainedTransfersX$2300NetRev/Transfer=$913,100annualrevenue
Source: 2013 Cost Report Data and AHD Profile

April 2, 2015 8
Appropriate Utilization of ICU and Step-down Beds
Improvement in CMI, Cost per Case, LOS and Value Based Care Metrics
Ability to recruit additional service lines (surgery or other invasive services)
Staffing Efficiencies in Special Care Units
Skill Set Retention and Improved Staff Competency
Improved Compliance with Medication Selection, Management and Costs
Improved Staff/Provider Satisfaction
Improved Patient/Family Satisfaction
Community Marketing and Branding Opportunities

9

10
Data Collection• Company Generated Outcome Reports
• Xcel spreadsheets
• Easy Abstraction of data
Benchmarking and Goals
• State, Federal and Facility Benchmarks
• Use of Nationally Recognized Benchmarks/Goals
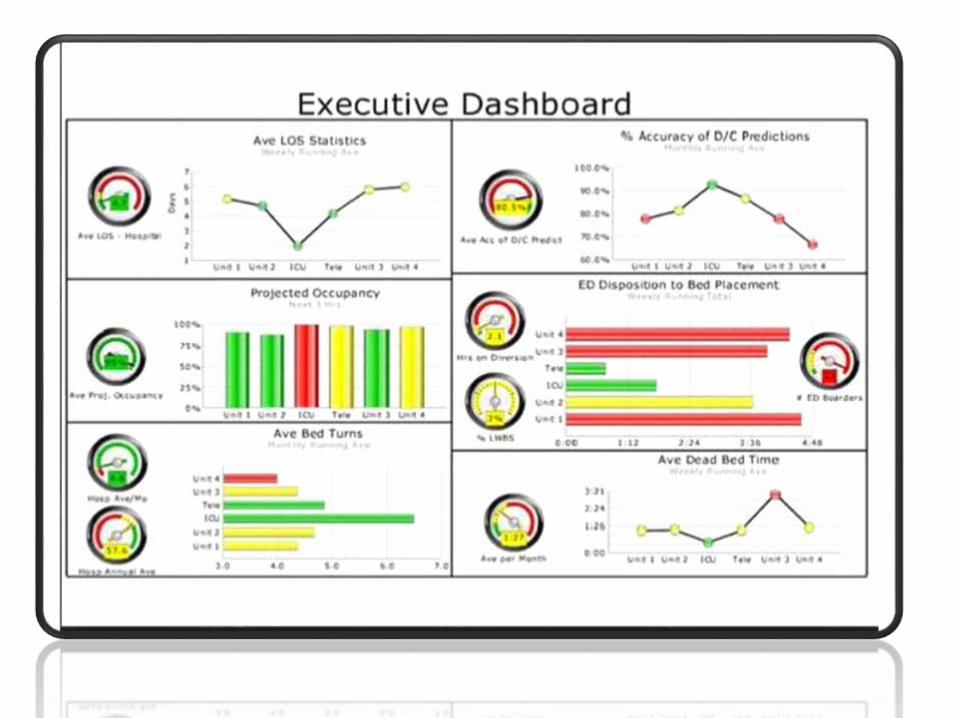
Dashboard Creation
• Global Dashboard Design
• Sort by Service Line
• Sort by Facility Type
• Other Trends/Variations
Consulting and Guidance
• Process Improvement Teams
• Client Scorecard Trends
• Provider Scorecard Trends
• Share Best Practices

11
Operations & Finance Outcomes
Volume Improvements
Community Outreach Results
Provider Recruitment Success
Cost Per Case/Total Cost of Care
Care Management (LOS vs. GMLOS)
Reduced Transfers/Outmigration
Timeliness of Clinical Consults
Denials/Appeals/Overturns
Clinical Services Expansion
Access to Specialty Providers
New Service Line Opportunities
Clinical & Efficiency Outcomes
Value Based Care Metrics
Quality and Efficiency Outcomes
Clinical Care Outcome Metrics
ED Turn Around Times
Preventable Readmissions
Patient Satisfaction Results
Adverse Events/Risk Events
Hospital Acquired Conditions (HACS)
Clinical Bundle Compliance
Telemedicine Service Line Metrics
(i.e. Stroke, Cardiology, ICU, Psych)
Telemedicine Impact Metrics

Sample ScorecardLOS-
Goal < 3.5DischargesPer Month
AdmissionsGoal >450


April 2, 2015 15
Questions