Embed Size (px)
Citation preview
Edelman Health Sector | January 2016
Consumers and the Digital Health Information Journey
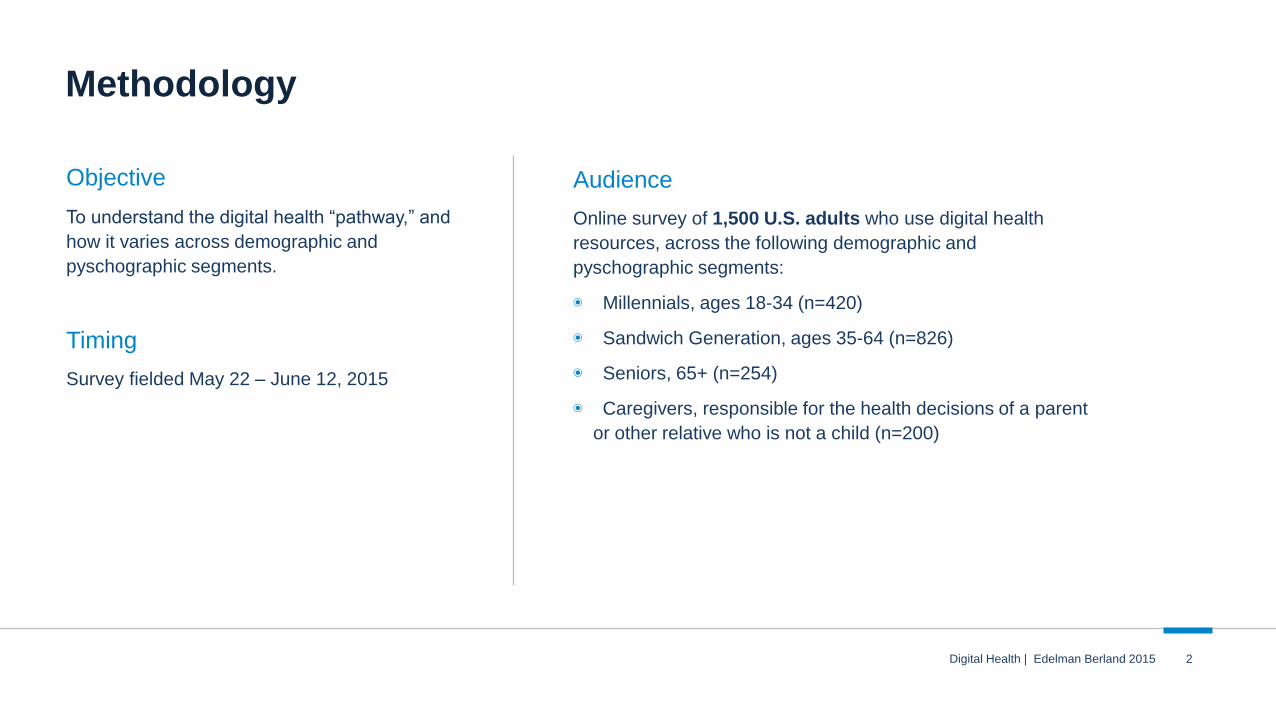
Methodology
Objective
To understand the digital health “pathway,” and
how it varies across demographic and
pyschographic segments.
Timing
Survey fielded May 22 – June 12, 2015
Audience
Online survey of 1,500 U.S. adults who use digital health
resources, across the following demographic and
pyschographic segments:
◉ Millennials, ages 18-34 (n=420)
◉ Sandwich Generation, ages 35-64 (n=826)
◉ Seniors, 65+ (n=254)
◉ Caregivers, responsible for the health decisions of a parent
or other relative who is not a child (n=200)
Digital Health | Edelman Berland 2015 2
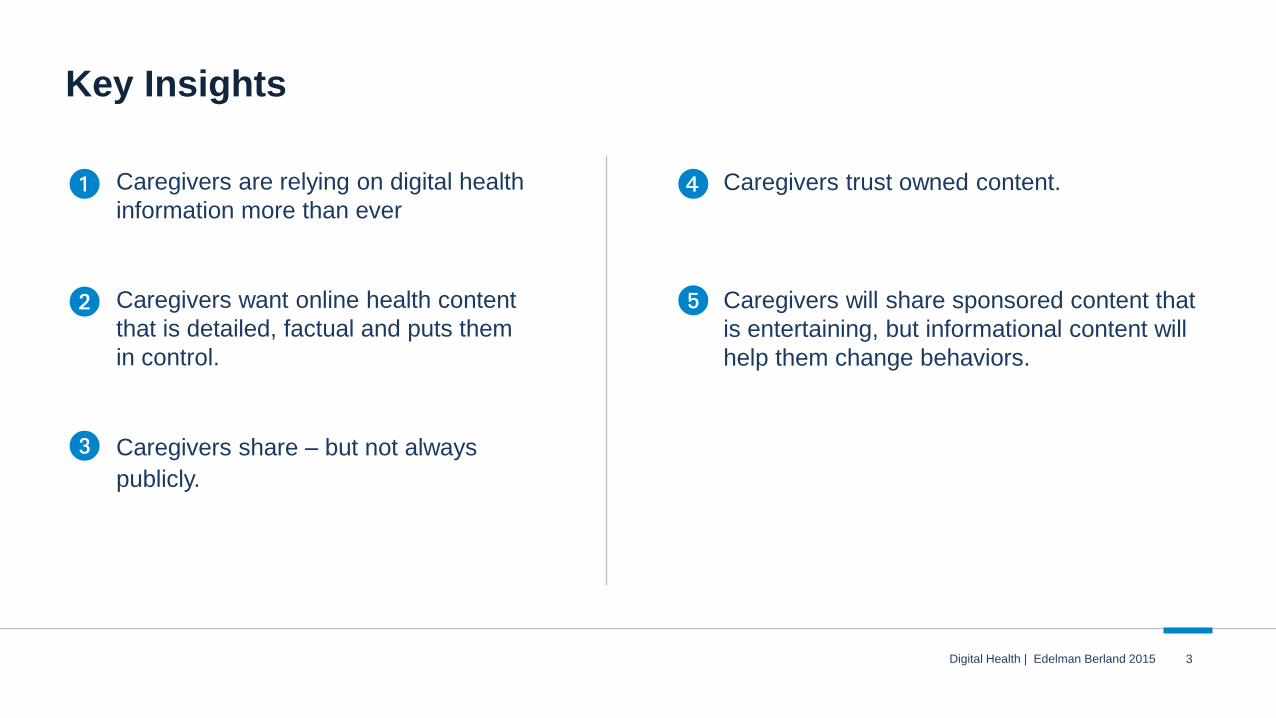
Caregivers are relying on digital health
information more than ever
Caregivers want online health content
that is detailed, factual and puts them
in control.
Caregivers share – but not always
publicly.
Caregivers trust owned content.
Caregivers will share sponsored content that
is entertaining, but informational content will
help them change behaviors.
Key Insights
3Digital Health | Edelman Berland 2015
Caregivers are relying on
digital health information
more than ever
I N S I G H T

Q13: In the past year, would you say that you have become more or less reliant on online resources for information about health?
Q14: For what reasons have you become more reliant on online health resources in that past year? (Open-end, Asked if more reliant, n=578)
Caregivers are increasingly reliant
on digital health informationPercent who are increasingly reliant on online resources compared
to last year—and why:
39%
56%
49%
TotalCaregiversMillennials
5Digital Health | Edelman Berland 2015
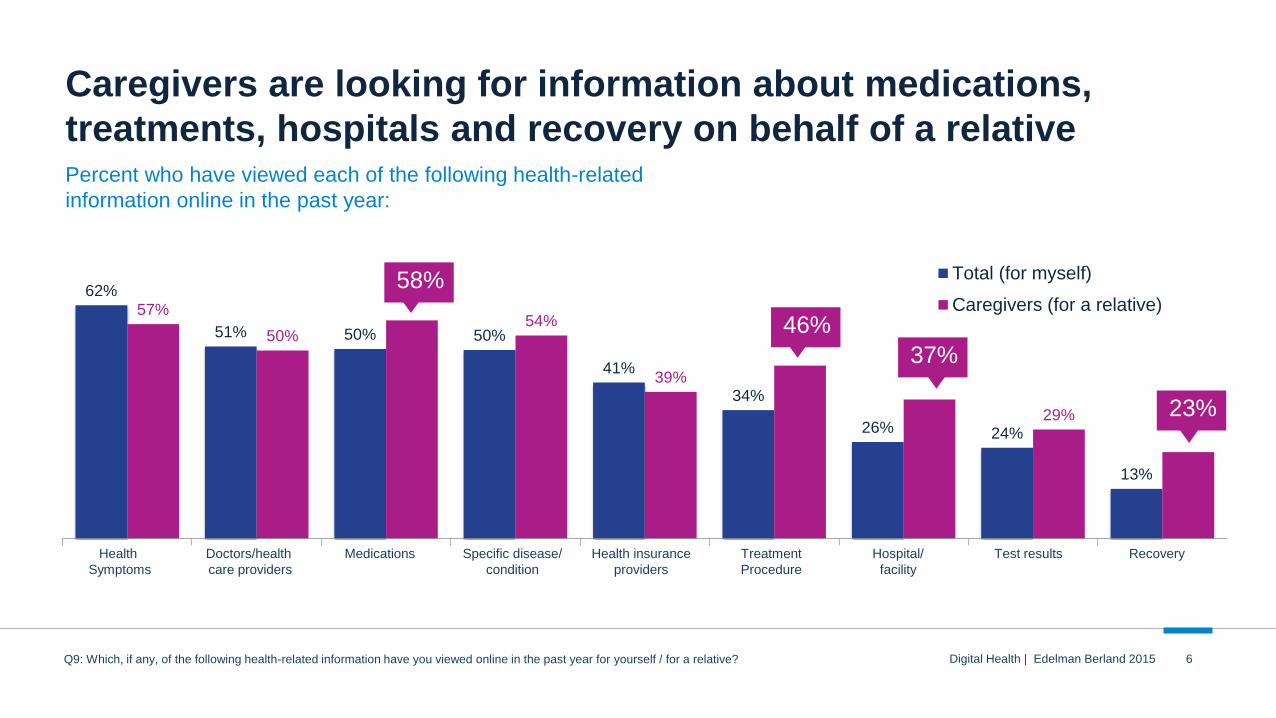
62%
51% 50% 50%
41%
34%
26% 24%
13%
57%
50%54%
39%
29%
Total (for myself)
Caregivers (for a relative)
Caregivers are looking for information about medications,
treatments, hospitals and recovery on behalf of a relativePercent who have viewed each of the following health-related
information online in the past year:
Health
Symptoms
Doctors/health
care providers
Treatment
Procedure
Medications Specific disease/
condition
Health insurance
providers
Hospital/
facility
Test results Recovery
46%
58%
6Digital Health | Edelman Berland 2015
37%
23%
Q9: Which, if any, of the following health-related information have you viewed online in the past year for yourself / for a relative?
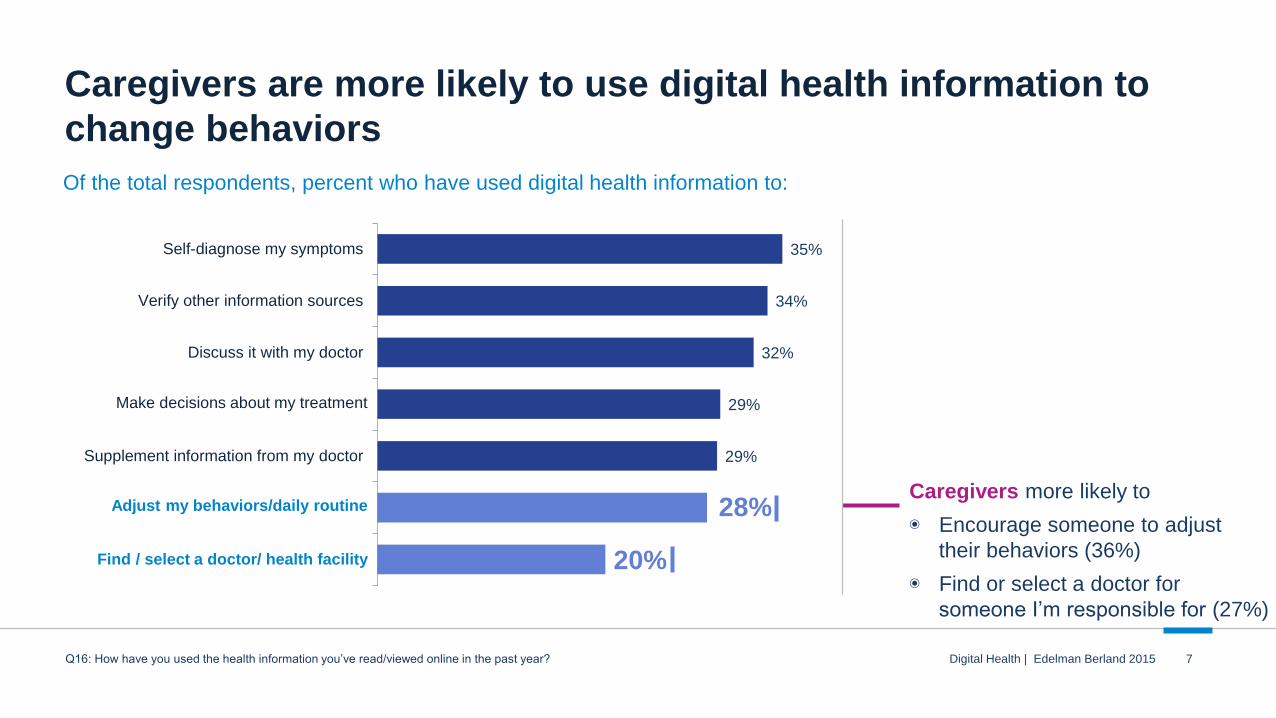
20%
28%
29%
29%
32%
34%
35%
Adjust my behaviors / daily routine
Supplement information from my doctor
Make decisions about my treatment
Discuss it with my doctor
Verify other information sources
Self-diagnose my symptoms
Caregivers are more likely to use digital health information to
change behaviors
Of the total respondents, percent who have used digital health information to:
Q16: How have you used the health information you’ve read/viewed online in the past year?
Make decisions about my treatment
Adjust my behaviors/daily routine
Digital Health | Edelman Berland 2015
28%Caregivers more likely to
◉ Encourage someone to adjust
their behaviors (36%)
◉ Find or select a doctor for
someone I’m responsible for (27%)
7
Find / select a doctor/ health facility
Caregivers want online
health content that is
detailed, factual and puts
them in control.
I N S I G H T

Q34-35: Which of the following statements comes closest to your opinion when reading information online about a chronic / acute condition? Digital Health | Edelman Berland 2015
Consumers – including Caregivers – want detail and controlPercent who agree with each statement:
provide very detailed,
clinical information
A lot of detail
38%
provide a summary, but allow me
to deep dive into the areas that I
want to further explore
Give me control
41%
provide an overview without
getting into the details
Give me an overview
21%
9

29%
26%25%
13%11%
19%18%
5% 5% 5%
Q36. When you are looking at health information online for the following types of conditions, do you prefer that the information sounds…?
Consumers – Caregivers included – want information that’s
direct and instructive, not personal or humorousPercent who prefer online health information that sounds:
Digital Health | Edelman Berland 2015
Direct Instructive Matter-of-Fact Clinical Down to Earth Academic Encouraging Personal Light-hearted AspirationalAuthoritative Humorous
Objective Subjective/Soft
36%34%
10

Video content: The message is more
important than the messengerPreferences for video content, in rank order:
Educational focusGraphic detailsPatient testimonialsDoctor interviews Medical explanations
More engaging and useful
Digital Health | Edelman Berland 2015 11Q33: Thinking about the types of health-related videos you see online, how engaging and useful are each of the following?
Caregivers share —
but not always publicly.
I N S I G H T
Q17: How have you shared the following types of online health information with others in the last year?
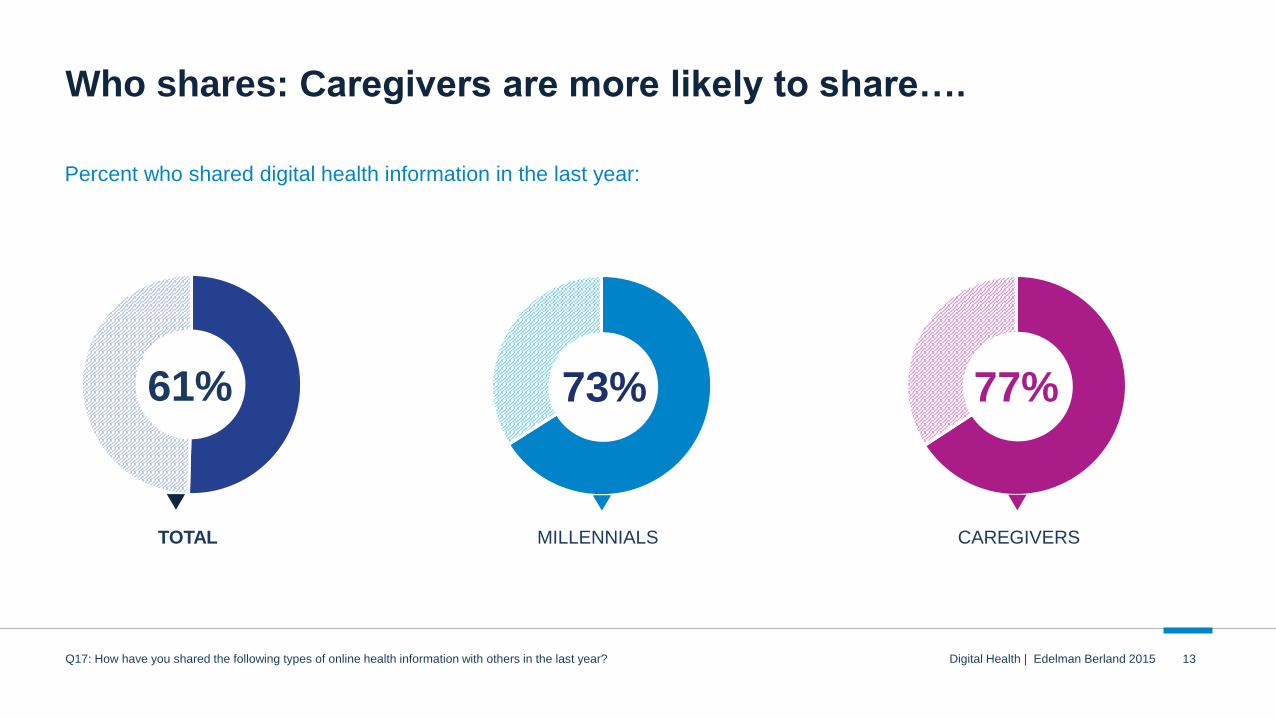
Who shares: Caregivers are more likely to share….
Percent who shared digital health information in the last year:
TOTAL
61%
Digital Health | Edelman Berland 2015
MILLENNIALS
73%
CAREGIVERS
77%
13
Digital Health | Edelman Berland 2015
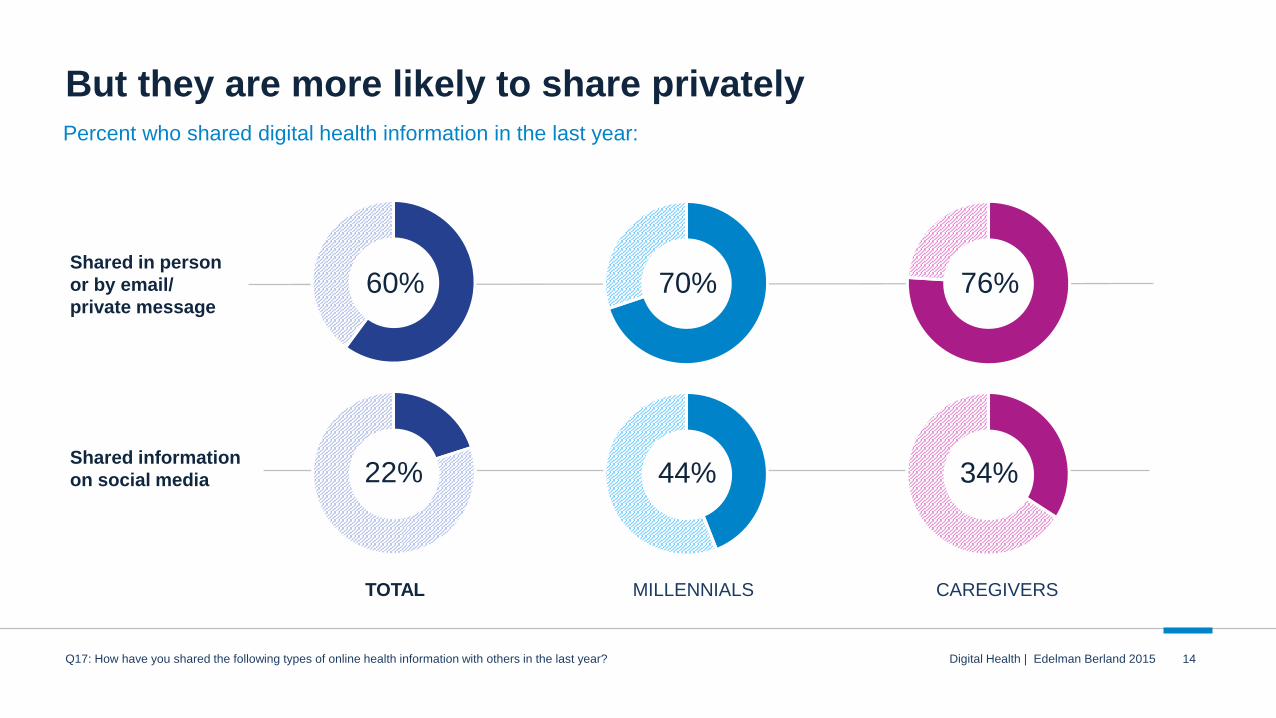
Percent who shared digital health information in the last year:
But they are more likely to share privately
TOTAL
60%
CAREGIVERS
76%
MILLENNIALS
70%Shared in person
or by email/
private message
Shared information
on social media 22% 44% 34%
14Q17: How have you shared the following types of online health information with others in the last year?
19%
21%
21%
25%
28%
31%
33%
33%
35%
35%
60%
7%
7%
5%
5%
6%
5%
10%
6%
10%
6%
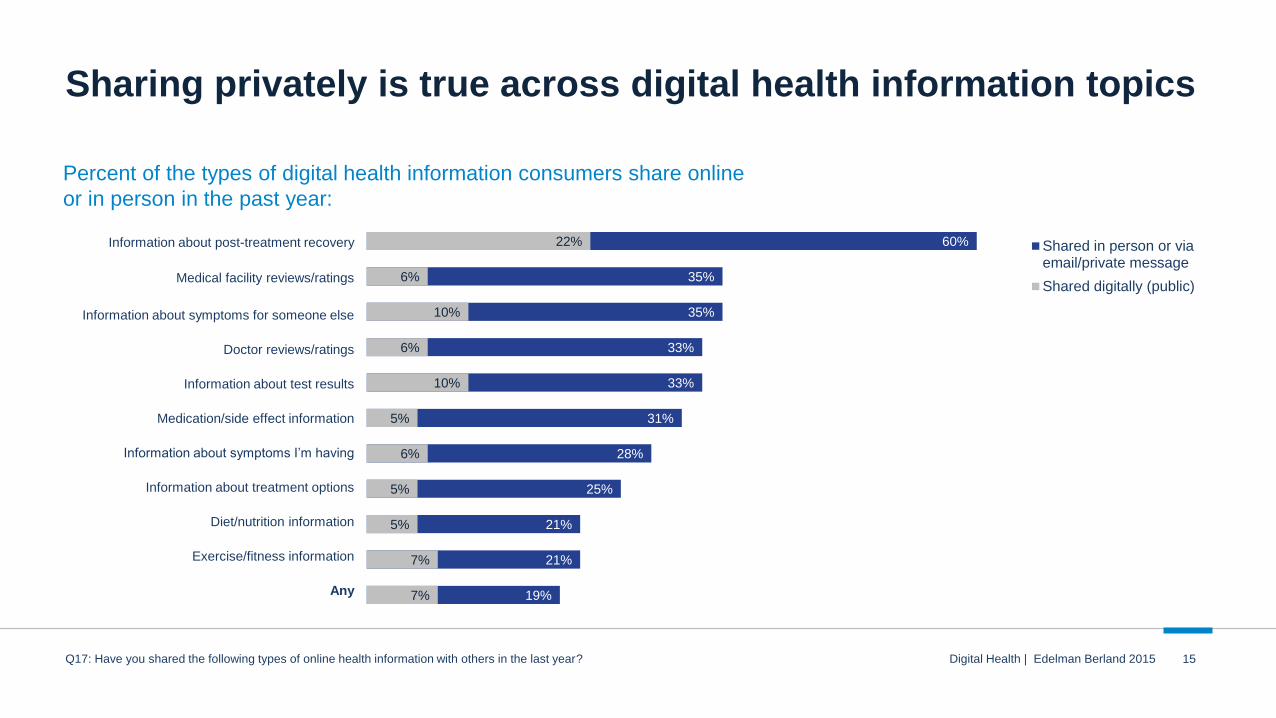
22% Shared in person or viaemail/private message
Shared digitally (public)
Digital Health | Edelman Berland 2015
Percent of the types of digital health information consumers share online
or in person in the past year:
Sharing privately is true across digital health information topics
Any
Exercise/fitness information
Diet/nutrition information
Information about treatment options
Information about symptoms I’m having
Medication/side effect information
Information about test results
Doctor reviews/ratings
Information about symptoms for someone else
Medical facility reviews/ratings
Information about post-treatment recovery
15Q17: Have you shared the following types of online health information with others in the last year?
15%14%
12%11%
10%
7%6%
5% 5%
30%
19%20% 21%
19%
11% 12% 12%10%
30%
25%26%
23%
19%
12%10%
11%
8%
Total Millennials Caregivers
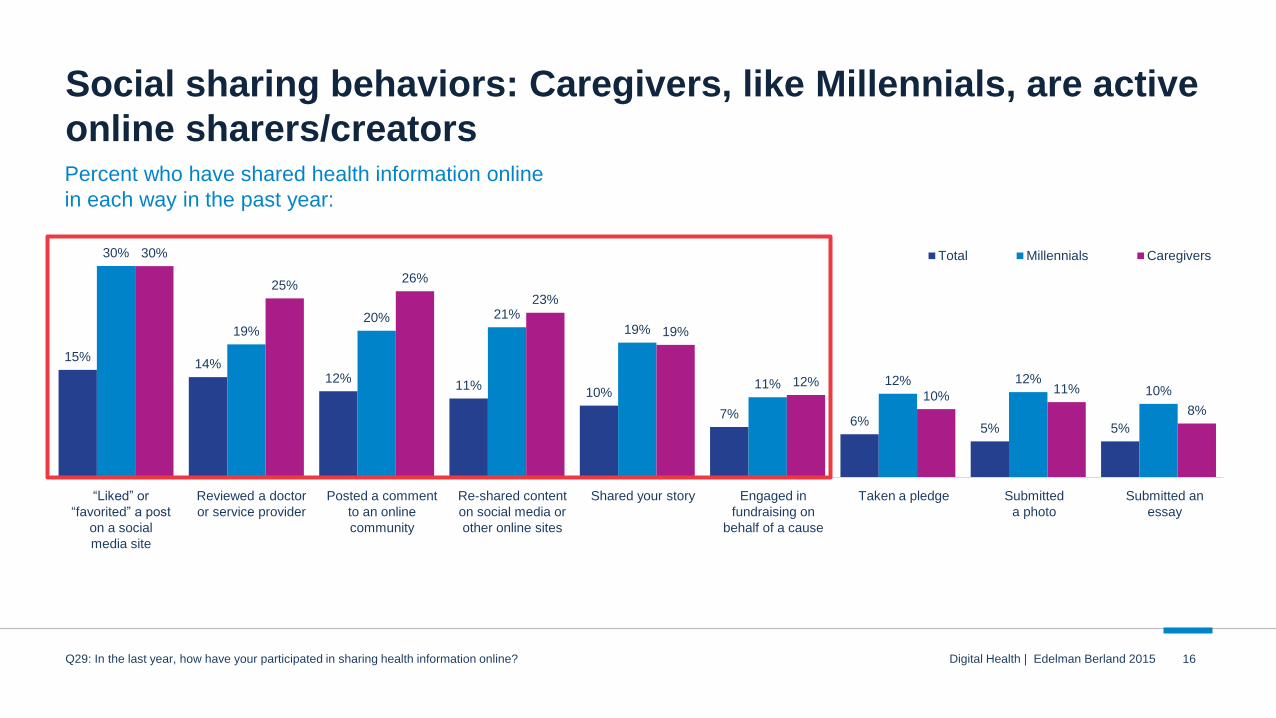
Q29: In the last year, how have your participated in sharing health information online? Digital Health | Edelman Berland 2015
Social sharing behaviors: Caregivers, like Millennials, are active
online sharers/creatorsPercent who have shared health information online
in each way in the past year:
“Liked” or
“favorited” a post
on a social
media site
Reviewed a doctor
or service provider
Engaged in
fundraising on
behalf of a cause
Posted a comment
to an online
community
Re-shared content
on social media or
other online sites
Shared your story Taken a pledge Submitted
a photo
Submitted an
essay
16
37%35%
31% 30%
24% 24%
20%
17%15%
34%
42%
34%
26% 26%
22% 22% 22%20%
39% 38% 37%
33%
28%25%
30%
22%
13%
Total Millennials Caregivers
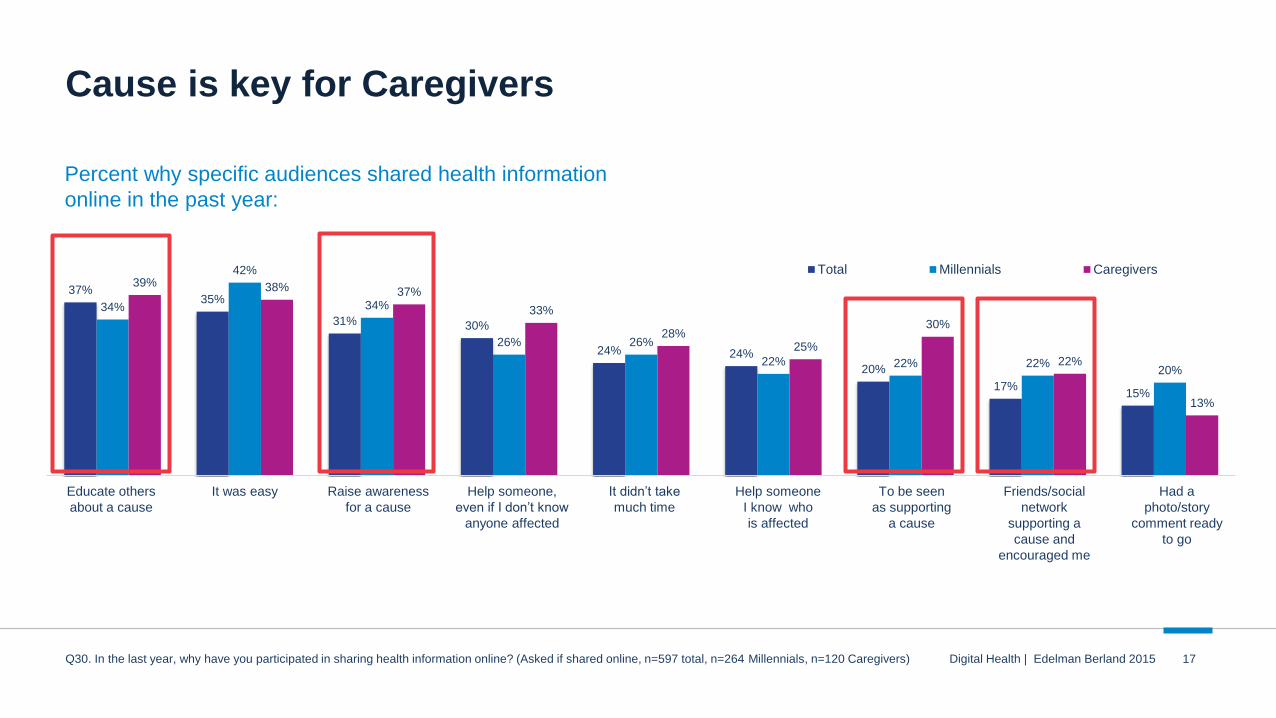
Cause is key for Caregivers
Percent why specific audiences shared health information
online in the past year:
Educate others
about a cause
It was easy Help someone
I know who
is affected
Raise awareness
for a cause
Help someone,
even if I don’t know
anyone affected
It didn’t take
much time
To be seen
as supporting
a cause
Friends/social
network
supporting a
cause and
encouraged me
Had a
photo/story
comment ready
to go
Digital Health | Edelman Berland 2015 17Q30. In the last year, why have you participated in sharing health information online? (Asked if shared online, n=597 total, n=264 Millennials, n=120 Caregivers)
75%
70%
65%
64%
55%
56%
56%
43%
40%
40%
36%
34%
60%
53%
52%
49%
42%
40%
39%
32%
31%
29%
28%
24%
Likely to Share - Total Likely to Share - Caregivers
Digital Health | Edelman Berland 2015
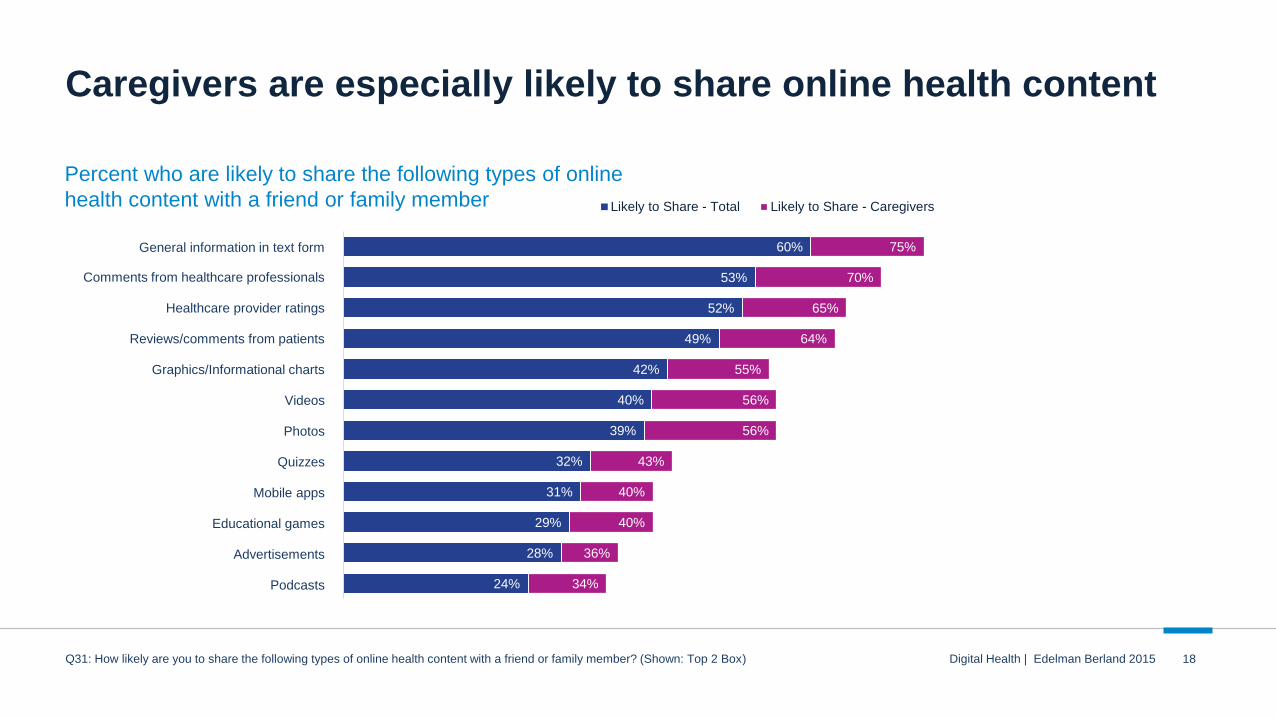
Caregivers are especially likely to share online health content
Percent who are likely to share the following types of online
health content with a friend or family member
Educational games
Mobile apps
Quizzes
Photos
Videos
Graphics/Informational charts
Reviews/comments from patients
Healthcare provider ratings
Comments from healthcare professionals
General information in text form
Advertisements
Podcasts
18Q31: How likely are you to share the following types of online health content with a friend or family member? (Shown: Top 2 Box)
Caregivers trust owned
content.
I N S I G H T
83%
76% 75%
66% 64% 62%
54% 53% 51%48% 46% 45%
31%28%
87% 85%82%
76%71% 72%
65% 64%
55%59%
63%
54%
40%
32%
Total Caregivers
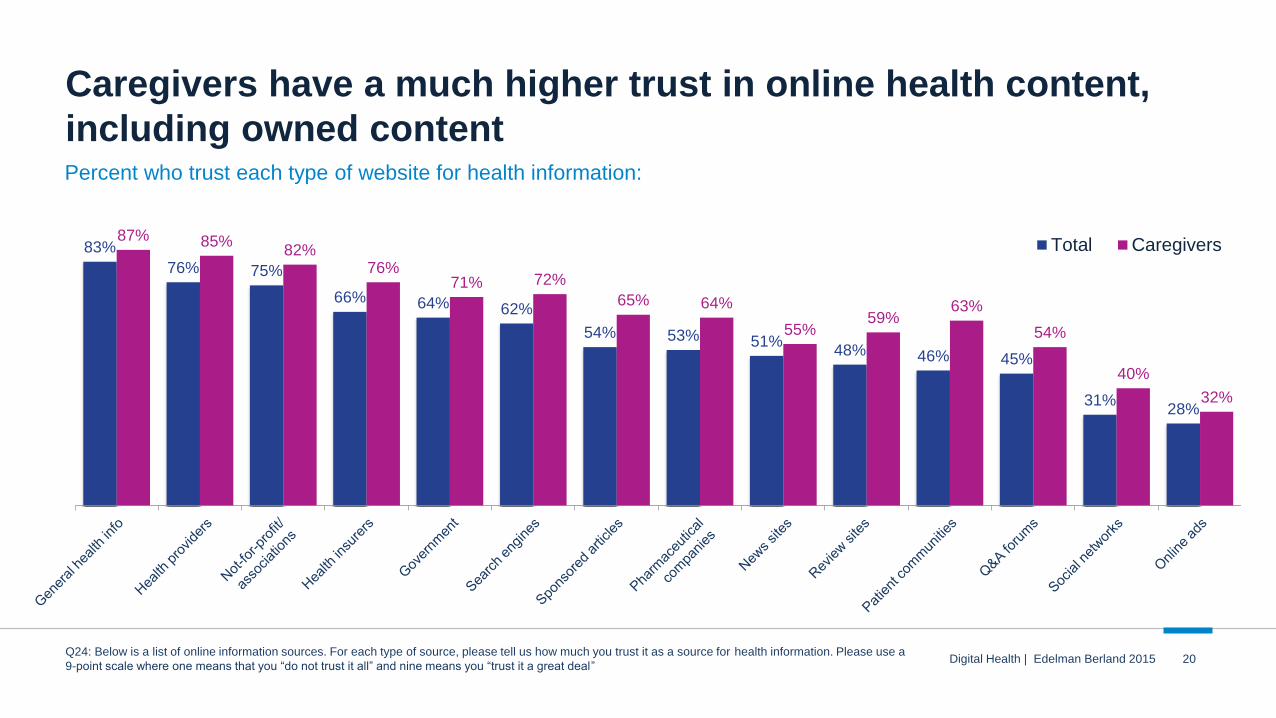
Caregivers have a much higher trust in online health content,
including owned contentPercent who trust each type of website for health information:
20Digital Health | Edelman Berland 2015Q24: Below is a list of online information sources. For each type of source, please tell us how much you trust it as a source for health information. Please use a
9-point scale where one means that you “do not trust it all” and nine means you “trust it a great deal”
Digital Health | Edelman Berland 2015
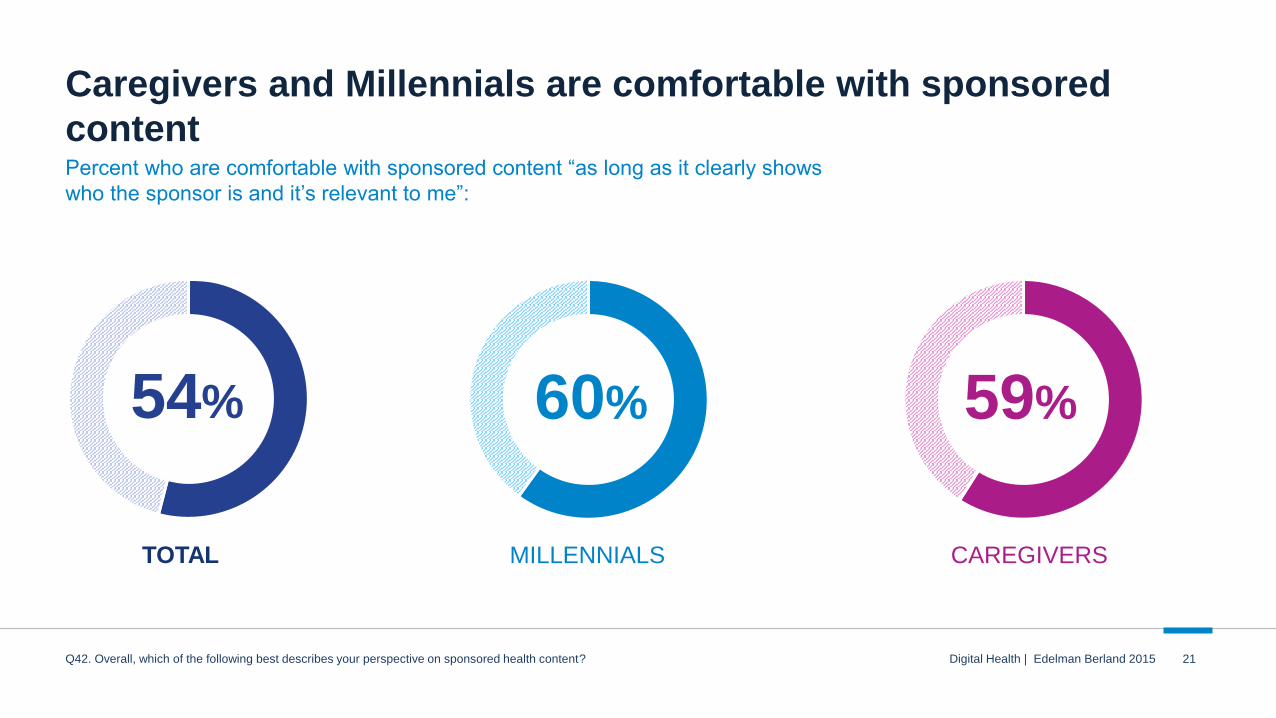
Caregivers and Millennials are comfortable with sponsored
contentPercent who are comfortable with sponsored content “as long as it clearly shows
who the sponsor is and it’s relevant to me”:
TOTAL
54%
MILLENNIALS
60%
CAREGIVERS
59%
21Q42. Overall, which of the following best describes your perspective on sponsored health content?
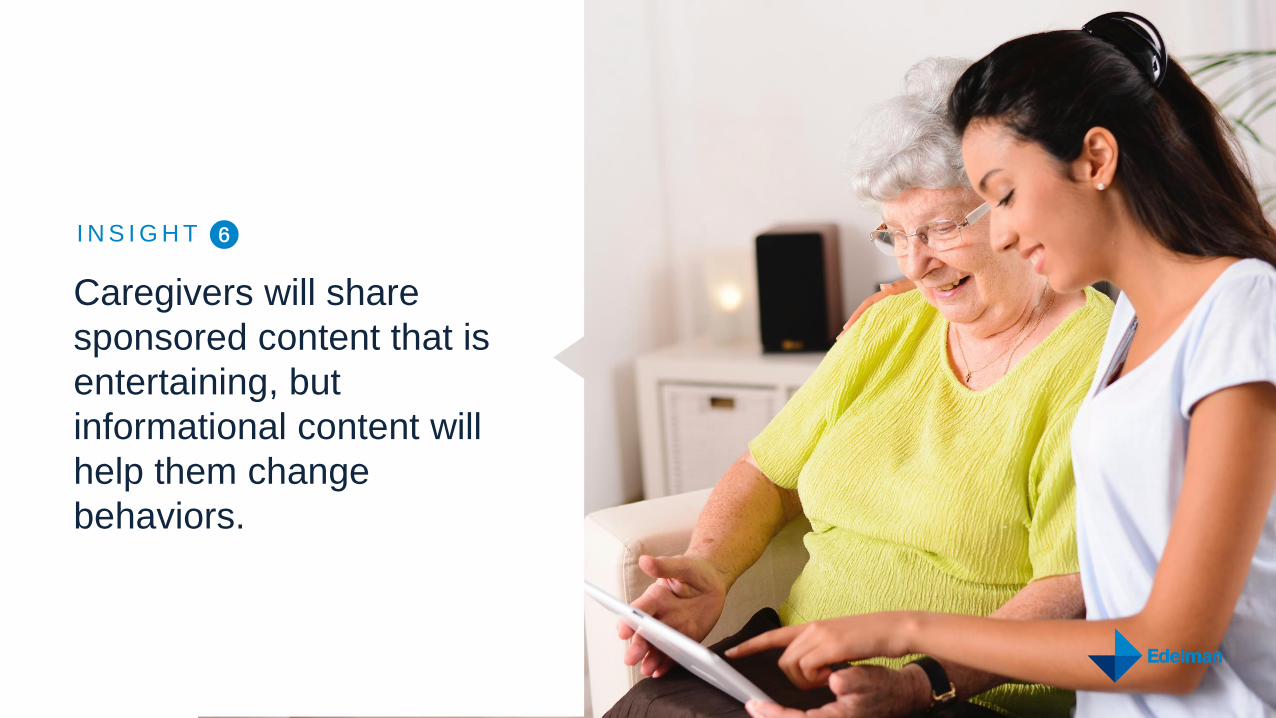
Caregivers will share
sponsored content that is
entertaining, but
informational content will
help them change
behaviors.
I N S I G H T
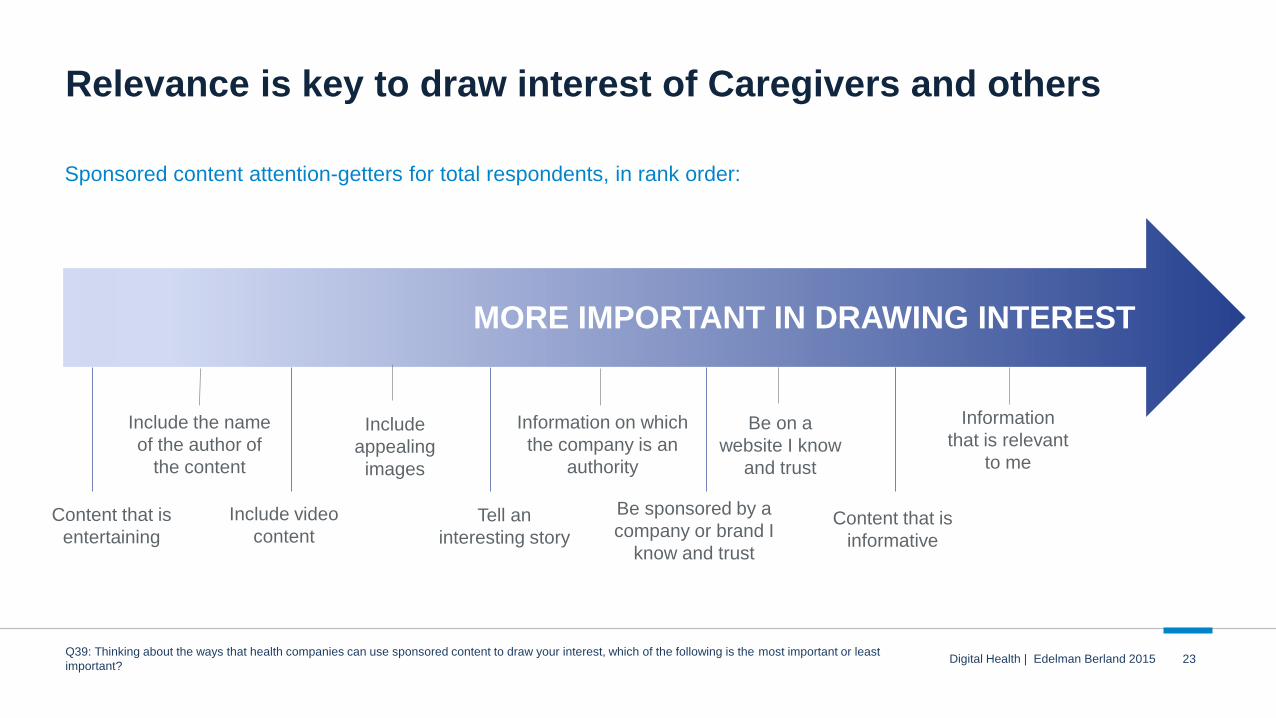
Relevance is key to draw interest of Caregivers and others
Sponsored content attention-getters for total respondents, in rank order:
MORE IMPORTANT IN DRAWING INTEREST
Digital Health | Edelman Berland 2015 23Q39: Thinking about the ways that health companies can use sponsored content to draw your interest, which of the following is the most important or least
important?
Include the name
of the author of
the content
Include video
content
Include
appealing
images
Tell an
interesting story
Information on which
the company is an
authority
Be on a
website I know
and trust
Content that is
informative
Information
that is relevant
to me
Be sponsored by a
company or brand I
know and trust
Content that is
entertaining

Info that gets shared is different than what changes behavior
Types of sponsored content that would increase various
sharing habits vs. behavior changes, in rank order:
Get Shared >> Change Behavior >>
Repost content to
your social network
Recommend to
others
Share content with
friends or family
Discuss content
with your doctor
Adjust your
behaviors/daily
routine
Informative
Interesting story
Relevant to me
On a trusted website
Entertaining
Relevant to me
Informative
On a trusted website
Brand is an authority
Brand is trusted
24Digital Health | Edelman Berland 2015Q40: Again, thinking about the ways that health companies can use “sponsored” content to draw your interest, which of the following would increase the chance
that you would…?

Action plan for brands
25Digital Health | Edelman Berland 2015

Action plan for
brands
Develop strategies – like linking your brand
to a cause – to activate the influential
Caregiver audience.
Present information straight up, and give
Caregivers control over the level of depth
and detail.
Create content that can easily be shared
privately and links back to owned properties.
Take full advantage of the high trust
Caregivers place in owned content to
engage and influence.
Explore new ways to measure the private
sharing of health information to more fully
capture brand impact.
Digital Health | Edelman Berland 2015 26
Discussion
Digital Health | Edelman Berland 2015 27
Appendix
Digital Health | Edelman Berland 2015 28
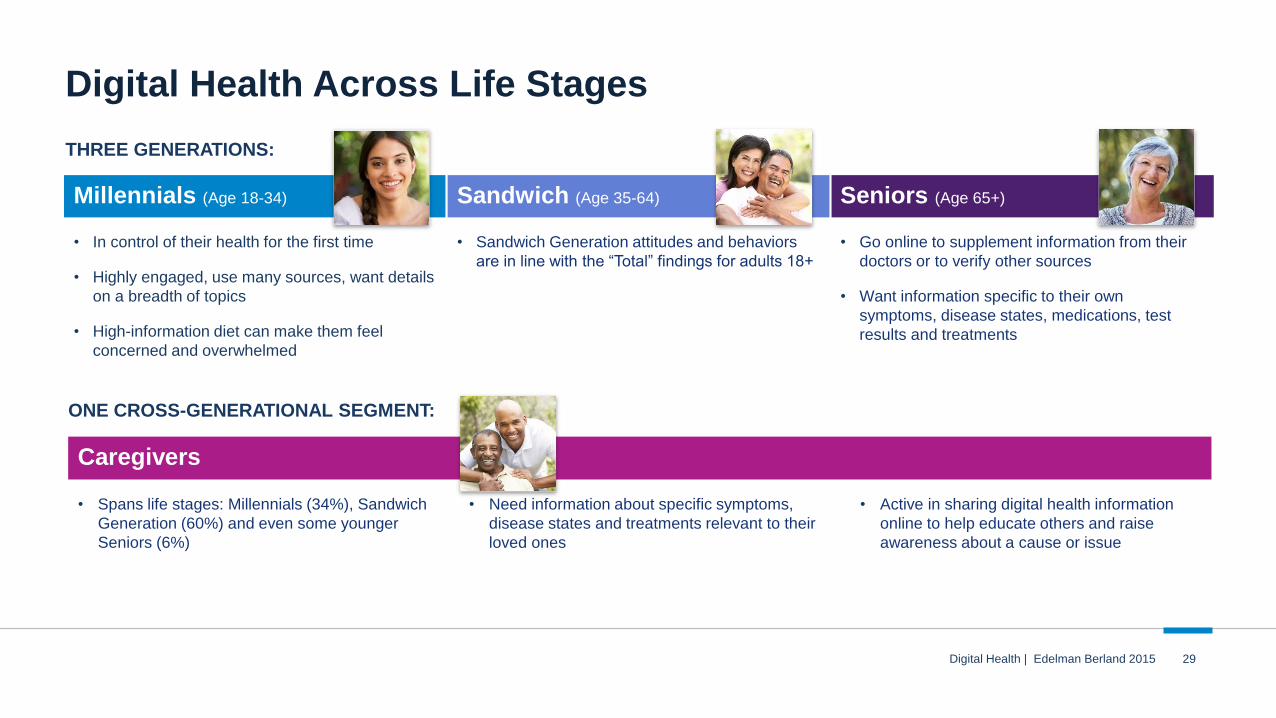
Digital Health Across Life Stages
Millennials (Age 18-34) Sandwich (Age 35-64) Seniors (Age 65+)
• In control of their health for the first time
• Highly engaged, use many sources, want details
on a breadth of topics
• High-information diet can make them feel
concerned and overwhelmed
• Sandwich Generation attitudes and behaviors
are in line with the “Total” findings for adults 18+
• Go online to supplement information from their
doctors or to verify other sources
• Want information specific to their own
symptoms, disease states, medications, test
results and treatments
Digital Health | Edelman Berland 2015
Caregivers
• Spans life stages: Millennials (34%), Sandwich
Generation (60%) and even some younger
Seniors (6%)
• Need information about specific symptoms,
disease states and treatments relevant to their
loved ones
• Active in sharing digital health information
online to help educate others and raise
awareness about a cause or issue
THREE GENERATIONS:
ONE CROSS-GENERATIONAL SEGMENT:
29