Embed Size (px)
Citation preview

Using healthcare data for biomedical research
MAY 27, 2016
Kees van Bochove, CEO & Founder, The Hyve

Open Source u Source code openly accessible and reusable for everyone
u Enables pre-competitive collaboration: both academics and
industry can use and enhance it
u Transparency: verification (scientific as well as IT security) can be
done by anyone, no ‘black box’

3
The Hyve
u Professionalsupportforopensourceso*wareforbioinforma1csandtransla1onal
researchso5ware,suchastranSMART,cBioPortal,i2b2,Galaxy,ADAMandOHDSI
MissionEnablepre-compe11vecollabora1oninlifescienceR&Dbyleveragingopensourceso*ware
Corevalues ShareReuseSpecialize
OfficeLoca5onsUtrecht,NetherlandsCambridge,MA,UnitedStates
ServicesSo5waredevelopmentDatascienceservicesConsultancyHos1ng/SLAs
Fast-growingStartedin201235peoplebynow

Interdisciplinary team
so5ware engineers, data scien1sts, project managers & staff; exper1se inbioinforma1cs,medicalinforma1cs,so5wareengineering,biosta1s1csetc.
4
YoungCB meeting @ The Hyve
5
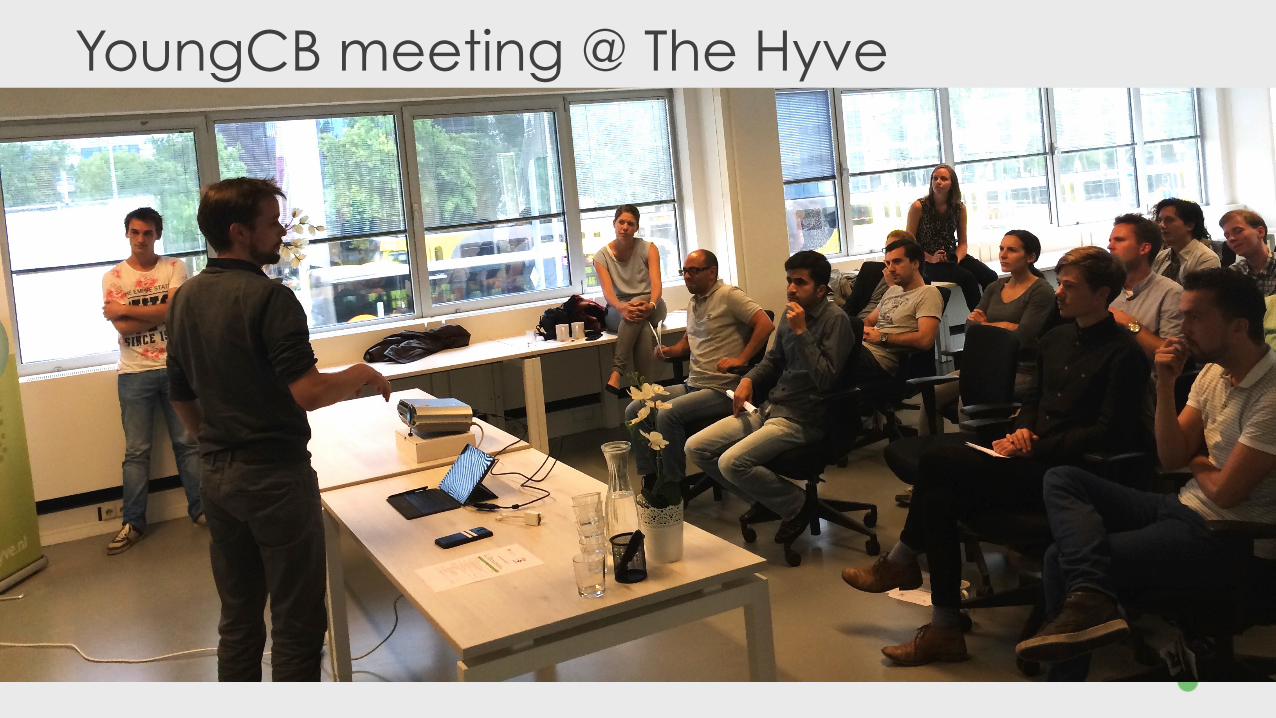
New The Hyve offices being built at the Arthur van Schendellaan in Utrecht, The Netherlands
6

7
3 Health Data Areas The Hyve is active in u Translational Research Data
(‘Clinical & bioinformatics data’)
u Population Health Data
(‘Real world data’)
u Personal Health Data
(‘Wearable sensors data’)
Example project:
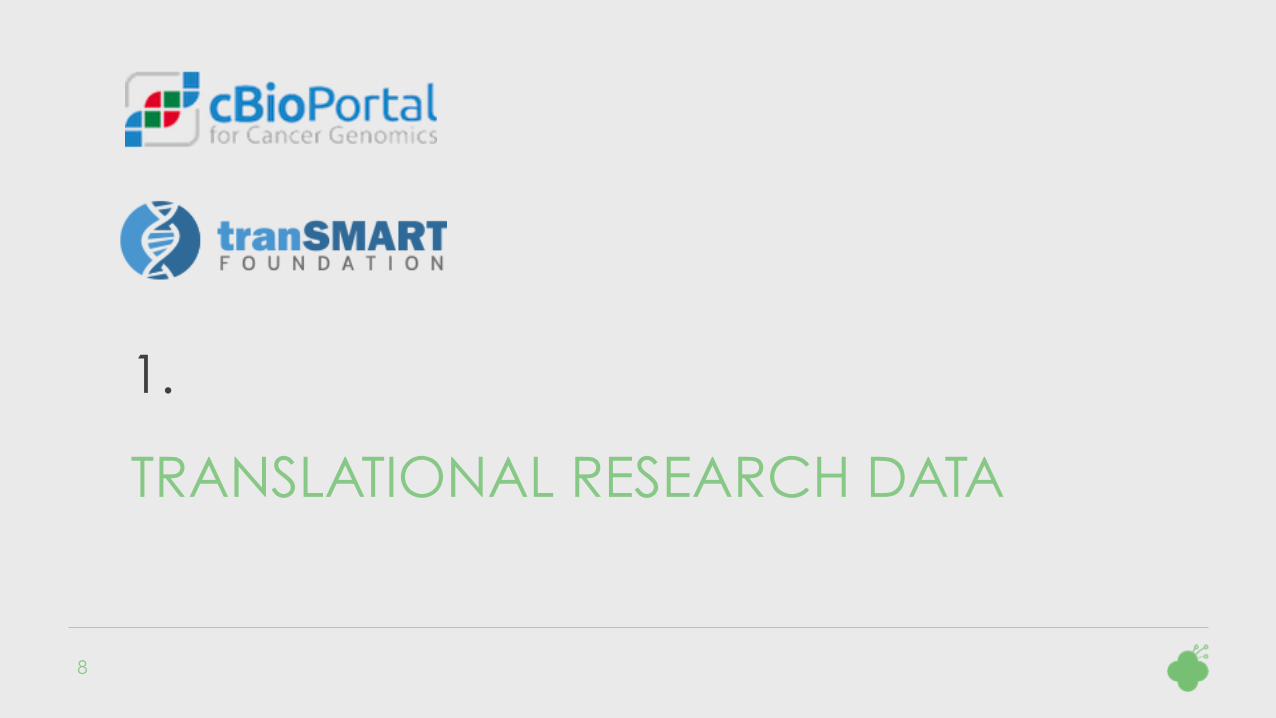
1.
TRANSLATIONAL RESEARCH DATA
8

9
Center for Translational Molecular Medicine (CTMM) u Public-private consortium
u Dedicated to the development of Molecular
Diagnostics and Molecular Imaging technologies
u Focusing on the translational aspects of molecular
medicine.
u 120 partners
u universities, academic medical centers, medical
technology enterprises and chemical and
pharmaceutical companies.
u Budget 300 M€
u 22 projects / research consortia
u TraIT is the Translational Research IT project
supporting these projects with a joint IT infrastructure

10
TraIT Consortium
Growing TraIT project team
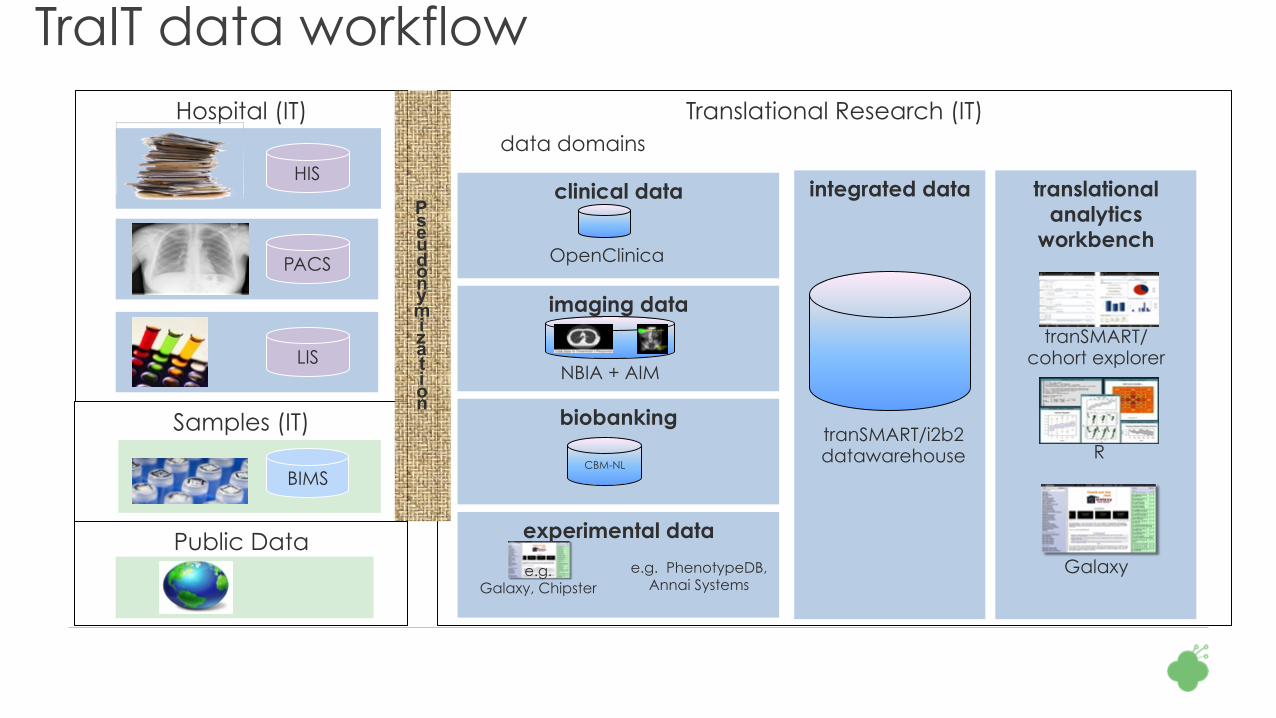
TraIT data workflow Hospital (IT) Translational Research (IT)
data domains
clinical data
imaging data
experimental data
biobanking
integrated data translational analytics
workbench
HIS
PACS
LIS
Galaxy
tranSMART/ cohort explorer
R tranSMART/i2b2 datawarehouse
CBM-NL
OpenClinica
NBIA + AIM
e.g. PhenotypeDB, Annai Systems
e.g. Galaxy, Chipster
Samples (IT)
Pseudonymization
Public Data
BIMS

12
TranSMART Platform: Scientific Function
CLINICAL GENETICS SENSORS IMAGING
DATA
UNDER STANDING BIOLOGY MEDICINE

13
TranSMART Open Source History u February 2012: J&J releases tranSMART as open
source on GitHub under GPL v3
u December 2012: CTMM TraIT project decides to use
tranSMART as core infrastructure component
u January 2013: IMI eTRIKS starts, uses tranSMART as
core infrastructure component
u February 2013: kickoff of tranSMART Foundation, U.
Michigan publishes PostgreSQL port
u March 2014: IMI EMIF kickoff, tranSMART is used as
data integration component

Contributors
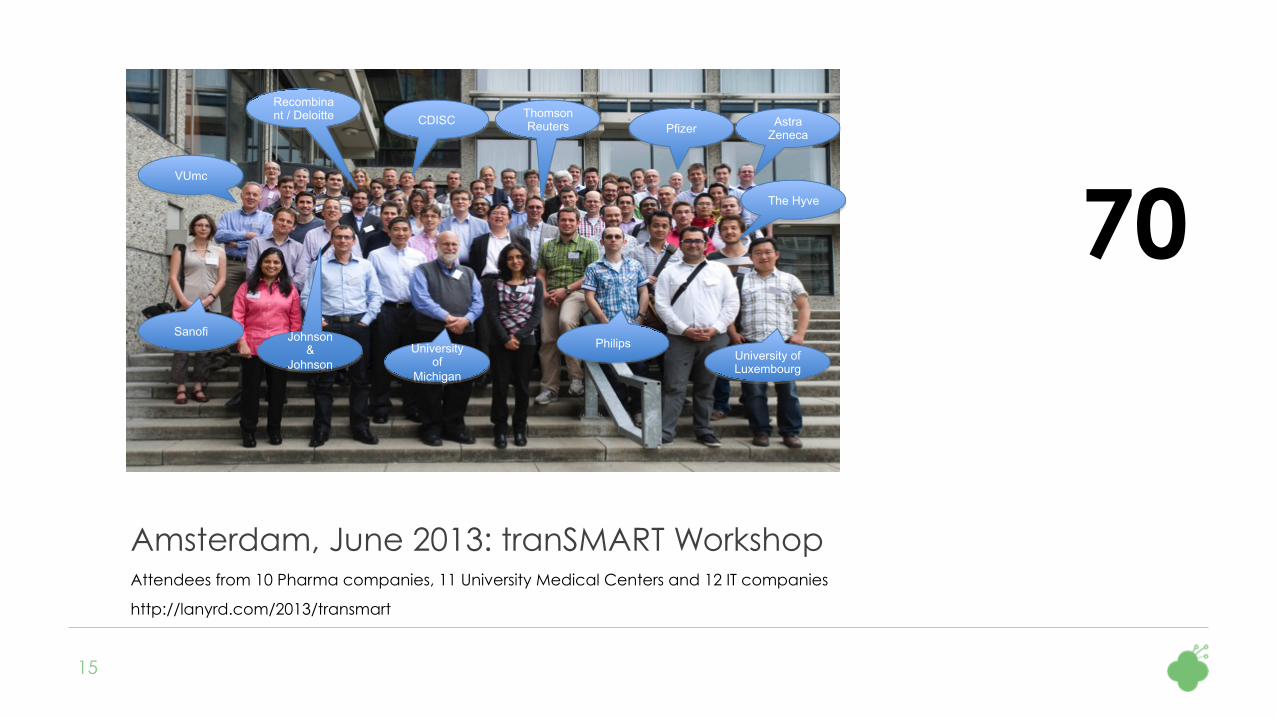
Amsterdam, June 2013: tranSMART Workshop Attendees from 10 Pharma companies, 11 University Medical Centers and 12 IT companies
http://lanyrd.com/2013/transmart
15
VUmc
Sanofi
Recombinant / Deloitte
University of
Michigan
Thomson Reuters Pfizer Astra
Zeneca CDISC
University of Luxembourg
Philips Johnson &
Johnson
The Hyve 70
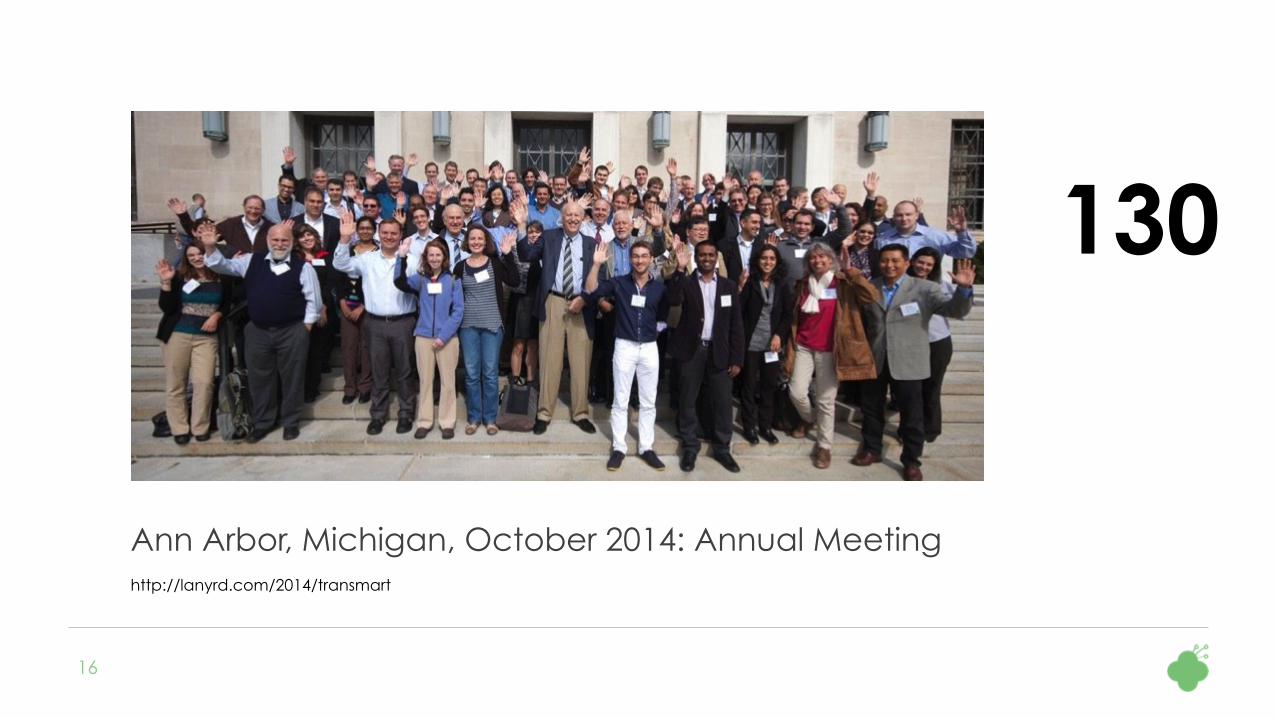
Ann Arbor, Michigan, October 2014: Annual Meeting http://lanyrd.com/2014/transmart
16
130

Bio IT World, Boston, April 2015 http://bit.ly/1R2N6uz
17
TranSMART wins all the prizes: Best Show Award, Best Practices Award, Best Poster Award
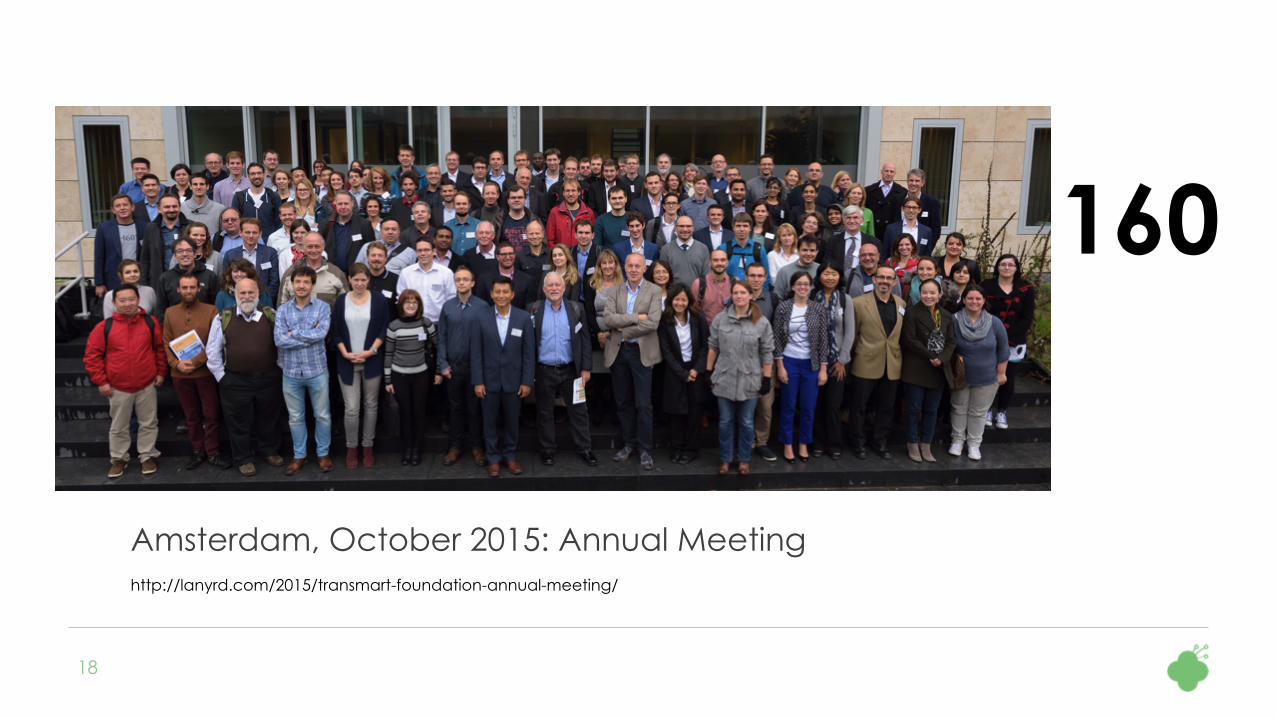
Amsterdam, October 2015: Annual Meeting http://lanyrd.com/2015/transmart-foundation-annual-meeting/
18
160
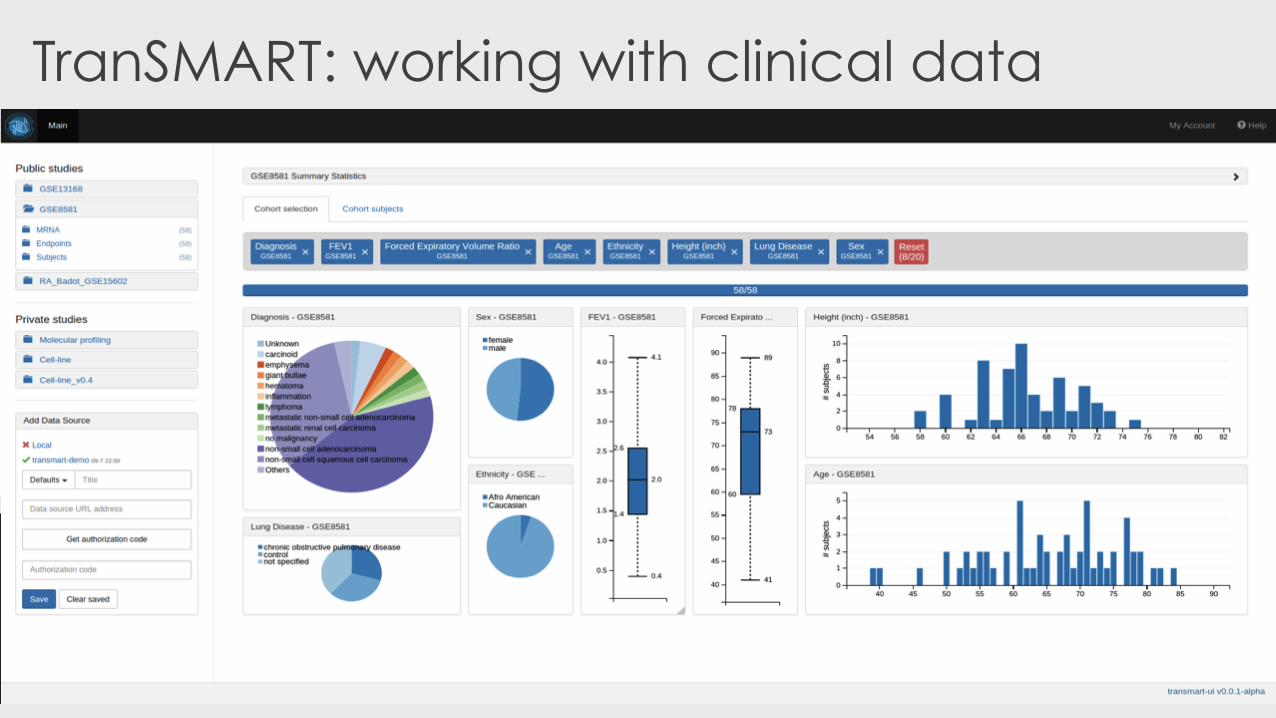
TranSMART: working with clinical data
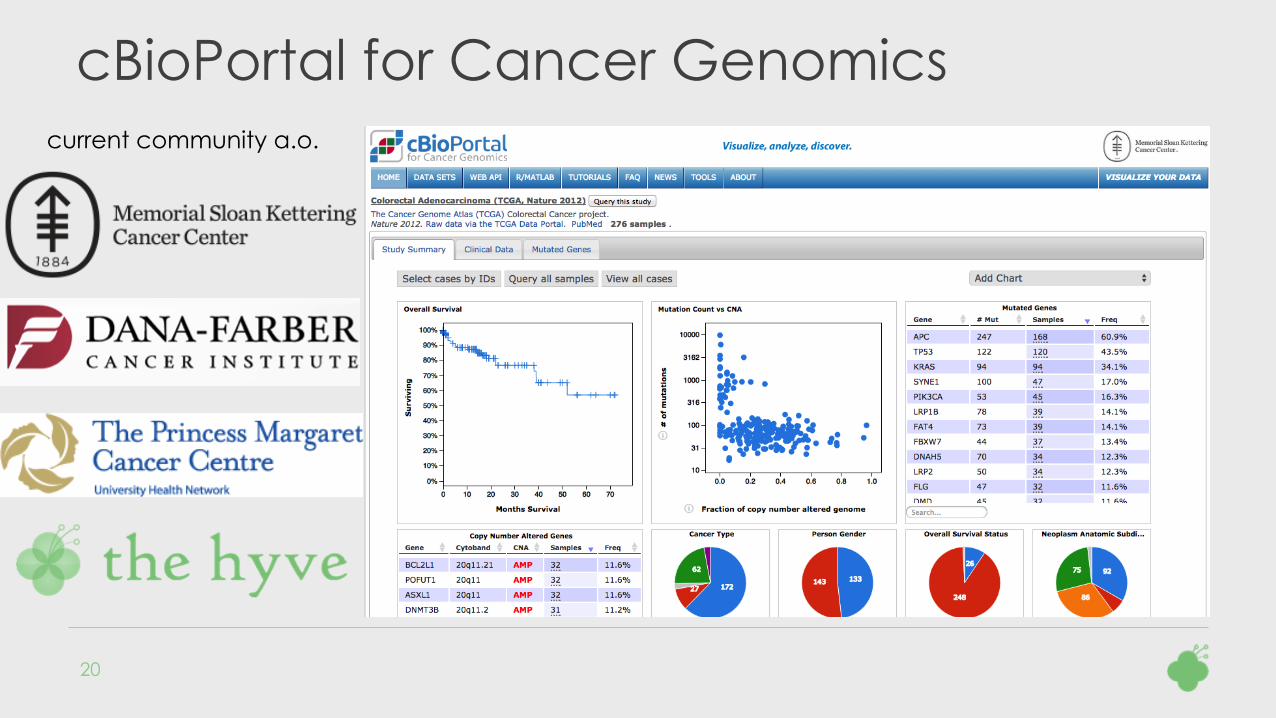
cBioPortal for Cancer Genomics
20
current community a.o.

Focus: intuitive exploratory analysis of the data

2.
POPULATION HEALTH DATA
22
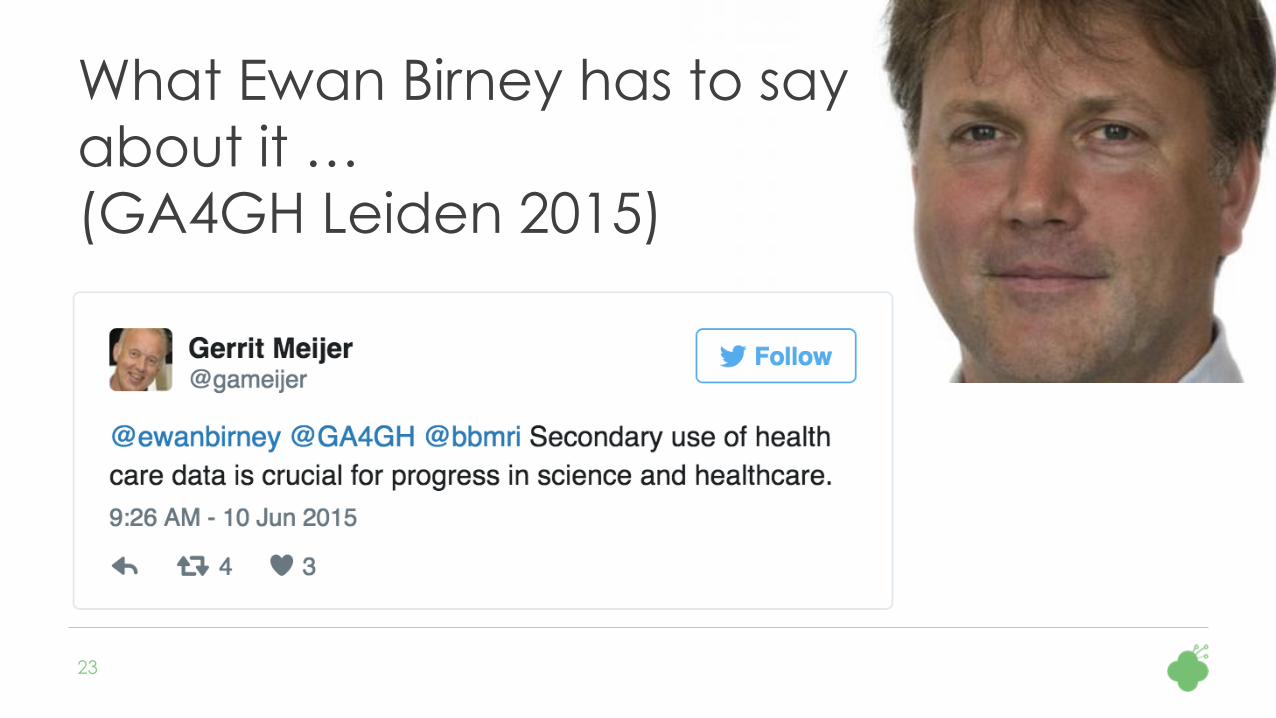
What Ewan Birney has to say about it … (GA4GH Leiden 2015)
23

Time To Market: 11 – 18 years
6
Neg
otia
tion
for R
eim
burs
emen
t 27
mem
ber S
tate
s
EMA
Fili
ng
Pre-
Clin
ical
Res
earc
h Cl
osed
& O
pen
Inno
vatio
n
Clinical Trials
EMA
App
rova
l for
Sal
e
HTA
App
rova
l
Phase 1 Phase 2 Phase 3
5,000 10,000
Compounds
250 Compounds
3 – 6 Years 6 – 7 Years
5 Therapies
1 Therapy
2 – 5 Years
Number of Patients/Subjects
20-100 100-500 1000-5000
Regulatory Review
Drug Discovery
Pre Clinical Testing
PhV Monitoring
Total Cost: $2 - $4 Billion USD
Sources: Drug Discovery and Development: Understanding the R&D Process, www.innovation.org;
CBO, Research and Development in the Pharmaceutical Industry, 2006;
Forbes, Matthew Herper, “The Truly Staggering Cost Of Inventing New Drugs”, February 10, 2012
Current EU “Patient Journey” is expensive and slow
New therapies don’t reach
patients until here
Phase 4 : $0.6B Drug Development : $2.6B
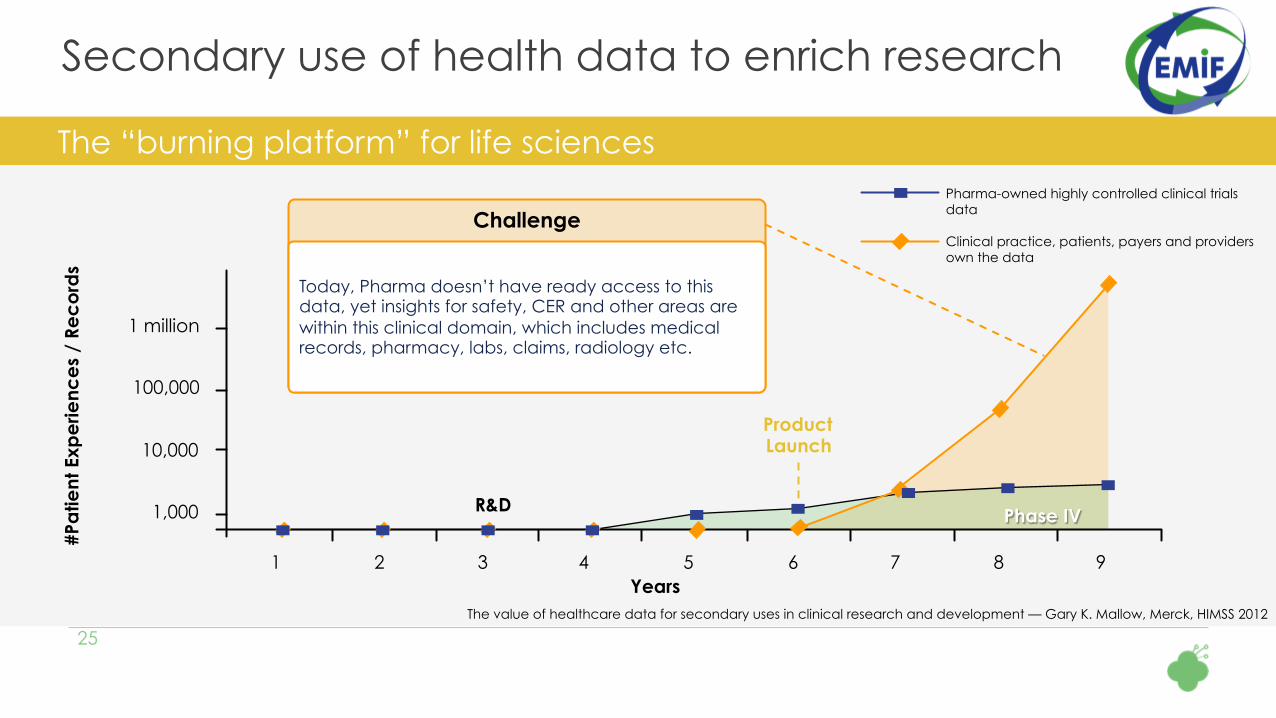
Secondary use of health data to enrich research
25 The value of healthcare data for secondary uses in clinical research and development — Gary K. Mallow, Merck, HIMSS 2012
1 2 3 4 5 6 7 8 9
1,000
10,000
100,000
1 million
Years
#Pa
tient
Exp
erie
nce
s /
Rec
ord
s
The “burning platform” for life sciences Pharma-owned highly controlled clinical trials data Clinical practice, patients, payers and providers own the data
Product Launch
R&D Phase IV
Challenge
Today, Pharma doesn’t have ready access to this data, yet insights for safety, CER and other areas are within this clinical domain, which includes medical records, pharmacy, labs, claims, radiology etc.
26
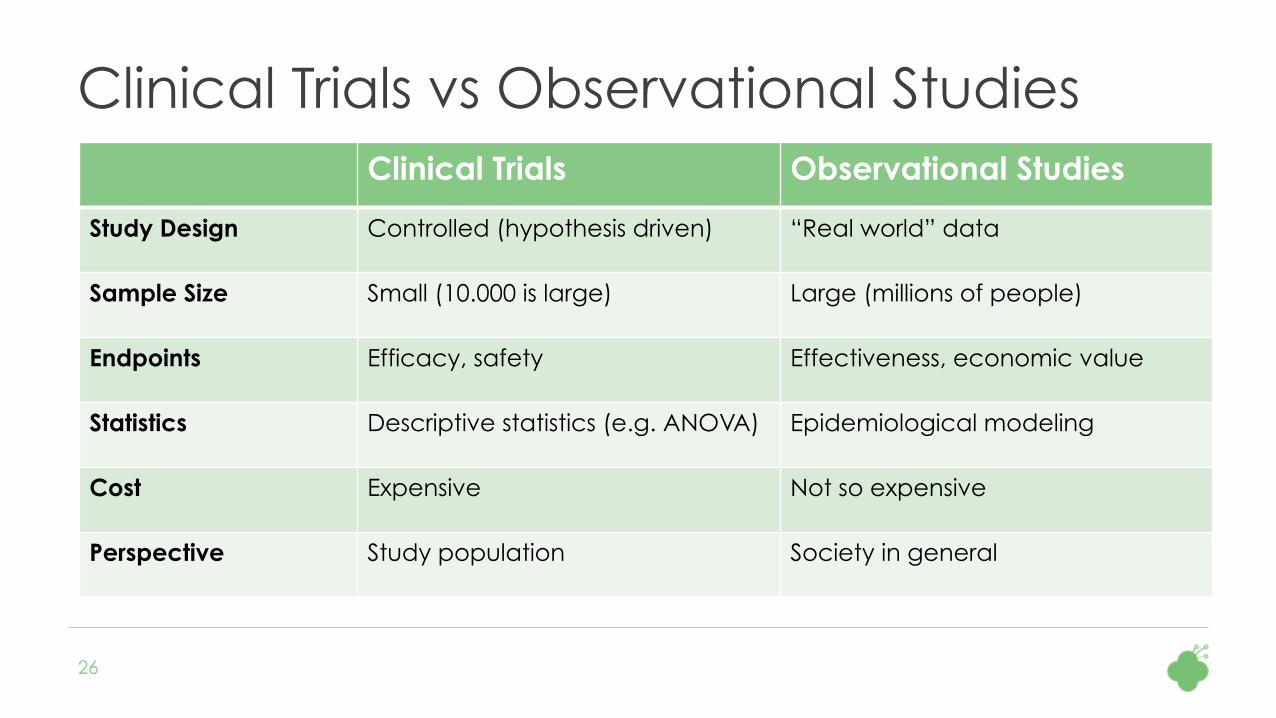
Clinical Trials vs Observational Studies Clinical Trials Observational Studies
Study Design Controlled (hypothesis driven) “Real world” data
Sample Size Small (10.000 is large) Large (millions of people)
Endpoints Efficacy, safety Effectiveness, economic value
Statistics Descriptive statistics (e.g. ANOVA) Epidemiological modeling
Cost Expensive Not so expensive
Perspective Study population Society in general

To become the trusted European hub for health care data intelligence,
enabling new insights into diseases and treatments
EMIF vision
27
Discover
Assess
Reuse

Data available through EMIF consortium
§ Large variety in “types” of data
§ Data is available from more than 53 million subjects from seven
EU countries, including
Primary care data sets
Hospital data
Administrative data Regional record-linkage systems
Registries and cohorts (broad and disease specific)
Biobanks
>25,000 subjects in AD cohorts
>90,000 subjects in metabolic cohorts
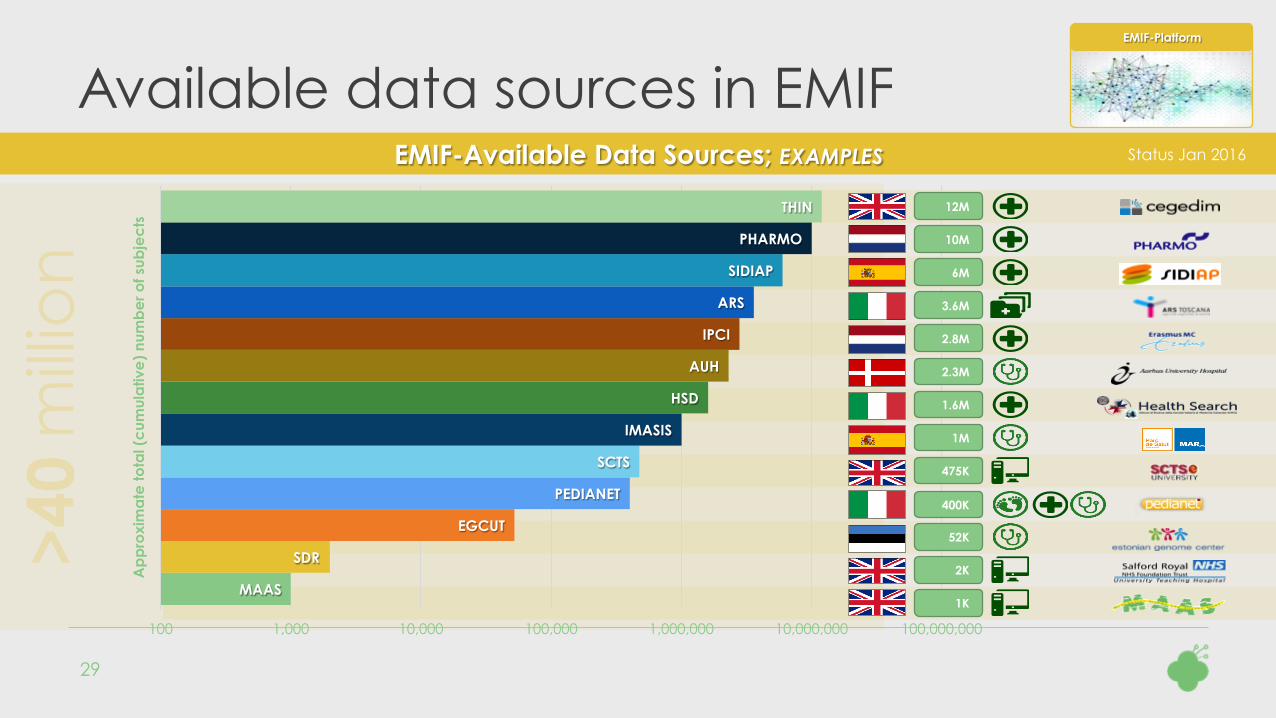
>40
mill
ion
MAAS
SDR
EGCUT
PEDIANET
SCTS
IMASIS
HSD
AUH
IPCI
ARS
SIDIAP
PHARMO
THIN
100 1,000 10,000 100,000 1,000,000 10,000,000 100,000,000
Ap
pro
xim
ate
tota
l (c
umul
ativ
e)
num
be
r of s
ubje
cts
Available data sources in EMIF
29
EMIF-Platform
EMIF-Available Data Sources; EXAMPLES
1K
2K
52K
400K
475K
2.8M
2.3M
10M
Status Jan 2016
3.6M
1.6M
1M
12M
6M
30
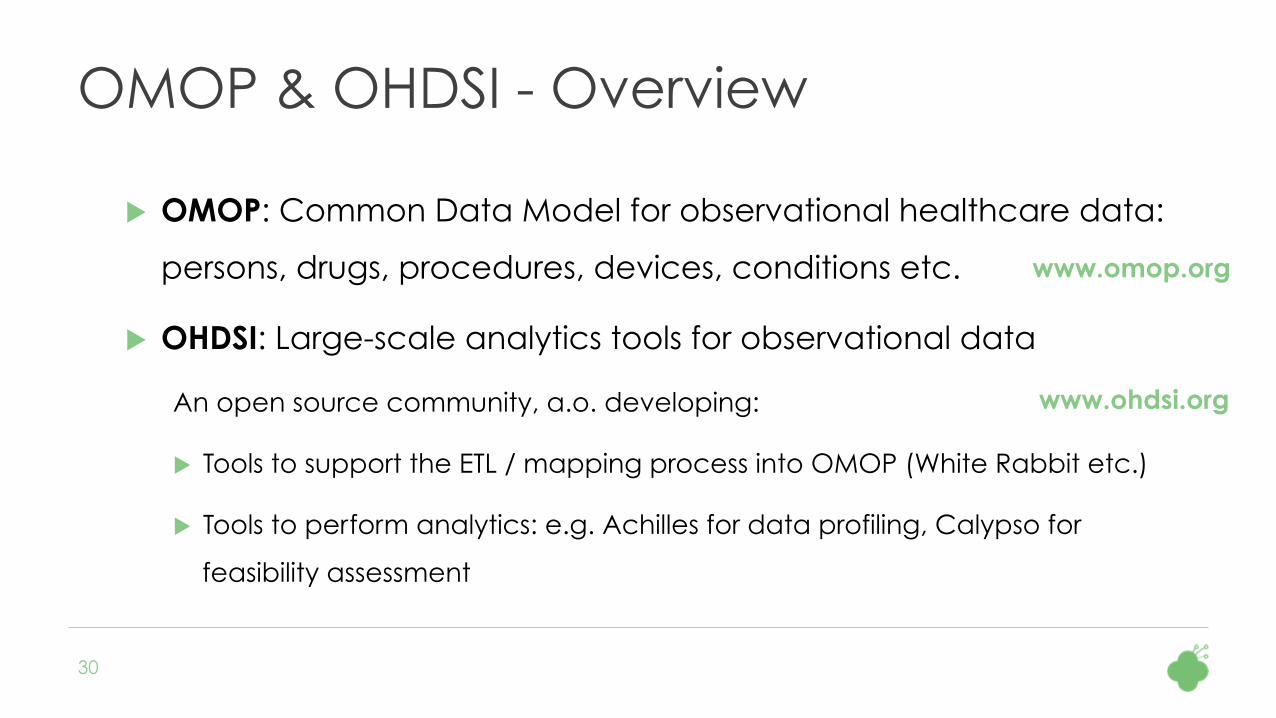
OMOP & OHDSI - Overview
u OMOP: Common Data Model for observational healthcare data:
persons, drugs, procedures, devices, conditions etc.
u OHDSI: Large-scale analytics tools for observational data
An open source community, a.o. developing:
u Tools to support the ETL / mapping process into OMOP (White Rabbit etc.)
u Tools to perform analytics: e.g. Achilles for data profiling, Calypso for
feasibility assessment
www.omop.org
www.ohdsi.org

31
OMOP Common Data Model v5.0
v OMOP =
Observational
Medical
Outcomes
Partnership
v CDM = Common
Data Model
v SQL Tables
32
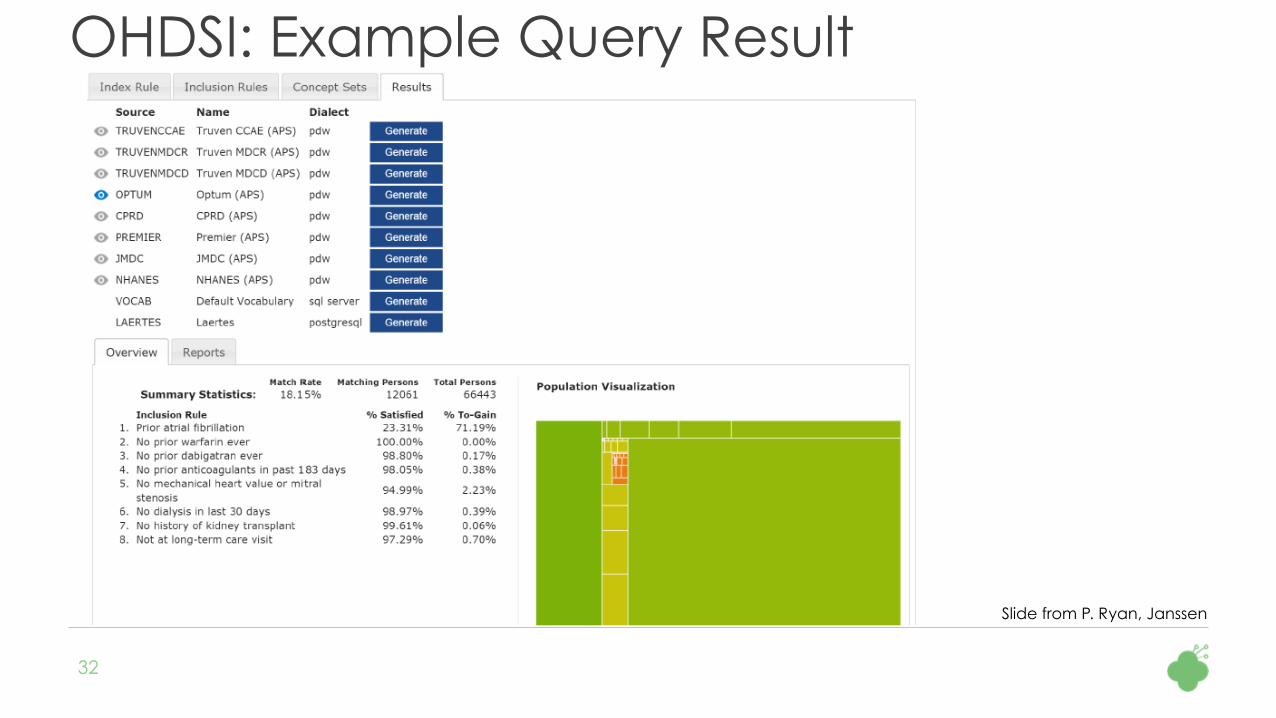
OHDSI: Example Query Result
Slide from P. Ryan, Janssen

Re-use of healthcare data
33
Prof. Johan van der Lei Erasmus MC University Medical Center
“We need to learn from experience and find ways to unite the large volumes of data in Europe. At
the end of the day, we are in this for better health care.”
Co-coordinator EMIF-Platform
EMIF-Platform
3.
PERSONAL HEALTH DATA
34
35
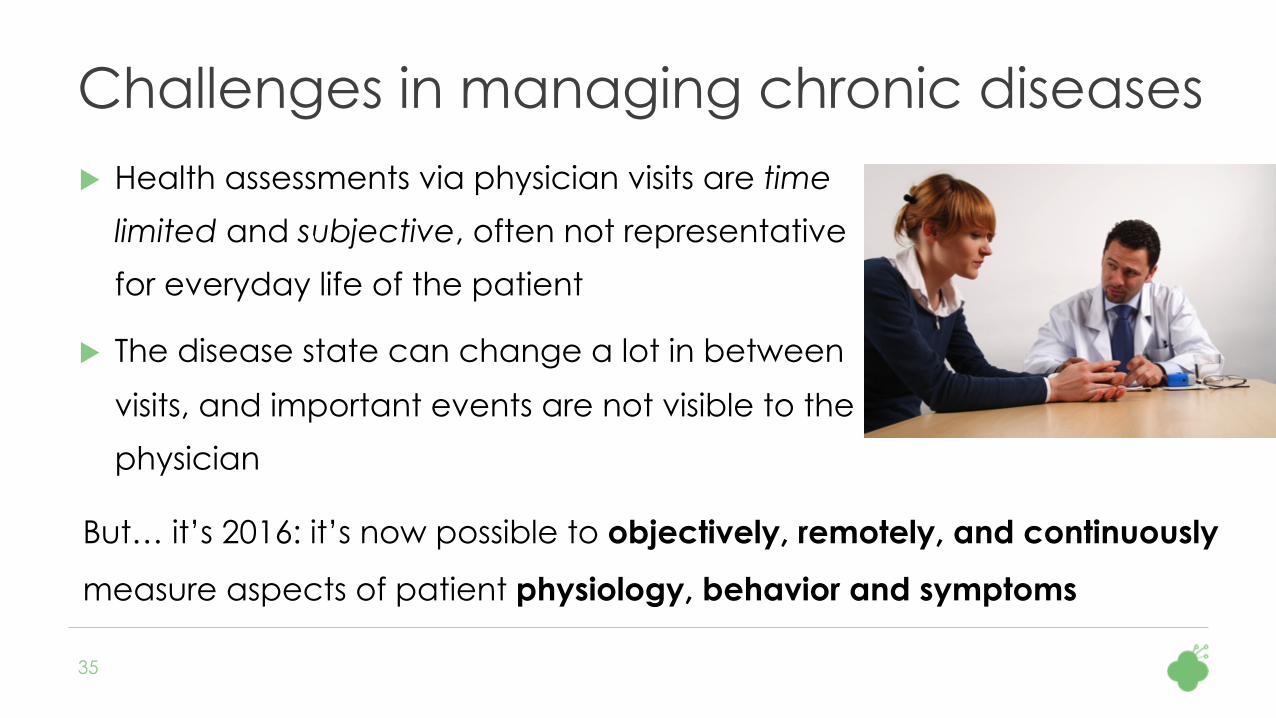
Challenges in managing chronic diseases u Health assessments via physician visits are time
limited and subjective, often not representative
for everyday life of the patient
u The disease state can change a lot in between
visits, and important events are not visible to the
physician
But… it’s 2016: it’s now possible to objectively, remotely, and continuously
measure aspects of patient physiology, behavior and symptoms

36
RADAR-CNS: Focus areas from diagnose & treat à predict & pre-empt
u Epilepsy
u Monitoring and predicting epileptic seizures
u Multiple Sclerosis
u Monitoring exacerbations and disease state
u Depression
u Monitoring for possible relapses, plan timely interventions
u Predict bipolar state transitions

37
Continuous Patient Assessment

38
Potential digital biomarkers

39
Preliminary Technology Stack
Analytics