Embed Size (px)
Citation preview

Transitioning from Reaching Every District to
Reaching Every Community -
with a focus on Quality Improvement In Ethiopia and Uganda
Exploration of RED/REC-QI in Ethiopia and Uganda is led by
Samra Ashenafi, JSI, UI-FHS Ethiopia project
Gerald Ssekitto, JSI, USAID/Maternal and Child Survival Program, Uganda
Ethiopia Uganda

Moving from Reaching Every District (RED) to Reaching Every Community and Child (REC)
Planning and management of resources
Reaching target populations
Linking services with communities
Supportive supervision
Monitoring for action
• Most districts have now been reached with routine immunization
• To achieve equity and
protect hard-to-reach from vaccine- preventable diseases, need flexible approaches and focus on low-performing districts and facilities

• RED/REC focuses on the “what” - strengthening RI performance, meaning immunization coverage
• QI focuses on the “how” - identifying process improvements to overcome bottlenecks and find local solutions
• QI methods break large problems into smaller, more “doable” pieces
– Identify small scale changes with peers, share promising practices and data on a regular basis
– Process improvements: finding positive deviance examples, local solutions, contextualize and test others’ successes
3
Adding Quality Improvement (QI) to RED and REC

Putting the pieces together: the RED/QI or REC-QI approach
• Data analysis and use
• Supportive supervision
• Quality review meetings (QRMs) and monthly review meetings
• Quality Improvement Teams (QITs) with community membership
• Microplanning as a key step in district and facility planning
REC-QI
Sup
po
rtive Su
pe
rvision

Examples of RED-QI and REC-QI in action
Ethiopia: RED-QI
Use of QI methodology – Plan-Do-Study-Act cycles - to mobilize volunteers to identify all children needing vaccination
Uganda: REC-QI
Mapping health facility catchment areas for target populations for effective immunization microplanning

Where are services provided?
- Health posts: serve 3000-5000 people
- Health centers: serve 15,000-25,000 people
- Outreach: important strategy to deliver immunization
Who provides vaccination?
- 34,000 Health Extension Workers (HEWs), trained for 1 year
- 2 HEWs per health post
- Immunization is one of 16 services they provide
- Community volunteers assist them with outreach
- Supported by Steering Committees (Quality Improvement Teams) made up of sub-district administrators and HEWs
Putting RED-QI into practice in Ethiopia: Immunization Service Delivery in Ethiopia

Quality Improvement Teams conduct Plan-Do-Study-Act (PDSA) cycles for
immunization
What are we trying toaccomplish?
How will we know that achange is an improvement?
What change can we make thatwill result in improvement?
Model for Improvement
PlanAct
DoStudy
• Identify one problem and change idea to focus on. Example: Identify and register all pregnant women and newborns for immunization
• Use HEWs and community volunteers to conduct house to house registration and sensitize on immunization
• Try this for 2-3 months & examine results
• Then adopt, adapt, or abandon the change idea.
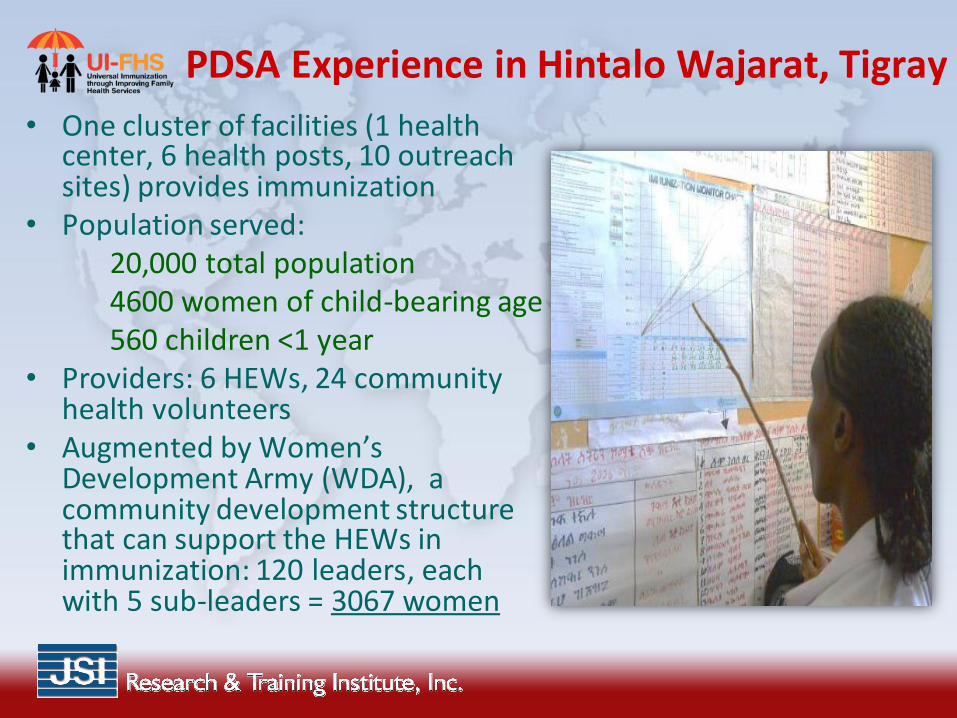
PDSA Experience in Hintalo Wajarat, Tigray
• One cluster of facilities (1 health center, 6 health posts, 10 outreach sites) provides immunization
• Population served: 20,000 total population 4600 women of child-bearing age 560 children <1 year
• Providers: 6 HEWs, 24 community health volunteers
• Augmented by Women’s Development Army (WDA), a community development structure that can support the HEWs in immunization: 120 leaders, each with 5 sub-leaders = 3067 women

AIM: Increase full immunization coverage from 85% to 95% from September 17, 2012 to November 7, 2012 • Plan: Quality Improvement Team conducted meeting with WDA,
HEWs, PHCU directors, supervisor and midwives • Do: Enlisted Women’s Development Army to identify unimmunized
children • 25 defaulter children found during house to house visits; all vaccinated • 68 never-immunized and newborn children registered from house to house
visit and during institutional delivery; 45 started their vaccinations
• Study • Integration with the community, WDA and health staffs is mandatory • Follow-up for children not yet started vaccination
• Act • Adopted the change idea and will use it for other programs
PDSA to Strengthen Routine Immunization

Uganda: Mapping facility catchment areas for target populations
Health facility target populations are essential for immunization microplanning and performance monitoring.
• Macro mapping: a continuous process of identifying and assigning communities (parish level) to facilities to enable effective health service delivery
• Micro mapping: a continuous process of identifying and assigning communities (village level) within a health facility catchment area to routine immunization service delivery points (static and outreaches)

Macro-mapping process: How is it done?
1. Assemble key inputs: District collects official government population statistics and lists of facilities with their locations and role in routine immunization service delivery
2. Prepare first draft of facility catchment area macro map: District convenes a half-day meeting of 5-10 person working committee with knowledge of district geography (location of parishes, physical structures such as rivers, cliffs, roads) to assign communities/parishes to health facilities.
3. Harmonize and build consensus on macro map: At a quarterly district health meeting, present and discuss the draft map; adjust and agree upon final version. Each facility catchment area is discussed separately in the presence of the health facility in-charge or representative

Criteria: how is it done?
Agree on criteria for assigning communities to facilities:
1. Proximity of community to the facilities
2. Access of HF by residents
• Geographical
• Socio economical
3. Capacity of health facility to serve the communities:
• Transport
• Health workers
• Adequate vaccines & ice packs
4. Health facility already providing health services in the community

Example: HF catchment areas
13
RUKUNGIRI DISTRICT MACRO MAP FOR HF SERVICE AREAS 15/01/2013
Parish/Ward
where HF is
located
HSD/SUBCOUNTY/
HF
LEVEL
Parishes its Resp
for
Total Pop
2012
Target Pop < 1yr
annualised to six
months
Rukungiri district 312861 6727
Kebisoni HSD 64800 1393
Buyanja S/C 37200 800
Buyanja T/Parish Buyanja HC III Nyakina 5900 127
Buyanja T/Parish 0 0
Kyamakanda 6500 140
Rwakirungura 3500 75
Bugyera 3800 82
Sub-total 19700 424
Nyakaina Kafunjo HC II
Kasheshe Kasheshe HC II Kasheshe 2850 61
Nyabitete Buhandagazi HC II Nyabitete 3700 80
Rubanga Rubanga HC II Rubanga 6400 138
Kyamakanda Rwamuhima HC II
Kyamakanda Kyamakanda HC II
Bugyera Kitojo HC II
Nyakabungo Nyakabungo HC II Nyakabungo 2850 61
Rwakirungura Rwakirungura HC II Rwakirungura 6900 148
0
Kebisoni S/C 27600 593
Kebisoni T/parish Kebisoni HC IV Kebisoni T/P 2900 62
Kakinga 2900 62
Kabingo 3600 77
Garubunda 3600 77
Subtotal 13000 280
Kigiro Ndama HC III Kigiro 3000 65Garubunda Garubunda HC II 0
Kabingo Kahengye HC II 0Mabanga Karuhembe HC II Mabanga 3600 77
Karuhembe 3600 77Subtotal 7200 155
Nyeibingo Bikungu HC II Nyeibingo 4400 950
St. Mark Mabanga HC II 0
Nyakazinga HC II 0Karuhembe

Micro-mapping process: How is it done?
1. Assemble key inputs: Each HF collects final Macro Mapp (HF catchment area communities) & list of RI service delivery points (static and outreaches) in catchment area
2. Prepare first draft of facility micro mapp: HF convenes a half-day meeting of 3-5 person working committee with knowledge of HF catchment area geography (location of parishes, villages, physical structures such as rivers, cliffs, roads) to assign communities/villages to RI service delivery points.
3. Harmonize and build consensus on micro mapp: At HF meeting with Village Health Teams (VHT), present & discuss draft mapp; adjust & agree upon final version. Each RI delivery point discussed separately in presence of VHT from each of the villages allocated

Micro-mapping process:
1. Assemble key inputs: Final Macro Mapp, list of RI service delivery points (Static and outreaches)
2. Prepare first draft of facility micro mapp: HF convenes a half-day meeting of 3-5 person working committee.
3. Harmonize and build consensus on micro mapp: HF staff & Village health Teams (VHT) meet.
Location, day & time of RI delivery point is discussed


Results and Applications Health facility catchment area sketch map developed to enhance planning and monitoring of health service delivery
– Makes it possible to complete the RED immunization microplanning tables
– Previously unreached communities can be identified & planned for services
– Improves resource allocations, e.g., for vaccines, by basing them on HF catchment area population
– Enables better linking of services to communities
– RI services oriented to caretakers needs & RI schedule communication greatly improved
– Target populations for other services. Example: ANC can be planned based on accurate estimates of expected number of pregnancies

RED guide EPI microplanning tool

Analysis of Health Facilty Data Cumulative (Q2 FY 2013/14)Criteria Criteria
Name : DPT1 coverage DPT1 coverage
90% 90%
Goal : Increase immunization coverage to at least 90% with all vaccines in every district Drop-out Rate Drop-out Rate
10% 10%
Area Name
Target
population for
Oct - Dec
2013
Oct-Dec 2013
Categorize
problem
Jul-Sep 2013
Categorize
problem
DPT1 DPT3 Measles DPT1 DPT3 Measles DPT3 Measles DPT1-DPT3DPT1-
MeaslesAccess Utilization
Category
1,2,3, or 4
Category
1,2,3, or 4
a b c d e f g h i j k l m n
District 3505 3404 3357 3050 97 96 87 148 455 1 10.4 Good Good Cat. 1 Cat. 4
Kebisoni HSD 705 634 601 590 89.9% 85% 84% 104 115 5% 7% Poor Good Cat. 3 Cat. 1
Buyanja S/C 405 285 262 304 70% 65% 75% 143 101 8% -7% Poor Good Cat. 3 Cat. 4
Buyanja 158 72 74 115 46% 47% 73% 84 43 -3% -60% Poor Poor Cat. 4 Cat. 4
Kasheshe 31 72 49 64 232% 158% 206% -18 -33 32% 11% Good Poor Cat. 2 Cat. 1
Buhandagazi 40 46 39 40 115% 98% 100% 1 0 15% 13% Good Poor Cat. 2 Cat. 2
Rubanga 70 53 59 47 76% 84% 67% 11 23 -11% 11% Poor Poor Cat. 4 Cat. 2
RUKUNGIRI DISTRICT
Doses of vaccine
administred
Compile population, immunization
coverage data in previous 3 months
Immunization
coverage (%)
Unimmunized
(No.)Drop-out (rates (%)
Analyse Problem
Identify problem

Results and Applications
HF specific target population estimates can lead to better management and high, sustainable coverage

Results and Applications

Conclusion
• REC-QI combines the “what” and “how” of RI system strengthening for sustainable improvement in coverage
• Brings together all EPI stakeholders including non- traditional ones – advocacy, resource mobilization
• Encourages innovation and seeking local solutions to improve processes
• By working at both national & lower level, REC-QI encourages peer learning and incorporation of innovations into national policies, guidelines & protocols
Thank you!
facebook.com/MCSPglobal Twitter.com/MCSPglobal
www.mcsprogram.org