Embed Size (px)
Citation preview
Achieving Equity in Immunization through Reaching Every Community
A UNICEF Initiative

100
80
60
40
20
0
Global African American Eastern Mediterranean European South East Asian Western Pacific
84 82 79 80 80
76 77 75 73 73 73 73 73 70 70 69
64
56 52 50
45
38
25 23 20
83 83 83
72 72 72 72 72
1980
1981
1982
1983
1984
1985
1986
1987
1988
1989
1990
1991
1992
1993
1994
1995
1996
1997
1998
1999
2000
2001
2002
2003
2004
2005
2006
2007
2008
2009
2010
2011
2012
Great progress with global
vaccination coverage, but more
needed in some regions
% D
TP
3 c
overa
ge

20 23 25
3845
50 5256
6469
7672 707073 7372 72 7272 73 7373 75 77 7880 80 8384 84 8383 84
0
20
40
60
80
100
1980
1981
1982
1983
1984
1985
1986
1987
1988
1989
1990
1991
1992
1993
1994
1995
1996
1997
1998
1999
2000
2001
2002
2003
2004
2005
2006
2007
2008
2009
2010
2011
2012
2013
% D
TP
3 c
overa
ge
Global High income Middle income Low income
Vaccination coverage is highest
and correlated with country
income
Source: WHO/UNICEF coverage estimates 2013 revision. July 2014
Immunization Vaccines and Biologicals, (IVB), World Health Organization.
194 WHO Member States. Date of slide: 28 July 2014.

202325
38
455052
56
6469
76727070
7373727272727373737577788080838484838384
0
20
40
60
80
100
1980
1981
1982
1983
1984
1985
1986
1987
1988
1989
1990
1991
1992
1993
1994
1995
1996
1997
1998
1999
2000
2001
2002
2003
2004
2005
2006
2007
2008
2009
2010
2011
2012
2013
2104
2015
2016
2017
2018
2019
2020
% D
TP
3 c
overa
ge
The expansion of vaccination coverage
UCIRapid scale-
up in
coverage
Consolidationstagnating coverage
(in %)
Launch of GAVIModest coverage
gains, and focus on
new vaccines
Reach the fifth childCoverage improvement, portfolio
expansion, and integration with
broader disease control
Adapted from: L. Brearley et al. Vaccine 31S(2013) B103-B107

Focusing on the un-reached, where there are
inequities in wealth…
0 10 20 30 40 50 60 70 80 90 100
Centr Afr Rep
Chad
D.R. Congo
India
Liberia
Madagascar
Mozambique
Nigeria
Pakistan
Viet Nam
Yemen
2010
2004
2010
2005
2007
2008
2011
2011
2012
2010
2006
DTP3 Coverage (%)
DTP3 Coverage among lowest and highest wealth quintiles, selected countries
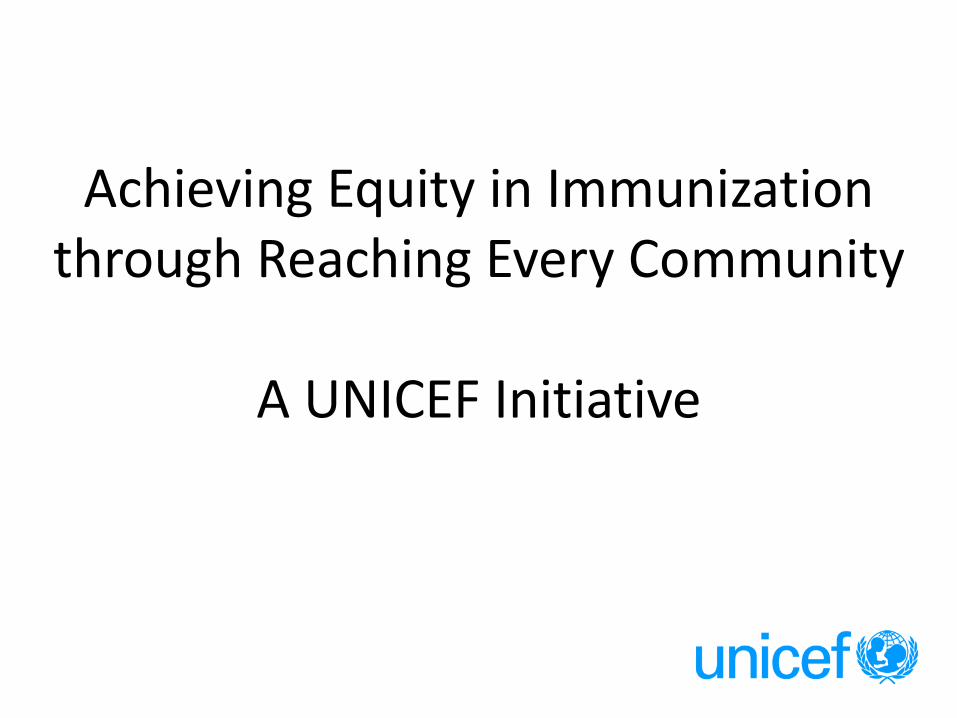
Immunization inequities by population characteristics, Madagascar, 2011
100
90
80
70
60
50
40
30
20
10
Madagascar (63%)
Boys (63.1)
Girls (62.6)
Urban (87)
Rural (59)
Secondaryeducation or more (80)
No formal instruction (47)
Birth Order 2nd (68)
Birth Order 6+ (50)
Mother’s education
Wealthiest quintile (74%)
Poorest quintile (49%)
% DTP3
Coverage ratio: 1.01CI: 0.94 –1.07
Coverage ratio: 1.35CI: 1.20 –1.51
Coverage ratio: 1.47CI: 1.39 –1.56
Coverage ratio: 1.69CI: 1.54 –1.86
Coverage ratio: 1.51CI: 1.35 –1.69
Coverage ratio: 3.44CI: 2.30 –5.16
Itasy Region (89)
Menaberegion (26)
OR: 1.02CI: 0.82 –1.17
OR: 2.0CI: 1.60 –2.68
OR: 4.52CI: 3.22 –6.35
OR: 2.99CI: 2.21 –4.04
OR: 4.48CI: 3.41 –5.88
OR: 25.1CI: 9.72 –65.8
Source: MDG survey, 2013; CI refers to 95% confidence interval; OR = Odds ratio
Inequities in Immunization take many forms

Why Equity & Immunization Matter
“Disease burdens tend to be
disproportionately
concentrated in more
marginalized populations,
reaching more people will
not only achieve a greater
degree of equity, but will
also achieve a greater health
impact and contribute to
economic development”

UNICEF – ideally placed to address immunization inequities
“In everything it does, the most disadvantaged children and the countries in greatest need have priority”

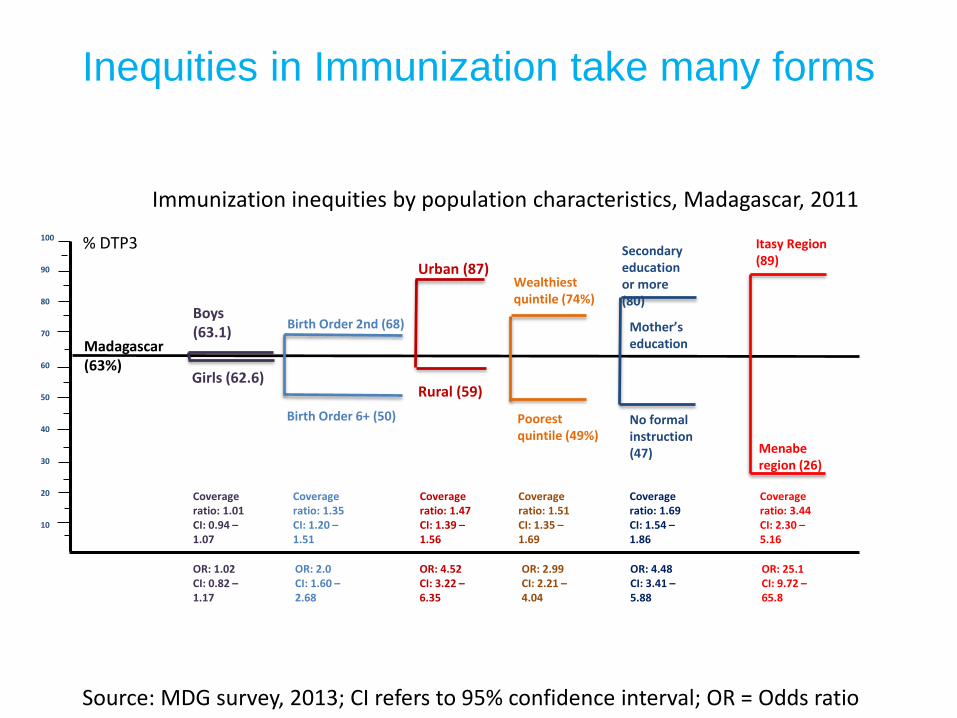
UNICEF’s Reaching Every Community Strategy
1. Identify children who suffer from immunization inequities & describe their
social/gender/geographical characteristics
2. Micro plans that reduce inequities by ensuring every community is accounted
for & receives immunization sessions appropriate to people served
3. Innovative solutions (including new technologies) that overcome problems of
inequities including social distance
4. Systems to monitor disadvantaged community immunization status
5. Commitment & allocation of resources to reduce immunization inequities at
the level they can be overcome, within Health Centres & communities

1) Identifying children & inequities
Mozambique – children in remote areas
0 20 40 60 80 100Vaccination coverage Pentavalent3 (DTP3) ( % )
Poorest
ZambeziaProvince
Illiterate mother
Rural
Boys
Richest
Mother with secondary education
Maputo Province
Urban
Girls
Geographic inequities

1) Identifying children & inequities
Liberia –children in poverty
• UNICEF supported immunization equity
analysis in May 2013
– Children in poorest households found to have
lowest coverage
– 1/3 of children were in the national capital
esp. urban poor communities
• UNICEF has developed an urban
immunization strategy and is supporting
the MOH with implementation
© UNICEF/NYHQ2007-0574/Pirozzi

1) Service delivery bottlenecks, Atsimo Andrefana region, September 2013, Madagascar
Source: DTP3 coverage: MDG survey 2013; Other data: Health Facility study, UNICEF 2014
UNICEF’s Reaching Every Community Strategy
1. Identify children who suffer from immunization inequities & describe their
social/gender/geographical characteristics
2. Micro plans that reduce inequities by ensuring every community is accounted
for & receives immunization sessions appropriate to people served
3. Innovative solutions (including new technologies) that overcome problems of
inequities including social distance
4. Systems to monitor disadvantaged community immunization status
5. Commitment & allocation of resources to reduce immunization inequities at
the level they can be overcome, within Health Centres & communities

2) Micro plans inclusive of all children
Madagascar
• UNICEF assessments found lack of quality micro planning at health facility level
• UNICEF has developed micro planning tool that focuses on equity gaps, including budget calculator
© UNICEF/NYHQ2009-1234/Pirozzi

2) Micro plans inclusive of all children
Cambodia
• UNICEF and WHO supported using measles SIA to assess community immunization coverage through card checks
• Updating HF micro plans to prioritize these communities & link to GAVI HSS funds for outreach
Formula used ( 0-80%)
Full PartialNon/no
card
Yellow
card
checked
No.full / No.checked x
100%
1 ភ្ន ំព្រាល ព្ព្រៃសន្ទះ Rural HTR 11 4 5 20 55%
2 ភ្ន ំព្រាល ដសី Rural HTR 9 3 6 12 75%
3 ភ្ន ំព្រាល ដសីអ ិត Rural HTR 5 0 4 7 71%
4 ភ្ន ំព្រាល ភ្ន ំព្រាល Rural HTR 3 1 1 5 60%
5 ភ្ន ំព្រាល បាយសី Rural HTR 14 6 2 20 70%
6 ភ្ន ំព្រាល អន្លង់រក្សា Rural HTR 6 5 2 8 75%
7 ភ្ន ំព្រាល សំបូ Rural HTR 3 9 12 25%
8 ភ្ន ំព្រាល ស្ព្រសម្អម្ Rural HTR 3 8 3 14 21%
9 ភ្ន ំព្រាល ភ្ន ំសព ង Rural HTR 3 1 1 5 60%
10 ភ្ន ំព្រាល ក្សាលឡាន្ Rural HTR 8 2 4 10 80%
11 ភ្ន ំព្រាល សទ ឹងព្រតង់ Rural HTR 11 6 3 20 55%
12 ភ្ន ំព្រាល ទួលខ្ពស់ Rural HTR 12 8 20 60%
13 ភ្ន ំព្រាល ថ្នល់បត់ Rural HTR 10 9 19 53%
14 ភ្ន ំព្រាល ដូង Rural HTR 13 2 5 20 65%
15 ភ្ន ំព្រាល បឹងព្រៃលឹត Rural HTR 8 2 5 15 53%
16 ភ្ន ំព្រាល ផ្សាព្រៃំ Rural HTR 11 3 1 15 73%
17 ភ្ន ំព្រាល អូរអិល Rural HTR 8 5 0 13 62%
No Name of HC
List of high risk village of Pailin province , 2014
Name of Village HRC type
Yellow Card Check - HRCs

UNICEF’s Reaching Every Community Strategy
1. Identify children who suffer from immunization inequities & describe their
social/gender/geographical characteristics
2. Micro plans that reduce inequities by ensuring every community is accounted
for & receives immunization sessions appropriate to people served
3. Innovative solutions (including new technologies) that overcome problems of
inequities including social distance
4. Systems to monitor disadvantaged community immunization status
5. Commitment & allocation of resources to reduce immunization inequities at
the level they can be overcome, within Health Centres & communities

3) Innovative solutions to overcome inequities and social distanceMozambique - UNICEF supported:
• 200,000 people reached through Multimedia Mobile units in media dark areas with debated video sessions promoting access to basic services and healthy behaviours
• Community Radios: weekly FFL programmes produced in 10 community radios in Zambezia
• Approx. 70,000 people engaged in participatory community theatre sessions in 4 high priority districts

3) Innovative solutions to overcome inequities and social distance
Uganda –
• mTrack is an SMS-based disease surveillance and medicine tracking system at all 5,000 health facilities and through 8,000 health workers
• e.g. SMS poll for feedback on:– Awareness of new vaccine introduction (PCV) –
3500 response in 24 hours (cost 150 USD)
– Cold chain functionality – 1862 health facilities within 48 hours (cost 150 USD)
– Vaccine stock outs – 1700 responses with 52% reporting stock outs of current vaccines
• Can also be used for community reporting model to improve accountability

3) Madagascar’s response to lack of access: Days of Intensified Routine Immunization (JIVR)
-
20,000
40,000
60,000
80,000
100,000
120,000
Jan Feb Mar Apr May Jun Jul Aug Sep Oct Nov Dec
Annee 2010
Annee 2011
Annee 2012
Mother and
Child Health Week
Mother and
Child Health Week
Days of
intensified
RI
Days of
intensified
RI
Days of
intensified
RI
Days of
intensified
RI
Source :Service de Vaccination

UNICEF’s Reaching Every Community Strategy
1. Identify children who suffer from immunization inequities & describe their
social/gender/geographical characteristics
2. Micro plans that reduce inequities by ensuring every community is accounted
for & receives immunization sessions appropriate to people served
3. Innovative solutions (including new technologies) that overcome problems of
inequities including social distance
4. Systems to monitor disadvantaged community immunization status
5. Commitment & allocation of resources to reduce immunization inequities at
the level they can be overcome, within Health Centres & communities
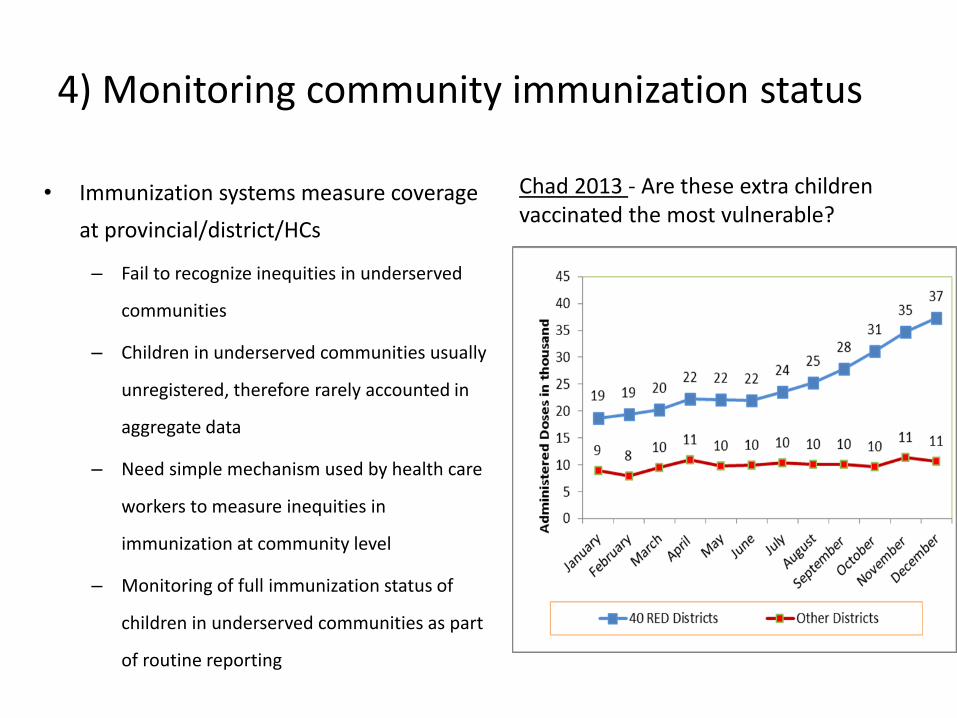
4) Monitoring community immunization status
• Immunization systems measure coverage
at provincial/district/HCs
– Fail to recognize inequities in underserved
communities
– Children in underserved communities usually
unregistered, therefore rarely accounted in
aggregate data
– Need simple mechanism used by health care
workers to measure inequities in
immunization at community level
– Monitoring of full immunization status of
children in underserved communities as part
of routine reporting
Chad 2013 - Are these extra children vaccinated the most vulnerable?

4) Monitoring community immunization status
Cambodia• UNICEF
supported trial based on LQA & card check in high risk communities
• Integrates both child and mother immunization status

UNICEF’s Reaching Every Community Strategy
1. Identify children who suffer from immunization inequities & describe their
social/gender/geographical characteristics
2. Micro plans that reduce inequities by ensuring every community is accounted
for & receives immunization sessions appropriate to people served
3. Innovative solutions (including new technologies) that overcome problems of
inequities including social distance
4. Systems to monitor disadvantaged community immunization status
5. Commitment & allocation of resources to reduce immunization inequities at
the level they can be overcome, within Health Centres & communities
Increasing Commitment & resources for Health Centres & Communities
• A rapid assessment approach to identify financial bottlenecks to the flow, use and tracking of immunization funds.
• Improve predictability and targeting (ring-fencing) of funds to implementing routine immunization services
• UNICEF has carried out proof of concept testing in Madagascar, Indonesia, Uganda, as well as preliminary work in Mozabique
Financial bottlenecks contribute to poor implementation & low coverage, e.g. Madagascar
• Some preliminary results Madagascar (2014)
1. Disbursements to health centers are in cash; no formal banks available.
2. Disbursed budget at times is lower than planned or approved budgets
3. Immunization funds not protected/ring-fenced and get used for other purposes
• Some impacts
– Low compliance with approved immunization plans and budgets.
– Funding delays impact outreach the unreached stay unreached
– Resource use does not follow microplans
– Fragmented resource availability: not all funds available at same time
– Poor tracking reduces managers’ ability to know what funds actually ‘buy’.
30
• Some solutions:
– Rapid SMS to alert district/province/nat’l level if outreaches can’t occur as planned due to lack of fuel, funds, vaccines, AND staff
– Community registers that must be signed by outreach staff, as quality/equity check to ensure at risk communities receive outreach
– High level political advocacy (with partners) to agree on PoA to increase predictability of routine immunization financing
31
Financial bottlenecks contribute to poor implementation & low coverage, e.g. Madagascar

Summary
• Tackling inequities is key to increasing immunization coverage.
• An equity approach will require using more “granularity” in identifying unreached children, and in defining strategies
•

THANK YOU