Embed Size (px)
Citation preview
s
Support for this work was provided by UNICEF. UNICEF and John Snow, Inc. (JSI) shall have the right to duplicate, use, or disclose the data to the extent
provided in the contract. This restriction does not limit UNICEF’s right to use information contained in these data if it is obtained from another source
without restriction.
UNICEF MALAWI
NETWORK
ASSESSMENT &
SYSTEM DESIGN FOR
TRANSPORT OF EID
SAMPLES AND TEST
RESULTS
Project Report
June 05, 2018
Submitted to:
UNICEF Malawi Lilongwe, Malawi
Judith Sherman Emmanuel Saka
John Snow, Inc.
1616 North Fort Myer Drive Arlington, VA 22209
Tel: +1.703.528.7474
www.jsi.com/supplychain

© John Snow, Inc. | Use of disclosure of data contained on this sheet is subject to the restriction on the title page of this document.
1
John Snow, Inc. (JSI) is a U.S.-based health care consulting firm committed to improving the health of individuals and communities worldwide. Our multidisciplinary staff works in partnership with host-country experts, organizations, and governments to make quality, accessible health care a reality for children, women, and men around the world. JSI’s headquarters are in Boston, Massachusetts, with U.S. offices in Washington, D.C.; Atlanta, Georgia; Burlington, Vermont; Concord, New Hampshire; Denver, Colorado; Providence, Rhode Island; and San Francisco, California. JSI also maintains offices in more than 40 countries throughout the developing world.
John Snow, Incorporated 1616 North Fort Myer Drive 703 528 7474 Voice Arlington Virginia 703 528 7480 Fax 22209 USA [email protected] Email www.jsi.com www.jsi.com Web
© John Snow, Inc. | Use of disclosure of data contained on this sheet is subject to the restriction on the title page of this document.
2
TABLE OF CONTENTS
Table of Contents ............................................................................................................................ 2
Acronym List .................................................................................................................................. 3
Executive Summary ........................................................................................................................ 4
Background & Objectives ............................................................................................................... 7
Objectives .................................................................................................................................... 7
Methodology & Approach .............................................................................................................. 8
Data Collection and Tools ........................................................................................................... 8
Interviews and Site Visits ............................................................................................................ 9
Analyses ...................................................................................................................................... 9
Limitations & Assumptions .......................................................................................................... 10
Specimen Referral Network and Public Health Supply Chain ..................................................... 12
Bottleneck Analysis ...................................................................................................................... 14
Network Optimization Analysis ................................................................................................... 19
Data Inputs ................................................................................................................................ 20
UAV Types and Specimen Referral System Requirements ...................................................... 21
Scenarios ................................................................................................................................... 25
Discussion and Recommendations ............................................................................................... 38
Stakeholder Engagement and Scenario Evaluation ................................................................... 38
Recommended System Design and Pilot .................................................................................. 41
ANNEX A: Documents Consulted .............................................................................................. 42
ANNEX B: Data Collection Tools .............................................................................................. 43
ANNEX C: Key Informants......................................................................................................... 53
ANNEX D: Network Scenario Inputs and Outputs ..................................................................... 54
© John Snow, Inc. | Use of disclosure of data contained on this sheet is subject to the restriction on the title page of this document.
3
ACRONYM LIST
CHAI Clinton Health Access Initiative
CMO Chief Medical Officer
CMST Central Medical Stores Trust
DBS Dried Blood Spot
DHO District Health Office
EID Early Infant Diagnosis
EPI Expanded Program on Immunization
HF Health Facility
HIV/AIDS Human Immunodeficiency Virus/Acquired Immunodeficiency Syndrome
KPIs Key Performance Indicators
LSAT Logistics System Assessment Tool
MBTS Malawi Blood Transfusion Service
MOH Ministry of Health
MZCH Mzuzu Central Hospital
POC Point of Care
RVS Regional Vaccine Store
SC Supply Chain
SCM Supply Chain Management
SOPs Standard Operating Procedures
TAT Turnaround Time
TB Tuberculosis
UAV/ UAS Unmanned Aerial Vehicle/ System
UNICEF United Nations International Children’s Emergency Fund
VL/ VLT Viral Load/ Viral Load Test

© John Snow, Inc. | Use of disclosure of data contained on this sheet is subject to the restriction on the title page of this document.
4
EXECUTIVE SUMMARY
A strong specimen referral system is built on a robust system design and efficient operational processes to safely refer quality-controlled specimens to testing laboratories and relay results back in a timely manner to enable clinicians to make informed decisions about their patients’ management.
Although Malawi already has a functional and effective specimen referral system running throughout the majority of the country, which is a major strength of the diagnostic network, there are still challenges to achieving an efficient referral system for HIV specimens and results for early infant diagnosis (EID) and viral load (VL) testing. These challenges include factors related to geography and climate, road conditions, distances between sites, the number of stops in the referral process, laboratory processing times, and financial constraints. Using network optimization software, network scenarios were developed to address some of these challenges in Nkhata Bay and Likoma Island districts by modeling changes in the transport network, including the use of unmanned aerial vehicles (UAVs) as an additional mode of transport in the current system. To address serving needs beyond EID and VL testing and to increase vehicle utilization, the modeled scenarios also considered transport of tuberculosis specimens, essential medicines, vaccines, safe blood for transfusions, and emergency health commodities.
Transport Network Optimization Scenarios
Four network scenarios were developed that serve all facilities in Nkhata Bay and Likoma Island districts, either directly or indirectly. The first scenario is the current system and baseline for comparison, in which most mainland facilities are served by motorcycle courier twice per week. The second scenario is similar to the first but increases frequencies of the motorcycle courier system. The third and fourth scenarios then incorporate UAVs. Based on Malawi’s specimen referral system requirements, and specifically the need for bi-directional transport and the distance of health facilities from the hub, the addition of UAVs as a mode of transport was limited to UAV types capable of vertical takeoff and landing and further narrowed to one type with a sufficient range to serve all facilities, assuming one hub for operations in Nkhata Bay. Upfront investment for the UAS is estimated at $115,000 including capital investment in facilities, vehicle (one UAV to cover both districts), equipment, and office space. Annual operating cost estimates are in addition to upfront investment needed for those scenarios including UAV systems.
Scenario 1 provides a baseline with which to compare other scenarios. Most mainland facilities are served directly by motorcycle courier twice per week on a fixed schedule. One facility and the reference laboratory at the Mzuzu Central Hospital (MZCH) are served once per week from the Nkhata Bay District Health Office (DHO). The two inaccessible mainland facilities are served indirectly, transporting their items by ferry or on foot to another facility that acts as a transfer point, and Likoma Island facilities use the local ferry to reach the mainland. Several other private facilities manage their own specimen and result transport to the DHO. The cost of this scenario, $37,600, is primarily driven by operating costs of the motorcycle courier service.
© John Snow, Inc. | Use of disclosure of data contained on this sheet is subject to the restriction on the title page of this document.
5
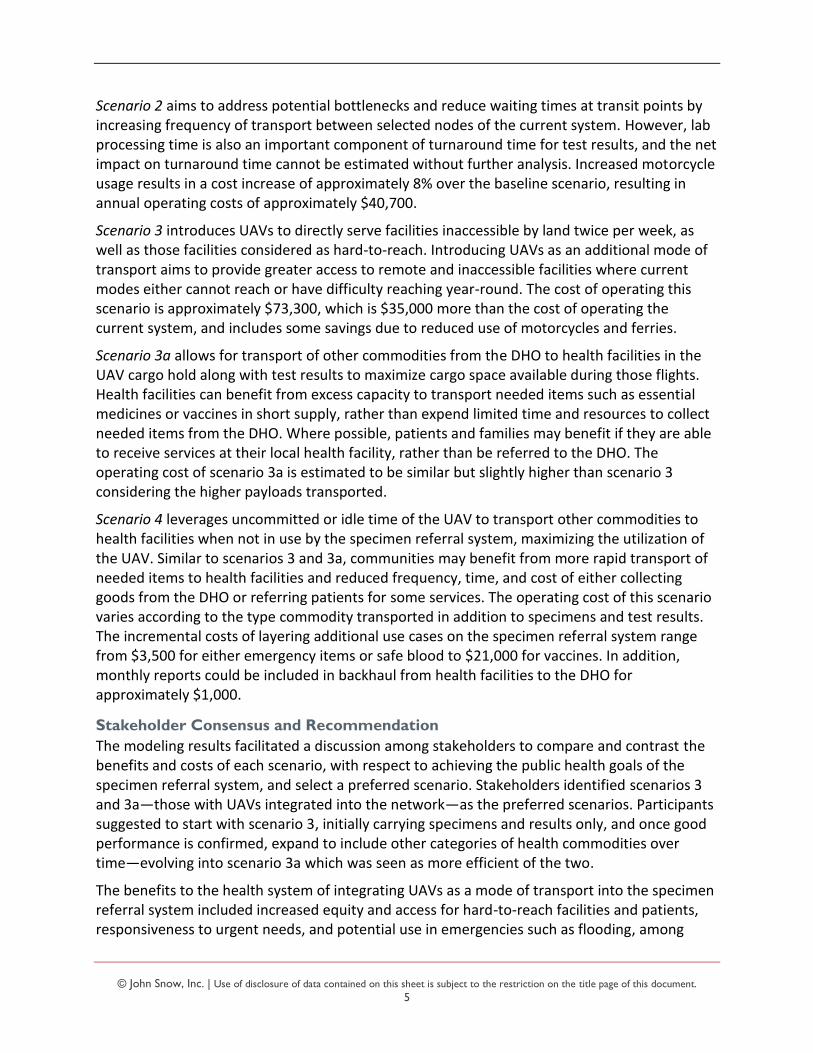
Scenario 2 aims to address potential bottlenecks and reduce waiting times at transit points by increasing frequency of transport between selected nodes of the current system. However, lab processing time is also an important component of turnaround time for test results, and the net impact on turnaround time cannot be estimated without further analysis. Increased motorcycle usage results in a cost increase of approximately 8% over the baseline scenario, resulting in annual operating costs of approximately $40,700.
Scenario 3 introduces UAVs to directly serve facilities inaccessible by land twice per week, as well as those facilities considered as hard-to-reach. Introducing UAVs as an additional mode of transport aims to provide greater access to remote and inaccessible facilities where current modes either cannot reach or have difficulty reaching year-round. The cost of operating this scenario is approximately $73,300, which is $35,000 more than the cost of operating the current system, and includes some savings due to reduced use of motorcycles and ferries.
Scenario 3a allows for transport of other commodities from the DHO to health facilities in the UAV cargo hold along with test results to maximize cargo space available during those flights. Health facilities can benefit from excess capacity to transport needed items such as essential medicines or vaccines in short supply, rather than expend limited time and resources to collect needed items from the DHO. Where possible, patients and families may benefit if they are able to receive services at their local health facility, rather than be referred to the DHO. The operating cost of scenario 3a is estimated to be similar but slightly higher than scenario 3 considering the higher payloads transported.
Scenario 4 leverages uncommitted or idle time of the UAV to transport other commodities to health facilities when not in use by the specimen referral system, maximizing the utilization of the UAV. Similar to scenarios 3 and 3a, communities may benefit from more rapid transport of needed items to health facilities and reduced frequency, time, and cost of either collecting goods from the DHO or referring patients for some services. The operating cost of this scenario varies according to the type commodity transported in addition to specimens and test results. The incremental costs of layering additional use cases on the specimen referral system range from $3,500 for either emergency items or safe blood to $21,000 for vaccines. In addition, monthly reports could be included in backhaul from health facilities to the DHO for approximately $1,000.
Stakeholder Consensus and Recommendation
The modeling results facilitated a discussion among stakeholders to compare and contrast the benefits and costs of each scenario, with respect to achieving the public health goals of the specimen referral system, and select a preferred scenario. Stakeholders identified scenarios 3 and 3a—those with UAVs integrated into the network—as the preferred scenarios. Participants suggested to start with scenario 3, initially carrying specimens and results only, and once good performance is confirmed, expand to include other categories of health commodities over time—evolving into scenario 3a which was seen as more efficient of the two.
The benefits to the health system of integrating UAVs as a mode of transport into the specimen referral system included increased equity and access for hard-to-reach facilities and patients, responsiveness to urgent needs, and potential use in emergencies such as flooding, among
© John Snow, Inc. | Use of disclosure of data contained on this sheet is subject to the restriction on the title page of this document.
6
others. Implementation challenges noted included issues of cost and long-term sustainability, and cost versus equity, and were suggested for further analysis. Numerous operational issues were highlighted as well as acceptance by communities, and concerns about accountability and responsibility. Interestingly, although many challenges were noted, it was agreed that they should not be seen as barriers to implementation, but rather a practical view of the context.
Based on these discussions, the recommended transport network system design integrates UAVs into the current system and follows a phased approach where the UAV system starts with transporting only specimens and results (scenario 3) and over time layers in additional use cases (scenario 3a) such that the system can be field-tested appropriately and complexity increased with proven performance. This phased approach should include specified operational KPIs with targets, which trigger movement to the next phase, and robust monitoring and evaluation.
© John Snow, Inc. | Use of disclosure of data contained on this sheet is subject to the restriction on the title page of this document.
7
BACKGROUND & OBJECTIVES
UNICEF has engaged John Snow, Inc. (JSI) to design a model for an optimized system for the collection, transportation and delivery of HIV samples and results for early infant diagnosis (EID) and viral load (VL) testing between health facilities and laboratories, exploring the use of unmanned aerial vehicles (UAVs) as an additional mode of transport.
UNICEF has been working with the Government of Malawi (GOM) and partners to strengthen the national HIV diagnostics network and medicine supply chain as part of their commitment to accelerating the achievement of ‘Start Free, Stay Free, AIDS Free.’ Improving paediatric uptake of antiretroviral therapy (ART) requires early diagnosis of HIV-exposed infants, and ongoing VL testing to monitor the effectiveness of the drugs and assess treatment failures. Both of these core activities require an efficient and cost-effective system for moving dry blood spot (DBS) samples from health centers to laboratories for testing, and for returning the results to the patient and healthcare provider.
Challenges in Malawi to achieving an efficient referral system for samples and results include factors related to geography, road conditions, distances between sites, multiple stops in the referral process, long laboratory processing times, and seasonal conditions, all contributing to long delays in turnaround time and ultimately initiating treatment. All of these challenges are underpinned by financial constraints and the need for cost-effective solutions.
The use of UAVs has recently become a viable addition to public health supply chains in transporting samples and commodities for public health programs, particularly given their ability to traverse difficult terrains and improve speed of delivery. UAVs may augment existing supply chains to offer a more reliable and potentially cost-effective alternative for last mile delivery in selected settings. In March 2016, UNICEF Malawi documented the feasibility of employing UAVs in a diagnostics supply chain and then did a further examination of its costs. This project builds on those results to design an optimized transport model for EID and VL testing in two districts, including incorporating UAVs as a possible additional mode of transport.
Objectives
The objective of this project is to design an optimized specimen referral system for the collection, transportation and delivery of HIV samples and results for EID and VL testing in Nkhata Bay and Likoma Island districts, addressing the challenges in Malawi’s diagnostic supply chain. The optimized system will consider Malawi’s physical and policy environment and may employ both traditional and innovative transport modes to meet the country’s health objectives. To address serving needs beyond EID and VL testing, additional Tuberculosis (TB) specimens, essential medicines, vaccines, safe blood for transfusions, and emergency health commodities have been considered.
Specific activities include the following:
Conduct a bottleneck analysis of Malawi’s supply chain system for EID and VL in Nkhata
Bay and Likoma Island districts, including transporting DBS for EID and VL testing and
the return of results to health facilities.
© John Snow, Inc. | Use of disclosure of data contained on this sheet is subject to the restriction on the title page of this document.
8
Design a supply chain pilot in the specified districts for optimal transport of DBS for EID
and VL and return of results utilizing UAVs, current transportation mechanisms and
point-of-care (POC) diagnostics, taking into consideration variations in geography, size
of facility/catchment area, current and future demand trends, road conditions,
distances between facilities and laboratories, and seasonal changes.
Design a monitoring framework for implementing the pilot that includes:
o Integration into existing MOH diagnostics and supply chain systems
o Community engagement
o Unforeseen challenges, opportunities and benefits
o Estimated costs
METHODOLOGY & APPROACH
JSI uses a consultative approach, fully engaging a wide range of stakeholders from the earliest planning stages, and continuing throughout the process, to ensure that the results of the project are relevant and accepted.
To gain a thorough understanding of Malawi’s specimen referral system and public health supply chain and include multiple perspectives, JSI carried out a series of activities, including a desk review, data collection from primary and secondary sources, interviews with a cross-section of stakeholders, and site visits to selected facilities. Findings from each of these activities were incorporated into the network optimization models.
Data Collection and Tools
Building detailed and robust network models and scenarios depends on good quality data inputs. The below list describes the various types of data requested to accurately describe the specimen referral network and supply chain systems, identify bottlenecks, and develop optimized transport network models for Nkhata Bay and Likoma Island districts within the context of the GOM’s health priorities.
Network and cost models used during the UAV feasibility study
Strategy and planning documents
Current supply chain and transport system for samples and test results
Site characteristics (health facilities providing HIV testing and treatment services,
warehouses, labs, etc.)
Product characteristics (samples and test results as primary goods; “other routine and
emergency cargo” to potentially be transported in the future)
Existing information system (LMIS)
MOH health system assets and equipment
Human Resources
Operations
© John Snow, Inc. | Use of disclosure of data contained on this sheet is subject to the restriction on the title page of this document.
9
Regulations relevant for health system, transport system, aviation system, etc.
These data were collected through a combination of interview-style meetings with key informants and requests for electronic formats where quantitative data was available.
Data collection tools specific to specimen referral systems and supply chains were customized to Malawi’s context and the objective of this work. Primary data collection tools applied in this project can be found in the Annex.
Interviews and Site Visits
The consultant team met with national stakeholders with involvement and/or interest in the specimen referral system, the public health supply chain, and transport systems. Key informant interviews were conducted with the MOH Health Technical Services and Support (HTSS), Diagnostics Directorate; Expanded Program on Immunization (EPI), HIV/AIDS, and TB program units; the Malawi Blood Transfusion Services (MBTS); the Central Medical Store Trust (CMST); funding partners; and implementing partners.
Site visits complemented national stakeholder interviews and aimed to accomplish two objectives: (1) validate existing information collected from other sources, and (2) collect new information directly from the primary sources. Our intention was to visit a selection of sites that represent the different types, sizes, and geographic conditions of facilities in Nkhata Bay. Ideally the visit schedule would have also included either facility in Likoma Island district; however, transportation schedules, time, and cost limited the consultant team’s ability to do so. As the optimized network models may incorporate a new transport mode, site selection was more heavily weighted toward facilities which would more likely use this new mode of transport: harder-to-reach facilities.
The following facilities were visited during the period of February 5-9, 2018:
Mzuzu Central Hospital Laboratory
Nkhata Bay DHO, District Hospital Laboratory, Pharmacy
Likoma Island DHO (interviewed at Nkhata Bay DHO)
Chitheka Health Center
Kavuzi Clinic
Ruarwe Health Center
Khondowe Health Center
Usisya Health Center
Chintheche Rural Hospital
A detailed list of key informants can be found in the Annex.
Analyses
A situational analysis of the current status of the specimen referral network in Nkhata Bay and Likoma Island districts was conducted using the data collected with the tools and interviews
© John Snow, Inc. | Use of disclosure of data contained on this sheet is subject to the restriction on the title page of this document.
10
noted. Data was collected and analyzed on specimen volumes and referral linkages, and examined the existing infrastructure supporting the logistics and transportation network.
The analysis also examined the specimen referral system for key bottlenecks across the people, processes, technologies, and policies with which the system operates. Note that not all bottlenecks identified will be addressed under the scope of this project. This cross-functional analysis includes the areas of policies, financing/ donor coordination, performance management, monitoring and evaluation, data collection/ connectivity, transportation, human resources/ staffing, biosafety and biosecurity (including equipment and packaging), and network design (including scheduling and routing), as applicable at each level or node of the network.
Understanding the desire for flexibility and efficiency, data was also collected and analyzed on the supply chain and existing infrastructure including vehicle assets, road networks, seasonal weather conditions, and operations costs, as well as relevant parallel supply chains operating in Malawi.
Lastly, data and information collected from each of these activities were combined with UAV-specific data generated by a UAV screening tool which was developed by the authors of the white paper, “What should you deliver by unmanned aerial systems?” Network analysis was performed using Llamasoft’s Supply Chain Guru software. Supply Chain Guru’s network optimization tool seeks to identify network designs that meet stakeholders’ service level and cost objectives within defined resource constraints or parameters—including health system requirements and characteristics of products, facilities, transport modes, as well as operational data such as operating hours and time spent at facilities/stops. Various network scenarios were defined based on the current specimen referral system, and then modified by incorporating different combinations of vehicle types and delivery frequencies. Outputs of the analysis include suggested route combinations according to transport mode and product (where applicable), the number of stops per route, capacity and time utilization of vehicles, and estimated costs.
LIMITATIONS & ASSUMPTIONS
1. A redesigned transport network can help to improve transport lead times and commodity availability at lower levels. However, bottlenecks that result from facility-level collection/ handling, gathering specimens or results at hubs outside of testing facilities, forecasting and ordering, central level stock availability, or laboratory processing time will not be alleviated by an improved transport system. As part of the situational analysis, each segment of the specimen referral system, including results return, was mapped to confirm the extent or size of existing transport-related bottlenecks that can be addressed with a new network design.
2. Network optimization relies heavily on large amounts of accurate data. The consultant team collected many of the data sets required. For data that was not available, reasonable assumptions were used and documented in the analysis sections.
© John Snow, Inc. | Use of disclosure of data contained on this sheet is subject to the restriction on the title page of this document.
11
3. This study does not include an evaluation of types of UAVs available or make any specific recommendation on the make(s) of UAV to be used. It does, however, identify the requirements of the logistics system to meet the health system needs, which will influence the type of UAV that can be used. UAV types that meet the health system requirements are included in the modeling exercise. For example, bi-directional transport requirements, e.g., sending samples from facilities and sending results from labs or products to facilities, require UAVs with landing capabilities. Flight ranges, cargo payloads, and infrastructure requirements of existing models are estimated based on published data for analysis purposes. Similarly, UAV cost estimates are indicative for the type of drone referenced.
4. Proposed optimization designs which include UAVs assume one base of operations in Nkhata Bay, located at the DHO. An assessment of infrastructure and resources would need to be carried out at other sites to assess feasibility of establishing multiple bases or hubs.
5. Other commodities to be included in the transport optimization models were agreed during the consultants’ country visit. Items include vaccines, safe blood for transfusions (routine only), physical monthly report forms from health facilities, and “other emergency products” including long tail items (defined as high value, low volume, highly variable demand, and not stocked at health facilities). A list of the specific products incorporated into the models and their estimated annual demand is included in the Network Optimization Analysis section.
6. Integrated transport of the various cargo types included in this analysis could be coordinated at the Nkhata Bay DHO, and would be supported by the various health programs. Currently, transport of various commodity types, specimens/ results, etc., is not integrated on one vehicle and doing so would require significant coordination. Additionally, any specific policies regarding segregation of commodities, either by use of specific cargo boxes or disinfection of shared cargo boxes would be determined in the future.
7. The pilot design and monitoring framework (implementation plan) is limited to the districts of Nkhata Bay and Likoma Island and any directly associated resupply points or testing laboratories.
8. The optimized transport scenarios did not propose adding any products to the current motorcycle courier system. If possible, integrating some or all of the proposed products into Riders’ current schedule for specimens and results could create opportunities for efficiencies and cost-savings. Further, the current motorcycle routes were not analyzed, as it is the team’s understanding that this exercise will soon be commenced by a separate project.
© John Snow, Inc. | Use of disclosure of data contained on this sheet is subject to the restriction on the title page of this document.
12
SPECIMEN REFERRAL NETWORK AND PUBLIC HEALTH
SUPPLY CHAIN
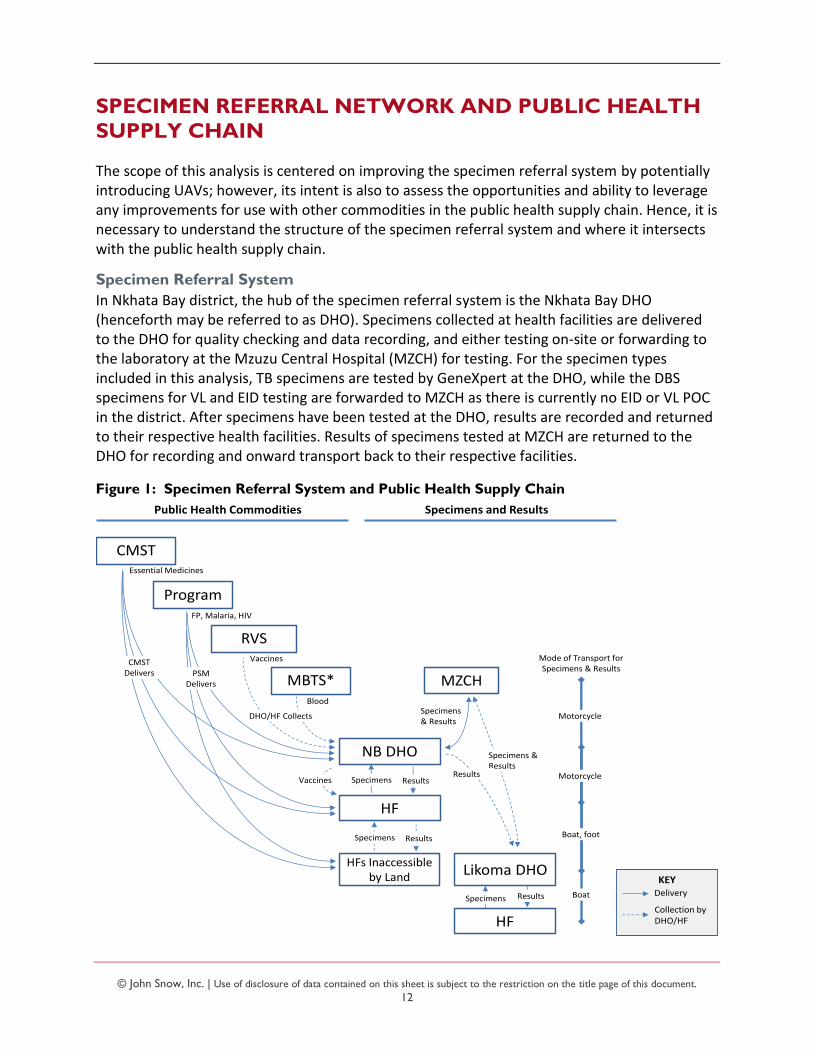
The scope of this analysis is centered on improving the specimen referral system by potentially introducing UAVs; however, its intent is also to assess the opportunities and ability to leverage any improvements for use with other commodities in the public health supply chain. Hence, it is necessary to understand the structure of the specimen referral system and where it intersects with the public health supply chain.
Specimen Referral System
In Nkhata Bay district, the hub of the specimen referral system is the Nkhata Bay DHO (henceforth may be referred to as DHO). Specimens collected at health facilities are delivered to the DHO for quality checking and data recording, and either testing on-site or forwarding to the laboratory at the Mzuzu Central Hospital (MZCH) for testing. For the specimen types included in this analysis, TB specimens are tested by GeneXpert at the DHO, while the DBS specimens for VL and EID testing are forwarded to MZCH as there is currently no EID or VL POC in the district. After specimens have been tested at the DHO, results are recorded and returned to their respective health facilities. Results of specimens tested at MZCH are returned to the DHO for recording and onward transport back to their respective facilities.
Figure 1: Specimen Referral System and Public Health Supply Chain
Program
NB DHO
HF
MZCH
RVS
MBTS*
Specimens & Results
Blood
Vaccines
FP, Malaria, HIV
Specimens Results
Specimens Results
Motorcycle
Motorcycle
PSM Delivers
DHO/HF Collects
Specimens and ResultsPublic Health Commodities
Likoma DHO
Specimens & Results
Results
Mode of Transport for Specimens & Results
HFs Inaccessible by Land
CMSTEssential Medicines
CMST Delivers
Vaccines
HF
Specimens Results Boat
Boat, foot
KEYDelivery
Collection by DHO/HF
© John Snow, Inc. | Use of disclosure of data contained on this sheet is subject to the restriction on the title page of this document.
13
On the mainland, a motorcycle courier service operated by Riders for Health (Riders) is used as the “last mile” transport service provider to reach facilities that are accessible by road. Six scheduled routes ensure that specimens are collected and results returned twice per week for all 18 facilities, except Kabuwa facility which is visited only once per week due to low volumes. All of the motorcycle courier routes are designed to be completed within one working day, so that all specimens and results collected by Riders are delivered to their destinations on the same day. Riders’ motorcycle couriers are also used to transport specimens and results between the DHO and MZCH once per week.
Mainland facilities that are only accessible by boat or foot—Ruarwe and Khondowe—use the Usisya health facility as a collection point or hub to connect with Riders’ courier. While these two facilities are not served directly by Riders, they are able to access the courier service at Usisya by either walking several hours or using the local ferry service.
The Likoma Island DHO generally hand carries specimens from their two health facilities to the mainland by boat and arrange for land transport to MZCH for testing, sometimes with the assistance of the DHO. Because the trip is long and costly, delivery and collection are less frequent, with estimates of about once per month. Test results are either collected when the specimens are dropped off at MZCH, or else results can be sent to the Nkhata Bay DHO with those for Nkhata Bay. The Nkhata Bay DHO will then inform the Likoma DHO that test results are ready and they will either hold for collection or make arrangements to send to the island as and when possible.
Public Health Supply Chain
The primary source of supply of essential medicines and medical supplies in the public health supply chain is the Central Medical Stores Trust (CMST). It directly supplies and delivers to all health facilities, including DHOs and hospitals, on a quarterly basis from its regional warehouse in Mzuzu. Commodities are ordered by requisition from the facility, however, quantities are often limited by availability of funds at the district/ facility level, or availability of commodities at CMST. At the time of this study, the most recent quarterly distribution had not been performed due to insufficient stock at CMST.
Donor-funded commodities for Family Planning (FP), Malaria, and HIV programs are managed and supplied through a parallel channel. These products are delivered directly to all facilities on a monthly basis.
The inventory of vaccines and vaccination supplies, e.g., syringes, etc., for Nkhata Bay and Likoma Island are managed at the Regional Vaccine Store (RVS) in Mzuzu. Quantities for each facility are determined by the district’s EPI program and are collected by the DHO from the RVS on a monthly basis. Districts are meant to carry out onward distribution to health facilities; however, in practice, due to shortages of funds for fuel at the district, most health facilities come to the district to collect their monthly allocation. Most of the facilities visited noted challenges with cold chain storage for vaccines, often due to unreliable electricity or maintenance of equipment. In part due to this, vaccination clinics are often planned around the date that vaccines arrive at the health facility to avoid long storage periods.
© John Snow, Inc. | Use of disclosure of data contained on this sheet is subject to the restriction on the title page of this document.
14
The regional blood store of Malawi Blood Transfusion Service (MBTS) is also located in Mzuzu. Blood is supplied to the DHO on a weekly basis, which in turn supplies Chinteche, the rural hospital in the district. Blood is not provided to the primary health facilities as they have neither the trained staff nor equipment to provide relevant services/ procedures.
Turnaround Time for Specimens and Test Results
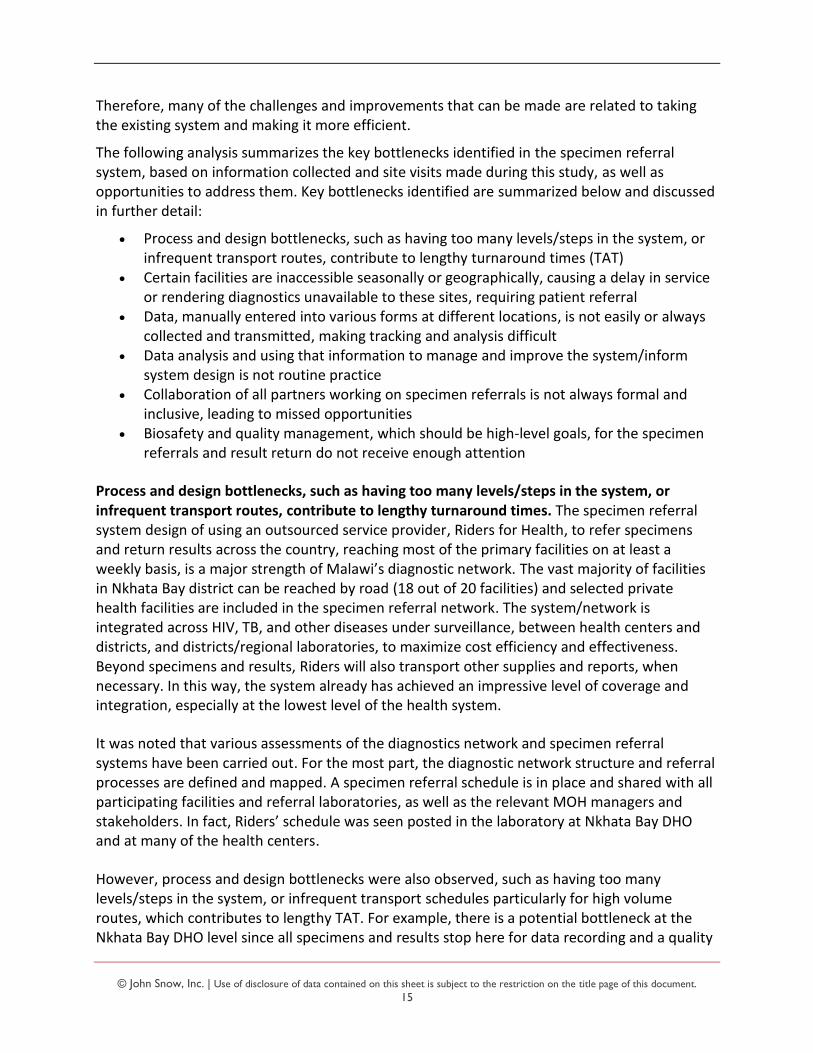
While turnaround times (TATs) for EID and VL test results are noted to be lengthy, they are primarily driven by system design and process elements rather than transportation itself. As mentioned earlier, specimens and results are currently collected and delivered once-to-twice per week for all facilities, meaning that depending on the date a specimen is taken from a patient, it may be held for 1-7 days before delivery to the DHO. Specimens and results are also collected and delivered between the DHO and MZCH once per week, meaning that depending on the day which the specimens arrive at the DHO, they may be held 1-6 days before they are sent to the lab at MZCH. Considering that specimens must be recorded and quality checked at the DHO, this holding time may increase when workload is high or there are limited resources to perform these tasks. A similar flow and holding periods are seen for the return of results as they make their way back to the health facilities.
Figure 2: Specimen Referral Process and Illustrative Turnaround Time for Nkhata Bay
For facilities that are not accessible by land, TATs are generally longer given that there is an additional leg to these routes and/or collection/ delivery for the health facility is not according to a fixed schedule. Informants noted that the TAT for Likoma Islands is so long that patients often prefer to travel to the mainland for tests that are urgent.
These system design and process elements of turnaround time are all in addition to the time needed for testing of specimens at the laboratory.
BOTTLENECK ANALYSIS
A strong specimen referral system begins with a robust system design and efficient operational processes to refer specimens to testing laboratories and relay results back in a timely manner to enable clinicians to make informed decisions about their patients’ management. Timeliness, quality/ safety, cost-efficiency and providing access to diagnostics at facilities without laboratories are all important goals of a specimen referral system. Malawi’s specimen referral system demonstrates strengths in some areas that support achieving these goals—it has already been setup nationally, has funding, is well-staffed, is integrated at lower levels with multiple disease types (not vertically designed), and is run by an outsourced service provider.
c
Specimen
collection*
Collection
from HC
1 day* or more
Deliver
to DHO
Same day 1-6 days or more
Pick up
from DHO
Same day 14 days or more
Deliver
to DHO
Deliver
to Mzuzu
Lab
Results
pick up
from
Mzuzu Lab
Same day
Deliver
to HC*
Collection
from
DHO
Same day1-6 days or more
c
© John Snow, Inc. | Use of disclosure of data contained on this sheet is subject to the restriction on the title page of this document.
15
Therefore, many of the challenges and improvements that can be made are related to taking the existing system and making it more efficient.
The following analysis summarizes the key bottlenecks identified in the specimen referral system, based on information collected and site visits made during this study, as well as opportunities to address them. Key bottlenecks identified are summarized below and discussed in further detail:
Process and design bottlenecks, such as having too many levels/steps in the system, or infrequent transport routes, contribute to lengthy turnaround times (TAT)
Certain facilities are inaccessible seasonally or geographically, causing a delay in service or rendering diagnostics unavailable to these sites, requiring patient referral
Data, manually entered into various forms at different locations, is not easily or always collected and transmitted, making tracking and analysis difficult
Data analysis and using that information to manage and improve the system/inform system design is not routine practice
Collaboration of all partners working on specimen referrals is not always formal and inclusive, leading to missed opportunities
Biosafety and quality management, which should be high-level goals, for the specimen referrals and result return do not receive enough attention
Process and design bottlenecks, such as having too many levels/steps in the system, or infrequent transport routes, contribute to lengthy turnaround times. The specimen referral system design of using an outsourced service provider, Riders for Health, to refer specimens and return results across the country, reaching most of the primary facilities on at least a weekly basis, is a major strength of Malawi’s diagnostic network. The vast majority of facilities in Nkhata Bay district can be reached by road (18 out of 20 facilities) and selected private health facilities are included in the specimen referral network. The system/network is integrated across HIV, TB, and other diseases under surveillance, between health centers and districts, and districts/regional laboratories, to maximize cost efficiency and effectiveness. Beyond specimens and results, Riders will also transport other supplies and reports, when necessary. In this way, the system already has achieved an impressive level of coverage and integration, especially at the lowest level of the health system.
It was noted that various assessments of the diagnostics network and specimen referral systems have been carried out. For the most part, the diagnostic network structure and referral processes are defined and mapped. A specimen referral schedule is in place and shared with all participating facilities and referral laboratories, as well as the relevant MOH managers and stakeholders. In fact, Riders’ schedule was seen posted in the laboratory at Nkhata Bay DHO and at many of the health centers.
However, process and design bottlenecks were also observed, such as having too many levels/steps in the system, or infrequent transport schedules particularly for high volume routes, which contributes to lengthy TAT. For example, there is a potential bottleneck at the Nkhata Bay DHO level since all specimens and results stop here for data recording and a quality
© John Snow, Inc. | Use of disclosure of data contained on this sheet is subject to the restriction on the title page of this document.
16
check (for the specimens) between the primary facility and referral to Mzuzu Central Hospital (MZCH), and then there is only weekly transport scheduled from the DHO to MZCH. There is also another facility, Usisya Health Center, which acts as a hub for two road-inaccessible health centers, Ruarwe and Khondowe. Another example is that test results are all currently transmitted by paper and brought back to the facilities by the same method that is used to transport specimens. All of the points in the turnaround from specimen to result can add up and can cause delays. It is worthwhile to point out, however, that transportation itself was not identified as a major bottleneck in the system as Riders provides twice-weekly pickups to nearly all health facilities, and all specimens and test results that are picked up are delivered to their destinations on the same day.
Based on the observations and interviews, there are various processes around specimen referrals that could be optimized to reduce TAT in a very low-cost way, e.g., prioritizing certain results and communicating them in an expedited way, such as via phone to the requesting clinician by revamping Results160, including migration to RapidPro, which would also include specimen tracking. Alternatively, since there is already a system used by the TB program on the GeneXpert analyzers, GxAlert (a product of the company SystemOne) could be extended to HIV to send out results via SMS. There is also the opportunity to collect and transport blood for chemistry and hematology testing at the DHO level as currently the patient is being referred—the system could be redesigned such that these specimens are taken along with the DBS and sputum specimens. Finally, although much of the structure and processes are defined and mapped, the country can continually review and adapt the specimen referral network design to meet the needs of the changing diagnostics network, including with the introduction of POC and near-POC testing.
Certain facilities are inaccessible seasonally or geographically, causing a delay in service or rendering diagnostics unavailable to these sites, requiring patient referral. Although the majority of the facilities in Nkhata Bay can be reached by road reliably, as mentioned previously, there are challenges with year-round accessibility at certain primary facilities, which affects TAT. For example, both of the facilities in Likoma Island District (St. Mary’s on Chizumulu and St. Peters on Likoma), as well as two of the facilities in Nkhata Bay District (Khondowe and Ruarwe), cannot be reached by road; therefore, specimens and results from these four sites currently rely on the ferry--which only travels once or twice per week on an erratic schedule with frequent breakdowns—or on health facility personnel to travel on foot where possible. Rainy season also poses a challenge to reliably reach at least three other health centers in Nkhata Bay District (Usisya, Tchesamu, Chitheka, and Nthungwa). These hard-to-reach facilities would potentially benefit from the use of UAVs as an additional mode of transport.
Data, manually entered into various forms at different locations, is not easily or always collected and transmitted, making tracking and analysis difficult. Riders collects a significant amount of data on specimen/result quantities and TATs and a portion of this data is highlighted on the EID dashboard, as well as on the paper results—dates up to the point the result is issued from the laboratory are listed on the VL and EID results. However, there is not an easy way to collect and transmit data—for Riders and other stakeholders—which, in turn, causes another
© John Snow, Inc. | Use of disclosure of data contained on this sheet is subject to the restriction on the title page of this document.
17
bottleneck in analyzing data for management and performance improvement. Specimen referral data, such as unique identification/ tracking numbers, dates of specimen collection, transport, testing, and results, is not always readily available and reported consistently in a complete, timely, and accurate manner. For example, tracking an individual specimen through the return of the result to the clinician or patient is not easy, and even less so in real-time. Much of the data collection and tracking systems are manual, which are time-consuming and prone to human error. Transmission of data is also difficult as not all facilities are connected by cellular networks (four out of the six primary facilities visited did not have network coverage).
There are many opportunities to improve the availability of data. For one, specimen tracking and data collection could be improved by introducing an electronic system for Riders’ data collection which is used in other countries. This would make the data electronically available potentially in real-time, or at least sooner than the current summary reports that are prepared once a month after month-end. Also, the excellent EID dashboard could be extended to all diagnostics and other diseases. If the country wanted to take an even more sophisticated route to tracking specimens, at least for EID/VL, barcoding could be considered. Introducing and sustaining barcoding has been seen to be a great challenge in many countries, but as Lasec is reportedly providing the requisition forms along with the DBS kit, there is an opportunity to request them to barcode the DBS cards and requisition forms before they reach Malawi, which would help with sustainability of printing the labels in-country.
Data analysis and use of that information to improve system performance is not routine practice. Firstly, the specimen referral system lacks a comprehensive monitoring and evaluation (M&E) framework. This should include well-defined key performance indicators (KPIs) for system performance, service provider performance, cost efficiency/resource management, transportation, and transit conditions/temperature control. This M&E framework should be part of a general specimen referral strategy (or guidelines), which is not yet available at the national level to provide a long-term vision of specimen referral design, oversight, and performance and guide strengthening initiatives. There are, however, specific programmatic policies, such as for EID and VL, that do exist and include laboratory and specimen referral components. One analysis that would be helpful would be a more comprehensive TAT process analysis, which should capture the date when the patient actually receives the result and when a treatment/ management decision is made based on the result, if applicable. This type of analysis could guide other process improvements if enough was detail provided. Another analysis that could be helpful is to first develop cost efficiency indicators (e.g., cost per specimen referred/result returned) and then use for comparison and optimization purposes.
Biosafety and quality management for specimen referral and results return do not receive enough attention. A robust specimen referral system promotes biosafety and quality for the specimens, individuals, and public. There is a challenge around both availability and use of proper packaging to ensure quality and biosafety, as well as standard operating procedures being available, trained on, and actioned. For DBS specimens, the DBS kit provider (Lasec) includes all consumables and forms needed in one bundle, which is ideal. However, for TB, collection and packaging materials are not consistently available and therefore not used for every specimen referral shipment, especially from the health centers. Standard Operating

© John Snow, Inc. | Use of disclosure of data contained on this sheet is subject to the restriction on the title page of this document.
18
Procedures (SOPs) for specimen packaging and handling were not available at the facilities visited. Biosafety and quality control of the specimen referral system do not appear to be explicitly monitored by the laboratory quality department/team. Nonetheless, rejection of specimens does not seem to be a current problem, in part due to additional training that has been provided along the way, such as for DBS collection.
Collaboration of all partners working on specimen referrals is not always formal and inclusive, leading to missed opportunities. There is a clear directorate and individual in charge of specimen referrals at the MOH, which is commendable. However, there does not appear to be strong collaboration of all partners working on specimen referrals. It is ideal to have a well-defined and transparent working group (perhaps as a part of the laboratory or a logistics technical working group) to support coordinated efforts to improve specimen referrals and respond effectively to challenges. This group can, for example, define and manage a current list of officially recognized specimen referral equipment, such as personal protective equipment (PPE), cooler boxes, ice packs, temperature monitoring devices, packaging etc., and actively drive procurement. The group should be fully inclusive to MOH directorates, various disease programs, laboratory partners, service providers, etc.
Although there is funding available and used to cover specimen referrals for the majority of the country at least weekly, the overall budget for all specimen referral strengthening activities (e.g., human resources, capacity building, information systems, etc.) may not adequately cover every need. The opportunities for pooling separate funding sources or sharing service providers should be discussed in this group. For example, the current system for higher-level referrals within the National TB Program, which has separate funds for certain transportation routes/service providers/specimens, is not closely coordinated with the Riders’ system. There is a potential to create linkages between Riders and long-haul transporters (e.g., AXA) for higher level TB-related referrals. Multiple donors/partners could benefit from an integrated and multi-purposes transport system – and theoretically could fund the system in a pooled manner.
Summary of Opportunities
Based on this analysis, and as described in each individual bottleneck, there are opportunities to strengthen specimen referrals and results return such that the goals of timeliness, quality/safety, cost-efficiency and providing access to diagnostics at facilities without laboratories are improved upon. These opportunities are summarized below. Note that some opportunities are outside the scope of this transport and network optimization.
Certain non-transport process and design bottlenecks can be improved in a low-cost way to improve turnaround time, including prioritizing certain results and communicating them in an expedited way, such as via phone to the requesting clinician or by setting up GxAlert to extend to HIV to send out results via SMS, or expanding collection with Riders to other tests, such as chemistry and hematology.
Data availability can be improved by making data entry faster, easier and electronic. Examples could include introduction of an electronic system for Riders’ data collection, expanding the well-designed EID dashboard to all diagnostics and diseases, and

© John Snow, Inc. | Use of disclosure of data contained on this sheet is subject to the restriction on the title page of this document.
19
potentially engaging Lasec to help print and affix barcodes to DBS cards and requisition forms before entering Malawi.
Data analysis could be planned for and used to improve the system and inform system design. There is an opportunity to create a comprehensive M&E framework for all specimen referrals, including well defined KPIs, which could be a part of a national strategy/guideline on all specimen referrals, not specific to disease program. Also, at a more operational level, two analyses that would be beneficial are a more comprehensive TAT process analysis and another on cost-efficiency, based on indicators that would need to be discussed and developed.
Biosafety and quality management around specimen referrals and results return should be closely monitored by the MOH and/or a national referral laboratory. Provide standard packaging materials and ensure SOPs are present in all facilities.
Stakeholder collaboration should be formalized into a technical working group on specimen referral/results return and all-inclusive of partners, led by the MOH. This group should meet regularly and share information/discuss financing/budget, potential efficiencies, strategies, M&E, etc.
Although the above opportunities for improvement are not addressed within the scope of this project, most are relatively low-cost actions that could be implemented by the MOH-HTSS Diagnostics Directorate and its stakeholders. The current staffing and human resources in the specimen referral system is a good basis for implementing these opportunities. There is an individual within the MOH who has oversight and advocates for the system, and the MOH is actively involved in managing the performance of Riders despite the funding and project management coming from elsewhere. There also appears to be an adequate number of qualified personnel operating and managing specimen referral functions, mainly through Riders. Staff with specimen referral responsibilities receive training and SOPs designed to build knowledge, skills, and abilities and include biosafety/ quality training. The only challenge noted was examples of where referring facility staff did not always follow up on delayed results, which may be related to a communication process or could be a human resource issue.
The areas that will be addressed by this project are (1) network and process design bottlenecks in the area of transportation and (2) improving access to difficult-to-reach facilities. With the potential to use UAVs, as well as the transport network analysis, there is the ability to improve the specimen referral and results return process and system design.
NETWORK OPTIMIZATION ANALYSIS
The transportation network optimization analysis had two main objectives. The first was to improve TAT from specimen pickup to return of results. However, as noted earlier, transportation itself for specimens and results was found to be a small component of the overall TAT. Other network elements that affect TAT include transport capacity and frequency of transport. It was determined that capacity is not a constraint in the current transport system,
© John Snow, Inc. | Use of disclosure of data contained on this sheet is subject to the restriction on the title page of this document.
20
therefore the analysis included a scenario to evaluate adjusting the frequency of transporting specimens and results within the existing system.
The second objective was to evaluate the implications (including, but not limited to, cost) and effectiveness of incorporating UAVs into the existing specimen transportation system, as well as assess the potential to leverage such a system to transport other health products such as vaccines, safe blood for transfusions, or other “emergency” items. The use of UAVs to transport different product groups will be referred to as “use cases.” Two scenarios were created to evaluate different combinations of UAV use within the existing network and for different use cases.
Data Inputs
Facilities
GPS coordinates of all health facilities in the network, including the Nkhata Bay and Likoma DHOs and MZCH, were the basis of the models. The majority of these were provided by Riders and validated by publicly accessible sources and recently published surveys. The DHOs identified which of the facilities were not accessible by road, or were difficult to reach or inaccessible during certain seasons.
Transport Assets, Delivery Schedule, Costs
Data on the current specimen referral transport system was primarily provided by Riders for Health. This included types of vehicles used, their capacity and costs, driver information, the schedule of deliveries/pickups, and general road conditions. Information on transport activities, modes, and costs for facilities not served directly by Riders for Health were provided by the facilities or by the DHO.
Products and Demand
Historical data on quantities of dried blood spots (DBS) and TB specimens picked up, processed, and results returned were provided by Riders for Health and CHAI. Contextual information was provided by the DHO, reference laboratories, health facilities, and program representatives.
Quantities of VL, EID, and TB specimens and test results appear to be highly seasonal. Given that only 16 months of historical data were available, and the low season appeared to shift, April was assumed to be the low volume/ demand month, and May the peak volume/ demand month. While informants could not identify the reasons for the very low quantities in Oct-Nov 2017 as compared to the previous year, it was suggested that rain and difficult travel conditions likely contribute to patients’ inability to access health services and therefore result in depressed specimen volumes.
Changes/ expansion to point of care (POC) equipment were also provided by CHAI and during conversations with the DHO and program representatives. While TATs would be improved by introduction of POC devices, the potential future POC linkages did not materially change the network analysis so only the current diagnostics network structure was considered.
© John Snow, Inc. | Use of disclosure of data contained on this sheet is subject to the restriction on the title page of this document.
21
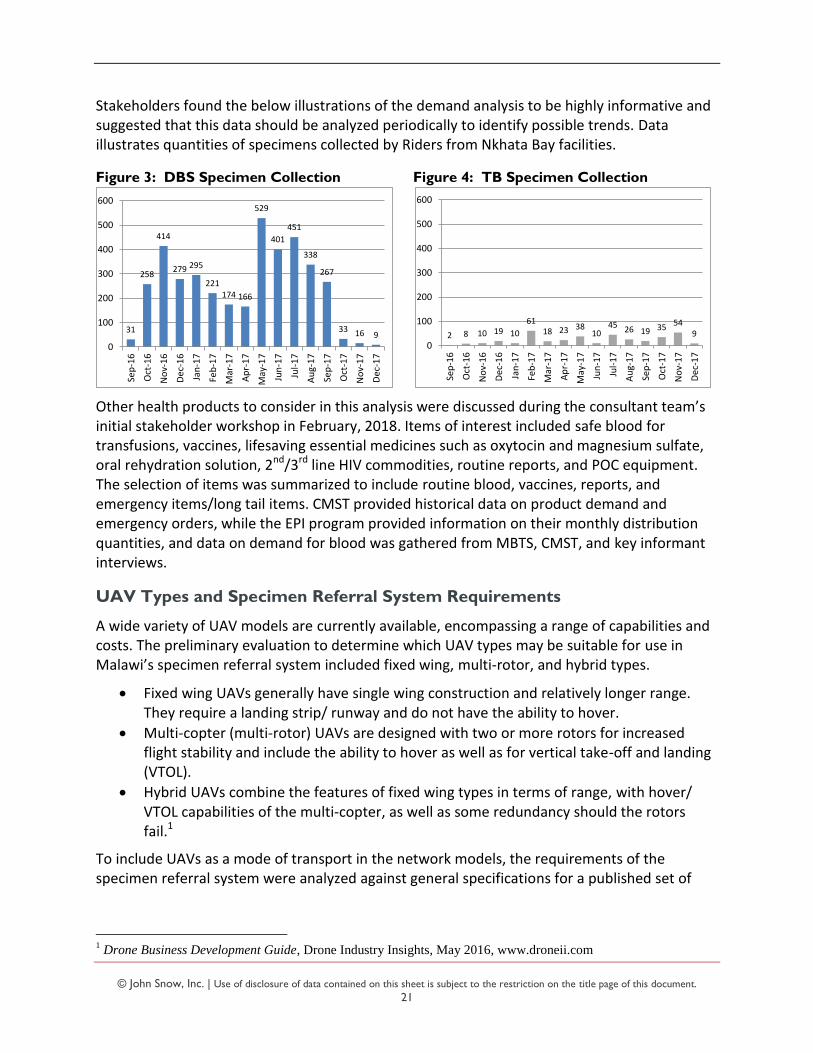
Stakeholders found the below illustrations of the demand analysis to be highly informative and suggested that this data should be analyzed periodically to identify possible trends. Data illustrates quantities of specimens collected by Riders from Nkhata Bay facilities.
Figure 3: DBS Specimen Collection Figure 4: TB Specimen Collection
Other health products to consider in this analysis were discussed during the consultant team’s initial stakeholder workshop in February, 2018. Items of interest included safe blood for transfusions, vaccines, lifesaving essential medicines such as oxytocin and magnesium sulfate, oral rehydration solution, 2nd/3rd line HIV commodities, routine reports, and POC equipment. The selection of items was summarized to include routine blood, vaccines, reports, and emergency items/long tail items. CMST provided historical data on product demand and emergency orders, while the EPI program provided information on their monthly distribution quantities, and data on demand for blood was gathered from MBTS, CMST, and key informant interviews.
UAV Types and Specimen Referral System Requirements
A wide variety of UAV models are currently available, encompassing a range of capabilities and costs. The preliminary evaluation to determine which UAV types may be suitable for use in Malawi’s specimen referral system included fixed wing, multi-rotor, and hybrid types.
Fixed wing UAVs generally have single wing construction and relatively longer range. They require a landing strip/ runway and do not have the ability to hover.
Multi-copter (multi-rotor) UAVs are designed with two or more rotors for increased flight stability and include the ability to hover as well as for vertical take-off and landing (VTOL).
Hybrid UAVs combine the features of fixed wing types in terms of range, with hover/ VTOL capabilities of the multi-copter, as well as some redundancy should the rotors fail.1
To include UAVs as a mode of transport in the network models, the requirements of the specimen referral system were analyzed against general specifications for a published set of
1 Drone Business Development Guide, Drone Industry Insights, May 2016, www.droneii.com
31
258
414
279 295
221174 166
529
401
451
338
267
33 16 9
0
100
200
300
400
500
600
Sep
-16
Oct
-16
No
v-1
6
De
c-1
6
Jan
-17
Feb
-17
Mar
-17
Ap
r-1
7
May
-17
Jun
-17
Jul-
17
Au
g-1
7
Sep
-17
Oct
-17
No
v-1
7
De
c-1
7
2 8 10 19 10
6118 23 38
1045
26 19 3554
9
0
100
200
300
400
500
600
Sep
-16
Oct
-16
No
v-1
6
De
c-1
6
Jan
-17
Feb
-17
Mar
-17
Ap
r-1
7
May
-17
Jun
-17
Jul-
17
Au
g-1
7
Sep
-17
Oct
-17
No
v-1
7
De
c-1
7
© John Snow, Inc. | Use of disclosure of data contained on this sheet is subject to the restriction on the title page of this document.
22
UAV types.2 For the purposes of this comparison, the following analysis assumes one base of operations is located at the Nkhata Bay DHO.
Range and Capacity Requirements in Nkhata Bay and Likoma Island Districts
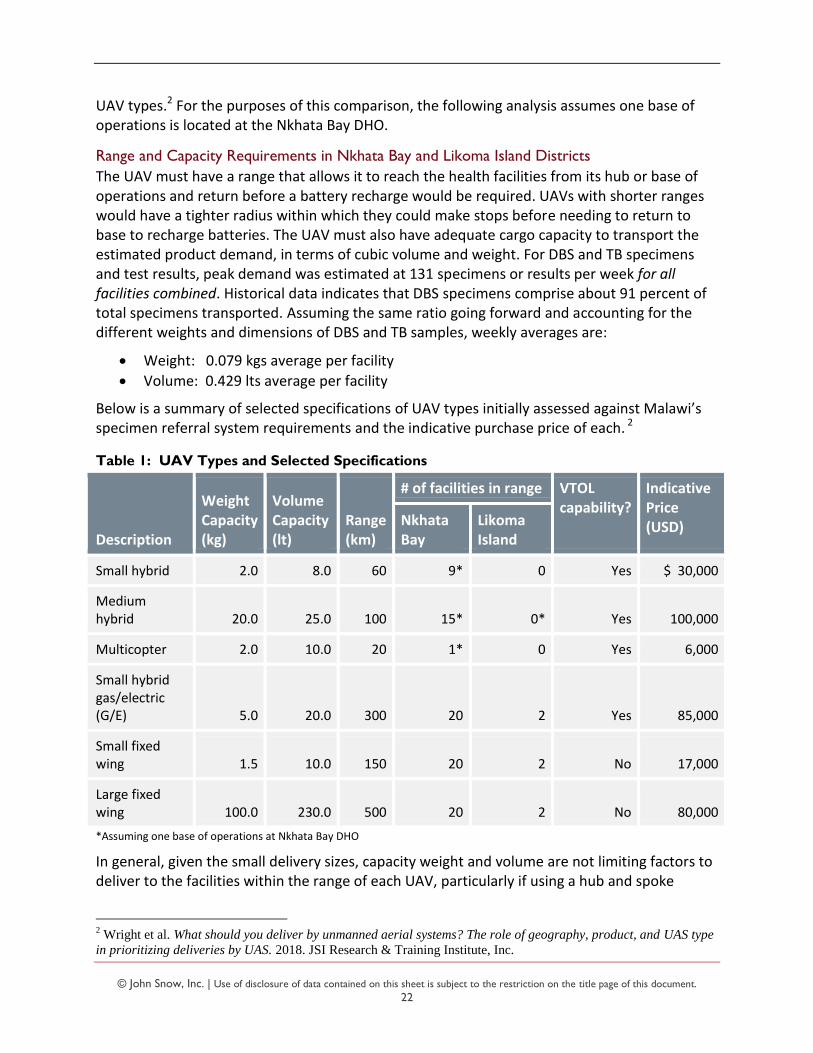
The UAV must have a range that allows it to reach the health facilities from its hub or base of operations and return before a battery recharge would be required. UAVs with shorter ranges would have a tighter radius within which they could make stops before needing to return to base to recharge batteries. The UAV must also have adequate cargo capacity to transport the estimated product demand, in terms of cubic volume and weight. For DBS and TB specimens and test results, peak demand was estimated at 131 specimens or results per week for all facilities combined. Historical data indicates that DBS specimens comprise about 91 percent of total specimens transported. Assuming the same ratio going forward and accounting for the different weights and dimensions of DBS and TB samples, weekly averages are:
Weight: 0.079 kgs average per facility
Volume: 0.429 lts average per facility
Below is a summary of selected specifications of UAV types initially assessed against Malawi’s specimen referral system requirements and the indicative purchase price of each. 2
Table 1: UAV Types and Selected Specifications
Description
Weight Capacity (kg)
Volume Capacity (lt)
Range (km)
# of facilities in range VTOL capability?
Indicative Price (USD) Nkhata
Bay Likoma Island
Small hybrid 2.0 8.0 60 9* 0 Yes $ 30,000
Medium hybrid 20.0 25.0 100 15* 0* Yes 100,000
Multicopter 2.0 10.0 20 1* 0 Yes 6,000
Small hybrid gas/electric (G/E) 5.0 20.0 300 20 2 Yes 85,000
Small fixed wing 1.5 10.0 150 20 2 No 17,000
Large fixed wing 100.0 230.0 500 20 2 No 80,000
*Assuming one base of operations at Nkhata Bay DHO
In general, given the small delivery sizes, capacity weight and volume are not limiting factors to deliver to the facilities within the range of each UAV, particularly if using a hub and spoke
2 Wright et al. What should you deliver by unmanned aerial systems? The role of geography, product, and UAS type
in prioritizing deliveries by UAS. 2018. JSI Research & Training Institute, Inc.
© John Snow, Inc. | Use of disclosure of data contained on this sheet is subject to the restriction on the title page of this document.
23
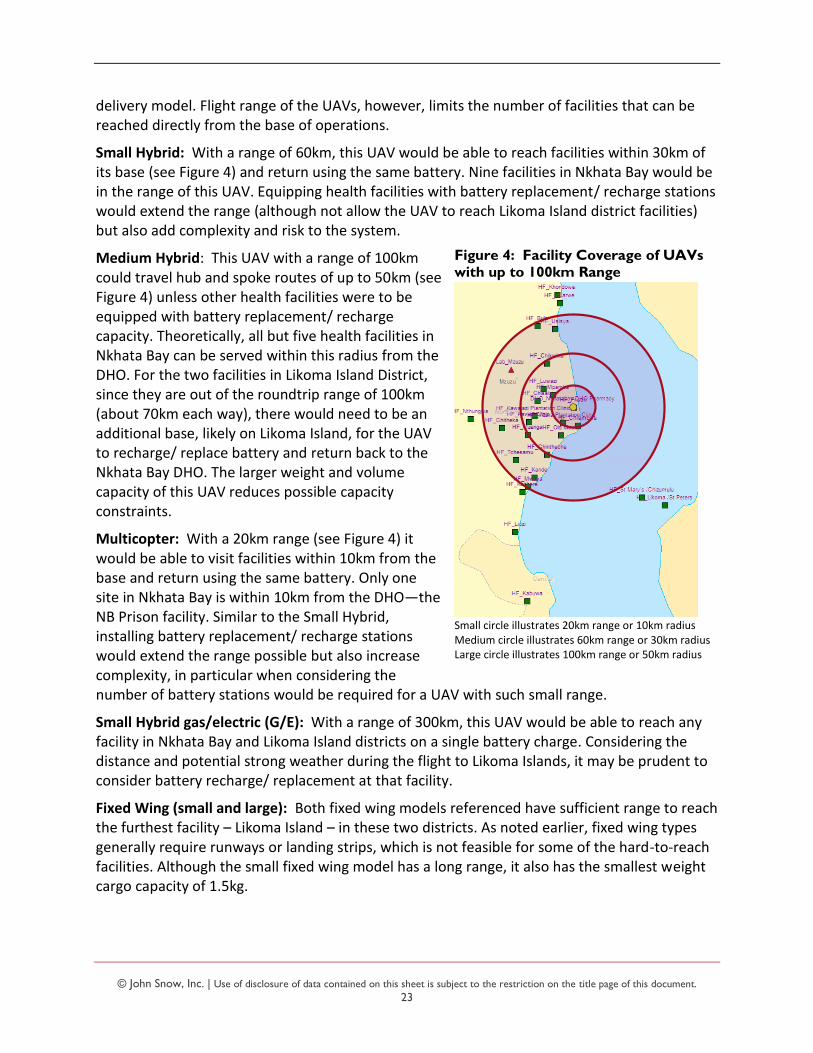
Figure 4: Facility Coverage of UAVs
with up to 100km Range
Small circle illustrates 20km range or 10km radius Medium circle illustrates 60km range or 30km radius Large circle illustrates 100km range or 50km radius
delivery model. Flight range of the UAVs, however, limits the number of facilities that can be reached directly from the base of operations.
Small Hybrid: With a range of 60km, this UAV would be able to reach facilities within 30km of its base (see Figure 4) and return using the same battery. Nine facilities in Nkhata Bay would be in the range of this UAV. Equipping health facilities with battery replacement/ recharge stations would extend the range (although not allow the UAV to reach Likoma Island district facilities) but also add complexity and risk to the system.
Medium Hybrid: This UAV with a range of 100km could travel hub and spoke routes of up to 50km (see Figure 4) unless other health facilities were to be equipped with battery replacement/ recharge capacity. Theoretically, all but five health facilities in Nkhata Bay can be served within this radius from the DHO. For the two facilities in Likoma Island District, since they are out of the roundtrip range of 100km (about 70km each way), there would need to be an additional base, likely on Likoma Island, for the UAV to recharge/ replace battery and return back to the Nkhata Bay DHO. The larger weight and volume capacity of this UAV reduces possible capacity constraints.
Multicopter: With a 20km range (see Figure 4) it would be able to visit facilities within 10km from the base and return using the same battery. Only one site in Nkhata Bay is within 10km from the DHO—the NB Prison facility. Similar to the Small Hybrid, installing battery replacement/ recharge stations would extend the range possible but also increase complexity, in particular when considering the number of battery stations would be required for a UAV with such small range.
Small Hybrid gas/electric (G/E): With a range of 300km, this UAV would be able to reach any facility in Nkhata Bay and Likoma Island districts on a single battery charge. Considering the distance and potential strong weather during the flight to Likoma Islands, it may be prudent to consider battery recharge/ replacement at that facility.
Fixed Wing (small and large): Both fixed wing models referenced have sufficient range to reach the furthest facility – Likoma Island – in these two districts. As noted earlier, fixed wing types generally require runways or landing strips, which is not feasible for some of the hard-to-reach facilities. Although the small fixed wing model has a long range, it also has the smallest weight cargo capacity of 1.5kg.

© John Snow, Inc. | Use of disclosure of data contained on this sheet is subject to the restriction on the title page of this document.
24
Bi-directional Transport Requirements
The specimen referral system currently requires that specimens are transported from the health facility to the DHO (and beyond), and then in reverse for results. The system therefore requires UAV equipment capable of landing and being unloaded/reloaded at all delivery locations. Additionally, while some hard-to-reach locations, such as Likoma Island, can accommodate runways, several others cannot. For example, Ruarwe and Khondowe facilities are each located in a small sandy cove at the foot of a mountainous area, with little land that may be suitable for a runway. The analysis also aimed to minimize the complexity and upfront investment that would be required by the use of multiple types of UAVs to reach different facilities. However, in the future, especially if the technology is scaled up in Malawi, it might be a consideration to have a mixed fleet of UAVs. Considering these requirements and aims, fixed-wing UAVs that airdrop cargo or require a runway to land at facilities for unloading/ reloading were excluded from the analysis, and four UAV types with vertical take-off and landing (VTOL) capability were selected for the modeling exercise.
The below chart summarizes selected performance metrics for the four VTOL UAV types if they were introduced into Malawi’s specimen referral system. The purpose of this comparison is to identify the maximum service level attained, or percentage of volume able to be delivered, for each UAV type against the minimum specimen referral system requirements. These results are based on deliveries twice per week to all facilities within the vehicle’s range, carrying peak volumes (see Data Inputs: Products and Demand). Additional details can be found in the Annex.
Table 2: UAV Types and Estimated Cost and Performance in Malawi’s Specimen Referral
System, considering Range and Cargo Capacity
Upfront Investment
Description Routes Stops Service Level
No. UAVs UAV
Ground Equip.
Annual Operations
Year 1 Total
Small hybrid 5 14 45% 1 $ 30,000 $ 30,000 $ 31,626 $ 91,626
Medium hybrid
3 16 80% 1 100,000 50,000 43,916 193,916
Multicopter 1 2 5% 1 6,000 30,000 30,076 66,076
Small hybrid (G/E)
3 22 100% 1 85,000 30,000 36,717 151,717
Optimal combinations of routes and stops are generated by the Supply Chain Guru software, considering the characteristics and constraints of the system as discussed thus far.
“Routes” indicates the number of completed trips—round trips in these examples—that the UAV will make to deliver the specified quantities to the facilities within its range. If the same route is driven/ flown twice during the period, it is counted as two routes.
“Stops” indicates the total number of facilities visited during all routes driven/ flown, including the hub or base. Additional details on routes and stops will be provided for each of the scenarios discussed later in this section.
© John Snow, Inc. | Use of disclosure of data contained on this sheet is subject to the restriction on the title page of this document.
25
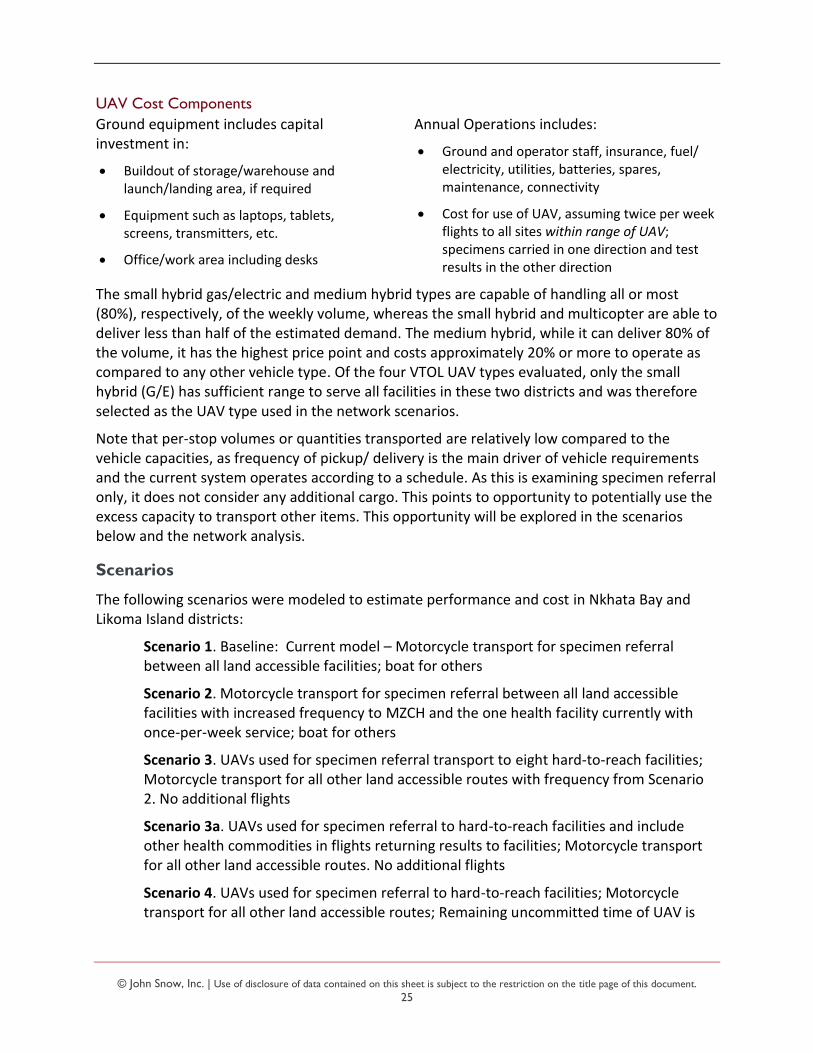
UAV Cost Components
Ground equipment includes capital investment in:
Buildout of storage/warehouse and launch/landing area, if required
Equipment such as laptops, tablets, screens, transmitters, etc.
Office/work area including desks
Annual Operations includes:
Ground and operator staff, insurance, fuel/ electricity, utilities, batteries, spares, maintenance, connectivity
Cost for use of UAV, assuming twice per week flights to all sites within range of UAV; specimens carried in one direction and test results in the other direction
The small hybrid gas/electric and medium hybrid types are capable of handling all or most (80%), respectively, of the weekly volume, whereas the small hybrid and multicopter are able to deliver less than half of the estimated demand. The medium hybrid, while it can deliver 80% of the volume, it has the highest price point and costs approximately 20% or more to operate as compared to any other vehicle type. Of the four VTOL UAV types evaluated, only the small hybrid (G/E) has sufficient range to serve all facilities in these two districts and was therefore selected as the UAV type used in the network scenarios.
Note that per-stop volumes or quantities transported are relatively low compared to the vehicle capacities, as frequency of pickup/ delivery is the main driver of vehicle requirements and the current system operates according to a schedule. As this is examining specimen referral only, it does not consider any additional cargo. This points to opportunity to potentially use the excess capacity to transport other items. This opportunity will be explored in the scenarios below and the network analysis.
Scenarios
The following scenarios were modeled to estimate performance and cost in Nkhata Bay and Likoma Island districts:
Scenario 1. Baseline: Current model – Motorcycle transport for specimen referral between all land accessible facilities; boat for others
Scenario 2. Motorcycle transport for specimen referral between all land accessible facilities with increased frequency to MZCH and the one health facility currently with once-per-week service; boat for others
Scenario 3. UAVs used for specimen referral transport to eight hard-to-reach facilities; Motorcycle transport for all other land accessible routes with frequency from Scenario 2. No additional flights
Scenario 3a. UAVs used for specimen referral to hard-to-reach facilities and include other health commodities in flights returning results to facilities; Motorcycle transport for all other land accessible routes. No additional flights
Scenario 4. UAVs used for specimen referral to hard-to-reach facilities; Motorcycle transport for all other land accessible routes; Remaining uncommitted time of UAV is
© John Snow, Inc. | Use of disclosure of data contained on this sheet is subject to the restriction on the title page of this document.
26
used to transport other health commodities on additional flights to any/all facilities in the districts
Each scenario is discussed in more detail below.
As noted in the previous section, the small hybrid (G/E) was selected as the UAV type used in the network scenarios given its sufficient range to serve all facilities in these two districts. The upfront investment required for any of the scenarios that include UAVs are those referenced in the previous section. Ongoing operating costs will vary according to the network and delivery parameters in each scenario.
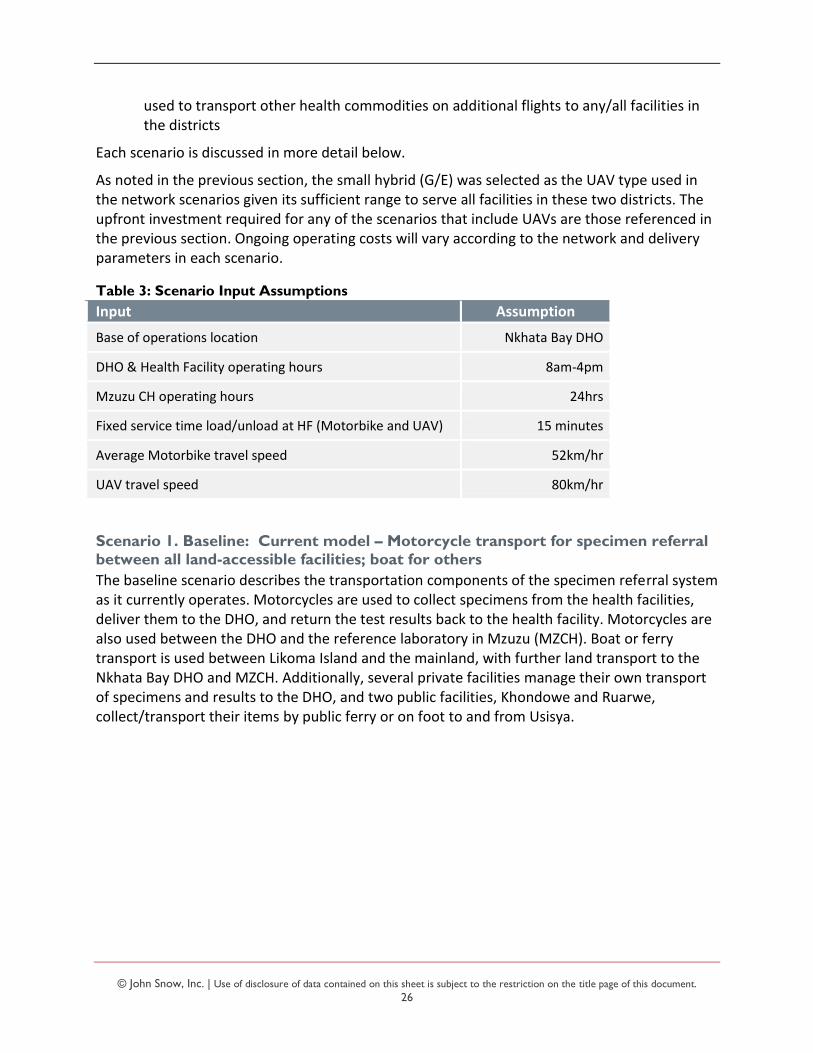
Table 3: Scenario Input Assumptions
Input Assumption
Base of operations location Nkhata Bay DHO
DHO & Health Facility operating hours 8am-4pm
Mzuzu CH operating hours 24hrs
Fixed service time load/unload at HF (Motorbike and UAV) 15 minutes
Average Motorbike travel speed 52km/hr
UAV travel speed 80km/hr
Scenario 1. Baseline: Current model – Motorcycle transport for specimen referral between all land-accessible facilities; boat for others
The baseline scenario describes the transportation components of the specimen referral system as it currently operates. Motorcycles are used to collect specimens from the health facilities, deliver them to the DHO, and return the test results back to the health facility. Motorcycles are also used between the DHO and the reference laboratory in Mzuzu (MZCH). Boat or ferry transport is used between Likoma Island and the mainland, with further land transport to the Nkhata Bay DHO and MZCH. Additionally, several private facilities manage their own transport of specimens and results to the DHO, and two public facilities, Khondowe and Ruarwe, collect/transport their items by public ferry or on foot to and from Usisya.

© John Snow, Inc. | Use of disclosure of data contained on this sheet is subject to the restriction on the title page of this document.
27
Figure 5: Current Specimen Referral
Transportation Routes
Nkhata Bay DHO
Mzuzu
Nkhata Bay DHO MZCH
Health Facility Route & direction
Description and Service Level
Motorcycle drivers transport specimens and test results between 18 of the 20 public health facilities served by Nkhata Bay and the DHO each week, using seven set routes. Most facilities are visited twice per week. One facility, Kabuwa, is visited once per week. Two facilities are not accessible by road year-round and therefore do not have direct specimen collection or return of results by Riders: Khondowe and Ruarwe. Four other facilities may have limited accessibility when road conditions are poor: Nthungwa, Usisya, Tchesamu, and Chitheka. In addition, motorcycles transport specimens and test results between the DHO and MZCH once per week.
Specimens and results are transported between Likoma Islands and the mainland by boat, typically the local ferry. A representative from Likoma carries the items each way. There is not a fixed schedule for transport; rather, the facility arranges transport when needed and when personnel and the ferry are available for the journey.
While not all facilities have direct transport service to/from the DHO, it is assumed that 100% of specimens and results that are collected are delivered under the baseline scenario. That is, all items picked up from any collection point are delivered to their destination.
Routes
Table 4: Scenario I Routes and Stops
Motorcycle Routes and Frequency
Once per Week Twice per Week
Nkhata Bay DHO Kabuwa
Nkhata Bay DHO Chintheche Kachere Kande Liuzi Tchesamu
Nkhata Bay DHO Chisala Chitheka Kavuzi Clinic Mpamba Mzenga
Nkhata Bay DHO Mzuzu
Nkhata Bay DHO Bula Usisya
Nkhata Bay DHO Chikwina Luwazi
© John Snow, Inc. | Use of disclosure of data contained on this sheet is subject to the restriction on the title page of this document.
28
Nkhata Bay DHO Chilambwe Old Maula Prison
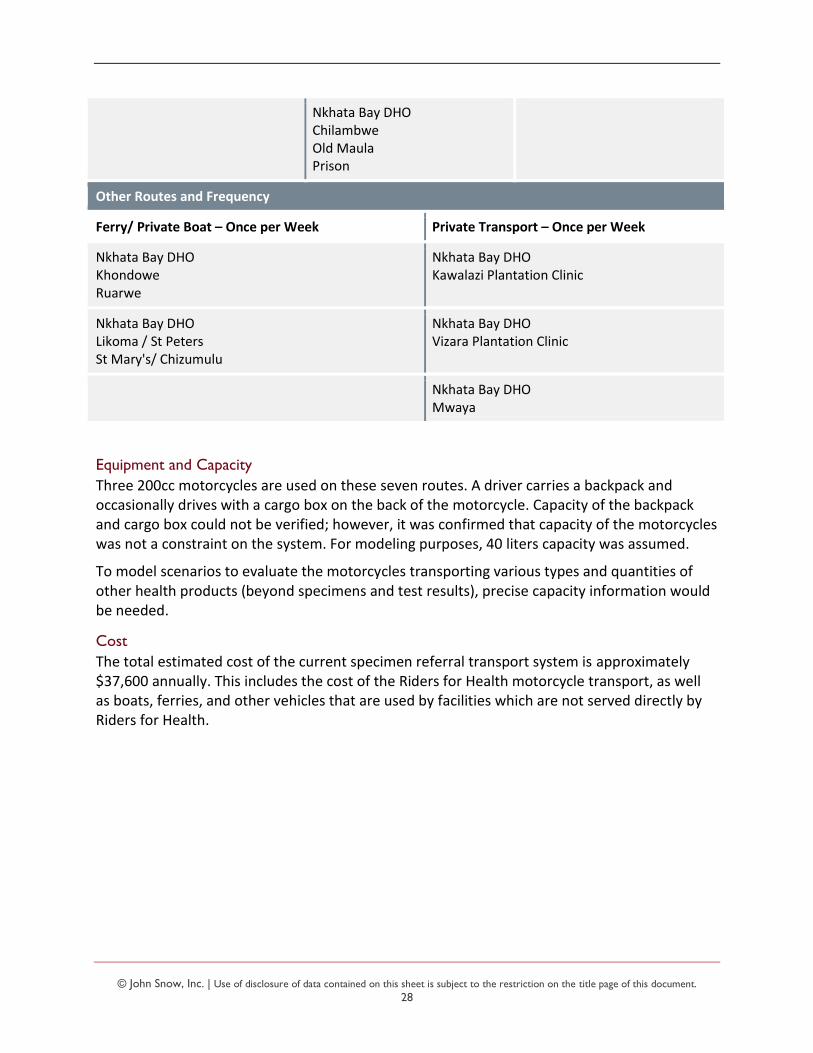
Other Routes and Frequency
Ferry/ Private Boat – Once per Week Private Transport – Once per Week
Nkhata Bay DHO Khondowe Ruarwe
Nkhata Bay DHO Kawalazi Plantation Clinic
Nkhata Bay DHO Likoma / St Peters St Mary's/ Chizumulu
Nkhata Bay DHO Vizara Plantation Clinic
Nkhata Bay DHO Mwaya
Equipment and Capacity
Three 200cc motorcycles are used on these seven routes. A driver carries a backpack and occasionally drives with a cargo box on the back of the motorcycle. Capacity of the backpack and cargo box could not be verified; however, it was confirmed that capacity of the motorcycles was not a constraint on the system. For modeling purposes, 40 liters capacity was assumed.
To model scenarios to evaluate the motorcycles transporting various types and quantities of other health products (beyond specimens and test results), precise capacity information would be needed.
Cost
The total estimated cost of the current specimen referral transport system is approximately $37,600 annually. This includes the cost of the Riders for Health motorcycle transport, as well as boats, ferries, and other vehicles that are used by facilities which are not served directly by Riders for Health.
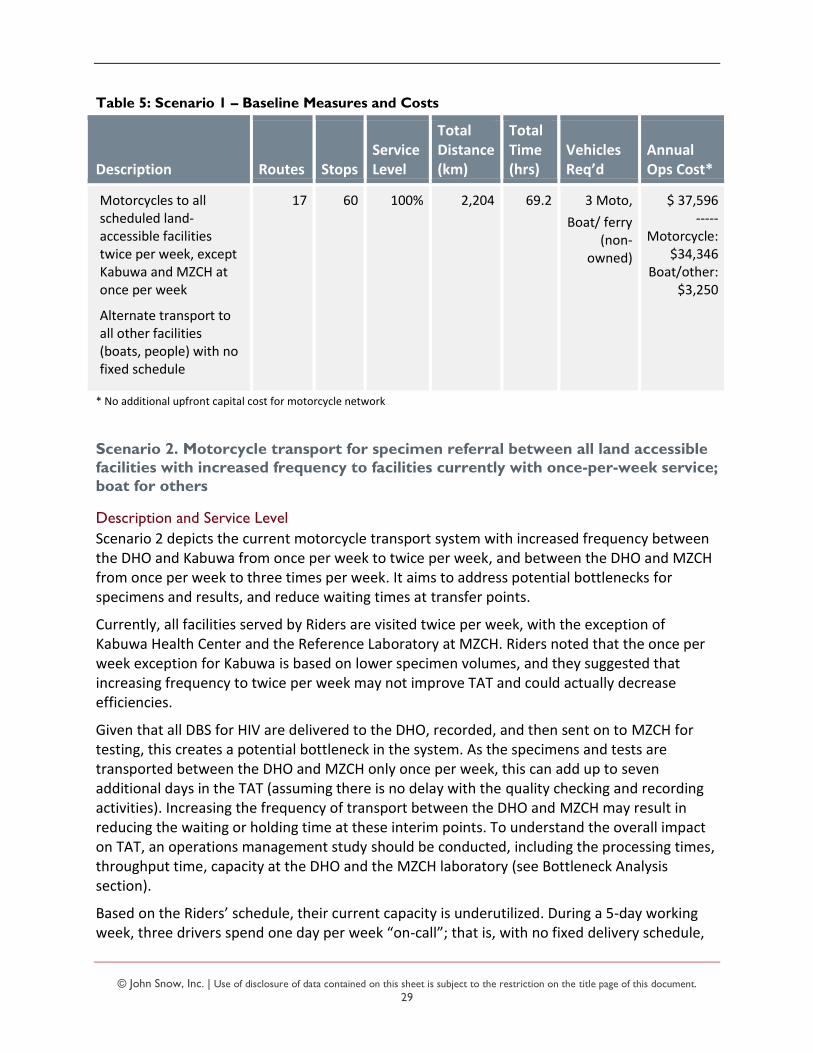
© John Snow, Inc. | Use of disclosure of data contained on this sheet is subject to the restriction on the title page of this document.
29
Table 5: Scenario 1 – Baseline Measures and Costs
Description Routes Stops Service Level
Total Distance (km)
Total Time (hrs)
Vehicles Req’d
Annual Ops Cost*
Motorcycles to all scheduled land-accessible facilities twice per week, except Kabuwa and MZCH at once per week
Alternate transport to all other facilities (boats, people) with no fixed schedule
17 60 100% 2,204 69.2 3 Moto,
Boat/ ferry (non-
owned)
$ 37,596 -----
Motorcycle: $34,346
Boat/other: $3,250
* No additional upfront capital cost for motorcycle network
Scenario 2. Motorcycle transport for specimen referral between all land accessible
facilities with increased frequency to facilities currently with once-per-week service;
boat for others
Description and Service Level
Scenario 2 depicts the current motorcycle transport system with increased frequency between the DHO and Kabuwa from once per week to twice per week, and between the DHO and MZCH from once per week to three times per week. It aims to address potential bottlenecks for specimens and results, and reduce waiting times at transfer points.
Currently, all facilities served by Riders are visited twice per week, with the exception of Kabuwa Health Center and the Reference Laboratory at MZCH. Riders noted that the once per week exception for Kabuwa is based on lower specimen volumes, and they suggested that increasing frequency to twice per week may not improve TAT and could actually decrease efficiencies.
Given that all DBS for HIV are delivered to the DHO, recorded, and then sent on to MZCH for testing, this creates a potential bottleneck in the system. As the specimens and tests are transported between the DHO and MZCH only once per week, this can add up to seven additional days in the TAT (assuming there is no delay with the quality checking and recording activities). Increasing the frequency of transport between the DHO and MZCH may result in reducing the waiting or holding time at these interim points. To understand the overall impact on TAT, an operations management study should be conducted, including the processing times, throughput time, capacity at the DHO and the MZCH laboratory (see Bottleneck Analysis section).
Based on the Riders’ schedule, their current capacity is underutilized. During a 5-day working week, three drivers spend one day per week “on-call”; that is, with no fixed delivery schedule,
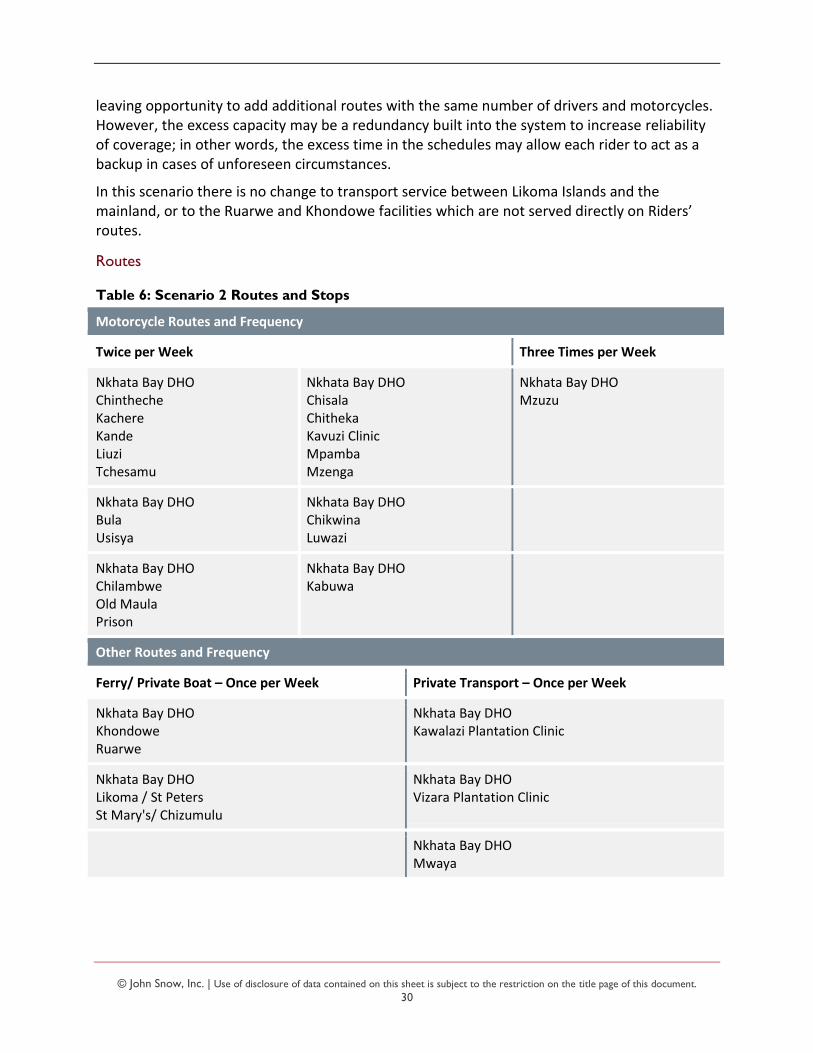
© John Snow, Inc. | Use of disclosure of data contained on this sheet is subject to the restriction on the title page of this document.
30
leaving opportunity to add additional routes with the same number of drivers and motorcycles. However, the excess capacity may be a redundancy built into the system to increase reliability of coverage; in other words, the excess time in the schedules may allow each rider to act as a backup in cases of unforeseen circumstances.
In this scenario there is no change to transport service between Likoma Islands and the mainland, or to the Ruarwe and Khondowe facilities which are not served directly on Riders’ routes.
Routes
Table 6: Scenario 2 Routes and Stops
Motorcycle Routes and Frequency
Twice per Week Three Times per Week
Nkhata Bay DHO Chintheche Kachere Kande Liuzi Tchesamu
Nkhata Bay DHO Chisala Chitheka Kavuzi Clinic Mpamba Mzenga
Nkhata Bay DHO Mzuzu
Nkhata Bay DHO Bula Usisya
Nkhata Bay DHO Chikwina Luwazi
Nkhata Bay DHO Chilambwe Old Maula Prison
Nkhata Bay DHO Kabuwa
Other Routes and Frequency
Ferry/ Private Boat – Once per Week Private Transport – Once per Week
Nkhata Bay DHO Khondowe Ruarwe
Nkhata Bay DHO Kawalazi Plantation Clinic
Nkhata Bay DHO Likoma / St Peters St Mary's/ Chizumulu
Nkhata Bay DHO Vizara Plantation Clinic
Nkhata Bay DHO Mwaya
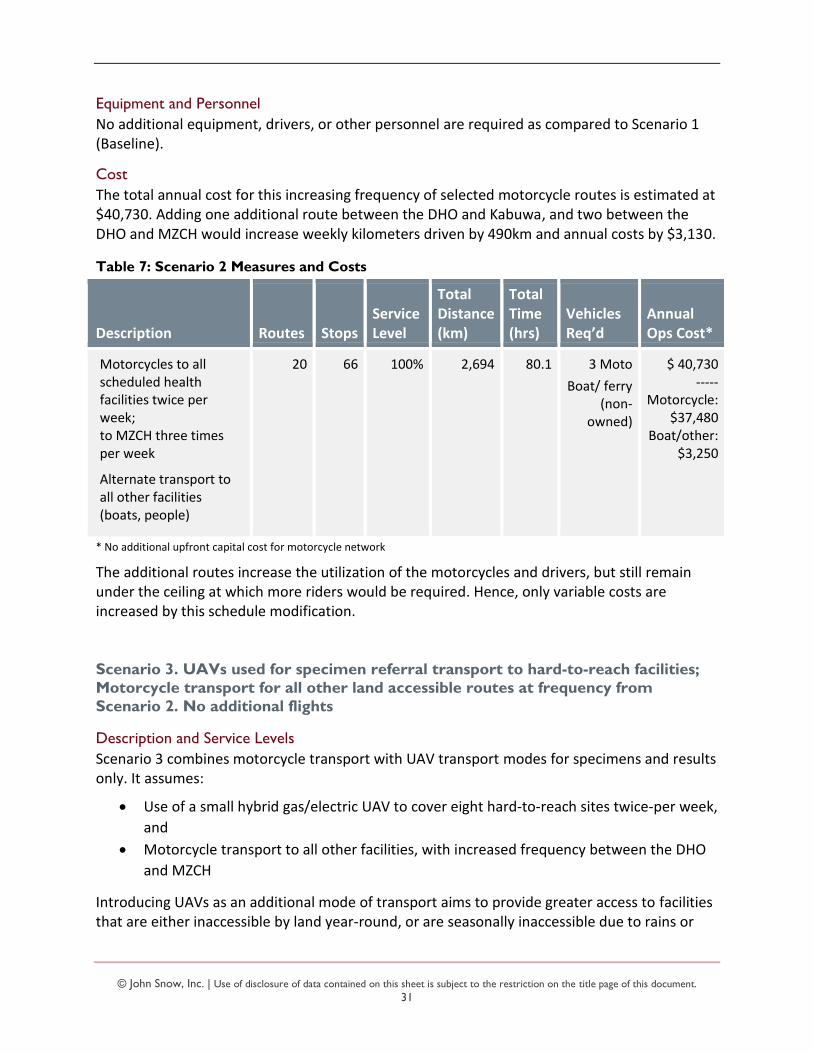
© John Snow, Inc. | Use of disclosure of data contained on this sheet is subject to the restriction on the title page of this document.
31
Equipment and Personnel
No additional equipment, drivers, or other personnel are required as compared to Scenario 1 (Baseline).
Cost
The total annual cost for this increasing frequency of selected motorcycle routes is estimated at $40,730. Adding one additional route between the DHO and Kabuwa, and two between the DHO and MZCH would increase weekly kilometers driven by 490km and annual costs by $3,130.
Table 7: Scenario 2 Measures and Costs
Description Routes Stops Service Level
Total Distance (km)
Total Time (hrs)
Vehicles Req’d
Annual Ops Cost*
Motorcycles to all scheduled health facilities twice per week; to MZCH three times per week
Alternate transport to all other facilities (boats, people)
20 66 100% 2,694 80.1 3 Moto
Boat/ ferry (non-
owned)
$ 40,730 -----
Motorcycle: $37,480
Boat/other: $3,250
* No additional upfront capital cost for motorcycle network
The additional routes increase the utilization of the motorcycles and drivers, but still remain under the ceiling at which more riders would be required. Hence, only variable costs are increased by this schedule modification.
Scenario 3. UAVs used for specimen referral transport to hard-to-reach facilities;
Motorcycle transport for all other land accessible routes at frequency from
Scenario 2. No additional flights
Description and Service Levels
Scenario 3 combines motorcycle transport with UAV transport modes for specimens and results only. It assumes:
Use of a small hybrid gas/electric UAV to cover eight hard-to-reach sites twice-per week,
and
Motorcycle transport to all other facilities, with increased frequency between the DHO
and MZCH
Introducing UAVs as an additional mode of transport aims to provide greater access to facilities that are either inaccessible by land year-round, or are seasonally inaccessible due to rains or
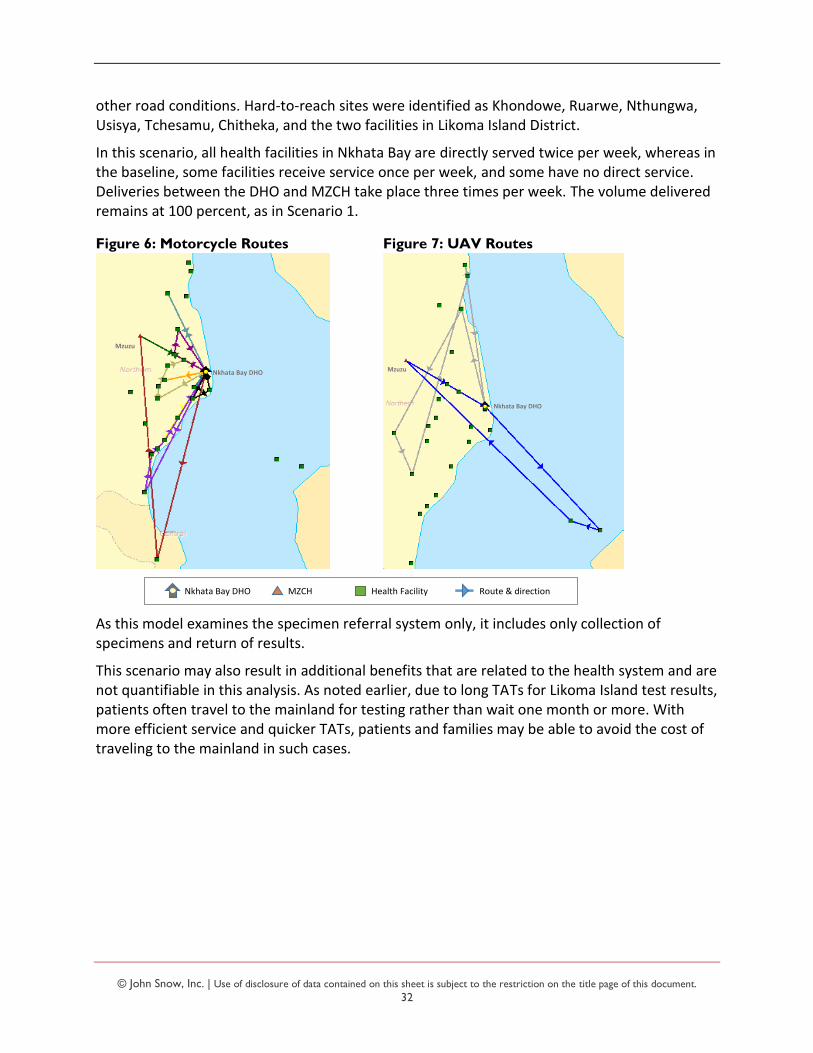
© John Snow, Inc. | Use of disclosure of data contained on this sheet is subject to the restriction on the title page of this document.
32
other road conditions. Hard-to-reach sites were identified as Khondowe, Ruarwe, Nthungwa, Usisya, Tchesamu, Chitheka, and the two facilities in Likoma Island District.
In this scenario, all health facilities in Nkhata Bay are directly served twice per week, whereas in the baseline, some facilities receive service once per week, and some have no direct service. Deliveries between the DHO and MZCH take place three times per week. The volume delivered remains at 100 percent, as in Scenario 1.
Figure 6: Motorcycle Routes Figure 7: UAV Routes
As this model examines the specimen referral system only, it includes only collection of specimens and return of results.
This scenario may also result in additional benefits that are related to the health system and are not quantifiable in this analysis. As noted earlier, due to long TATs for Likoma Island test results, patients often travel to the mainland for testing rather than wait one month or more. With more efficient service and quicker TATs, patients and families may be able to avoid the cost of traveling to the mainland in such cases.
Nkhata Bay DHO
Mzuzu
Nkhata Bay DHO
Mzuzu
Nkhata Bay DHO MZCH Health Facility Route & direction
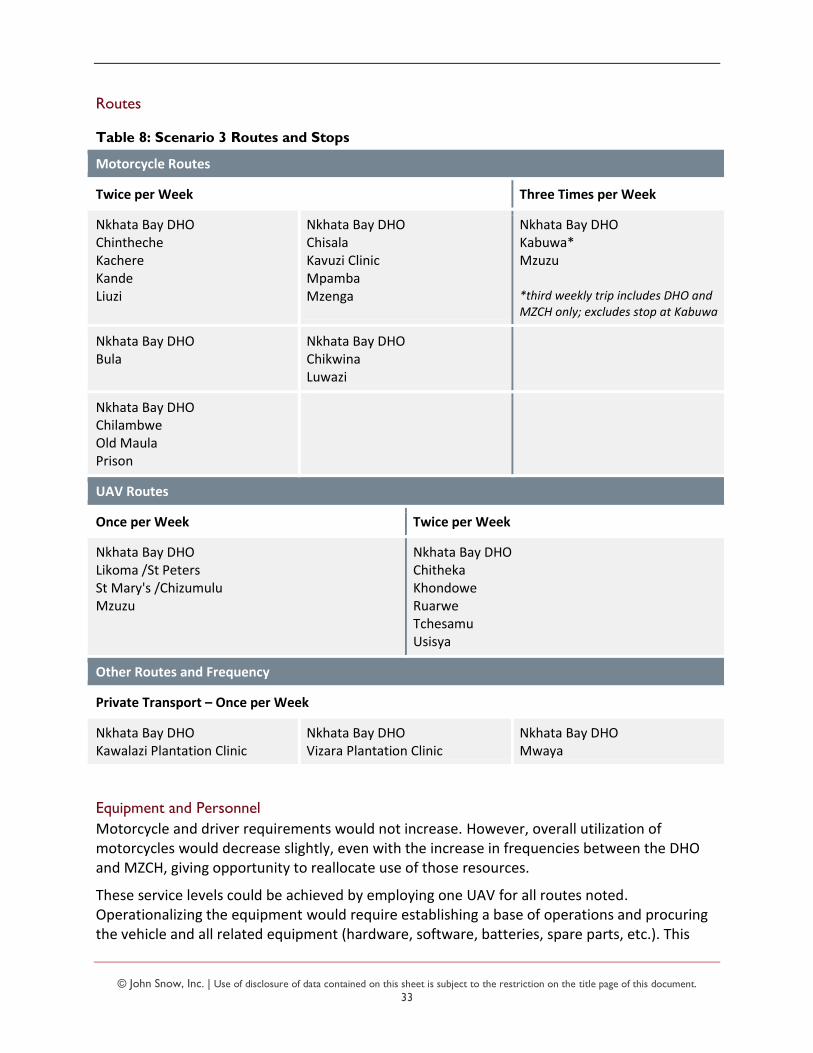
© John Snow, Inc. | Use of disclosure of data contained on this sheet is subject to the restriction on the title page of this document.
33
Routes
Table 8: Scenario 3 Routes and Stops
Motorcycle Routes
Twice per Week Three Times per Week
Nkhata Bay DHO Chintheche Kachere Kande Liuzi
Nkhata Bay DHO Chisala Kavuzi Clinic Mpamba Mzenga
Nkhata Bay DHO Kabuwa* Mzuzu *third weekly trip includes DHO and MZCH only; excludes stop at Kabuwa
Nkhata Bay DHO Bula
Nkhata Bay DHO Chikwina Luwazi
Nkhata Bay DHO Chilambwe Old Maula Prison
UAV Routes
Once per Week Twice per Week
Nkhata Bay DHO Likoma /St Peters St Mary's /Chizumulu Mzuzu
Nkhata Bay DHO Chitheka Khondowe Ruarwe Tchesamu Usisya
Other Routes and Frequency
Private Transport – Once per Week
Nkhata Bay DHO Kawalazi Plantation Clinic
Nkhata Bay DHO Vizara Plantation Clinic
Nkhata Bay DHO Mwaya
Equipment and Personnel
Motorcycle and driver requirements would not increase. However, overall utilization of motorcycles would decrease slightly, even with the increase in frequencies between the DHO and MZCH, giving opportunity to reallocate use of those resources.
These service levels could be achieved by employing one UAV for all routes noted. Operationalizing the equipment would require establishing a base of operations and procuring the vehicle and all related equipment (hardware, software, batteries, spare parts, etc.). This
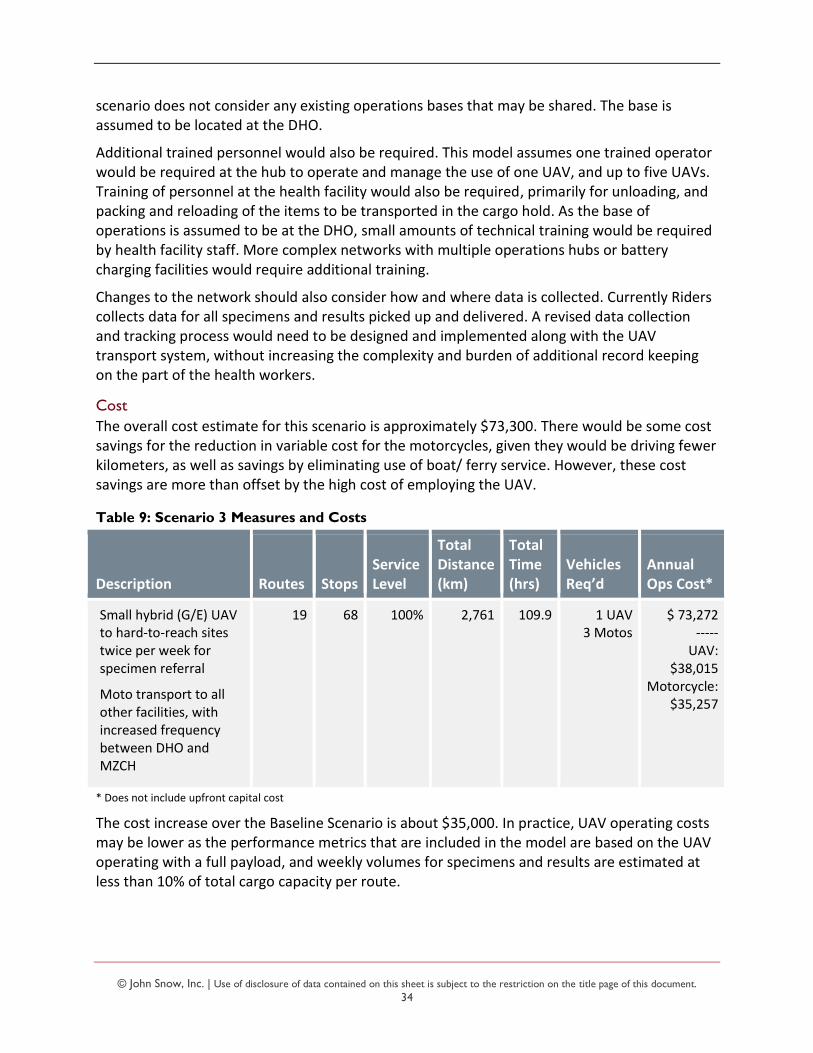
© John Snow, Inc. | Use of disclosure of data contained on this sheet is subject to the restriction on the title page of this document.
34
scenario does not consider any existing operations bases that may be shared. The base is assumed to be located at the DHO.
Additional trained personnel would also be required. This model assumes one trained operator would be required at the hub to operate and manage the use of one UAV, and up to five UAVs. Training of personnel at the health facility would also be required, primarily for unloading, and packing and reloading of the items to be transported in the cargo hold. As the base of operations is assumed to be at the DHO, small amounts of technical training would be required by health facility staff. More complex networks with multiple operations hubs or battery charging facilities would require additional training.
Changes to the network should also consider how and where data is collected. Currently Riders collects data for all specimens and results picked up and delivered. A revised data collection and tracking process would need to be designed and implemented along with the UAV transport system, without increasing the complexity and burden of additional record keeping on the part of the health workers.
Cost
The overall cost estimate for this scenario is approximately $73,300. There would be some cost savings for the reduction in variable cost for the motorcycles, given they would be driving fewer kilometers, as well as savings by eliminating use of boat/ ferry service. However, these cost savings are more than offset by the high cost of employing the UAV.
Table 9: Scenario 3 Measures and Costs
Description Routes Stops Service Level
Total Distance (km)
Total Time (hrs)
Vehicles Req’d
Annual Ops Cost*
Small hybrid (G/E) UAV to hard-to-reach sites twice per week for specimen referral
Moto transport to all other facilities, with increased frequency between DHO and MZCH
19 68 100% 2,761 109.9 1 UAV 3 Motos
$ 73,272 ----- UAV:
$38,015 Motorcycle:
$35,257
* Does not include upfront capital cost
The cost increase over the Baseline Scenario is about $35,000. In practice, UAV operating costs may be lower as the performance metrics that are included in the model are based on the UAV operating with a full payload, and weekly volumes for specimens and results are estimated at less than 10% of total cargo capacity per route.
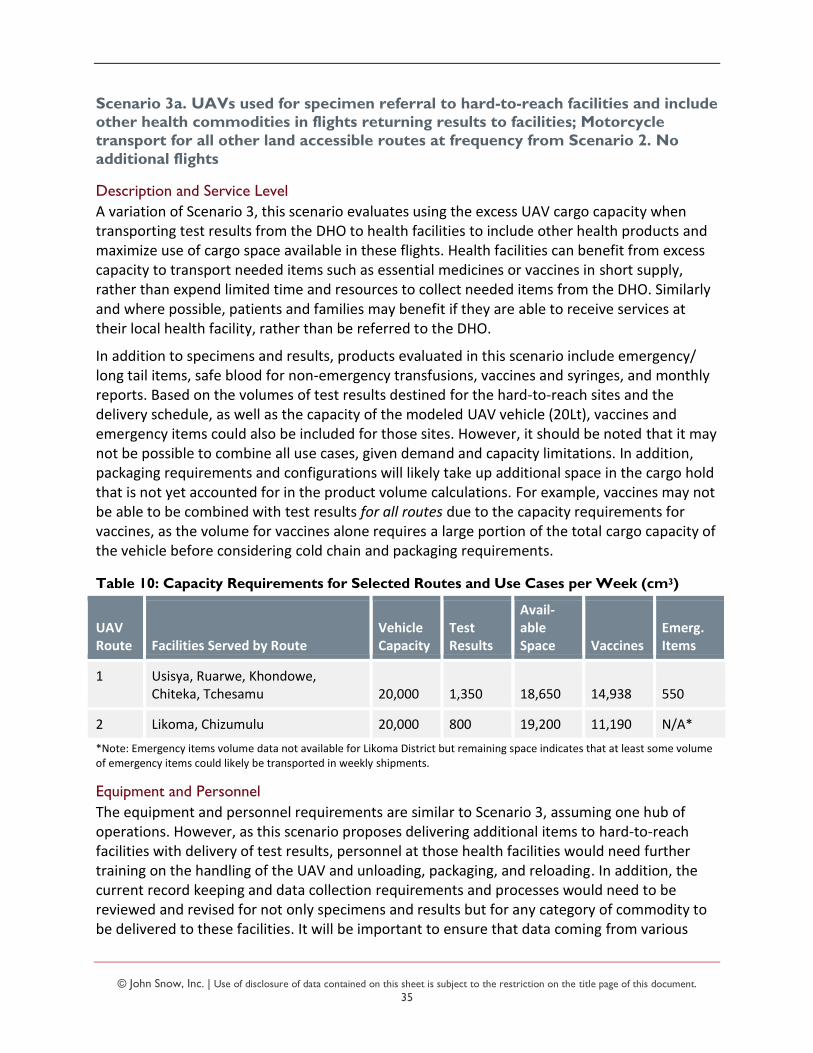
© John Snow, Inc. | Use of disclosure of data contained on this sheet is subject to the restriction on the title page of this document.
35
Scenario 3a. UAVs used for specimen referral to hard-to-reach facilities and include other health commodities in flights returning results to facilities; Motorcycle
transport for all other land accessible routes at frequency from Scenario 2. No
additional flights
Description and Service Level
A variation of Scenario 3, this scenario evaluates using the excess UAV cargo capacity when transporting test results from the DHO to health facilities to include other health products and maximize use of cargo space available in these flights. Health facilities can benefit from excess capacity to transport needed items such as essential medicines or vaccines in short supply, rather than expend limited time and resources to collect needed items from the DHO. Similarly and where possible, patients and families may benefit if they are able to receive services at their local health facility, rather than be referred to the DHO.
In addition to specimens and results, products evaluated in this scenario include emergency/ long tail items, safe blood for non-emergency transfusions, vaccines and syringes, and monthly reports. Based on the volumes of test results destined for the hard-to-reach sites and the delivery schedule, as well as the capacity of the modeled UAV vehicle (20Lt), vaccines and emergency items could also be included for those sites. However, it should be noted that it may not be possible to combine all use cases, given demand and capacity limitations. In addition, packaging requirements and configurations will likely take up additional space in the cargo hold that is not yet accounted for in the product volume calculations. For example, vaccines may not be able to be combined with test results for all routes due to the capacity requirements for vaccines, as the volume for vaccines alone requires a large portion of the total cargo capacity of the vehicle before considering cold chain and packaging requirements.
Table 10: Capacity Requirements for Selected Routes and Use Cases per Week (cm3)
UAV Route Facilities Served by Route
Vehicle Capacity
Test Results
Avail-able Space Vaccines
Emerg. Items
1 Usisya, Ruarwe, Khondowe, Chiteka, Tchesamu 20,000 1,350 18,650 14,938 550
2 Likoma, Chizumulu 20,000 800 19,200 11,190 N/A*
*Note: Emergency items volume data not available for Likoma District but remaining space indicates that at least some volume of emergency items could likely be transported in weekly shipments.
Equipment and Personnel
The equipment and personnel requirements are similar to Scenario 3, assuming one hub of operations. However, as this scenario proposes delivering additional items to hard-to-reach facilities with delivery of test results, personnel at those health facilities would need further training on the handling of the UAV and unloading, packaging, and reloading. In addition, the current record keeping and data collection requirements and processes would need to be reviewed and revised for not only specimens and results but for any category of commodity to be delivered to these facilities. It will be important to ensure that data coming from various
© John Snow, Inc. | Use of disclosure of data contained on this sheet is subject to the restriction on the title page of this document.
36
sources is of good quality and combined in one repository so that the change in process does not result in loss of data visibility. Lines of accountability for data should also be established.
Coordination and communication requirements between programs and operations personnel will be essential to ensure effective utilization of the equipment and appropriate handling and shipping of products. Forming a regularly-meeting group around logistics of all cargo types/ use cases at the district level may be necessary.
It has been posited that moving to weekly vaccine delivery with the use of UAVs may decrease cold chain requirements in the system. This may be true for upstream stores where larger volumes of commodities are managed. However, procurement activity (volume and frequency of incoming product) would also need to be considered.
Importantly, at the facility level, a shift to weekly delivery may decrease or increase cold chain uptime requirements in terms of reliability and functioning of equipment. Currently, vaccines are collected once per month and vaccination clinics are typically planned near the arrival date, leaving small quantities to store throughout the month. Weekly delivery would mean that a lower but constant supply would be on hand throughout the month, likely requiring closer monitoring and management. Such a change would require planning and careful behavior change activity given that communities may be accustomed to a monthly routine.
Costs
Operating costs are estimated to be similar to Scenario 3; however, there may be some variances due to the higher payloads transported in Scenario 3a. As noted earlier, cost estimates were developed based on performance inputs measured with the UAV equipment operating at full capacity, and there is currently not enough detailed performance data to estimate the cost variance for operating the equipment with lighter payloads.
Scenario 4. UAVs used for specimen referral to hard-to-reach facilities; Motorcycle transport for all other land accessible routes; Uncommitted time of UAV is used to
transport other health commodities on additional flights to all facilities in the two
districts
Description and Service Level
This scenario builds on Scenario 3 and evaluates the possibility to employ the UAV when it is not being used for specimens and results to transport other types of health products to any/ all facilities, separate from specimens and results, thereby maximizing the utilization of the UAV. Similar to Scenarios 3 and 3a, health facilities, patients, and families may benefit from more rapid transport of needed items to health facilities and from reduced frequency, transit time, and cost of either collecting goods from the DHO or referring patients for service due to limited availability of needed commodities at the health facility.
Other products evaluated in this scenario include emergency/ long tail items, safe blood for non-emergency transfusions, vaccines and syringes, and monthly reports.
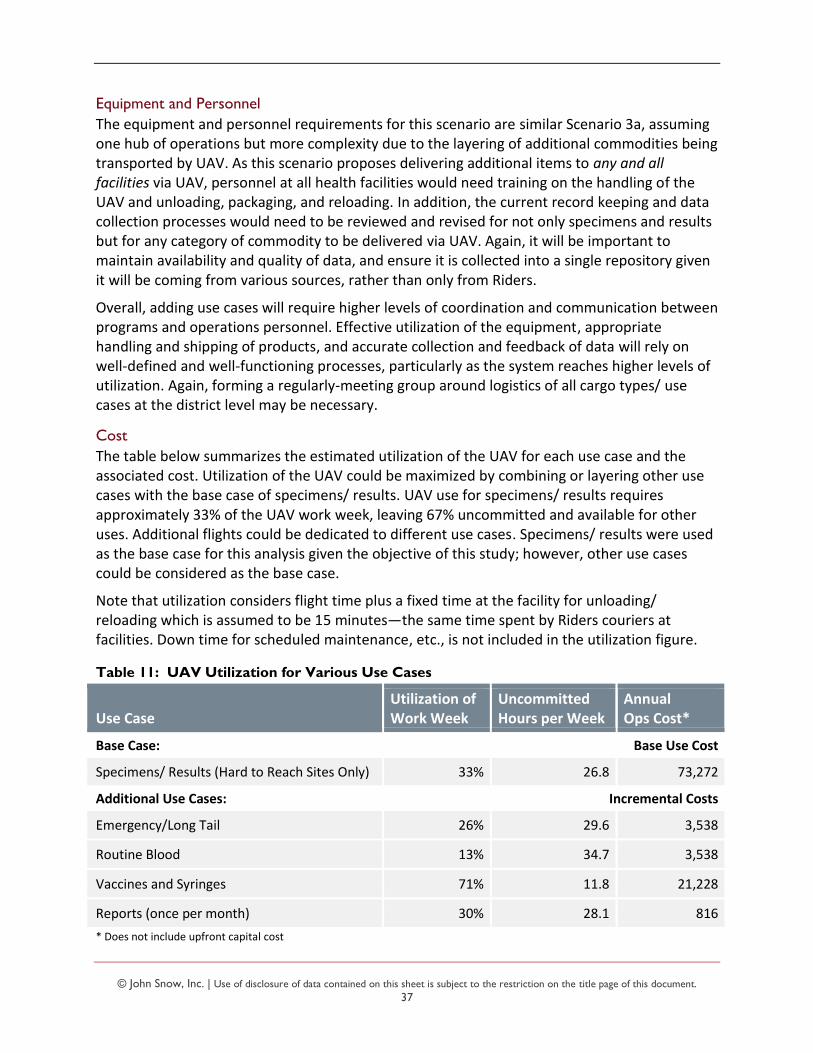
© John Snow, Inc. | Use of disclosure of data contained on this sheet is subject to the restriction on the title page of this document.
37
Equipment and Personnel
The equipment and personnel requirements for this scenario are similar Scenario 3a, assuming one hub of operations but more complexity due to the layering of additional commodities being transported by UAV. As this scenario proposes delivering additional items to any and all facilities via UAV, personnel at all health facilities would need training on the handling of the UAV and unloading, packaging, and reloading. In addition, the current record keeping and data collection processes would need to be reviewed and revised for not only specimens and results but for any category of commodity to be delivered via UAV. Again, it will be important to maintain availability and quality of data, and ensure it is collected into a single repository given it will be coming from various sources, rather than only from Riders.
Overall, adding use cases will require higher levels of coordination and communication between programs and operations personnel. Effective utilization of the equipment, appropriate handling and shipping of products, and accurate collection and feedback of data will rely on well-defined and well-functioning processes, particularly as the system reaches higher levels of utilization. Again, forming a regularly-meeting group around logistics of all cargo types/ use cases at the district level may be necessary.
Cost
The table below summarizes the estimated utilization of the UAV for each use case and the associated cost. Utilization of the UAV could be maximized by combining or layering other use cases with the base case of specimens/ results. UAV use for specimens/ results requires approximately 33% of the UAV work week, leaving 67% uncommitted and available for other uses. Additional flights could be dedicated to different use cases. Specimens/ results were used as the base case for this analysis given the objective of this study; however, other use cases could be considered as the base case.
Note that utilization considers flight time plus a fixed time at the facility for unloading/ reloading which is assumed to be 15 minutes—the same time spent by Riders couriers at facilities. Down time for scheduled maintenance, etc., is not included in the utilization figure.
Table 11: UAV Utilization for Various Use Cases
Use Case Utilization of Work Week
Uncommitted Hours per Week
Annual Ops Cost*
Base Case: Base Use Cost
Specimens/ Results (Hard to Reach Sites Only) 33% 26.8 73,272
Additional Use Cases: Incremental Costs
Emergency/Long Tail 26% 29.6 3,538
Routine Blood 13% 34.7 3,538
Vaccines and Syringes 71% 11.8 21,228
Reports (once per month) 30% 28.1 816
* Does not include upfront capital cost
© John Snow, Inc. | Use of disclosure of data contained on this sheet is subject to the restriction on the title page of this document.
38
Example Transporting samples to hard-to-reach sites requires 33% of the work week, leaving 67% of the time uncommitted.
Emergency/ long tail items require 26% of a work week, and could be scheduled for transport when the UAV is not being used for specimens/ results.
Specimens 33% $ 73,272 Emergency 26% 3,538
Total time 59% Cost $ 76,810
In general, different combinations are possible where the utilization figures add up to less than 100 percent. Vaccines represent a unique case in that the utilization for those products alone is relatively high. While it may be possible to use a UAV for vaccine delivery and delivery of another product, as the utilization gets close to 100 percent, there is increased risk of incomplete delivery as there is no room for error or deviation from the schedule.
Costs indicated for the base case capture all ongoing operating costs, such as ground staff. Therefore, combining different use cases will also reduce overall costs as many ongoing operating costs would be shared. Costs shown for the additional use cases indicate the incremental costs of combining each use case with the base case.
With the expansion of the types of commodities being delivered by UAV, there is increased opportunity for cost savings on the part of the patients, families, and health facilities over Scenarios 3/3a.
Additional details for the various scenarios and use cases evaluated can be found in the Annex.
DISCUSSION AND RECOMMENDATIONS
Stakeholder Engagement and Scenario Evaluation
Following the optimization activity and production of the scenarios described in the previous section, a workshop was held in Lilongwe on March 28, 2018 to review the results. Participants were the same key stakeholders who previously took part in the data validation workshop, involved in the Malawi public health diagnostics network and supply chain and in the development of UAV use in Malawi. This group met to discuss the outputs of the models and scenarios, debate the tradeoffs of each of the scenarios and the ability of each scenario to best serve public health needs, answer any last questions, and agree on a prioritized scenario(s) around which to develop the pilot.
As noted earlier, the objective of this activity was not to evaluate individual UAV manufacturers or makes/models. However, the requirements of the specimen referral system and public health supply chain will need to be considered when evaluating potential models and their specifications. Prior to developing the scenarios and considering needs of the specimen referral system, consultants considered the following basic specifications:
Ability to be loaded and unloaded at all sites, and therefore land and take-off vertically
Capacity in terms of weight and volume
Range in terms of distance
© John Snow, Inc. | Use of disclosure of data contained on this sheet is subject to the restriction on the title page of this document.
39
Workshop participants were also asked to identify characteristics of UAVs they felt would be important to specimen referrals and results return and to transporting other health commodities. Responses are summarized below:
Ease of use
Capacity and range
Vertical takeoff and landing
Cold chain/ temperature control ability
Ability to land safely in times of emergency
Ability to track the flight path
Maintenance considerations and costs
Biosafety
Ability to withstand environmental conditions
Ability to re-route; autonomous versus manual override
Participants were then split into three smaller groups to discuss which scenario they would choose, including the Baseline Scenario 1, and why. They were also asked to identify the benefits and challenges of their preferred solution.
All groups selected a scenario with UAVs integrated into the network. Of the three groups, all selected either Scenario 3 or 3a as the preferred scenario. Overall, the benefits of integrating UAVs into the system were described as follows:
The key point of adding UAVs to the system is to focus on hard-to-reach facilities and patients
Speed – UAVs are fast, reducing time to deliver cargo, medicines, vaccines – as well as the added advantage for urgent commodity deliveries
They can also be used in emergencies, flooding, etc.
They could directly serve islands, currently with limited access to the mainland
This provides an opportunity to complete long distance flights – no tests have been carried out yet in a real-life situation
The market is ready for a live pilot, not just another test, as there is a need to prove that the system works
It is a learning opportunity for the country and a demonstration opportunity for the broader community, even beyond the intended immediate impact on the health system
Autonomous drones may decrease training needs at the health facility level
The group that chose Scenario 3 (specimens/results only) suggested that it would be good to start with specimens/results as cargo, and with good performance confirmed, expand to
© John Snow, Inc. | Use of disclosure of data contained on this sheet is subject to the restriction on the title page of this document.
40
include other categories of health commodities over time. The other two groups that selected Scenario 3a saw the efficiency over Scenario 3 in that additional cargo could be transported on the same routes to remote facilities with no significant increase in costs. The only change to Scenarios 3/3a that was discussed with the participants was to link Likoma Island health facilities directly with MZCH instead of routing them through Nkhata Bay DHO, which is not required practice since they are covered under their own DHO.
Scenario 2 was seen to potentially increase inefficiencies since, for example, the one primary health facility that was increased from one to two visits per week was specifically scheduled at a lower pick-up frequency due to low volumes of specimens generated. For Scenario 4, participants expressed that this could be a longer-term objective, and that it would introduce too much complexity as an initial transport model. The participants also expressed their satisfaction with the range of the scenarios that were presented and did not suggest any additional scenarios to run.
Challenges to introducing UAVs into the transport network were also discussed, considering implementation and operations. A summary of the points discussed include:
Unpredictably windy weather, especially over Lake Malawi, which may not have been fully tested yet
Concerns about costs, which may impact sustainability and the government’s ability to pay over time
Cost vs equity—how to justify the annual cost increase from $38,000 for the current system to $73,000 (excluding upfront investment) for a small number of patients
Questions remain about equity and lives saved—may need cost-effectiveness analysis and will need impact assessment to measure results over time
Additional responsibilities for health center staff, distracting them from time spent on patient care
Human resources may be challenging (training, etc.) but is the most important success factor of system
How to ensure operations sustainability—maintenance, operations, how to maintain the current staff/ training, etc.
Communications between health centers, laboratory and DHO/command center— they should always be in communication in case of break down or emergency need
Civic education/ sensitization at community level is critical and needs to be done well to ensure that there is no interference with UAVs or products transported
Biosecurity risks need to be addressed and planned for, especially in the event of a crash or unmanned spill
Property damage or injuring people—operator must have insurance as precondition, as referenced in CAAM regulations, but this is currently a challenge in Malawi as there are no local insurance providers who will cover drones
© John Snow, Inc. | Use of disclosure of data contained on this sheet is subject to the restriction on the title page of this document.
41
Data management must be considered, including documentation and chain of custody, e.g., how does health center confirm arrival at command center, etc.
Must have clear accountability and lines of responsibility within each organization to say who specifically is responsible for UAV, on land and in air
Although there were many challenges mentioned, the Laboratory Director pointed out that these should not be seen as a bottleneck to implementation. Cost will be the major ongoing issue but the introduction of the new system can be done stepwise, starting with a small pilot region, similar to the way that Riders for Health was introduced over a period of many years.
Recommended System Design and Pilot
Based on the scenario results and discussion with stakeholders, the preferred transport network system design includes integration of UAVs for the eight hard-to-reach facilities into the current transport network provided by Riders for Health using motorcycles. Hard-to-reach facilities include six mainland health centers and the two in Likoma Island District.
A phased approach is recommended where the UAV system starts with transporting only specimens and results (Scenario 3) and then over time layers in additional use cases (Scenario 3a) such that the drone can be field-tested appropriately and complexity in the system is slowly added with proven performance. This phased approach should include specified KPIs with targets, which, when met, will trigger movement into the next phase. It is important to point out that these “trigger” KPIs and targets will need to be carefully selected and should focus more on effective drone operations, less so on the outcomes of the particular use case. While KPIs for the use cases are also important, they should not be used to trigger moving to a more complex phase.
Also noted during the stakeholder discussion, the importance of monitoring and evaluation of the system must be emphasized. This includes strong data collection and management, specimen tracking, cost-effectiveness study, impact assessment, etc., all of which must be an integral part of the pilot.
An Implementation Plan and Monitoring Framework for this pilot is included as an Annex of this document.
© John Snow, Inc. | Use of disclosure of data contained on this sheet is subject to the restriction on the title page of this document.
42
ANNEX A: DOCUMENTS CONSULTED
Costs Associated with the Use of Unmanned Aerial Vehicles for Transportation of Laboratory Samples in Malawi. 2016, Village Reach, Seattle, WA, USA
HIV Viral Load Supply Chain Management and Workforce Development during Scale-up. 2016, Malawi Ministry of Health HTSS, Lilongwe, Malawi (presentation document)
Implementation of the 2012 Joint Strategy for Supply Chain Integration in Malawi – Second Evaluation Report. 2017, GH Pro and Options Consultancy, Washington, DC, USA
Malawi Health Commodities Logistics Management System Standard Operating Procedures Manual. 2015, Malawi Ministry of Health and John Snow, Inc., Malawi
Malawi Health Sector Strategic Plan 2017-2022. 2017, Malawi Ministry of Health, Lilongwe, Malawi
Malawi National Community Health Strategy 2017-2022. 2017, Malawi Ministry of Health, Lilongwe, Malawi
Malawi Service Provision Assessment (MSPA) 2013-14. 2014, Malawi Ministry of Health and ICF International, Lilongwe, Malawi, and Rockville, Maryland, USA
UAVs in Global Health: Defining a Collective Path Forward, 2017. USAID Center for Accelerating Innovation and Impact, Washington, DC, USA
Use of UAVs for the Transportation of HIV Laboratory Samples in Malawi: Feasibility Study. 2016, Matternet Team, California, USA
What should you deliver by unmanned aerial systems? White Paper. 2018, inSupply, JSI Research & Training Institute, Inc., Llamasoft, The Nichols Group, International

© John Snow, Inc. | Use of disclosure of data contained on this sheet is subject to the restriction on the title page of this document.
43
ANNEX B: DATA COLLECTION TOOLS
Specimen Referral Network
The below questionnaire was applied at the MOH, DHO, Lab, and Health Facility levels, customized to address the context of each.
Questionnaire for Ministry of Health officials Building Laboratory Capacity to Support the Global Health Security Agenda, an African Society for Laboratory Medicine Initiative
Project: Assessment of Sample Referral Systems and Capabilities
Question Notes
1. Are there any Health policy, strategy, or implementation plans for the overall health system
that you could share electronically? Including the Viral Load Scale-up Plan?
3. Are there any policy, strategy, or implementation plans for the national laboratory that you
could share electronically?
1. Please provide name and contact details of the primary person at the PCR Laboratory
responsible for specimen transport/logistics. Is this the same person who would interface
with the MoH on lab issues?
2. Please provide name and contact details of the primary person at the DHO in Nkhata Bay
and Likoma Island responsible for specimen transport/logistics.
1. Who are the main implementing partners that support the laboratory in-country? Please
include their associated current and relevant projects
2. Who are the main donors that support the laboratory in-country? Please include their
associated current and relevant projects
1. Is there a technical working group (TWG) that is responsible for MoH-related laboratory
issues? If so, how often does it meet? Please provide a l ist of members.
2. If there is not an official TWG, are there any regular MOH-led meetings with stakeholders
to discuss and review the performance and/or responsibil ity of the labs? If so, how often?
3. Is there an annual review meeting to review laboratory activities?
1. How is the laboratory network structured? (E.g. is there a National Public Health Lab, a
National Research Lab and/or regional labs?)
2. If you have this network drawn out as either a map or l ist, please share
3. Please provide the number of health facil ities and laboratories at each tier/level in
Malawi
1. Has GIS mapping of country / region laboratories and health facil ities been done? To what
level of detail? If so, please share
2. Is there a GIS located health facil ity database? If not, is there an alternative ministry
department or body responsible for this?
3. Has there been any laboratory network optimization or laboratory capacity analysis done?
4. Are there GPS road network maps available? If not, is there an alternative ministry
department or body that is responsible for this?
1. Do you have a l ist of tests available for each tier of the laboratory network? If so, please
share
2. Do you have a referral network list (e.g. what facil ity refers to what lab for what test)?
1. Do public laboratories provide services for private health care facil ities such as running
tests from a private health centre? If so, does it cost money to the laboratory or the patient?
2. Are there private laboratories that provide services? If so, do you have a l ist of facil ities
and is there any official regulation or interaction with the public sector?
3. Do private laboratories provide services for public health care facil ities such as running
tests from a public health centres? If so, does it cost money to the laboratory or the patient?
1. In general, how strong is the reporting/data collection done by laboratories?
2. Please provide detail on strength of reporting/data collection for each tier of the
laboratory system (National, Regional, Peripheral)
3. Is there a national patient identification number / system?
4. Is there a Lab information system in country? If so, is it an electronic LIS system and what
does it cover (e.g. disease, tiers of laboratory system, geographic coverage)?
5. If there is an electronic LIS, does it connect with the patient health records (i.e. can you
send a result electronically back to a facil ity, directly into the patient's medical records)?
6. What level of telecommunications connectivity exists across health facil ities in Nkhata
Bay and Likoma Island (mobile networks, internet, wireless…)?
Point of care
availability
1. What is the availability and accessibil ity of point of care (PoC) testing?
2. If possible, l ist the name of the site and the name of the instruments in use
2. Lab network /
infrastructure
Laboratory network
structure
National Mapping
Regional and Facility
Level Mapping
Private service
delivery
Communications
and information
Area
1. Landscape
Policy
Roles and
Responsibilities
Partners and donors
Coordination and
Communication
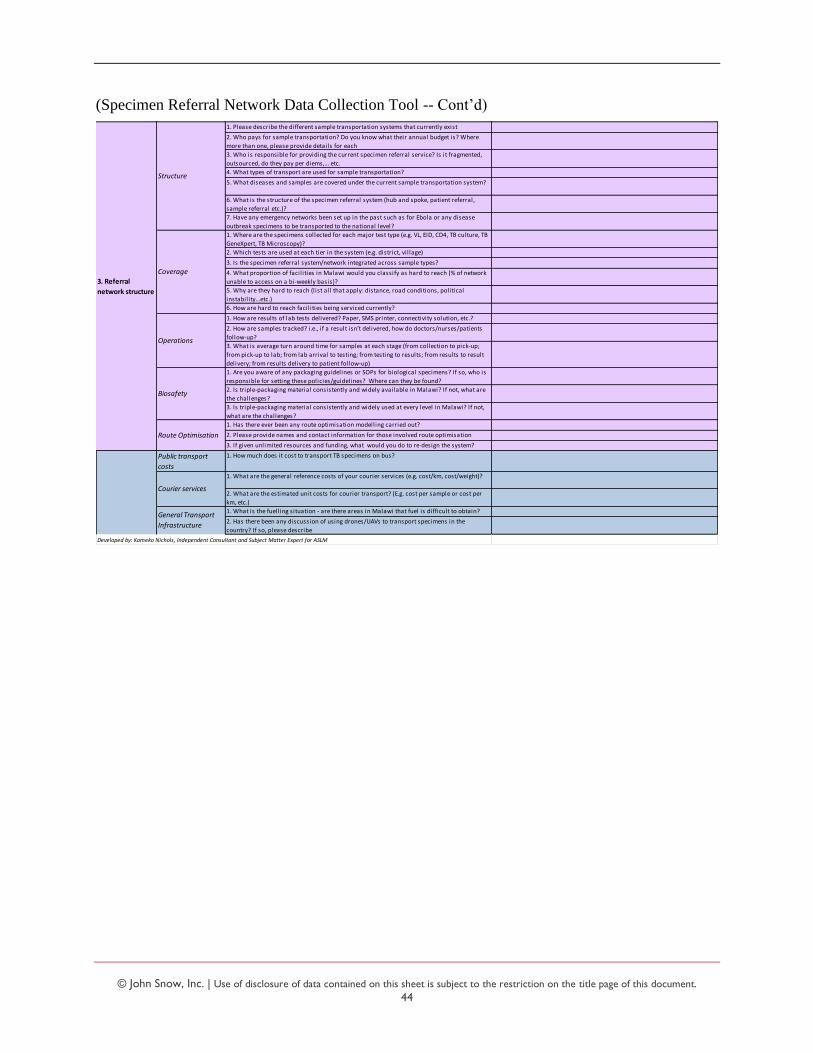
© John Snow, Inc. | Use of disclosure of data contained on this sheet is subject to the restriction on the title page of this document.
44
(Specimen Referral Network Data Collection Tool -- Cont’d)
1. Please describe the different sample transportation systems that currently exist
2. Who pays for sample transportation? Do you know what their annual budget is? Where
more than one, please provide details for each
3. Who is responsible for providing the current specimen referral service? Is it fragmented,
outsourced, do they pay per diems,... etc.
4. What types of transport are used for sample transportation?
5. What diseases and samples are covered under the current sample transportation system?
6. What is the structure of the specimen referral system (hub and spoke, patient referral,
sample referral etc.)?
7. Have any emergency networks been set up in the past such as for Ebola or any disease
outbreak specimens to be transported to the national level?
1. Where are the specimens collected for each major test type (e.g. VL, EID, CD4, TB culture, TB
GeneXpert, TB Microscopy)?
2. Which tests are used at each tier in the system (e.g. district, vil lage)
3. Is the specimen referral system/network integrated across sample types?
4. What proportion of facil ities in Malawi would you classify as hard to reach (% of network
unable to access on a bi-weekly basis)?
5. Why are they hard to reach (l ist all that apply: distance, road conditions, political
instability…etc.)
6. How are hard to reach facil ities being serviced currently?
1. How are results of lab tests delivered? Paper, SMS printer, connectivity solution, etc.?
2. How are samples tracked? i.e., if a result isn’t delivered, how do doctors/nurses/patients
follow-up?
3. What is average turn around time for samples at each stage (from collection to pick-up;
from pick-up to lab; from lab arrival to testing; from testing to results; from results to result
delivery; from results delivery to patient follow-up)
1. Are you aware of any packaging guidelines or SOPs for biological specimens? If so, who is
responsible for setting these policies/guidelines? Where can they be found?
2. Is triple-packaging material consistently and widely available in Malawi? If not, what are
the challenges?
3. Is triple-packaging material consistently and widely used at every level in Malawi? If not,
what are the challenges?
1. Has there ever been any route optimisation modelling carried out?
2. Please provide names and contact information for those involved route optimisation
3. If given unlimited resources and funding, what would you do to re-design the system?
Public transport
costs
1. How much does it cost to transport TB specimens on bus?
1. What are the general reference costs of your courier services (e.g. cost/km, cost/weight)?
2. What are the estimated unit costs for courier transport? (E.g. cost per sample or cost per
km, etc.)
1. What is the fuelling situation - are there areas in Malawi that fuel is difficult to obtain?
2. Has there been any discussion of using drones/UAVs to transport specimens in the
country? If so, please describe
Developed by: Kameko Nichols, Independent Consultant and Subject Matter Expert for ASLM
Courier services
General Transport
Infrastructure
3. Referral
network structure
Structure
Coverage
Operations
Biosafety
Route Optimisation

© John Snow, Inc. | Use of disclosure of data contained on this sheet is subject to the restriction on the title page of this document.
45
LOGISTICS SYSTEM ASSESSMENT TOOL (LSAT)
This tool will complement the Specimen Referral tool and drill down on specific supply chain functions as needed, based on initial responses.
SECTION I: Organization and Staffing – All levels
3. Are there written procedures and guidelines (e.g., manuals, job aids, standards) to help staff carry out their
responsibilities:
a. managing and using the lab / logistics management information system?
Yes No Comments:
b. forecasting quantities needed, including consumables?
Yes No Comments:
c. procurement?
Yes No Comments:
d. inventory management, storage, and distribution?
Yes No Comments:
h. supervision and staff development?
Yes No Comments:
3. Is there a supervision system that covers lab or supply chain activities?
Yes No Comments:
4. How often is supervision conducted at the service delivery points?
Never Weekly Monthly Quarterly Annually Comments:
5. Is there a process in place for improving any gaps in the knowledge and skills of lab or supply chain
personnel? If yes, please describe process.
a. central? Comments:
b. regional? Comments:
c. district? Yes No Comments:
d. service delivery point? Yes No Comments:
10. Do staff have the tools and resources they need to do their jobs, at the following levels (e.g., job aids, forms,
carbon paper, calculators, shelving, vehicles, funds for transport, etc.)? If not, which tools or resources are
missing at the following levels:
a. central? Comments:
b. regional? No Comments:
c. district? Yes No Comments:
d. service delivery point? Yes No Comments:
11. a. Is external assistance (from other NGOs, donors, or partners) used to complete management and
supervision activities? Yes No Comments:
b. If yes, describe the extent of the external assistance.
24. Has training been given to current staff at all appropriate levels, in the following areas:
a. completion and submission of LMIS reports? Yes No Comments:
b. proper storage of health products? Yes No Comments:
c. maintaining proper stock levels? Yes No Comments:
d. determining order quantities? Yes No Comments:
e. determining issue quantities? Yes No Comments:
f. estimating annual needs? Yes No Comments:
g. reviewing reports and records? Yes No Comments:
h. other? (list): Yes No Comments:
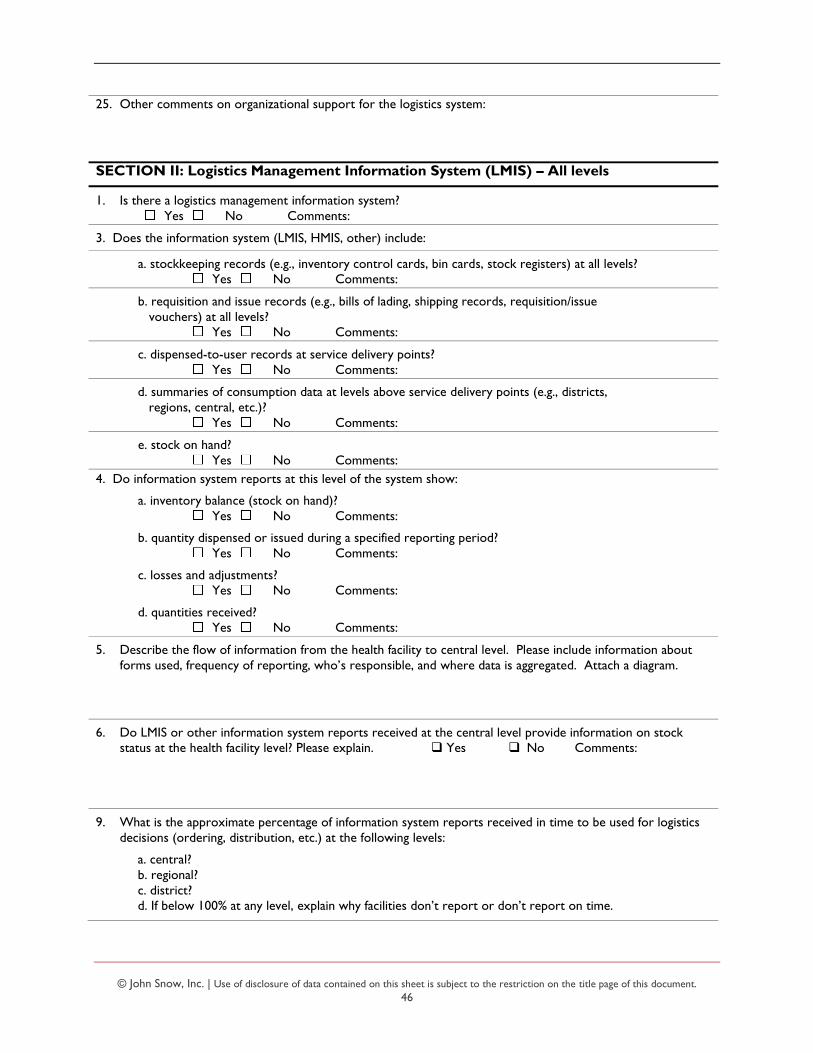
© John Snow, Inc. | Use of disclosure of data contained on this sheet is subject to the restriction on the title page of this document.
46
25. Other comments on organizational support for the logistics system:
SECTION II: Logistics Management Information System (LMIS) – All levels
1. Is there a logistics management information system?
Yes No Comments:
3. Does the information system (LMIS, HMIS, other) include:
a. stockkeeping records (e.g., inventory control cards, bin cards, stock registers) at all levels?
Yes No Comments:
b. requisition and issue records (e.g., bills of lading, shipping records, requisition/issue
vouchers) at all levels?
Yes No Comments:
c. dispensed-to-user records at service delivery points?
Yes No Comments:
d. summaries of consumption data at levels above service delivery points (e.g., districts,
regions, central, etc.)?
Yes No Comments:
e. stock on hand?
Yes No Comments:
4. Do information system reports at this level of the system show:
a. inventory balance (stock on hand)?
Yes No Comments:
b. quantity dispensed or issued during a specified reporting period?
Yes No Comments:
c. losses and adjustments?
Yes No Comments:
d. quantities received?
Yes No Comments:
5. Describe the flow of information from the health facility to central level. Please include information about
forms used, frequency of reporting, who’s responsible, and where data is aggregated. Attach a diagram.
6. Do LMIS or other information system reports received at the central level provide information on stock
status at the health facility level? Please explain. Yes No Comments:
9. What is the approximate percentage of information system reports received in time to be used for logistics
decisions (ordering, distribution, etc.) at the following levels:
a. central?
b. regional?
c. district?
d. If below 100% at any level, explain why facilities don’t report or don’t report on time.

© John Snow, Inc. | Use of disclosure of data contained on this sheet is subject to the restriction on the title page of this document.
47
10. Are information system records reconciled against physical inventories at each level?
Yes No
a. If yes, how is this done? b. How often?
13. Is external assistance provided to manage the information system? Describe.
22. a. Is logistics information provided to the appropriate decision makers for logistics planning
(e.g., Ministry of Health, Ministry of Finance, UNFPA, USAID, World Bank, NGOs)?
Yes No Comments:
b. What information is provided?
c. Who provides the information?
d. Who receives the information?
e. How often? monthly quarterly semi-annually annually other___________
f. How is the information used?
23. Other comments on the LMIS:
SECTION IV: Forecasting – Central level stakeholders
1. Describe the forecasting process, including for consumables
a. Who initiates it?
b. When does it take place?
c. How long does the process take?
d. What is the role of regional or lower levels in the process?
e. Does the private sector participate?
2. Are forecasts developed using:
a. dispensed-to-user data? Yes No Comments:
b. distribution/issues data? Yes No Comments:
c. stock on hand at all levels? Yes No Comments:
3. Are forecasts developed using the following:
a. demographic data or disease prevalence/morbidity? Yes No Comments:
b. service statistics? Yes No Comments:
4. Are forecasts validated by comparing previous estimated consumption with actual consumption?
Yes No Comments:
5. How close have most forecasts been to actual consumption?
less than 0–10% between 10–25% between 25–50% more than 50% discrepancy
7. What other factors are considered in the preparation of forecasts (e.g., consolidating decentralized forecasts
or quantifications, seasonal and regional variations, standard treatment guidelines, stockout periods, etc.)?
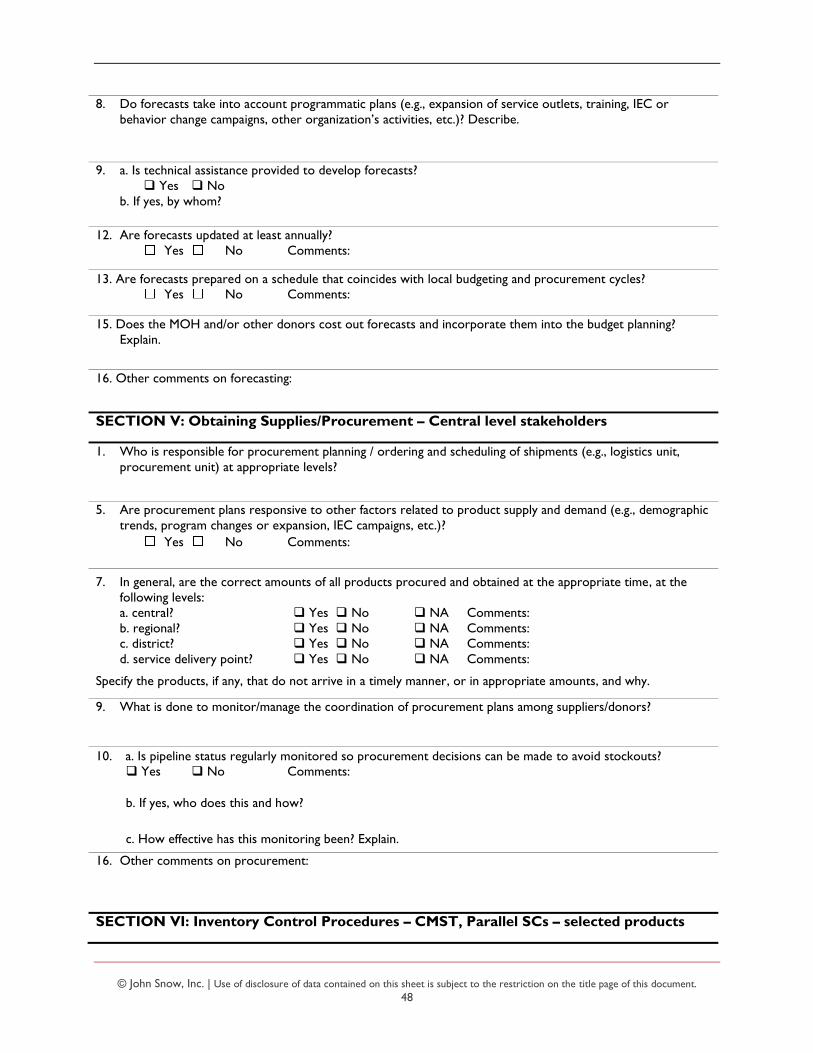
© John Snow, Inc. | Use of disclosure of data contained on this sheet is subject to the restriction on the title page of this document.
48
8. Do forecasts take into account programmatic plans (e.g., expansion of service outlets, training, IEC or
behavior change campaigns, other organization’s activities, etc.)? Describe.
9. a. Is technical assistance provided to develop forecasts?
Yes No
b. If yes, by whom?
12. Are forecasts updated at least annually?
Yes No Comments:
13. Are forecasts prepared on a schedule that coincides with local budgeting and procurement cycles?
Yes No Comments:
15. Does the MOH and/or other donors cost out forecasts and incorporate them into the budget planning?
Explain.
16. Other comments on forecasting:
SECTION V: Obtaining Supplies/Procurement – Central level stakeholders
1. Who is responsible for procurement planning / ordering and scheduling of shipments (e.g., logistics unit,
procurement unit) at appropriate levels?
5. Are procurement plans responsive to other factors related to product supply and demand (e.g., demographic
trends, program changes or expansion, IEC campaigns, etc.)?
Yes No Comments:
7. In general, are the correct amounts of all products procured and obtained at the appropriate time, at the
following levels:
a. central? Yes No NA Comments:
b. regional? Yes No NA Comments:
c. district? Yes No NA Comments:
d. service delivery point? Yes No NA Comments:
Specify the products, if any, that do not arrive in a timely manner, or in appropriate amounts, and why.
9. What is done to monitor/manage the coordination of procurement plans among suppliers/donors?
10. a. Is pipeline status regularly monitored so procurement decisions can be made to avoid stockouts?
Yes No Comments:
b. If yes, who does this and how?
c. How effective has this monitoring been? Explain.
16. Other comments on procurement:
SECTION VI: Inventory Control Procedures – CMST, Parallel SCs – selected products
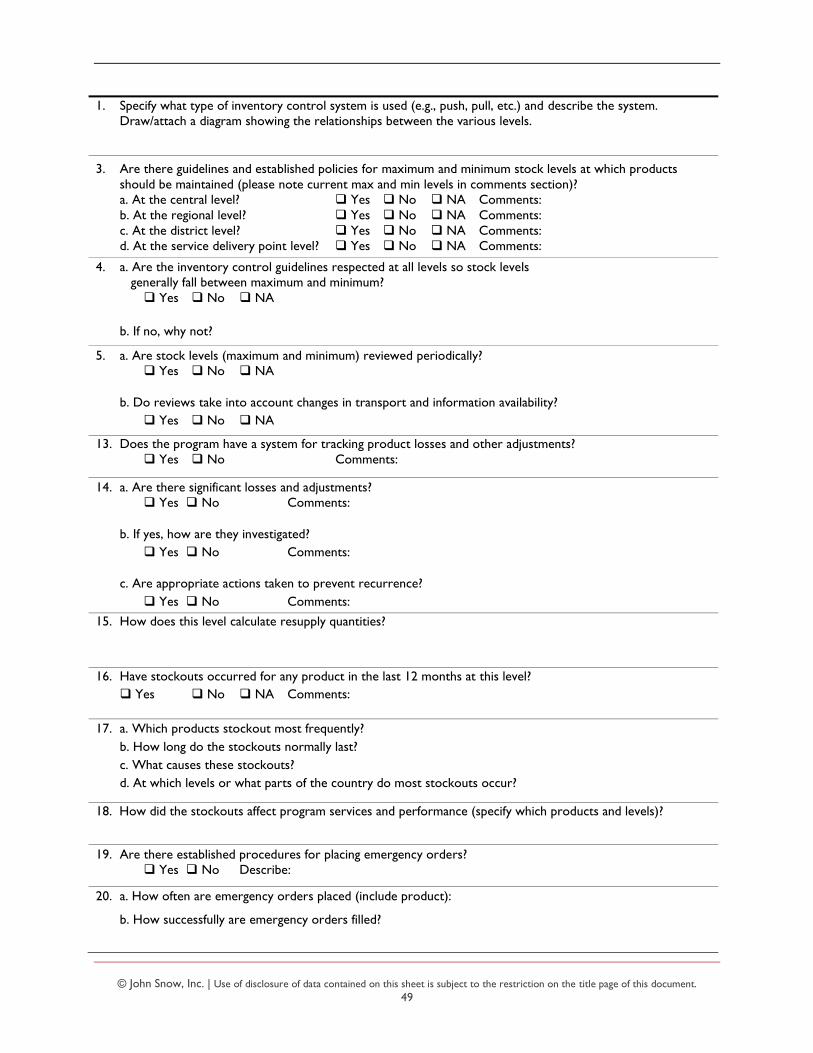
© John Snow, Inc. | Use of disclosure of data contained on this sheet is subject to the restriction on the title page of this document.
49
1. Specify what type of inventory control system is used (e.g., push, pull, etc.) and describe the system.
Draw/attach a diagram showing the relationships between the various levels.
3. Are there guidelines and established policies for maximum and minimum stock levels at which products
should be maintained (please note current max and min levels in comments section)?
a. At the central level? Yes No NA Comments:
b. At the regional level? Yes No NA Comments:
c. At the district level? Yes No NA Comments:
d. At the service delivery point level? Yes No NA Comments:
4. a. Are the inventory control guidelines respected at all levels so stock levels
generally fall between maximum and minimum? Yes No NA
b. If no, why not?
5. a. Are stock levels (maximum and minimum) reviewed periodically?
Yes No NA
b. Do reviews take into account changes in transport and information availability?
Yes No NA
13. Does the program have a system for tracking product losses and other adjustments?
Yes No Comments:
14. a. Are there significant losses and adjustments?
Yes No Comments:
b. If yes, how are they investigated?
Yes No Comments:
c. Are appropriate actions taken to prevent recurrence?
Yes No Comments:
15. How does this level calculate resupply quantities?
16. Have stockouts occurred for any product in the last 12 months at this level?
Yes No NA Comments:
17. a. Which products stockout most frequently?
b. How long do the stockouts normally last?
c. What causes these stockouts?
d. At which levels or what parts of the country do most stockouts occur?
18. How did the stockouts affect program services and performance (specify which products and levels)?
19. Are there established procedures for placing emergency orders?
Yes No Describe:
20. a. How often are emergency orders placed (include product):
b. How successfully are emergency orders filled?

© John Snow, Inc. | Use of disclosure of data contained on this sheet is subject to the restriction on the title page of this document.
50
21. Other comments on inventory control:
SECTION VII: Warehousing and Storage – For each parallel supply chain
Specify supply chain – Products managed, party managing it, geographic coverage, structure
1. Does the program have written guidelines for storage and handling of all products, at all levels of the system
(e.g., manuals, posters, etc.)? Yes No Comments:
2. Are there written guidelines for disposal of sharps, biohazardous material, and other medical waste?
Yes No Comments:
3. Does the program conduct at least one physical inventory of all products annually at storage facilities?
Yes No Comments:
4. Are there cold chain requirements in this supply chain?
Yes No NA Comments:
5. Are cold chain storage resources (e.g., refrigerator, paraffin/kerosene, and temperature chart) available at
this level of the system, where appropriate?
Yes No NA Comments:
6. How is the cold chain monitored to ensure that products are consistently maintained at appropriate
temperatures? (Check all that apply.)
written guidelines supervision
temperature log sheets other_____________________________
7. Is the existing storage capacity adequate to handle the current quantities of product?
Yes No NA Comments:
13. a. Is there a procedure for recording complaints about product quality?
Yes No Comments:
b. If yes, how are they handled?
14. Are visual quality assurance inspections of products conducted at the storage facility ?
Yes No How often? ________________________ Comments:
15. Are there written procedures or guidelines for destroying damaged and expired products?
Yes No Describe:
17. In practice, are damaged and expired products destroyed according to the program’s disposal guidelines?
Yes No NA Comments:
18. Describe notable problems encountered in the past year, if any, regarding wastage due to damage or
expirations. Please note product, level, location, approximate amount of goods, and actions taken.
19. Other comments on warehousing and storage:
SECTION VIII: Transport and Distribution – For each parallel supply chain
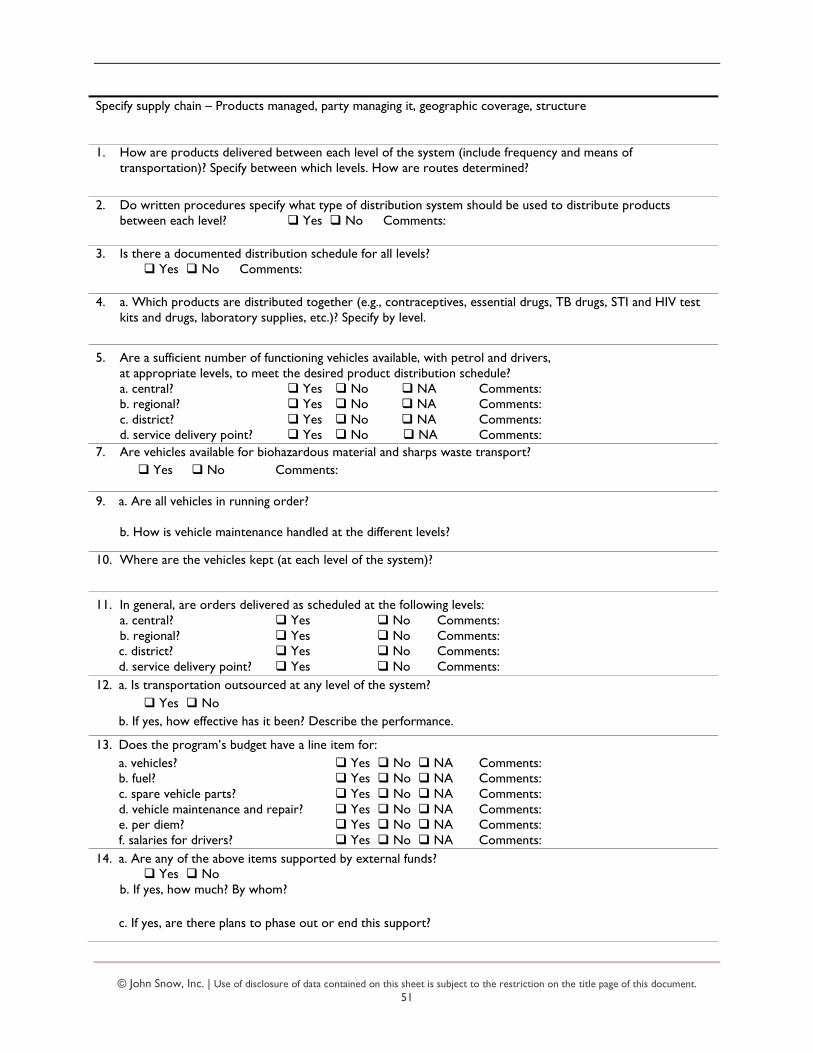
© John Snow, Inc. | Use of disclosure of data contained on this sheet is subject to the restriction on the title page of this document.
51
Specify supply chain – Products managed, party managing it, geographic coverage, structure
1. How are products delivered between each level of the system (include frequency and means of
transportation)? Specify between which levels. How are routes determined?
2. Do written procedures specify what type of distribution system should be used to distribute products
between each level? Yes No Comments:
3. Is there a documented distribution schedule for all levels?
Yes No Comments:
4. a. Which products are distributed together (e.g., contraceptives, essential drugs, TB drugs, STI and HIV test
kits and drugs, laboratory supplies, etc.)? Specify by level.
5. Are a sufficient number of functioning vehicles available, with petrol and drivers,
at appropriate levels, to meet the desired product distribution schedule?
a. central? Yes No NA Comments:
b. regional? Yes No NA Comments:
c. district? Yes No NA Comments:
d. service delivery point? Yes No NA Comments:
7. Are vehicles available for biohazardous material and sharps waste transport?
Yes No Comments:
9. a. Are all vehicles in running order?
b. How is vehicle maintenance handled at the different levels?
10. Where are the vehicles kept (at each level of the system)?
11. In general, are orders delivered as scheduled at the following levels:
a. central? Yes No Comments:
b. regional? Yes No Comments:
c. district? Yes No Comments:
d. service delivery point? Yes No Comments:
12. a. Is transportation outsourced at any level of the system?
Yes No
b. If yes, how effective has it been? Describe the performance.
13. Does the program’s budget have a line item for:
a. vehicles? Yes No NA Comments:
b. fuel? Yes No NA Comments:
c. spare vehicle parts? Yes No NA Comments:
d. vehicle maintenance and repair? Yes No NA Comments:
e. per diem? Yes No NA Comments:
f. salaries for drivers? Yes No NA Comments:
14. a. Are any of the above items supported by external funds?
Yes No
b. If yes, how much? By whom?
c. If yes, are there plans to phase out or end this support?
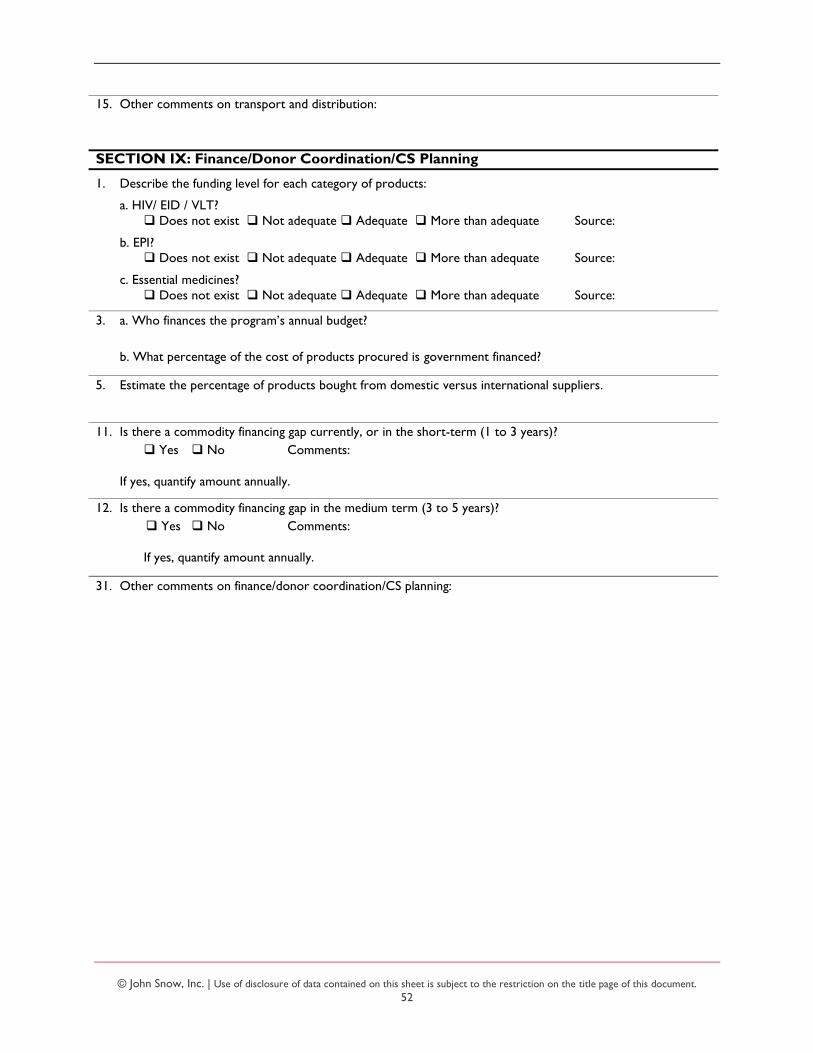
© John Snow, Inc. | Use of disclosure of data contained on this sheet is subject to the restriction on the title page of this document.
52
15. Other comments on transport and distribution:
SECTION IX: Finance/Donor Coordination/CS Planning
1. Describe the funding level for each category of products:
a. HIV/ EID / VLT?
Does not exist Not adequate Adequate More than adequate Source:
b. EPI?
Does not exist Not adequate Adequate More than adequate Source:
c. Essential medicines?
Does not exist Not adequate Adequate More than adequate Source:
3. a. Who finances the program’s annual budget?
b. What percentage of the cost of products procured is government financed?
5. Estimate the percentage of products bought from domestic versus international suppliers.
11. Is there a commodity financing gap currently, or in the short-term (1 to 3 years)?
Yes No Comments:
If yes, quantify amount annually.
12. Is there a commodity financing gap in the medium term (3 to 5 years)?
Yes No Comments:
If yes, quantify amount annually.
31. Other comments on finance/donor coordination/CS planning:

© John Snow, Inc. | Use of disclosure of data contained on this sheet is subject to the restriction on the title page of this document.
53
ANNEX C: KEY INFORMANTS
CAAM
Alfred Mtilatila Hastings Jailosi
CDC Malawi
Nicole Buono Henry Mbah Innocent Zungu
CHAI
Chris Mwase Andrews Gunda
CMST
Feston Kaupa Neema Kamuyango
GHSC-PSM
Phil Kamutega
Riders for Health
Mphatso Kachule Alice Mbozi
URC
Limbikani Kanyenda
VillageReach
Carla Blauvelt Matthew Ziba Charles Matemba
MBTS
Bridon Mbaya
MoH-EPI
Geoffrey Chirwa
MoH-HTSS
James Kandulu
MoH-HIV
Brown Chirandowra
MoH-Preventive Health Services
Mabvuto Chiwaula
MoH-TB
Isaias Dambe Ms. Miriam Mr. Bernard
MSH
Daniel Mangulu Miriam Kafunda Worried Gausi
UNICEF Malawi
Johannes Wedenig Judith Sherman Emmanuel Saka Sam Chirwa
USAID
Lumbani Makwakwa Abu Ugbede
Site Visits
Mzuzu Central Hospital
Dokani Ndovi John Kaunda Ian Kambwani Master Chisale
Nkhata Bay Hospital
Bonnifacio Ndovi Patrick Kalengo Kondwani Shaba Happy Nyirenda
Chitheka Health Center
Esau Mphande
Kavuzi Health Center
Yotam Ngoma Glory Mkhuta
Khondowe Health Center
Raydings Kaunda Osward Mphande Lupakisko Mkulechi
Likoma Island DHO
David Sibale
Ruware Health Center
Paul Kabuzi
Usisya Health Center
Roosevelt Njeghenje
Chinteche Rural Hospital
Harriet Amon Bright Jere Alex Rodgers Juliet Phiri Andrew Nantenga
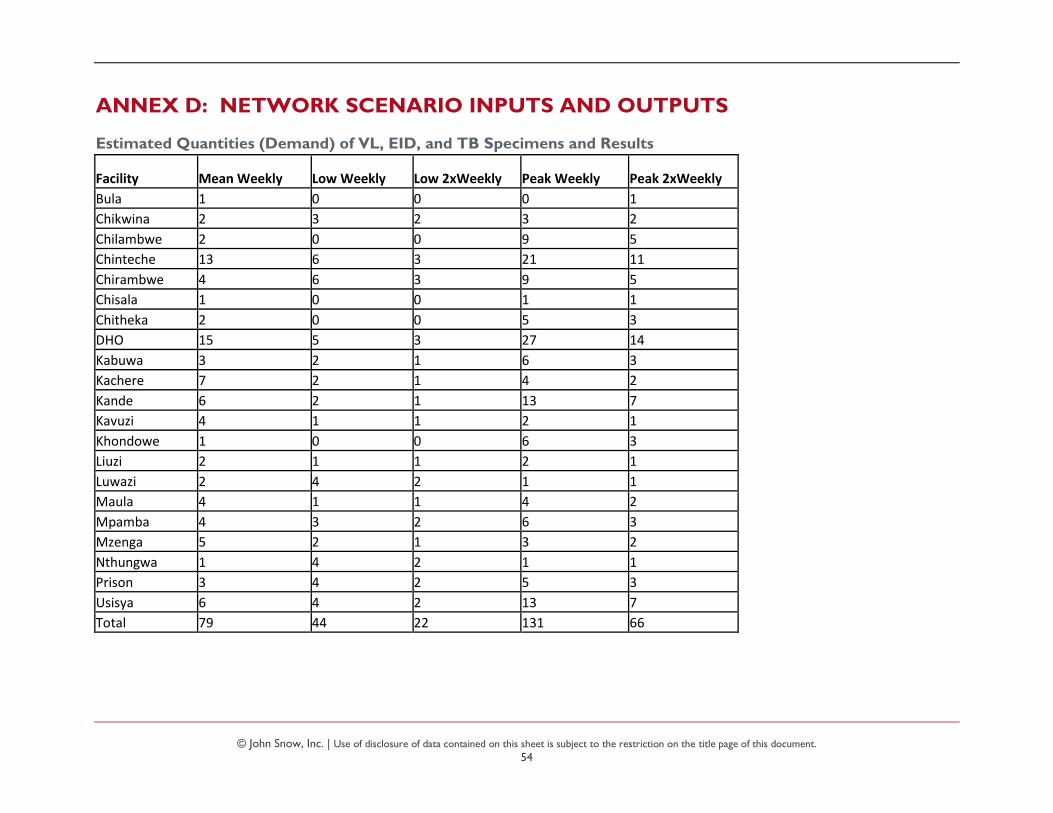
© John Snow, Inc. | Use of disclosure of data contained on this sheet is subject to the restriction on the title page of this document.
54
ANNEX D: NETWORK SCENARIO INPUTS AND OUTPUTS
Estimated Quantities (Demand) of VL, EID, and TB Specimens and Results
Facility Mean Weekly Low Weekly Low 2xWeekly Peak Weekly Peak 2xWeekly
Bula 1 0 0 0 1
Chikwina 2 3 2 3 2
Chilambwe 2 0 0 9 5
Chinteche 13 6 3 21 11
Chirambwe 4 6 3 9 5
Chisala 1 0 0 1 1
Chitheka 2 0 0 5 3
DHO 15 5 3 27 14
Kabuwa 3 2 1 6 3
Kachere 7 2 1 4 2
Kande 6 2 1 13 7
Kavuzi 4 1 1 2 1
Khondowe 1 0 0 6 3
Liuzi 2 1 1 2 1
Luwazi 2 4 2 1 1
Maula 4 1 1 4 2
Mpamba 4 3 2 6 3
Mzenga 5 2 1 3 2
Nthungwa 1 4 2 1 1
Prison 3 4 2 5 3
Usisya 6 4 2 13 7
Total 79 44 22 131 66

© John Snow, Inc. | Use of disclosure of data contained on this sheet is subject to the restriction on the title page of this document.
55
Emergency/ Long Tail Items Included in Analysis Estimated Shipment Sizes (cm3 and kg)
Facility Name Total Volume
Total Weight
Weekly Volume
Weekly Weight
Bula HC 7275 3.9 240 0.1
Chikwina HC 2435 2.4 81 0.1
Chintheche Rural Hospital 53600 15.4 1768 0.5
Chisala HC 10345 6.1 342 0.2
Chitheka Hc 18175 9.3 600 0.3
Kachere HC 8520 5.9 281 0.2
Kande HC 2070 1.3 69 0.0
Khondowe HC 1500 0.4 50 0.0
Liuzi HC 35320 13.6 1165 0.4
Maula HC 3010 1.1 100 0.0
Mpamba HC 40070 16.3 1321 0.5
Mzenga HC 2840 0.9 94 0.0
Nthungwa HC 340 0.1 12 0.0
Tchesamu HC 1500 0.4 50 0.0
Usisya HC 12100 4.2 399 0.1
Product Number Product Name
Unit of Measure
Unit Vol (cm
3)
Unit Wt (kg)
AA012600 Carbamazepine 200mg, tablets 1000 1185 0.29
AA042000 Metformin hydrochloride 500mg, tablets 1000 1940 0.64
AA046500 Nifedipine 20mg (slow release), tablets 100 230 0.03
AA050400 Phenytoin sodium 100mg, coated tablets 1000 980 0.39
AA054000 Promethazine hydrochloride 25mg, coated tablets 1000 570 0.28
AA054950 Pyridoxine (Vitamin B6) 20mg, tablets 100 108 0.033
AA055200 Pyridoxine (Vitamin B6) 25mg, tablets 1000 335 1.74
AA055800 Quinine sulphate 300mg, sugar coated tablets 1000 2100 0.7
BB004500 Aminophylline 25mg/ml, 10ml Each 60 0.02
BB042900 Insulin soluble 100 IU/ml, 10ml Each 80 0.03
BB043200 Insulin zinc suspension (lente) 100 IU/ml, 10ml Each 80 0.03
BB063900 Phytomenadione 2mg/ml, 1ml (Vitamin K) Each 15 0.004
BB066900 Promethazine hydrochloride 25mg/ml, 2ml Each 34 0.008
CC001500 Rabies vaccine course, (1x 5, 0.5ml/dose PFR and 1x5 vials d Each 293 0.08
EE033900 Oral rehydration salt, 20.5g satchet (WHO formula) for 1L so Each 76 0.03
EE038100 Povidone iodine 10% in alcoholic solution, 500ml Each 1035 0.641
Source: CMST
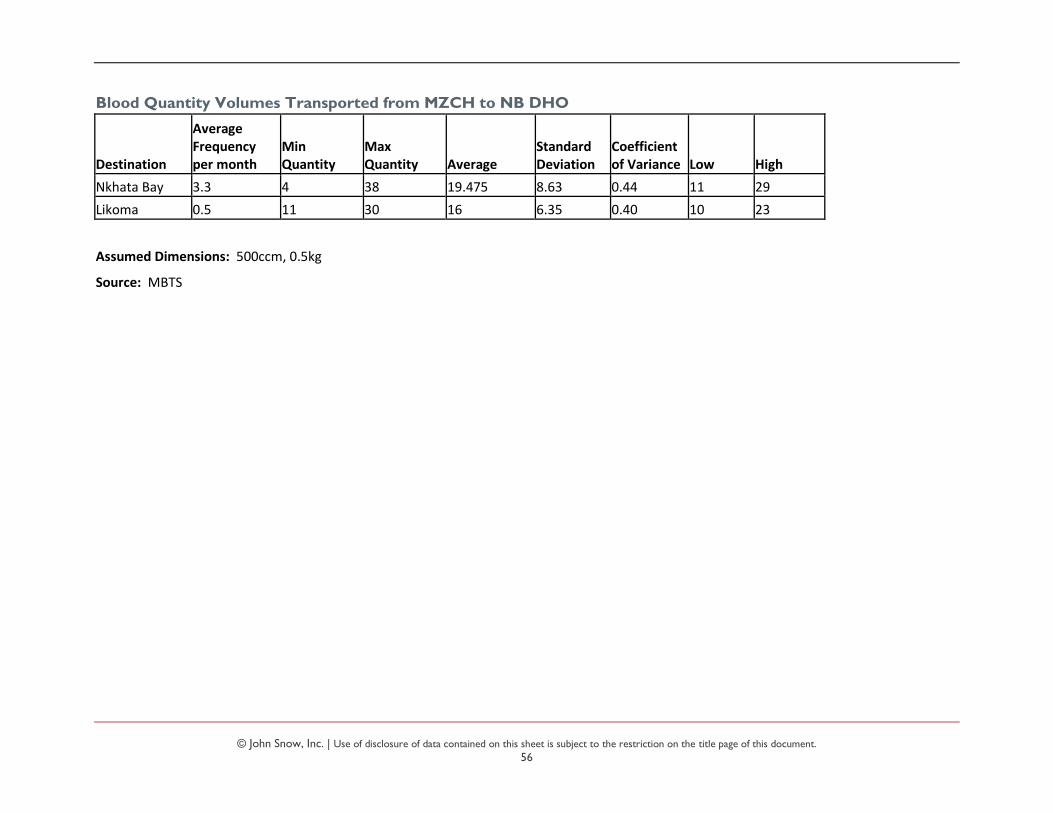
© John Snow, Inc. | Use of disclosure of data contained on this sheet is subject to the restriction on the title page of this document.
56
Blood Quantity Volumes Transported from MZCH to NB DHO
Destination
Average Frequency per month
Min Quantity
Max Quantity Average
Standard Deviation
Coefficient of Variance Low High
Nkhata Bay 3.3 4 38 19.475 8.63 0.44 11 29
Likoma 0.5 11 30 16 6.35 0.40 10 23
Assumed Dimensions: 500ccm, 0.5kg
Source: MBTS
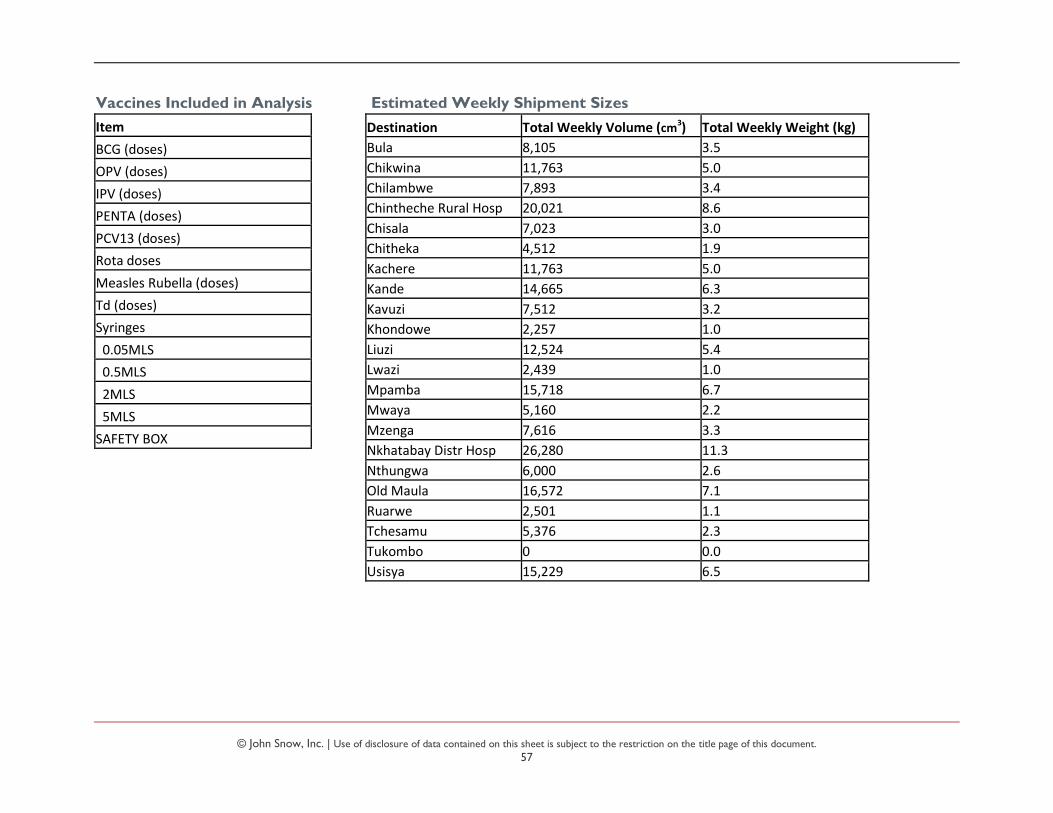
© John Snow, Inc. | Use of disclosure of data contained on this sheet is subject to the restriction on the title page of this document.
57
Vaccines Included in Analysis Estimated Weekly Shipment Sizes
Destination Total Weekly Volume (cm3) Total Weekly Weight (kg)
Bula 8,105 3.5
Chikwina 11,763 5.0
Chilambwe 7,893 3.4
Chintheche Rural Hosp 20,021 8.6
Chisala 7,023 3.0
Chitheka 4,512 1.9
Kachere 11,763 5.0
Kande 14,665 6.3
Kavuzi 7,512 3.2
Khondowe 2,257 1.0
Liuzi 12,524 5.4
Lwazi 2,439 1.0
Mpamba 15,718 6.7
Mwaya 5,160 2.2
Mzenga 7,616 3.3
Nkhatabay Distr Hosp 26,280 11.3
Nthungwa 6,000 2.6
Old Maula 16,572 7.1
Ruarwe 2,501 1.1
Tchesamu 5,376 2.3
Tukombo 0 0.0
Usisya 15,229 6.5
Item
BCG (doses)
OPV (doses)
IPV (doses)
PENTA (doses)
PCV13 (doses)
Rota doses
Measles Rubella (doses)
Td (doses)
Syringes
0.05MLS
0.5MLS
2MLS
5MLS
SAFETY BOX
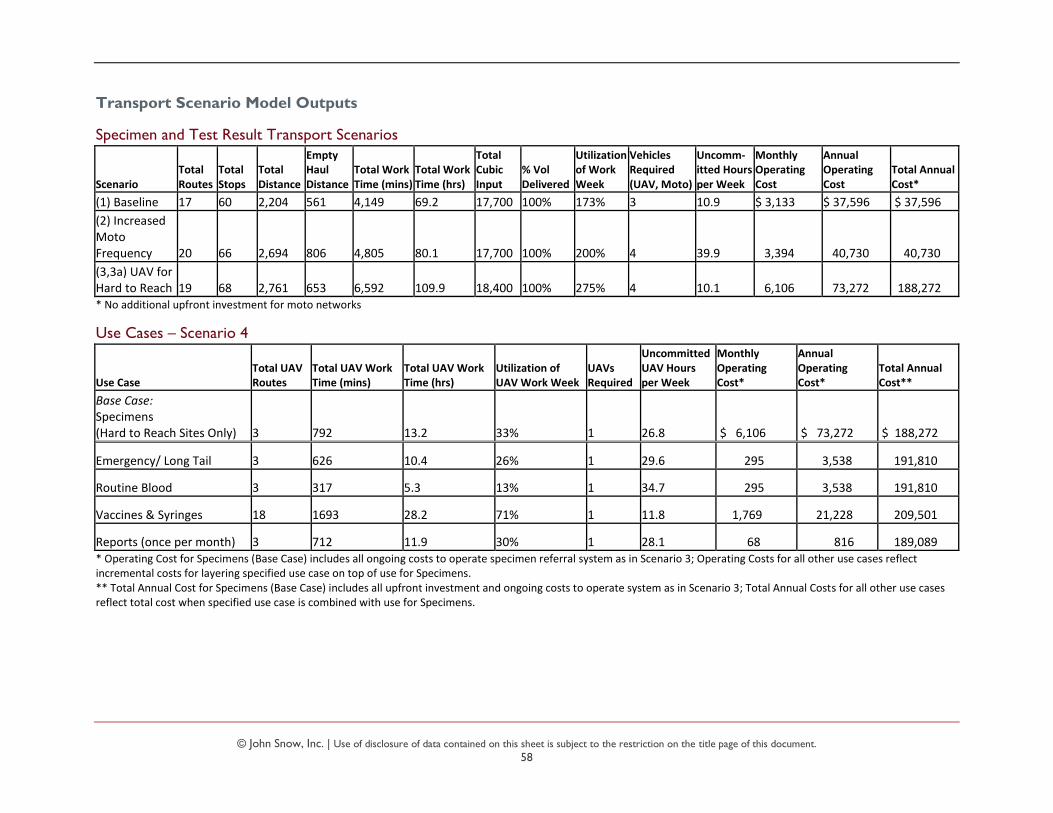
© John Snow, Inc. | Use of disclosure of data contained on this sheet is subject to the restriction on the title page of this document.
58
Transport Scenario Model Outputs
Specimen and Test Result Transport Scenarios
Scenario Total Routes
Total Stops
Total Distance
Empty Haul Distance
Total Work Time (mins)
Total Work Time (hrs)
Total Cubic Input
% Vol Delivered
Utilization of Work Week
Vehicles Required (UAV, Moto)
Uncomm-itted Hours per Week
Monthly Operating Cost
Annual Operating Cost
Total Annual Cost*
(1) Baseline 17 60 2,204 561 4,149 69.2 17,700 100% 173% 3 10.9 $ 3,133 $ 37,596 $ 37,596
(2) Increased Moto Frequency 20 66 2,694 806 4,805 80.1 17,700 100% 200% 4 39.9 3,394 40,730 40,730
(3,3a) UAV for Hard to Reach 19 68 2,761 653 6,592 109.9 18,400 100% 275% 4 10.1 6,106 73,272 188,272 * No additional upfront investment for moto networks
Use Cases – Scenario 4
Use Case Total UAV Routes
Total UAV Work Time (mins)
Total UAV Work Time (hrs)
Utilization of UAV Work Week
UAVs Required
Uncommitted UAV Hours per Week
Monthly Operating Cost*
Annual Operating Cost*
Total Annual Cost**
Base Case: Specimens (Hard to Reach Sites Only) 3 792 13.2 33% 1 26.8 $ 6,106 $ 73,272 $ 188,272
Emergency/ Long Tail 3 626 10.4 26% 1 29.6 295 3,538 191,810
Routine Blood 3 317 5.3 13% 1 34.7 295 3,538 191,810
Vaccines & Syringes 18 1693 28.2 71% 1 11.8 1,769 21,228 209,501
Reports (once per month) 3 712 11.9 30% 1 28.1 68 816 189,089 * Operating Cost for Specimens (Base Case) includes all ongoing costs to operate specimen referral system as in Scenario 3; Operating Costs for all other use cases reflect incremental costs for layering specified use case on top of use for Specimens. ** Total Annual Cost for Specimens (Base Case) includes all upfront investment and ongoing costs to operate system as in Scenario 3; Total Annual Costs for all other use cases reflect total cost when specified use case is combined with use for Specimens.

© John Snow, Inc. | Use of disclosure of data contained on this sheet is subject to the restriction on the title page of this document.
59