Embed Size (px)
Citation preview

Health in the Workplace, National Football CentreJune 29th, 2015

39.1%
Male deaths – under 75
25.0%
Female deaths – under 75
Source: ONS 2014

19.6%
Male deaths – under 65
12.0%
Female deaths – under 65
Source: ONS 2014

273 884 3,458 10,284
30,990
81,066
111,553
203 509 1,690 6,561
21,550
61,533
165,737
-
20,000
40,000
60,000
80,000
100,000
120,000
140,000
160,000
180,000
1-4 years 5-19 years 20-34 years 35-49 years 50-65 years 65-79 years 80+ years
Number of male and female deaths by age
Men Women
Source: 2012 Mortality Statistics. ONS 2013

64.0
66.0
68.0
70.0
72.0
74.0
76.0
78.0
80.0
82.0
84.0
Life Expectancy at Birth – 1980-2012
Male Female
Male
Female
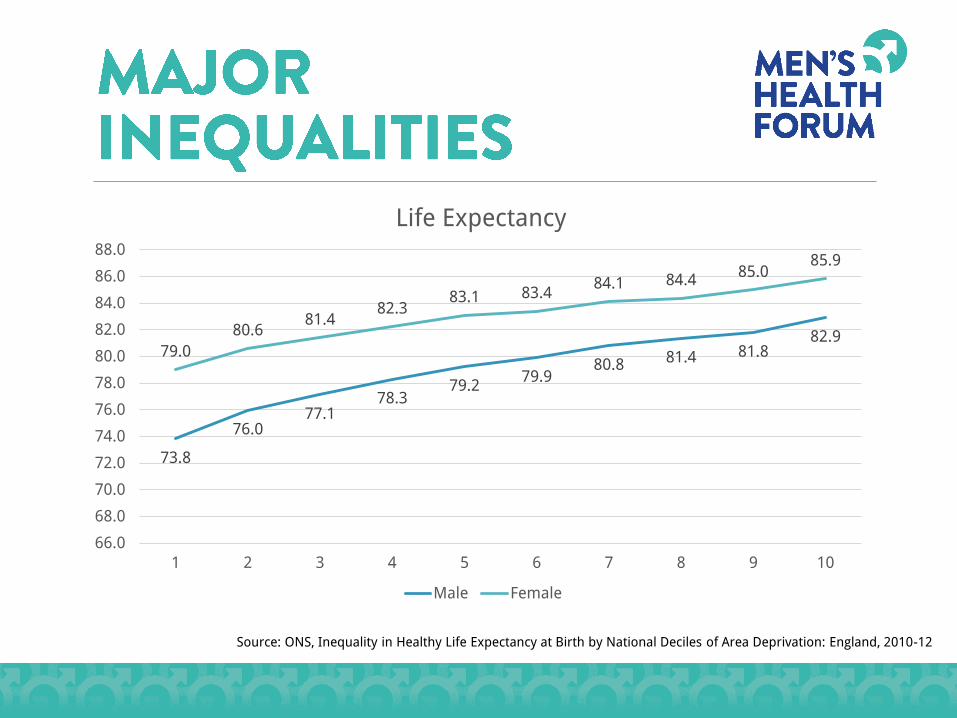
73.8
76.077.1
78.379.2
79.980.8 81.4 81.8
82.979.0
80.681.4
82.383.1 83.4
84.1 84.485.0
85.9
66.0
68.0
70.0
72.0
74.0
76.0
78.0
80.0
82.0
84.0
86.0
88.0
1 2 3 4 5 6 7 8 9 10
Life Expectancy
Male Female
Source: ONS, Inequality in Healthy Life Expectancy at Birth by National Deciles of Area Deprivation: England, 2010-12

79.1
74.0
82.9 83.0
79.5
86.6
66.0
68.0
70.0
72.0
74.0
76.0
78.0
80.0
82.0
84.0
86.0
88.0
England Blackpool / Manchester East Dorset / Purbeck
Life Expectancy at birth – 2010-12
Men Women
Source: ONS

3,130
2,335
981
1,746
2,004
804
0
500
1,000
1,500
2,000
2,500
3,000
3,500
Circulatorydiseases
Cancer Respiratorydiseases
Male
2002 2012
1,945
1,635
675
1,118
1,471
581
0
500
1,000
1,500
2,000
2,500
3,000
3,500
Circulatorydiseases
Cancer Respiratorydiseases
Female
2002 2012
Source: ONS Age-standardised mortality rates (ASMRs) per million population

Male71%
Female29%
CVD deaths under 65
0
5,000
10,000
15,000
20,000
25,000
30,000
35,000
40,000
45,000
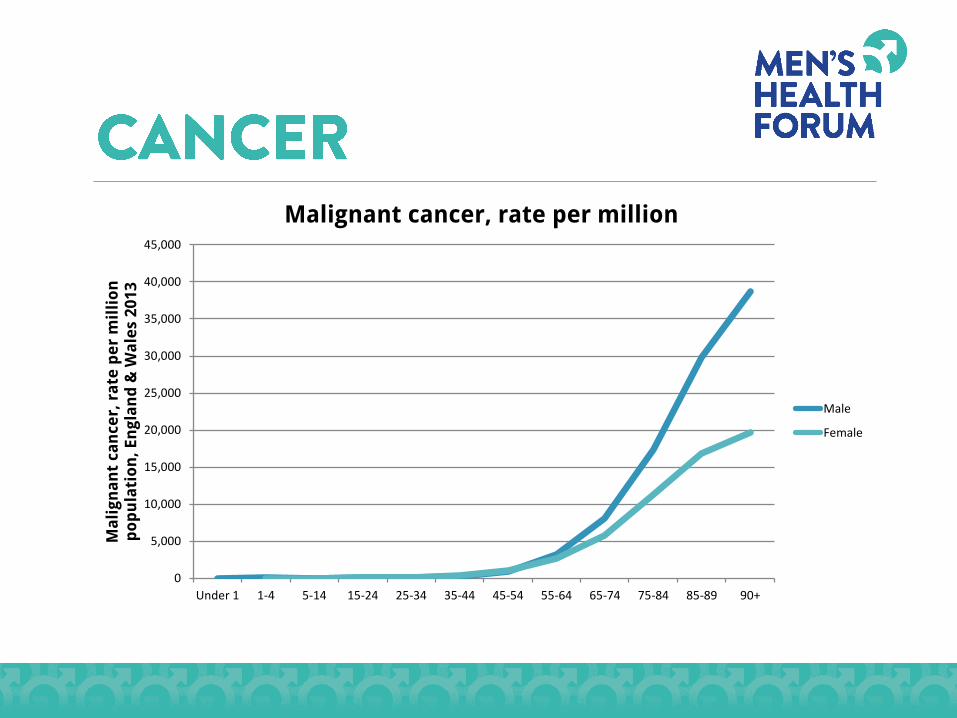
Under 1 1-4 5-14 15-24 25-34 35-44 45-54 55-64 65-74 75-84 85-89 90+
Ma
lig
na
nt
can
cer,
ra
te p
er
mil
lio
n
po
pu
lati
on
, E
ng
lan
d &
Wa
les
20
13
Malignant cancer, rate per million
Male
Female

2.89
1.65 1.58 2.01
1.70 1.92
1.53 1.62 1.42 1.54
2.89
1.27
2.21
-
0.50
1.00
1.50
2.00
2.50
3.00
3.50
Male to female cancer mortality ratio (all ages)
Source: CRUK, Mortality rate ratios are European age-standardised, of male to female cancer mortality (excluding NMSC), UK, 2010.
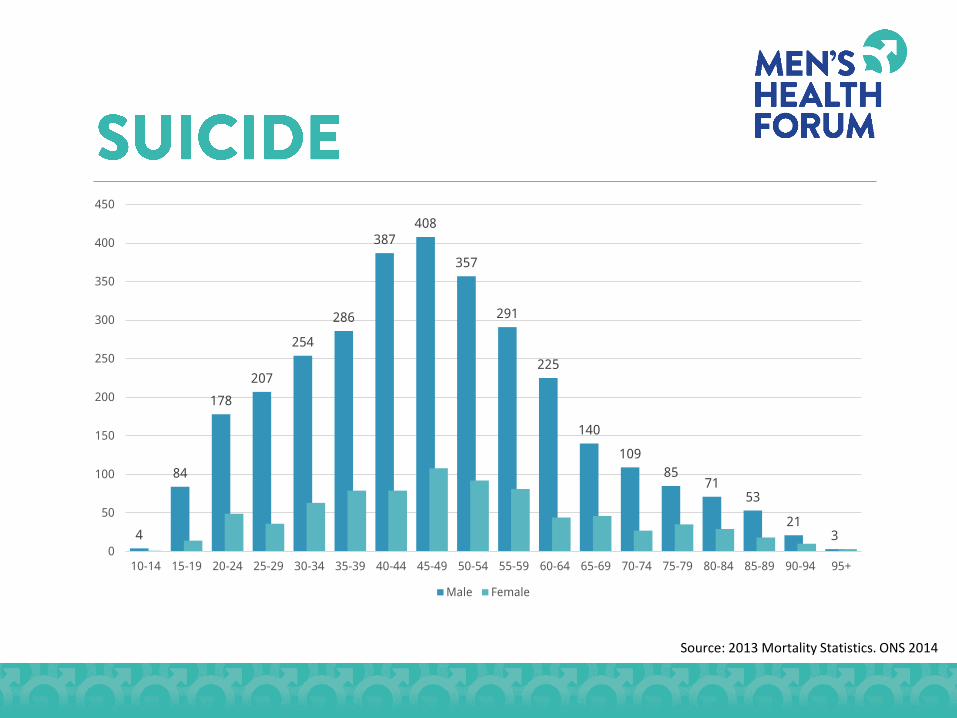
4
84
178
207
254
286
387408
357
291
225
140
109
8571
53
213
0
50
100
150
200
250
300
350
400
450
1014 15-19 20-24 25-29 30-34 35-39 40-44 45-49 50-54 55-59 60-64 65-69 70-74 75-79 80-84 85-89 90-94 95+
Male Female
Source: 2013 Mortality Statistics. ONS 2014

0%
1%
1%
2%
2%
2%
3%
4%
5%
6%
9%
10%
10%
10%
19%
54%
0% 10% 20% 30% 40% 50% 60%
Alzheimer's disease or dementia
Blindness or severe visual impairment
Epilepsy
Kidney or liver disease
Learning difficulty
Long-term neurological problem
Cancer in the last 5 years
Deafness or severe hearing impairment
Long-term mental health problem
Angina or long-term heart problem
Diabetes
Long-term back problem
Asthma or long-term chest problem
Arthritis or long-term joint problem
High blood pressure
[Combined LTCs]
Source: GP Patient Survey, July 2014

40% Full-time paid work (30 hours or more each
week)
53% Part-time paid work (under 30 hours each week)
30% Full-time education at school, college or university
60% Unemployed
99% Permanently sick or disabled
84% Fully retired from work62% Looking after the home
53% Doing something else
Source: GP Patient Survey, July 2014

You should probably have come a little
earlier

Wang Y et al. BMJ Open 2013;3:e003320©2013 by British Medical Journal Publishing Group

2,587
11,573
530
1,546664
7,449
757
5,183
2,000
4,000
6,000
8,000
10,000
12,000
14,000
Self-employedfull-time
Employee full-time
Self-employedpart-time
Employed part-time
‘000
Men Women
Source: ONS, Labour Force Survey, UK, Feb-Apr 2014

800
155
0
100
200
300
400
500
600
700
800
900
Men Women
Extra deaths by suicide during 2008-2010 recession years
2014 DH suicide strategy report

Rate of Heart Attack over time, by Employment Status
Du
pre
et
al, 2
01
2, T
he
Cu
mu
lati
ve E
ffe
ct o
f U
ne
mp
loym
en
t o
n R
isks
fo
r A
cute
Myo
card
ial I
nfa
rcti
on
. Arc
h I
nte
rn M
ed
. 2
01
2;1
72
(22
):1
73
1-1
73
7.

24.4
66.6
25.1
57.2
0.0
10.0
20.0
30.0
40.0
50.0
60.0
70.0
80.0
1993 1994 1995 1996 1997 1998 1999 2000 2001 2002 2003 2004 2005 2006 2007 2008 2009 2010 2011 2012
Men - Obese Men - Overweight including obese
Women - Obese Women - Overweight including obese

2217
0
10
20
30
40
50
60
1970 1975 1980 1985 1990 1995 2000 2005 2010 2015
GB Smoking Rates
Men Women

0
10,000
20,000
30,000
40,000
50,000
60,000
Under 16 16 to 24 25 to 34 35 to 44 45 to 54 55 to 64 65 to 74 75+
Alcohol-related NHS hospital admissions (wholly attributable to alcohol)
Male Female
Ho
spit
al E
pis
od
e St
atis
tics
, Hea
lth
an
d S
oci
al C
are
Info
rmat
ion
Cen
tre,
En
glan
d -
Dat
a fo
r to
tal n
um
ber
o
f ad
mis
sio
ns
for
each
ICD
-10
co
de.
20
12
/13

64%
55%
25%
5%
49%
37%
14%
22%
59%
54%
75%
72%
82%
34%
64%
51%
5%
48%
33%
71%
0% 20% 40% 60% 80% 100%
Arthritis
Bowel cancer
Breast cancer
Cervical cancer
Dementia
Lung cancer
None of the above
Osteoporosis
Prostate cancer
Skin cancer
Which of the following conditions, if any, do you think you know the symptoms of?
Male Female
Lower claimed symptom awareness
Populus survey on behalf of Saga – August 2013 – 11,729 men and women 50+

13%
23%
0%
5%
10%
15%
20%
25%
Total Usage of NHS Choices
Male Female
Base: All adults 16+ in England, NHS Choices Omnibus, January 2014

69,245avoidable deaths


One man in five dies before 65. Together we can change that