Embed Size (px)
Citation preview

Dr. Md.Toufiqur Rahman
MBBS, FCPS, MD, FACC, FESC, FRCPE, FSCAI,
FAPSC, FAPSIC, FAHA, FCCP, FRCPG
Associate Professor of Cardiology
National Institute of Cardiovascular Diseases(NICVD),
Sher-e-Bangla Nagar, Dhaka-1207
Consultant, Medinova, Malibagh branch
Honorary Consultant, Apollo Hospitals, Dhaka and
STS Life Care Centre, Dhanmondi [email protected]
Arterial Blood Gas Analysis
CRT 2014Washington DC, USA

HISTORY
The first arterial puncture was performed in 1912 by Hurter, a German physician.
Employing Hurter’s radial artery puncture technique, W.C.Stadie measured oxygen saturation in patients with pneumonia and showed that cyanosis of critically ill patients resulted from incomplete oxygenation of hemoglobin (Stadie 1919).

Over the next 40 years blood gas measurements were more of a laboratory research tool.
It was not until the 1950s that electrodes were developed that could rapidly and reproducibly measure PaO2, PaCO2 and pH.
In 1953 Leland Clark invented the platinum oxygen electrode, a prototype that evolved into the first modern blood gas electrode(Clark 1953,Clark1957).
HISTORY

Development of commercially viable pH and PCO2 electrodes soon followed and by the mid -1960s several university centers were able to provide pH, PaCO2 and PaO2 measurements on arterial blood.
In 1973 the first commercially available automated blood gas machine was introduced (ABLI from Radiometer), and this was soon followed by machines from other companies (Severinghaus 1986 ).
HISTORY

Recent Developments
Non invasive measurements are now available for some of the results of ABG; Pulse Oximeter for SpO2
End tidal Gas analysis for PCO2
In Neonates and children skin electrodes for measuring PO2 & PCO2 have found wide application.
Now devices are being developed for continuous blood gases with fiber optic intra arterial sensors
With these improvements the ABG measurements of shifted from the experimental and developmental stages into clinical arena.
ABG is probably the single most useful test for pulmonary function, as arterial levels of O2, CO2, & pH reflect the end result of ventilation perfusion & gas exchange.
Recent Developments

Information Obtained from an ABG:Acid base statusOxygenation
Dissolved O2 (pO2)Saturation of hemoglobin
CO2 eliminationLevels of carboxyhemoglobin and methemoglobin

Indications of ABG
1. Routine in all cases of Open-heart surgery
2. Patient under mechanical ventilation 3. In case of thoracic trauma or
underlying lung contusion ABG determines where ventilator is
required or not.

4. Integral part in he management of premature neonates.
5. To determine acidosis or alkalosis, whether these are respiratory or metabolic.
6. In a hypoxaemic patient due to any cause.
Indications of ABG
Contraindications:Bleeding diathesisAV fistulaSevere peripheral vascular disease, absence of
an arterial pulseInfection over site

Which Artery to Choose?The radial artery is superficial, has collaterals and
is easily compressed. It should almost always be the first choice.
Other arteries (femoral, dorsalis pedis, brachial) can be used in emergencies.


Specimen collection
Arterial bloods are obtained from any Arterial sources, (usually radial, brachial or femoral).
If multiple samples are to be drawn over a period time (as in case of cardiac surgery) an indwelling arterial line is placed, which is perfused with heparinised saline to prevent thrombus formation.
Arterial punctures are painful & result hyperventilation. Use of L/A can result more patient comfort & accurate data.

Blood specimen are best collected in the heparinized glass syringe. Heparine is used to displace the air form the syringe & no air should be permitted to enter the syringe during collection.
Ideally sample should be analysed straight away. Otherwise it can be capped & stored in crushed ice.
Specimen collection

Storage at room temp. results rise in PCO2 & fall in pH & PO2 due to blood metabolism.
Capillary samples are used from finger. Heel, ear lobe. PCO2 & pH results on capillary blood are close to those of arterial blood taken at the same time. The PO2 is less reliable.
Specimen collection

Why an ABG instead of Pulse oximetry?
Pulse oximetry uses light absorption at two wavelengths to determine hemoglobin saturation.
Pulse oximetry is non-invasive and provides immediate and continuous data.

Collection Problems:Type of syringe
Plastic vs. glassUse of heparinAir bubblesSpecimen handling and transport
Type of SyringeGlass-
Impermeable to gasesExpensive and impractical
Plastic-Somewhat permeable to gasesDisposable and inexpensive

Why an ABG instead of Pulse oximetry?Pulse oximetry does not assess ventilation
(pCO2) or acid base status.Pulse oximetry becomes unreliable when
saturations fall below 70-80%.Technical sources of error (ambient or
fluorescent light, hypoperfusion, nail polish, skin pigmentation)
Pulse oximetry cannot interpret methemoglobin or carboxyhemoglobin.

One blood sample & Two sets of tests
One Blood sampleBlood gas refers to any element or compound
that is a gas under ordinary condition and that is also dissolved to some extant in our blood.
Not all blood gases are routinely measured & not all blood gas measurements are of true blood gases. CO2 & O2 are routinely measured as their partial pressure PaCO2 & PaO2.
CO is measured as %COHb, N2, Helium & others are not measured at all
Two sets of testsAll blood gas machine to measure pH, PaCO2 & PaO2 and
to calculate HCO3 value.A co-oximeter can measure Hb content and values related
to Hb binding; SaO2 %COHb, & %MetHb. From this information the atrerial O2 content (CaO2) can be calculated
The one vs two machine arrangement is the case in most
laboratories.However newer technology now ncorporates
both machine within a single console so that both sets of
measurements (Blood gas & co-oximetery) can be made
from a single entered sample.

Normal ABG Values pH 7.35-7.45PaCO2 35-45 mmHg.
PaO2 70-100 mmHg.
SaO2 93-98%
HCO3- 22-26 mEq/L
%metHb <2%%COHb <3%BE +2 mEq/LCaO2 16-22 ml O2/dl

Electrolyte MeasurementsOver the past decade many blood gas labs
have taken-on an additional task; measuring electrolytes in the arterial sample (Na+, K+, Cl-, HCO3
- & Ca++Mg++)Electrolytes measurement acts as an aid to
understanding Acid-Base status.

What Other information is needed to interpret blood gas data?
Information about the patients immediate environment FIO2, PB
Additional Lab data, for examplePrevious ABG report, electrolytes, blood sugar, BUNHb% or HCTCXR & pulmonary function test
Clinical information, including history & clinical exam.Respiratory rate & Other vital signs, Degree of respiratory effort, mental status & state of
tissue perfusion.

How much physiology do you need to know for proper ABG interpretation?
Knowledge of some basic pulmonary physiology is crucial for understanding ABG data.
There are three physiologic processes and four equations important in interpretation of ABG.

Equation Physiologic Process
1. PaCO2 Alveolar ventilation
2. Alveolar gas equation Oxygenation3. O2 content equation Oxygenation
4. Henderson-Hasselbach Acid-Base balance equation

THE FOUR MOST IMPORTANT EQUATIONS IN CLINICAL PRACTICE
Equation Title
Complete Equation Abbreviation Sufficient for Most Clinical Applications
PCO 2
equation
PACO2=VCO2 x 0.863 / VA
where VA=VE-VDPaCO2 ~ VCO2 / VA
Henderson- Hasselbalch equation
pH=pK + log HCO3- /
0.03(PaCO2)pH ~ HCO3
- / PaCO2
Alveolar gas equation
PAO2=FIO2(PB-PH2O) --
PACO2[FIO2 + (1-FIO2) / R]
PAO2=FIO2(PB-47)-
1.2(PaCO2)
Oxygen content equation
CaO2=(SaO2 x Hb x 1.34) + .003(PaO2)
Where: 1.34=ml O2/gram Hb
.003=ml O2/mm Hg PaO2/dl
Hb=content in grams/dl
CaO2=SaO2 x 1.34 x Hb

PaCO2 and alveolar ventilation
PaCO2
(mmHg)
Condition in Blood
State of alveolar ventilation
>45 Hypercapnia Hypoventilation
35-45 Eucapnia Normal Ventilation
<35 Hypocapnia Hyperventilation

The PCO2 equation puts into physiologic perspective one of the most common of all clinical observations: a patient's respiratory rate and breathing effort. The equation states that alveolar PCO2 (PACO2) is directly proportional to the amount of CO2 produced by metabolism and delivered to the lungs (VCO2) and inversely proportional to the alveolar ventilation (VA). While the derivation of the equation is for alveolar PCO2, its great clinical utility stems from the fact that alveolar and arterial PCO2 can be assumed to be equal. Thus:
PCO2=VCO2 x 0.863 / VA
where VA=VE-VD

The constant 0.863 is necessary to equate dissimilar units for VCO2 (ml/min) and VA (L/min) to PACO2 pressure units (mm Hg). Alveolar ventilation is the total amount of air breathed per minute (VE; minute ventilation) minus that air which goes to dead space per minute (VD). Dead space includes all airways larger than alveoli plus air entering alveoli in excess of that which can take part in gas exchange.
Even when alveolar and arterial PCO2 are not equal (as in states of severe ventilation-perfusion imbalance), the relationship expressed by the equation remains valid:
PaCO2 ~ VCO2 / VA

PaCO2 vs. alveolar ventilation (VA).The relationship is shown for carbonDioxide production rates of 200
l/minand 300 ml/min. Changes in PaCO2
Are shown for a one liter decreaseShort Horizontal lines) in VAstarting at two Different PaCO2
values, 30 and 60 mm Hg. A decrease
in alveolar ventilation in thehypercapnic patient will result in aGreater rise in PaCO2 than will thesame VA change when PaCO2 is lowor normal. Also, note that an
increasein carbon dioxide production whenVA is fixed will result in an increasein PaCO2

PaO2 & Alveolar-Arterial PO2
difference
The alveolar gas equation for calculating PAO2 is essential to understanding any PaO2 value and in assessing if the lungs are properly transferring oxygen into the blood. Is a PaO2 of 28 mm Hg abnormal? How about 55 mm Hg? 95 mm Hg? To clinically interpret PaO2 one has to also know the patient's PaCO2, FIO2 (fraction of inspired oxygen) and the PB (barometric pressure), all components of the equation for PAO2:
1-FIO2
PAO2 = FIO2(PB-PH20) - PACO2[FIO2 + ------------- ] R

The abbreviated equation below is useful for clinical purposes; in this version alveolar PO2 equals inspired PO2 (PIO2) minus arterial PCO2 x 1.2, assuming the R value is 0.8 (and assuming identical values for arterial and alveolar PCO2). Water vapor pressure in the airways is dependent only on body temperature and is 47 mm Hg at normal body temperature (37 degrees C).
PAO2 = FIO2(PB-47) - 1.2(PaCO2)

Ambient FIO2 is the same at all altitudes, 0.21. It is usually not necessary to measure PB if you know its approximate average value where the blood was drawn
If PIO2 is held constant and PaCO2 increases, PAO2 and PaO2 will always decrease.

The alveolar-arterial PO2 difference, notated P(A-a)O2, varies normally with age and FIO2. Up to middle age, breathing ambient air, normal P(A-a)O2 ranges between 5 and 20 mm Hg. Breathing an FIO2 of 1.0 the normal P(A-a)O2 ranges up to about 110 mm Hg
If P(A-a)O2 is increased above normal there is a defect of gas transfer within the lungs; this defect is almost always due to V-Q imbalance.

Because of several assumptions in clinical use of the alveolar gas equation, precision in calculating PAO2 is not achievable. Fortunately an estimate of P(A-a) O2 is usually sufficient for clinical purposes.
Since oxygen enters the pulmonary capillary blood by passive diffusion, it follows that in a steady state the alveolar PO2 must always be higher than the arterial PO2

Physiologic causes of Low PaO2
Respiratory cause Effects on
P(A-a)O2 PaO2/FIO2
Pulmonary R-L shunt; Increased Decreased
Vent-perfusion imbalance Increased Decreased
Diffusion barrier Increased Decreased
Hypoventilation ( PaCO2) Normal Decreased
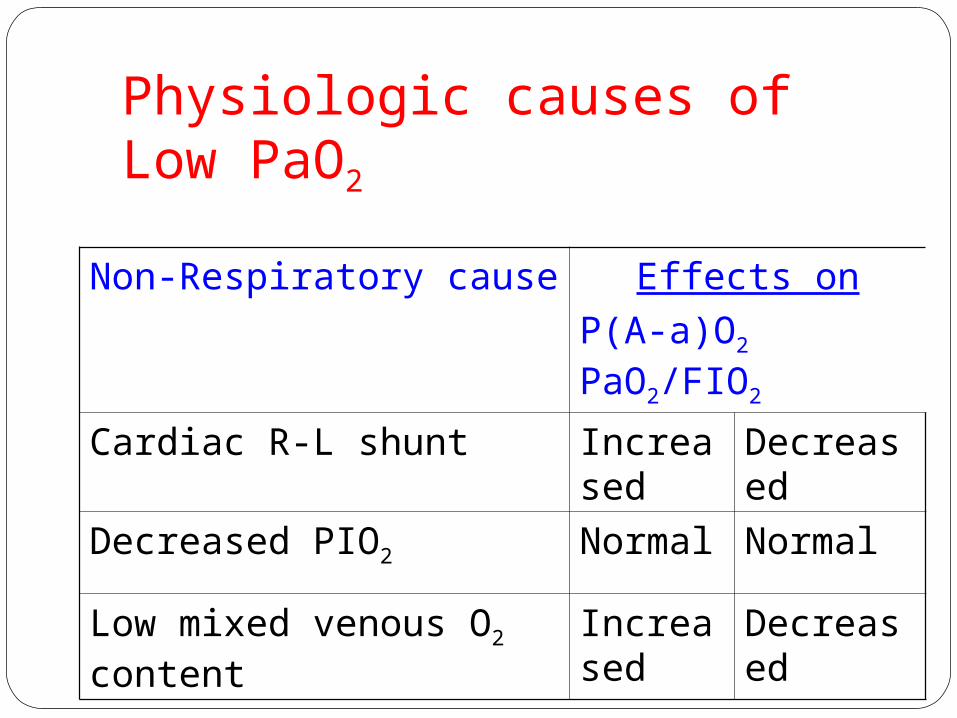
Physiologic causes of Low PaO2
Non-Respiratory cause Effects on
P(A-a)O2 PaO2/FIO2
Cardiac R-L shunt Increased Decreased
Decreased PIO2 Normal Normal
Low mixed venous O2 content Increased Decreased

PaO2, SaO2 & Oxygen content(Oxygen Content Equation )
All physicians know that hemoglobin carries oxygen and that anemia can lead to severe hypoxemia. Making the necessary connection between PaO2 and O2 content requires knowledge of the oxygen content equation.
CaO2 = (SaO2 x Hb x 1.34) + .003(PaO2)

The oxygen carrying capacity of one gram of hemoglobin is 1.34 ml. With a hemoglobin content of 15 grams/dl blood and a normal hemoglobin oxygen saturation (SaO2) of 98%, arterial blood has a hemoglobin-bound oxygen content of 15 x .98 x 1.34 = 19.7 ml O2/dl blood.

An additional small quantity of O2 is carried dissolved in plasma: .003 ml O2/dl plasma/mm Hg PaO2, or .3 ml O2/dl plasma when PaO2 is 100 mm Hg. Since normal CaO2 is 16-22 ml O2/dl blood, the amount contributed by dissolved (unbound) oxygen is very small, only about 1.4% to 1.9% of the total
Given normal pulmonary gas exchange (i.e., a normal respiratory system), factors that lower oxygen content - such as anemia, carbon monoxide poisoning, methemoglobinemia, shifts of the oxygen dissociation curve - do not affect PaO2. PaO2 is a measurement of pressure exerted by uncombined oxygen molecules dissolved in plasma; once oxygen molecules chemically bind to hemoglobin they no longer exert any pressure.
PaO2 affects oxygen content by determining, along with other factors such as pH and temperature, the oxygen saturation of hemoglobin (SaO2). The familiar O2-dissociation curve can be plotted as SaO2 vs. PaO2 and as PaO2 vs. oxygen content

Oxyhemoglobin dissociation curve

When hemoglobin content is adequate, patients can have a reduced PaO2 (defect in gas transfer) and still have sufficient oxygen content for the tissues (e.g., hemoglobin 15 grams%, PaO2 55 mm Hg, SaO2 88%, CaO2 17.8 ml O2/dl blood). Conversely, patients can have a normal PaO2 and be profoundly hypoxemic by virtue of a reduced CaO2. This paradox - normal PaO2 and hypoxemia - generally occurs one of two ways: 1) anemia, or 2) altered affinity of hemoglobin for binding oxygen.

A common misconception is that anemia affects PaO2 and/or SaO2; if the respiratory system is normal, anemia affects neither value. (In the presence of a right to left intrapulmonary shunt anemia can lower PaO2 by lowering the mixed venous oxygen content; when mixed venous blood shunted past the lungs mixes with oxygenated blood leaving the pulmonary capillaries, lowering the resulting PaO2.

With a normal respiratory system mixed venous blood is fully oxygenated - as much as allowed by the alveolar PO2 - as it passes through the pulmonary capillaries.)
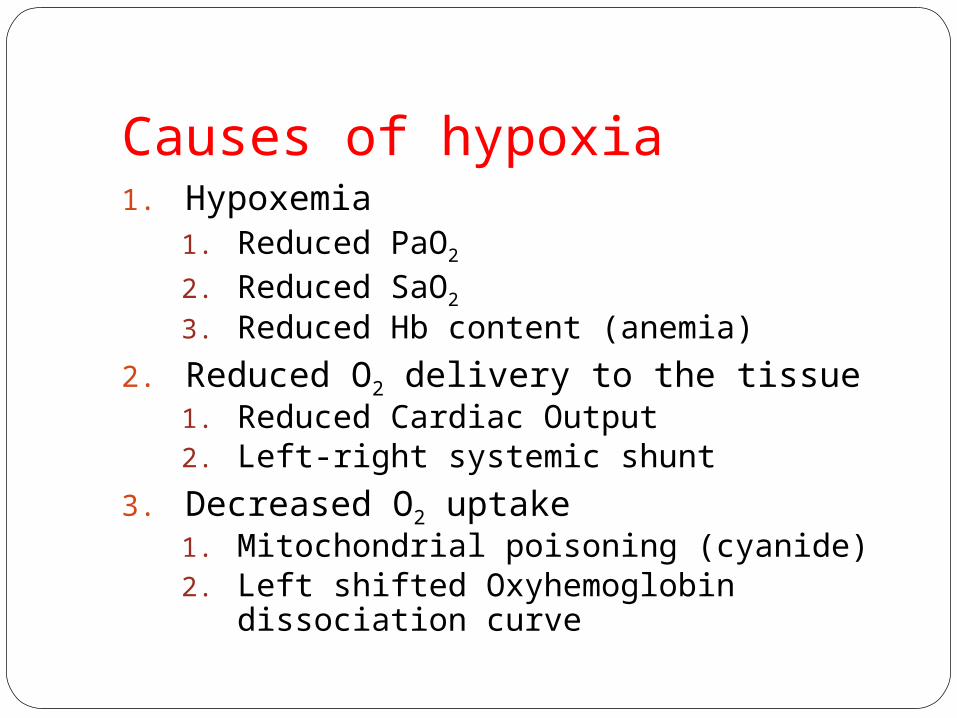
Causes of hypoxia1. Hypoxemia
1. Reduced PaO2
2. Reduced SaO2
3. Reduced Hb content (anemia)
2. Reduced O2 delivery to the tissue1. Reduced Cardiac Output2. Left-right systemic shunt
3. Decreased O2 uptake1. Mitochondrial poisoning (cyanide)2. Left shifted Oxyhemoglobin dissociation
curve

The Henderson-Hasselbalch Equation Of the four equations in this paper, the Henderson-Hasselbalch is the one with which physicians are most familiar. The H-H equation is repeatedly emphasized in basic science courses and in renal and pulmonary pathophysiology lectures; students hear about it on many occasions.

The bicarbonate buffer system, quantitatively the largest in the extracellular fluid, instantaneously reflects any blood acid-base disturbance in one or both of its buffer components (HCO3
- and PACO2). The ratio of HCO3
- to PACO2 determines pH and therefore the acidity of the blood:
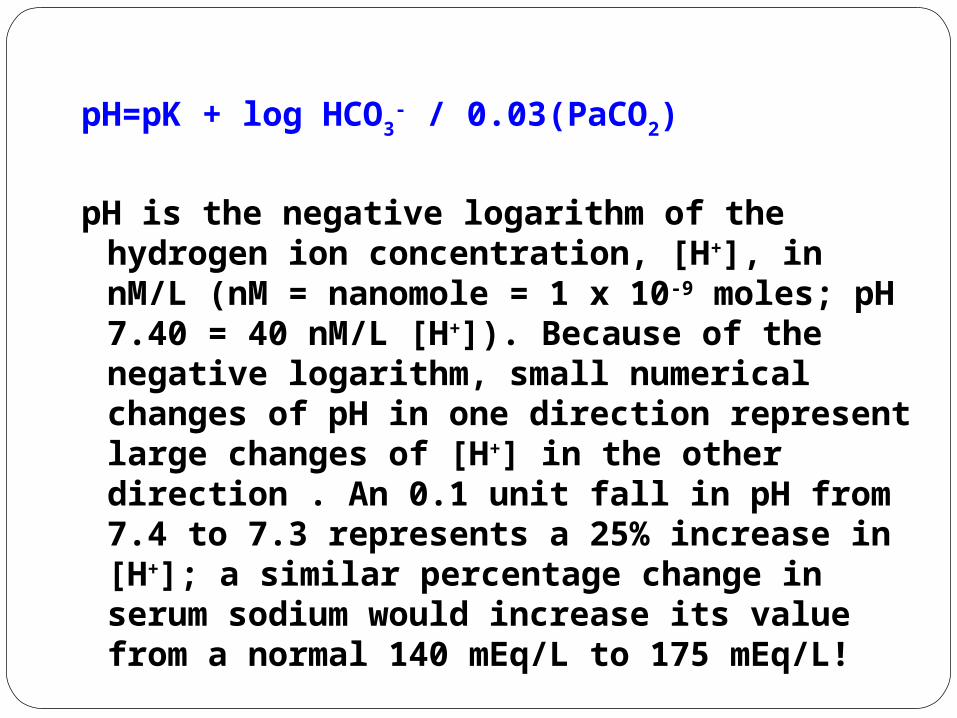
pH=pK + log HCO3- / 0.03(PaCO2)
pH is the negative logarithm of the hydrogen ion concentration, [H+], in nM/L (nM = nanomole = 1 x 10⁻⁹ moles; pH 7.40 = 40 nM/L [H+]). Because of the negative logarithm, small numerical changes of pH in one direction represent large changes of [H+] in the other direction . An 0.1 unit fall in pH from 7.4 to 7.3 represents a 25% increase in [H+]; a similar percentage change in serum sodium would increase its value from a normal 140 mEq/L to 175 mEq/L!
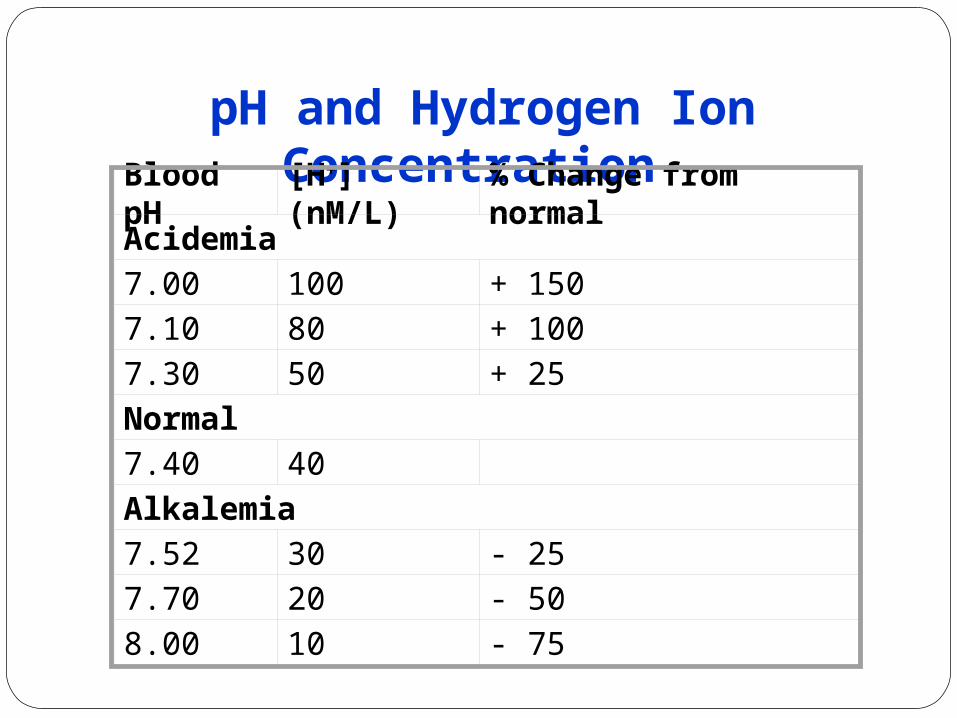
pH and Hydrogen Ion Concentration
Blood pH [H+] (nM/L) % Change from normal
Acidemia
7.00 100 + 150
7.10 80 + 100
7.30 50 + 25
Normal
7.40 40
Alkalemia
7.52 30 - 25
7.70 20 - 50
8.00 10 - 75
Unfortunately, the logarithmic nature of pH and the fact that acid-base disorders involve simultaneous changes in three biochemical variables and in the function of two organ systems (renal and respiratory), have all combined to made acid-base a difficult subject for many clinicians.
If any of the three H-H variables is truly abnormal the patient has an acid-base disturbance without exception. Thus any patient with an abnormal HCO3
- or PaCO2, not just abnormal pH, has an acid-base disorder. Most hospitalized patients have at least one bicarbonate measurement as part of routine serum electrolytes; this is usually called the 'CO2' or 'total CO2' when measured in venous blood.
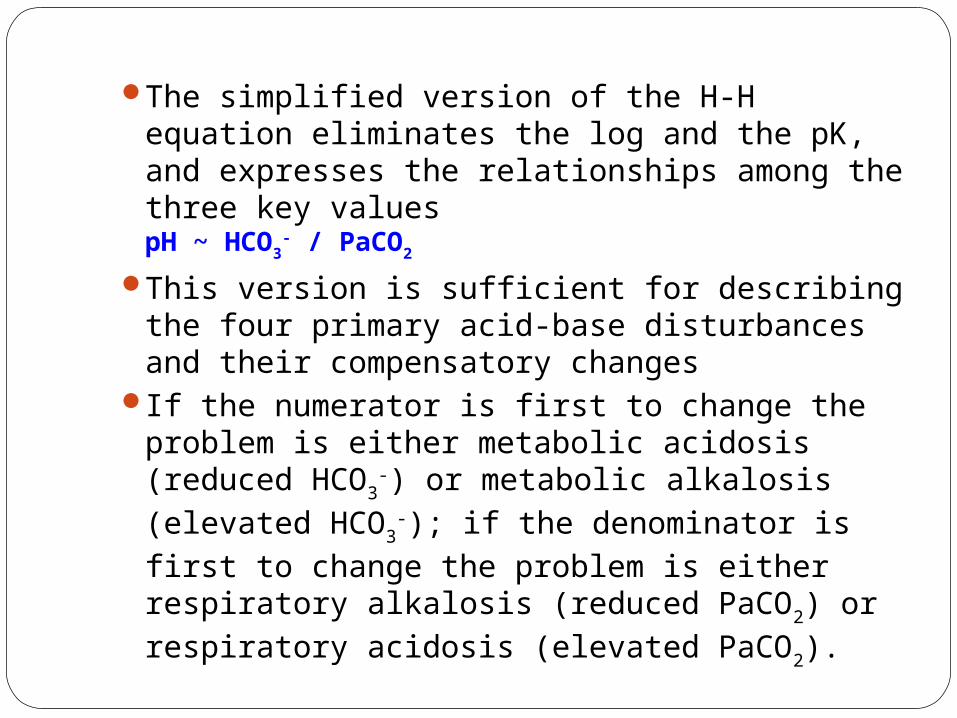
The simplified version of the H-H equation eliminates the log and the pK, and expresses the relationships among the three key values
pH ~ HCO3- / PaCO2
This version is sufficient for describing the four primary acid-base disturbances and their compensatory changes
If the numerator is first to change the problem is either metabolic acidosis (reduced HCO3
-) or metabolic alkalosis (elevated HCO3
-); if the denominator is first to change the problem is either respiratory alkalosis (reduced PaCO2) or respiratory acidosis (elevated PaCO2).
By convention 'acidosis' and 'alkalosis' refer to in-vivo physiologic derangements and not to any change in pH. Each primary acid-base disorder arises from one or more specific clinical conditions, e.g., metabolic acidosis from diabetic ketoacidosis or hypoperfusion lactic acidosis; metabolic alkalosis from diuretics or nasogastric suctioning; etc. Thus the diagnosis of any primary acid-base disorder is analogous to diagnoses like "anemia" or "fever"; a specific cause must be sought in order to provide proper treatment.

Because of the presence of more than one acid-base disorder ('mixed disorders') a patient with any acidosis or alkalosis may end up with a high, low or normal pH. For example, a patient with obvious metabolic acidosis from uremia could present with a high pH due to a concomitant metabolic alkalosis (which may not be as clinically obvious). Acidemia (low pH) and alkalemia (high pH) are terms reserved for derangements in blood pH only.

Compensation for a primary disorder takes place when the other component in the H-H ratio changes as a result of the primary event; these compensatory changes are not classified by the terms used for the four primary acid-base disturbances. For example, a patient who hyperventilates (lowers PaCO2) solely as compensation for metabolic acidosis does not have a primary respiratory alkalosis but simply compensatory hyperventilation.

This terminology helps separate diagnosable and treatable clinical disorders from derangements in acid-base that exist only because of the primary disorder.
Compensatory changes for acute respiratory acidosis and alkalosis, and metabolic acidosis and alkalosis, occur in a predictable fashion, making it relatively easy to spot the presence of a mixed disorder in many situations. For example, single acid-base disorders do not lead to normal pH.

Two or more disorders can be manifested by normal pH when they are opposing, e.g., respiratory alkalosis and metabolic acidosis in a septic patient. Although pH can end up in the normal range (7.35-7.45) in single disorders of a mild degree when fully compensated, a truly normal pH with abnormal HCO3
- and PaCO2 should make one think of two or more primary acid-base disorders. Similarly, a high pH in a case of acidosis or a low pH in a case of alkalosis signifies two or more primary disorders.

Maximal respiratory compensation for a metabolic disorder takes about 12-24 hours and maximal renal compensation for a respiratory disorder takes up to several days. As a rule of thumb, in maximally compensated metabolic acidosis the last two digits of the pH approximate the PaCO2. For example, a patient with a disease causing uncomplicated metabolic acidosis over 24 hours' duration, whose pH is 7.25, should have a PaCO2 equal or close to 25 mm Hg. In metabolic alkalosis respiratory compensation is more variable and there is no simple relationship by which to predict the final PaCO2


How to calculate the degree of compensationScale of compensation
Primary change(for 1unit change)
Compensation(scale of change)
M Acidosis pH HCO3 mEq/L 1.2 PCO2mmHg
M Alkalosis pH HCO3 mEq/L 0.5 PCO2 mmHg
R Acidosis pH PCO2 mmHg 0.35 HCO3 mEq/L
R alkalosis pH PCO2 mmHg 0.5 HCO3 mEq/L
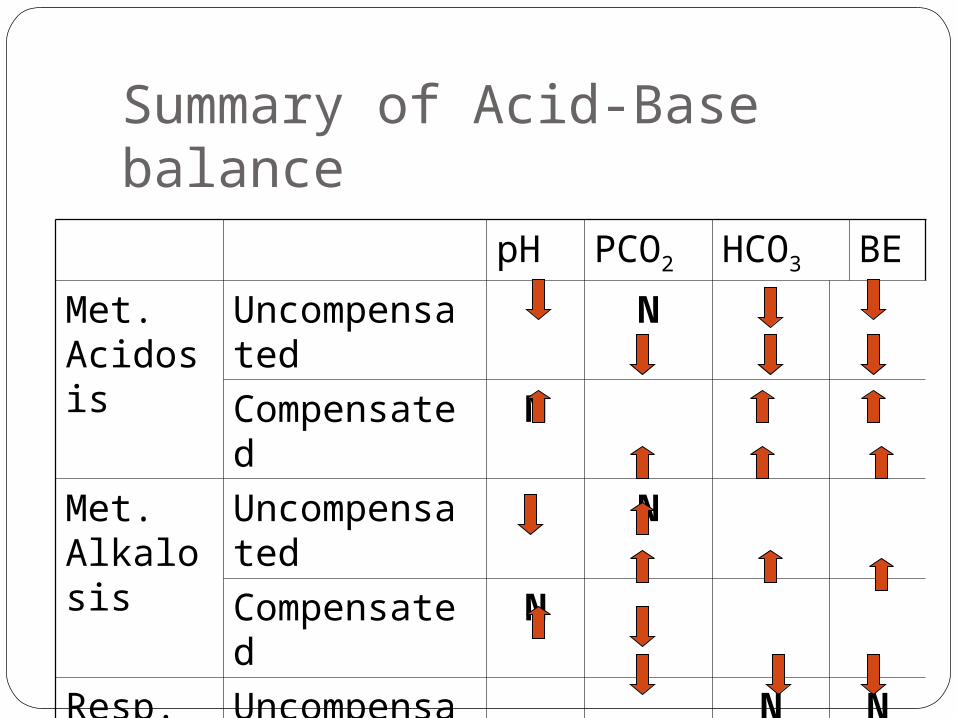
Summary of Acid-Base balance
pH PCO2 HCO3 BE
Met. Acidosis
Uncompensated N
Compensated N
Met. Alkalosis
Uncompensated N
Compensated N
Resp. Acidosis
Uncompensated N N
Compensated N
Resp. Alkalosis
Uncompensated N N
Compensated N
Conclusion It should be remembered that there is
always more than a single explanation for any given set of blood gas results. So it is not possible to make a diagnosis on the basis of these result alone, which must always be considered together with the pt.’s history, heamodynamic parameters & other investigations.

Thank You
Asia Pacific Congress of Hypertension, 2014, February
Cebu city, Phillipines
Seminar on Management of Hypertension, Gulshan, Dhaka