Embed Size (px)
Citation preview

WORLD HAPPINESSREPORT 2016 | VOLUME I
Edited by John Helliwell, Richard Layard and Jeffrey Sachs
Update


1
TABLE OF CONTENTS
1. Setting the Stage 2
John Helliwell, Richard Layard and Jeffrey Sachs
2. The Distribution of World Happiness 8 John Helliwell, Haifang Huang and Shun Wang
3. Promoting Secular Ethics 50 Richard Layard
4. Happiness and Sustainable Development: Concepts and Evidence 56 Jeffrey Sachs
WORLD HAPPINESS REPORT 2016 Edited by John Helliwell, Richard Layard and Jeffrey Sachs
The World Happiness Report was written by a group of independent experts acting in their personal capacities. Any views expressed in this report do not necessarily reflect the views of any organization, agency or program of the United Nations.
UpdateUpdate

2
JOHN HELLIWELL, RICHARD LAYARD AND JEFFREY SACHS
Chapter 1
SETTING THE STAGE
John F. Helliwell, Canadian Institute for Advanced Research and Vancouver School of Economics, University of British Columbia
Richard Layard, Director, Well-Being Programme, Centre for Economic Performance,London School of Economics and Political Science
Jeffrey D. Sachs, Director of the Earth Institute and the UN Sustainable Development SolutionsNetwork, Special Advisor to United Nations Secretary-General Ban Ki-moon on the SustainableDevelopment Goals

W O R L D H A P P I N E S S R E P O R T 2 0 1 6 | U P D AT E
3
Introduction
The first World Happiness Report was published in April 2012, in support of the High Level Meeting at the United Nations on happiness and well-being, chaired by the Prime Minister of Bhutan. Since then we have come a long way. Increasingly, happiness is considered to be the proper measure of social progress and the goal of public policy. This is the fourth World Happi-ness Report, and it is different in several respects from its predecessors. These differences relate to timing, content and geography.
In April 2015, we were already in the throes of planning for the World Happiness Report 2017, on the assumption that we would have, and need, somewhere between 18 months and two years to undertake the depth and range of research we wanted to cover. However we were invited to prepare a shorter report in 2016—the World Happiness Report 2016 Update—that would be released in Rome in March 2016, close to World Happiness Day (March 20th). Twelve months after that we plan to release World Happiness Report 2017, with the usual broad range of chapters based on global research, this time including separate chapters focused on two large global sub-populations, in China and Africa respectively. Further plans include deeper analysis of workplace happiness, and the happi-ness implications of immigration, refugees, and transient populations.
Given the short time available since the launch of World Happiness Report 2015, this Update has only three chapters beyond this introduction, one from each editor. Chapter 2, by John Helliwell, Haifang Huang, and Shun Wang, contains our primary rankings of and explanations for life evaluations, significantly expanded this year to include analysis of the inequality of well-being, based on the distributions of happiness levels within and among societies. Chapter 3, by Rich-ard Layard, deals with the links between happi-ness and secular ethics. Chapter 4, by Jeffrey Sachs, discusses the close connection between
happiness and recently agreed upon Sustainable Development Goals.
At the suggestion of our Italian hosts, and under separate editorial direction, we have this year, for the first time, a companion volume containing five research papers for presentation at the 2016 launch conference in Rome—the 2016 Special Rome Edition. Four of the five papers are by Italian authors, and the other reviews a variety of links between human flourishing, the common good, and Catholic social teaching. We shall provide a brief overview of each after we first outline the contents and main findings of the World Happiness Report 2016 Update.
Chapter 2: The Distribution of World Happiness (John Helliwell, Haifang Huang, and Shun Wang)
In this report we give new attention to the inequality of happiness across individuals. The distribution of world happiness is presented first by global and regional charts showing the distribution of answers, from roughly 3,000 respondents in each of more than 150 countries, to a question asking them to evaluate their current lives on a ladder where 0 represents the worst possible life and 10, the best possible. For the world as a whole, the distribution is very normally distributed about the median answer of 5, with the population-weighted mean being 5.4. When the global population is split into ten geographic regions, the resulting distributions vary greatly in both shape and average values. Only two regions—the Middle East and North Africa, and Latin America and the Caribbean—have more unequally distributed happiness than does the world as a whole.
Average levels of happiness also differ across regions and countries. A difference of four points in average life evaluations, on a scale that runs from zero to ten, separates the ten happiest countries from the ten least happy countries. Three-quarters of the differences among coun-tries, and also among regions, are accounted for by differences in six key variables, each of which

4
digs into a different aspect of life. The six factors are GDP per capita, healthy years of life expec-tancy, social support (as measured by having someone to count on in times of trouble), trust (as measured by a perceived absence of corrup-tion in government and business), perceived freedom to make life decisions, and generosity (as measured by recent donations). Differences in social support, incomes and healthy life expectancy are the three most important factors. International differences in positive and nega-tive emotions (affect) are much less fully ex-plained by these six factors. When affect mea-sures are used as additional elements in the explanation of life evaluations, only positive emotions contribute significantly, appearing to provide an important channel for the effects of both perceived freedom and social support.
Analysis of changes in life evaluations from 2005-2007 to 2013-2015 continue to show big international differences in the dynamics of happiness, with both the major gainers and the major losers spread among several regions.
The main innovation in the World Happiness Report Update 2016 is our focus on inequality. We have previously argued that happiness, as measured by life evaluations, provides a broader indicator of human welfare than do measures of income, poverty, health, education, and good government viewed separately. We now make a parallel suggestion for measuring and address-ing inequality. Thus we argue that inequality of well-being provides a better measure of the distribution of welfare than is provided by income and wealth, which have thus far held centre stage when the levels and trends of inequality are being considered. First we show that there is a wide variation among countries and regions in their inequality of well-being, and in the extent to which these inequalities changed from 2005-2011 to 2012-2015. In the world as a whole, in eight of the 10 global regions, and in more than half of the countries surveyed there was a significant increase in the inequality of happiness. By contrast, no global
region, and fewer than one in 10 countries, showed significant reductions in happiness inequality over that period.
Second, the chapter shows that people do care about the happiness of others, and how it is distributed. Beyond the six factors already discussed, new research suggests that people are significantly happier living in societies where there is less inequality of happiness.
Chapter 3: Promoting Secular Ethics (Richard Layard)
This chapter argues that the world needs an ethi-cal system that is both convincing and inspiring. To supplement what is seen as a global decline in the impact of religious ethics, the chapter offers the principle of the greatest happiness as one that can inspire and unite people from all backgrounds and cultures, and that is also in harmony with major religious traditions. But to sustain people in living good lives, more than a principle is needed. Living organisations are needed, including those already provided by many religions, in which people meet regularly for uplift and mutual support. To create secular organisations of this type in addition to religious institutions is an important opportunity to promote well-being in the 21st century. The movement known as Action for Happiness is used as an example to show both the need for and the power of collaborative action to design and deliver better lives.
Chapter 4: Happiness and Sustainable Develop-ment: Concepts and Evidence (Jeffrey Sachs)
The year 2015 was a watershed for humanity, with the adoption of Sustainable Development Goals (SDGs) by heads of state at a special summit at the United Nations in September 2015, on the 70th anniversary of the UN.
Sustainable development is a holistic approach to well-being that calls on societies to pursue economic, social, and environmental objectives

W O R L D H A P P I N E S S R E P O R T 2 0 1 6 | U P D AT E
5
in an integrated manner. When countries sin-gle-mindedly pursue individual objectives, such as economic development to the neglect of social and environmental objectives, the results can be highly adverse for human well-being, even dangerous for survival. Many countries in recent years have achieved economic growth at the cost of sharply rising inequality, entrenched social exclusion, and grave damage to the natural environment. The SDGs are designed to help countries to achieve a more balanced approach, thereby leading to higher levels of well-being for the present and future generations.
This chapter shows that measures of sustainable development, including a new Sustainable Development Index prepared by the Sustainable Development Solutions Network, help to account for cross-country variations in happiness, along the lines suggested by the analysis in Chapter 2 of this Report. In particular the SDG Index helps to account for cross-national patterns of happiness even after controlling for GDP per capita and unemployment . A measure of Economic Free-dom, as proposed by libertarians, shows no such explanatory weight. The evidence suggests that indeed all three dimensions of sustainable devel-opment—economic, social, and environmental—are needed to account for the cross-country variation in happiness.
The UN Sustainable Development Solutions Network has urged the inclusion of indicators of Subjective Well-being to help guide and measure the progress towards the SDGs. To this end, a letter from thirty global experts in well-being research—plus national and global statisticians with experience in collecting and using these data—has been sent to the UN Secretary Gener-al, and to the committees responsible for moni-toring the SDGs.
The 2016 Special Rome Edition (Edited by Jeffrey Sachs, Leonardo Becchetti and Anthony Annett)
As we have noted above, World Happiness Report 2016—Special Rome Edition, separately selected and edited, was prepared for the March 2016 launch event in Rome. The papers all have strong Roman links: the paper by Anthony Annett links Catholic social teaching with the work of other philosophers of well-being, while the other four papers are by Italian researchers dealing with a variety of issues in the analysis of well-being. We are immensely grateful to our Roman hosts for creating the launch event, and for contributing a variety of interesting papers. We provide below a brief description of each paper, and of its possi-ble implications for the future development of global happiness research.
Chapter 1: Inside the Life Satisfaction Blackbox (Leonardo Becchetti, Luisa Corrado and Paola Sama)
The authors propose the use of a package of domain measures of the quality of life to supple-ment or perhaps even replace the overall life evaluations central to the World Happiness Report. They find that their package measure is more fully explained by a typical set of individual-level variables, and prefer it for that reason. They recommend, as do we, the collection of a broader range of variables that measure or arguably support various aspects of well-being. Only thus can the science of well-being be broadened and strengthened. However, to measure overall happiness, we continue to attach more validity to peoples’ own judgments of the quality of their lives than to any index we might construct out of possible component measures.

6
Chapter 2: Human Flourishing, the Common Good, and Catholic Social Teaching (Anthony Annett)
This paper makes three claims. First, human beings are by their nature oriented toward broader notions of happiness that are intimately tied to the common good. Second, with the turn toward the individual, post-Enlightenment politi-cal and economic developments have stripped the common good of all substantive content. Third, by restoring the centrality of the common good, Catholic social teaching offers a coherent and internally consistent framework for human flourishing that applies principles to particular circumstances in a way that does not depend on agreeing with the confessional claims of the Catholic Church.
Chapter 3: The Challenges of Public Happiness: An Historical-Methodological Reconstruction (Luigino Bruni and Stefano Zemagni)
The central idea of this paper, drawn from Aristotle, is that there is an intrinsic value in relational and civil life, without which human life does not fully flourish. They contrast this broader conception of a good life, for which they see roots in the Italian civil economy, with what they see as narrower and more hedonistic approaches. The central role they ascribe to the social context—what they refer to as relational goods—has echoes in the empirical findings in the World Happiness Report, where the quality of social support and the excellence of civil institu-tions are of primary importance, supplemented now by an apparent preference for equality of happiness.
Chapter 4: The Geography of Parenthood and Well-Being: Do Children Make Us Happy, Where, and Why? (Luca Stanca)
The author digs deeper into a frequent finding that having children does not add to the happi-ness of their parents. The paper confirms a negative relationship between parenthood and life satisfaction that is stronger for females than males, and turns positive only for older age groups and for widowers. Looking across the world, a negative relationship between parent-hood and life satisfaction is found in two-thirds of the countries studied. The negative effect of parenthood on life satisfaction is found to be significantly stronger in countries with higher GDP per capita or higher unemployment rates.
Chapter 5: Multidimensional Well-Being in Contemporary Europe: Analysis of the Use of a Self-Organizing Map Applied to SHARE Data (Mario Lucchini, Luca Crivelli and Sara della Bella).
The authors use a network-based mechanical data-reduction process to look for common and divergent features of 38 different well-being indicators collected from the same survey of older European adults that provided the data for the paper by Becchetti et al. They find that the measures of positive emotions tend to cluster together, as do the measures of negative emo-tions. Overall life evaluations show a more umbrella-like character, with somewhat more kinship to the positive emotions. This seems to be consistent with the World Happiness Report 2016 Update finding that positive and negative affect have quite different apparent impacts of life evaluations, being strongly positive for positive affect but only very slightly negative for negative affect.

W O R L D H A P P I N E S S R E P O R T 2 0 1 6 | U P D AT E
7
Conclusion
In light of the limited time since the last report, the 2016 Update is shorter than usual. This year, as detailed in Chapter 2 of the Update, we provide a fuller accounting of the distribution of happiness among people within each country and region. Just as happiness provides a broader measure of well-being than separate accountings of income, health status, and the quality of the social context, we find that inequality of well-be-ing provides a broader measure of inequality than measures focusing on the distribution of income and wealth. After documenting a general rise in the inequality of happiness, we present preliminary evidence that countries with more equal distributions of well-being have higher average life evaluations. This in turn invites broader discussions about the policies that might improve the levels and distribution of well-being within and among countries.
We also present in Chapter 4 some preliminary evidence that sustainable development is condu-cive to happiness. We find that happiness is higher in countries closer to realizing the Sus-tainable Development Goals, as approved by the nations of the world in September 2015.
To supplement our short World Happiness Report 2016 Update, and to fuel the discussions at the three-day series of launch events in Rome, we have also issued the companion Volume 2—the World Happiness Report 2016 Special Rome Edition. This separately-edited volume compris-es more technical papers, mainly prepared by our Roman hosts.
We are also in the midst of planning the next full report, the World Happiness Report 2017, which will include special chapters on happiness in Africa and in China, as well as analyses of happiness in the workplace and over the course of life. We also plan to extend our analysis of the inequality of happiness, and to dig deeper into the happiness consequences of international migration.
The cause of happiness as a primary goal for public policy continues to make good progress. So far, four national governments—Bhutan, Ecuador, United Arab Emirates and Venezuela—have appointed ministers of happiness responsi-ble for coordinating their national efforts. There are many more sub-national governments—from large states like Jalisco in Mexico to many cities and communities around the world—that are now committed to designing policies en-abling people to live happier lives. Experimenta-tion is easier at the sub-national level, and this is where we expect to find the most progress. These local efforts are often supported by more encompassing organizations—such as the Happiness Research Institute based in Copenha-gen and the Action for Happiness in the United Kingdom—designed to foster and transmit locally-inspired and delivered innovations.
In these interconnected ways, we see increasing evidence that the emerging science of well-being is combining with growing policy interest at all levels of government to enable people to live sustainably happier lives. Our data show what needs to be done to improve the level and distri-bution of happiness. We are encouraged that progress can and will be made.

8
JOHN F. HELLIWELL, HAIFANG HUANG AND SHUN WANG
Chapter 2
THE DISTRIBUTION OF WORLD HAPPINESS
John F. Helliwell, Canadian Institute for Advanced Research and Vancouver School of Economics, University of British Columbia
Haifang Huang, Department of Economics, University of Alberta
Shun Wang, KDI School of Public Policy and Management, Korea
The authors are grateful to the Canadian Institute for Advanced Research and the KDI School for research support, and to the Gallup Organization for data access and assistance. In particular, several members of the Gallup staff helped in the development of Technical Box 3. The author are also grateful for helpful advice and comments from Ed Diener, Curtis Eaton, Carrie Exton, Leonard Goff, Carol Graham, Shawn Grover, Richard Layard, Guy Mayraz, Hugh Shiplett and Conal Smith.

W O R L D H A P P I N E S S R E P O R T 2 0 1 6 | U P D AT E
9
Introduction
It is now almost four years since the publication of the first World Happiness Report (WHR) in 2012. Its central purpose was to survey the scientific underpinnings of measuring and understanding subjective well-being. Its main content is as relevant today as it was then, and remains available for those now coming to the topic for the first time. The subsequent World Happiness Report 2013 and World Happiness Report 2015, issued at roughly 18 month inter-vals, updated and extended this background. To make this World Happiness Report 2016 Update accessible to those who are coming fresh to the World Happiness Report series, we repeat enough of the core analysis in this chapter, and its several on-line appendices, to explain the mean-ing of the evidence we are reporting.
Chapter 2 in World Happiness Report 2015, the Geography of World Happiness, started with a global map, and continued with our attempts to explain the levels and changes in average nation-al life evaluations among countries around the world. This year we shall still consider the geographic distribution of life evaluations among countries, while extending our analysis to consider in more detail the inequality of happiness – how life evaluations are distributed among individuals within countries and geo-graphic regions.
In studying more deeply the distribution of happiness within national and regional popula-tions, we are extending the approach adopted in Chapter 2 of the first World Happiness Report, in which Figure 2.1 showed the global distribution of life evaluations among the 11 response catego-ries, with the worst possible life as a 0 and the best possible life as a 10 (the Cantril ladder question). The various parts of Figure 2.2 then made the same allocation of responses for respondents in nine global regions, weighting the responses from different countries according to each country’s population. In those figures we combined all the data then available, for the
survey years 2005 through 2011, in order to achieve representative samples in each answer category. In this chapter we repeat that analysis using data from the subsequent four years, 2012-2015. This will give us sufficiently large samples to compare what we found for 2005-2011 with what we now see in the data for 2012-2015.
Our main analysis of the distribution of happi-ness among and within nations continues to be based on individual life evaluations, roughly 1,000 per year in each of more than 150 coun-tries, as measured by answers to the Cantril ladder question: “Please imagine a ladder, with steps numbered from 0 at the bottom to 10 at the top. The top of the ladder represents the best possible life for you and the bottom of the ladder represents the worst possible life for you. On which step of the ladder would you say you personally feel you stand at this time?” We will, as usual, present the average life evaluation scores for each country, in this report based on averages from the surveys conducted in 2013, 2014 and 2015.
This will be followed, as in earlier editions, by our latest attempts to show how six key variables contribute to explaining the full sample of national annual average scores over the whole period 2005-2015. These variables include GDP per capita, social support, healthy life expectan-cy, social freedom, generosity and absence of corruption. We shall also show how measures of experienced well-being, especially positive emotions, can add to life circumstances in the support for higher life evaluations.
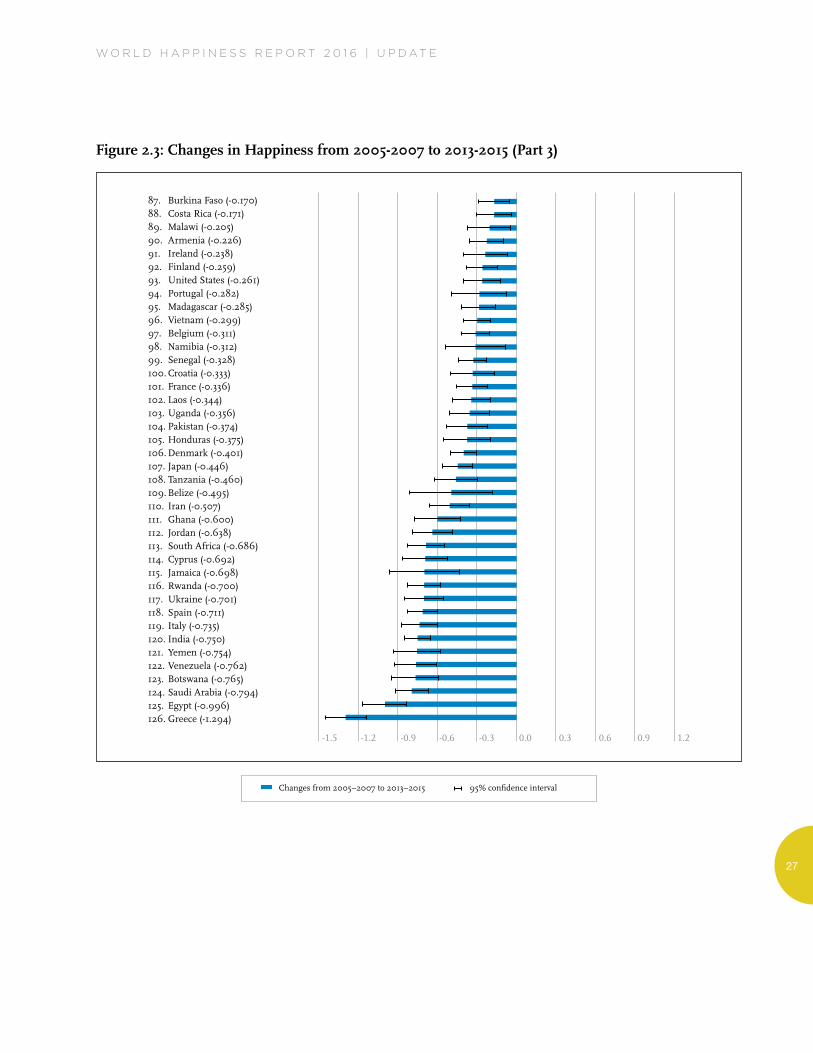
We shall then turn to consider the distribution of life evaluations among individuals in each coun-try, using data from all 2012-2015 surveys, with the countries ranked according to the equality of life evaluations among their survey respondents, as measured by the standard deviation from the mean. We shall then show how these national measures of the equality of life evaluations have changed from 2005-2011 to 2012-2015.

10
Our reason for paying more attention to the distribution of life evaluations is quite simple. If it is appropriate to use life evaluations as an umbrella measure of the quality of life, to supple-ment and consolidate the benefits available from income, health, family and friends, and the broader institutional and social context, then it is equally important to broaden the measurement of inequalities beyond those for income and wealth. Whether people are more concerned with equality of opportunities or equality of outcomes, the data and analysis should embrace the avail-ability of and access to sustainable and livable cities and communities as much as to income and wealth. We will make the case that the distribution of life evaluations provides an over-arching measure of inequality in just the same way as the average life evaluations provide an umbrella measure of well-being.
The structure of the chapter is as follows. We shall start with a review of how and why we use life evaluations as our central measure of subjec-tive well-being within and among nations. We shall then present data for average levels of life evaluations within and among countries and global regions. This will include our latest efforts to explain the differences in national average evaluations, across countries and over the years. After that we present the latest data on changes between 2005-2007 and 2013-2015 in average national life evaluations.
We shall then turn to consider inequality and well-being. We first provide a country ranking of the inequality of life evaluations based on data from 2012-2015, followed by a country ranking based on the size of the changes in inequality that have taken place between 2005-2011 and 2012-2015. We then attempt to assess the possible consequences for average levels of well-being, and for what might be done to address well-being inequalities. We conclude with a summary of our latest evidence and its implications.
Measuring and Understanding Happiness
Chapter 2 of the first World Happiness Report explained the strides that had been made during the preceding 30 years, mainly within psychology, in the development and validation of a variety of measures of subjective well-being. Progress since then has moved faster, as the number of scientific papers on the topic has continued to grow rapidly,1 and as the measurement of subjective well-being has been taken up by more national and international statistical agencies, guided by technical advice from experts in the field.
By the time of the first report there was already a clear distinction to be made among three main classes of subjective measures: life evaluations, positive emotional experiences (positive affect) and negative emotional experiences (negative affect); see Technical Box 1. The Organization for Economic Co-operation and Development (OECD) subsequently released Guidelines on Measuring Subjective Well-being,2 which included both short and longer recommended modules of subjective well-being questions.3 The centerpiece of the OECD short module was a life evaluation question, asking respondents to assess their satisfaction with their current lives on a 0 to 10 scale. This was to be accompanied by two or three affect questions and a question about the extent to which the respondents felt they had a purpose or meaning in their lives. The latter question, which we treat as an important sup-port for subjective well-being, rather than a direct measure of it, is of a type4 that has come to be called “eudaimonic,” in honor of Aristotle, who believed that having such a purpose would be central to any reflective individual’s assess-ment of the quality of his or her own life.
Chapter 2 of World Happiness Report 2015 re-viewed evidence from many countries and several different surveys about the types of information available from different measures of subjective well-being.8 What were the main messages? First, all three of the commonly used

W O R L D H A P P I N E S S R E P O R T 2 0 1 6 | U P D AT E
11life evaluations (specifically Cantril ladder, satisfaction with life, and happiness with life in general) tell almost identical stories about the nature and relative importance of the various factors influencing subjective well-being. For example, for several years it was thought (and is still sometimes reported in the literature) that
respondents’ answers to the Cantril ladder question, with its use of a ladder as a framing device, were more dependent on their incomes than were answers to questions about satisfac-tion with life. The evidence for this came from comparing modeling using the Cantril ladder in the Gallup World Poll (GWP) with modeling
Technical Box 1: Measuring Subjective Well-being
The OECD (2013) Guidelines on Measuring Sub-jective Well-being, quotes in its introduction the following definition and recommendation from the earlier Commission on the Measurement of Economic and Social Progress:
“Subjective well-being encompasses three dif-ferent aspects: cognitive evaluations of one’s life, positive emotions (joy, pride), and nega-tive ones (pain, anger, worry). While these as-pects of subjective well-being have different determinants, in all cases these determinants go well beyond people’s income and material conditions... All these aspects of subjective well-being should be measured separately to derive a more comprehensive measure of peo-ple’s quality of life and to allow a better under-standing of its determinants (including peo-ple’s objective conditions). National statistical agencies should incorporate questions on sub-jective well-being in their standard surveys to capture people’s life evaluations, hedonic expe-riences and life priorities.”5
The OECD Guidelines go on to recommend a core module of questions to be used by national statistical agencies in their household surveys:
“There are two elements to the core measures module.
The first is a primary measure of life evaluation. This represents the absolute minimum re-quired to measure subjective well-being, and it is recommended that all national statistical agencies include this measure in one of their annual household surveys.
The second element consists of a short series of affect questions and an experimental eudaimon-ic question (a question about life meaning or purpose). The inclusion of these measures com-plements the primary evaluative measure both because they capture different aspects of subjec-tive well-being (with a different set of drivers) and because the difference in the nature of the measures means that they are affected in differ-ent ways by cultural and other sources of mea-surement error. While it is highly desirable that these questions are collected along with the pri-mary measure as part of the core, these ques-tions should be considered a lower priority than the primary measure.”6
Almost all OECD countries7 now contain a life evaluation question, usually about life satisfac-tion, on a 0 to 10 rating scale, in one or more of their surveys. However, it will be many years be-fore the accumulated efforts of national statisti-cal offices will produce as large a number of comparable country surveys as is now available through the Gallup World Poll (GWP), which has been surveying an increasing number of countries since 2005, and now includes almost all of the world’s population. The GWP contains one life evaluation as well as a range of positive and negative experiential questions, including several measures of positive and negative affect, mainly asked with respect to the previous day. In this chapter, we make primary use of the life evaluations, since they are, as we show in Table 2.1, more international in their variation and are more readily explained by life circumstances.

12
based on life satisfaction answers in the World Values Survey (WVS). But this conclusion, based on comparing two different surveys, unfortu-nately combines survey and method differences with the effects of question wording. When it subsequently became possible to ask both questions9 of the same respondents on the same scales, as was the case in the Gallup World Poll in 2007, it was shown that the estimated income effects and almost all other structural influences were identical, and a more powerful explanation was obtained by using an average of the two answers.10
It was also believed at one time that when questions included the word “happiness” they elicited answers that were less dependent on income than were answers to life satisfaction questions or the Cantril ladder. Evidence for that view was based on comparing World Values Survey happiness and life satisfaction answers,11 and by comparing the Cantril ladder with happi-ness yesterday (and other emotions yesterday). Both types of comparison showed the effects of income on the happiness answers to be less significant than on satisfaction with life or the Cantril ladder. Both conclusions were based on the use of non-comparable data. The first com-parison, using WVS data, involved different scales and a question about happiness that might have combined emotional and evaluative components. The second strand of literature, based on GWP data, compared happiness yesterday, which is an experiential/emotional response, with the Cantril ladder, which is equally clearly an evaluative measure. In that context, the finding that income has more purchase on life evaluations than on emotions seems to have general applicability, and stands as an established result.12
But what if happiness is used as part of a life evaluation? That is, if respondents are asked how happy, rather than how satisfied, they are with their life as a whole? Would the use of “happiness” rather than “satisfaction” affect the influence of income and other factors on the
answers? For this important question, no defini-tive answer was available until the European Social Survey (ESS) asked the same respondents “satisfaction with life” and “happy with life” questions, wisely using the same 0 to 10 re-sponse scales. The answers showed that income and other key variables all have the same effects on the “happy with life” answers as on the “satisfied with life” answers, so much so that once again more powerful explanations come from averaging the two answers.
Another previously common view was that changes in life evaluations at the individual level were largely transitory, returning to their base-line as people rapidly adapt to their circumstanc-es. This view has been rejected by four indepen-dent lines of evidence. First, average life evaluations differ significantly and systematical-ly among countries, and these differences are substantially explained by life circumstances. This implies that rapid and complete adaptation to different life circumstances does not take place. Second, there is evidence of long-standing trends in the life evaluations of sub-populations within the same country, further demonstrating that life evaluations can be changed within policy-relevant time scales.13 Third, even though individual-level partial adaptation to major life events is a normal human response, there is very strong evidence of continuing influence on well-being from major disabilities and unem-ployment, among other life events.14 The case of marriage is still under debate. Some recent results using panel data from the UK have suggested that people return to baseline levels of life satisfaction several years after marriage, a result that has been argued to support the more general applicability of set points.15 However, subsequent research using the same data has shown that marriage does indeed have long-last-ing well-being benefits, especially in protecting the married from as large a decline in the middle-age years that in many countries repre-sent a low-point in life evaluations.16 Fourth, and especially relevant in the global context, are studies of migration showing migrants to have

W O R L D H A P P I N E S S R E P O R T 2 0 1 6 | U P D AT E
13
average levels and distributions of life evalua-tions that resemble those of other residents of their new countries more than of comparable residents in the countries from which they have emigrated.17 This confirms that life evaluations do depend on life circumstances, and are not destined to return to baseline levels as required by the set point hypothesis.
Why Use Life Evaluations for International Comparisons of the Quality of Life?
In each of the three previous World Happiness Reports we presented different ranges of data covering most of the experiences and life evalua-tions that were available for a large number of countries. We were grateful for the breadth of available information, and used it to deepen our understanding of the ways in which experiential and evaluative reports are connected. Our conclusion is that while experiential and evalua-tive measures differ from each other in ways that help to understand and validate both, life evaluations provide the most informative mea-sures for international comparisons because they capture the overall quality of life as a whole.
For example, experiential reports about happi-ness yesterday are well explained by events of the day being asked about, while life evaluations more closely reflect the circumstances of life as a whole. Most Americans sampled daily in the Gallup-Healthways Well-Being Index Survey feel happier on weekends, to an extent that depends on the social context on and off the job. The weekend effect disappears for those employed in a high trust workplace, who regard their superi-or more as a partner than a boss, and maintain their social life during weekdays.18
By contrast, life evaluations by the same respon-dents in that same survey show no weekend effects.19 This means that when they are answer-ing the evaluative question about life as a whole,
people see through the day-to-day and hour-to-hour fluctuations, so that the answers they give on weekdays and weekends do not differ.
On the other hand, although life evaluations do not vary by the day of week, they are much more responsive than emotional reports to differences in life circumstances. This is true whether the comparison is among national averages20 or among individuals.21
Furthermore, life evaluations vary more between countries than do emotions. Thus almost one-quarter of the global variation in life evalua-tions is among countries, compared to three-quarters among individuals in the same country. This one-quarter share for life evalua-tions is far more than for either positive affect (7 percent) or negative affect (4 percent). This difference is partly due to the role of income, which plays a stronger role in life evaluations than in emotions, and is also very unequally spread among countries. For example, more than 40 percent of the global variation among household incomes is among nations rather than among individuals within nations.22
These twin facts – that life evaluations vary much more than do emotions across countries, and that these life evaluations are much more fully explained by life circumstances than are emotional reports– provide for us a sufficient reason for using life evaluations as our central measure for making international compari-sons.23 But there is more. To give a central role to life evaluations does not mean we need to either ignore or downplay the important infor-mation provided by experiential measures. On the contrary, we see every reason to keep experi-ential measures of well-being, as well as mea-sures of life purpose, as important elements in our attempts to measure and understand subjec-tive well-being. This is easy to achieve, at least in principle, because our evidence continues to suggest that experienced well-being and a sense of life purpose are both important influences on

14
life evaluations, above and beyond the critical role of life circumstances. We shall provide direct evidence of this, and especially of the importance of positive emotions, in Table 2.1. Furthermore, in Chapter 3 of World Happiness Report 2015 we gave experiential reports a central role in our analysis of variations of subjective well-being across genders, age groups, and global regions.
We would also like to be able to compare in-equality measures for life evaluations with those for emotions, but unfortunately that is not currently possible, since the Gallup World Poll emotion questions all offer only yes and no responses. Thus nothing can be said about their distribution beyond the national average shares of yes and no answers. For life evaluations, however, there are 11 response categories, so we are able to contrast distribution shapes for each country and region, and see how these evolve as time passes. We start by looking at the popula-tion-weighted global and regional distributions of life evaluations, based on how respondents rate their lives24.
In the rest of this report, Cantril ladder is the only measure of life evaluations to be used, and “happiness” and “subjective well-being” are used exchangeably. All the analysis on the levels or changes of subjective well-being refers only to life evaluations, specifically the Cantril ladder.
The Distribution of Happiness around the World
The various panels of Figure 2.1 contain bar charts showing for the world as a whole, and for each of 10 global regions, the distribution of the 2012-2015 answers to the Cantril ladder question asking respondents to value their lives today on a 0 to 10 scale, with the worst possible life as a 0 and the best possible life as a 10.
In Table 2.1 we present our latest modeling of national average life evaluations and measures of positive and negative affect (emotion) by country and year. For ease of comparison, the Table has the same basic structure as Table 2.1 in the World Happiness Report 2015. The major difference comes from the inclusion of data for late 2014 and 2015, which increases by 144 (or about 15 percent) the number of country-year observations.25 The resulting changes to the estimated equation are very slight.26 There are four equations in Table 2.1. The first equation provides the basis for constructing the sub-bars shown in Figure 2.2.
The equation explains national average life evaluations in terms of six key variables: GDP per capita, social support, healthy life expectan-cy, freedom to make life choices, generosity and freedom from corruption.27 Taken together, these six variables explain almost three-quarters of the variation in national annual average ladder scores among countries, using data from the years 2005 to 2015. The model’s predictive power is little changed if the year fixed effects in the model are removed, falling from 74.1% to 73.6% in terms of the adjusted r-squared.
Figure 2.1: Population-Weighted Distributions of Happiness, 2012-2015 (Part 1)
.25
.15
0 1 2 3 4 5 6 7 8 9 10
.05
.2
.1
Mean = 5.353
SD = 2.243
World

W O R L D H A P P I N E S S R E P O R T 2 0 1 6 | U P D AT E
15
.25
.1
.05
.3
.15
.35
.2
0 1 2 3 4 5 6 7 8 9 10
Mean = 7.125
SD = 2.016
Northern America & ANZ
.25
.1
.05
.3
.15
.35
.2
0 1 2 3 4 5 6 7 8 9 10
Mean = 6.578
SD = 2.329
Latin America & Caribbean
.25
.1
.05
.3
.15
.35
.2
0 1 2 3 4 5 6 7 8 9 10
Mean = 6.575
SD = 1.944
Western Europe
.25
.1
.05
.3
.15
.35
.2
0 1 2 3 4 5 6 7 8 9 10
Mean = 5.554
SD = 2.152
Central and Eastern Europe
.25
.1
.05
.3
.15
.35
.2
0 1 2 3 4 5 6 7 8 9 10
Mean = 5.502
SD = 2.073
Commonwealth of Independent States
.25
.1
.05
.3
.15
.35
.2
0 1 2 3 4 5 6 7 8 9 10
Mean = 5.363
SD = 1.963
Southeast Asia
.25
.1
.05
.3
.15
.35
.2
0 1 2 3 4 5 6 7 8 9 10
Mean = 5.288
SD = 2.000
East Asia
.25
.1
.05
.3
.15
.35
.2
0 1 2 3 4 5 6 7 8 9 10
Mean = 4.999
SD = 2.452
Middle East & North Africa
.25
.1
.05
.3
.15
.35
.2
0 1 2 3 4 5 6 7 8 9 10
Mean = 4.589
SD = 2.087
South Asia
.25
.1
.05
.3
.15
.35
.2
0 1 2 3 4 5 6 7 8 9 10
Mean = 4.370
SD = 2.115
Sub-Saharan Africa
Figure 2.1: Population-Weighted Distributions of Happiness, 2012-2015 (Part 2)

16
The second and third columns of Table 2.1 use the same six variables to estimate equations for national averages of positive and negative affect, where both are based on averages for answers about yesterday’s emotional experiences. In general, the emotional measures, and especially negative emotions, are much less fully explained by the six variables than are life evaluations. But the differences vary a lot from one circumstance to another. Per-capita income and healthy life expectancy have significant effects on life evalua-tions, but not, in these national average data, on either positive or negative affect. The situation changes when we consider social variables.
Bearing in mind that positive and negative affect are measured on a 0 to 1 scale, while life evalua-tions are on a 0 to 10 scale, social support can be seen to have a similar proportionate effect on positive and negative emotions as on life evalua-tions. Freedom and generosity have even larger influences on positive affect than on the ladder. Negative affect is significantly reduced by social support, freedom, and absence of corruption.
In the fourth column we re-estimate the life evaluation equation from column 1, adding both positive and negative affect to partially imple-
Table 2.1: Regressions to Explain Average Happiness across Countries (Pooled OLS)
Notes: This is a pooled OLS regression for a tattered panel explaining annual national average Cantril ladder responses from all available surveys from 2005 to 2015. See Technical Box 2 for detailed information about each of the predictors. Coefficients are reported with robust standard errors clustered by country in parentheses. ***, **, and * indicate significance at the 1, 5 and 10 percent levels respectively.
Dependent Variable
Independent Variable Cantril Ladder Positive Affect Negative Affect Cantril Ladder
Log GDP per capita 0.338 -0.002 0.011 0.341(0.059)*** (0.009) (0.008) (0.058)***
Social support 2.334 0.253 -0.238 1.768(0.429)*** (0.052)*** (0.046)*** (0.417)***
Healthy life expectancy at birth 0.029 0.0002 0.002 0.028(0.008)*** (0.001) (0.001)* (0.008)***
Freedom to make life choices 1.056 0.328 -0.089 0.315(0.319)*** (0.039)*** (0.045)** (0.316)
Generosity 0.820 0.171 -0.011 0.429(0.276)*** (0.032)*** (0.030) (0.277)
Perceptions of corruption -0.579 0.033 0.092 -0.657(0.282)** (0.030) (0.025)*** (0.271)**
Positive affect 2.297(0.443)***
Negative affect 0.050(0.506)
Year fixed effects Included Included Included Included
Number of countries 156 156 156 156
Number of observations 1,118 1,115 1,117 1,114
Adjusted R-squared 0.741 0.497 0.226 0.765

W O R L D H A P P I N E S S R E P O R T 2 0 1 6 | U P D AT E
17
Technical Box 2: Detailed information about each of the predictors in Table 2.1
1. GDP per capita is in terms of Purchasing Power Parity (PPP) adjusted to constant 2011 international dollars, taken from the World Development Indicators (WDI) released by the World Bank in December 2015. See the appendix for more details. GDP data for 2015 are not yet available, so we extend the GDP time series from 2014 to 2015 using coun-try-specific forecasts of real GDP growth from the OECD Economic Outlook No. 98 (Edition 2015/2) and World Bank’s Global Economic Prospects (December 2014 release), after ad-justment for population growth. The equa-tion uses the natural log of GDP per capita, since that form fits the data significantly bet-ter than does GDP per capita.
2. The time series of healthy life expectancy at birth are constructed based on data from the World Health Organization (WHO) and the World Development Indicators (WDI). WHO publishes the data on healthy life expectancy for the year 2012. The time series of life ex-pectancies, with no adjustment for health, are available in WDI. We adopt the following strategy to construct the time series of healthy life expectancy at birth: first we generate the ratios of healthy life expectancy to life expec-tancy in 2012 for countries with both data. We then apply the country-specific ratios to other years to generate the healthy life expec-tancy data. See the appendix for more details.
3. Social support (or having someone to count on in times of trouble) is the national average of the binary responses (either 0 or 1) to the Gallup World Poll (GWP) question “If you were in trouble, do you have relatives or friends you can count on to help you whenev-er you need them, or not?”
4. Freedom to make life choices is the national average of binary responses to the GWP question “Are you satisfied or dissatisfied with your freedom to choose what you do with your life?”
5. Generosity is the residual of regressing the national average of GWP responses to the question “Have you donated money to a char-ity in the past month?” on GDP per capita.
6. Perceptions of corruption are the average of binary answers to two GWP questions: “Is corruption widespread throughout the gov-ernment or not” and “Is corruption wide-spread within businesses or not?” Where data for government corruption are missing, the perception of business corruption is used as the overall corruption-perception measure.
7. Positive affect is defined as the average of pre-vious-day affect measures for happiness, laughter and enjoyment for GWP waves 3-7 (years 2008 to 2012, and some in 2013). It is defined as the average of laughter and enjoy-ment for other waves where the happiness question was not asked.
8. Negative affect is defined as the average of previous-day affect measures for worry, sad-ness and anger for all waves. See the appen-dix for more details.

18
ment the Aristotelian presumption that sus-tained positive emotions are important supports for a good life.28 The most striking feature is the extent to which the results buttress a finding in psychology, that the existence of positive emo-tions matters much more than the absence of negative ones. Positive affect has a large and highly significant impact in the final equation of Table 2.1, while negative affect has none.
As for the coefficients on the other variables in the final equation, the changes are material only on those variables – especially freedom and generosity – that have the largest impacts on positive affect. Thus we can infer first that positive emotions play a strong role in support of life evaluations, and second that most of the impact of freedom and generosity on life evalua-tions is mediated by their influence on positive emotions. That is, freedom and generosity have a large impact on positive affect, which in turn has an impact on life evaluations. The Gallup World Poll does not have a widely available measure of life purpose to test whether it too would play a strong role in support of high life evaluations. However, data from the large samples of UK data now available does suggest that life purpose plays a strongly supportive role, independent of the roles of life circumstances and positive emotions.
Ranking of Happiness by Country
Figure 2.2 (below) shows the average ladder score (the average answer to the Cantril ladder question, asking people to evaluate the quality of their current lives on a scale of 0 to 10) for each country, averaged over the years 2013-2015. Not every country has surveys in every year; the total sample sizes are reported in the statistical appendix, and are reflected in Figure 2.2 by the horizontal lines showing the 95 percent confi-dence regions. The confidence regions are tighter for countries with larger samples. To increase the number of countries ranked, we also include four countries that had no 2013-
2015 surveys, but did have a survey in 2012. This brings the number of countries shown in Figure 2.2 to 157.
The length of each overall bar represents the average score, which is also shown in numerals. The rankings in Figure 2.2 depend only on the average Cantril ladder scores reported by the respondents.
Each of these bars is divided into seven seg-ments, showing our research efforts to find possible sources for the ladder levels. The first six sub-bars show how much each of the six key variables is calculated to contribute to that country’s ladder score, relative to that in a hypothetical country called Dystopia, so named because it has values equal to the world’s lowest national averages for 2013-2015 for each of the six key variables used in Table 2.1. We use Dystopia as a benchmark against which to compare each other country’s performance in terms of each of the six factors. This choice of benchmark permits every real country to have a non-negative contribution from each of the six factors. We calculate, based on estimates in Table 2.1, a 2013–2015 ladder score in Dystopia to have been 2.33 on the 10-point scale. The final sub-bar is the sum of two components: the calculated average 2013-2015 life evaluation in Dystopia (=2.33) and each country’s own predic-tion error, which measures the extent to which life evaluations are higher or lower than pre-dicted by our equation in the first column of Table 2.1. The residuals are as likely to be negative as positive.29
Returning to the six sub-bars showing the contribution of each factor to each country’s average life evaluation, it might help to show in more detail how this is done. Taking the exam-ple of healthy life expectancy, the sub-bar for this factor in the case of India is equal to the amount by which healthy life expectancy in India exceeds the world’s lowest value, multi-plied by the Table 2.1 coefficient for the influ-

W O R L D H A P P I N E S S R E P O R T 2 0 1 6 | U P D AT E
19
ence of healthy life expectancy on life evalua-tions. The width of these different sub-bars then shows, country-by-country, how much each of the six variables is estimated to contribute to explaining the international ladder differences. These calculations are illustrative rather than conclusive, for several reasons. First, the selec-tion of candidate variables was restricted by what is available for all these countries. Tradi-tional variables like GDP per capita and healthy life expectancy are widely available. But mea-sures of the quality of the social context, which have been shown in experiments and national surveys to have strong links to life evaluations, have not been sufficiently surveyed in the Gallup or other global polls, or otherwise mea-sured in statistics available for all countries. Even with this limited choice, we find that four variables covering different aspects of the social and institutional context – having someone to count on, generosity, freedom to make life choices and absence of corruption – are togeth-er responsible for 50 percent of the average differences between each country’s predicted ladder score and that in Dystopia in the 2013-2015 period. As shown in Table 13 of the Statisti-cal Appendix, the average country has a 2013-2015 ladder score that is 3.05 points above the Dystopia ladder score of 2.33. Of the 3.05 points, the largest single part (31 percent) comes from GDP per capita, followed by social support (26 percent) and healthy life expectancy (18 per-cent), and then by freedom (12 percent), gener-osity (8 percent) and corruption (5 percent).30
Our limited choice means that the variables we use may be taking credit properly due to other better variables, or to un-measurable other factors. There are also likely to be vicious or virtuous circles, with two-way linkages among the variables. For example, there is much evi-dence that those who have happier lives are likely to live longer, to be most trusting, more cooperative, and generally better able to meet life’s demands.31 This will feed back to influence health, GDP, generosity, corruption, and the sense of freedom. Finally, some of the variables
are derived from the same respondents as the life evaluations, and hence possibly determined by common factors. This risk is less using national averages, because individual differences in personality and many life circumstances tend to average out at the national level.
The seventh and final segment is the sum of two components. The first is a fixed baseline num-ber representing our calculation of the ladder score for Dystopia (=2.33). The second compo-nent is the average 2013-2015 residual for each country. The sum of these two components comprises the right-hand sub-bar for each country; it varies from one country to the next because some countries have life evaluations above their predicted values, and others lower. The residual simply represents that part of the national average ladder score that is not ex-plained by our model; with the residual includ-ed, the sum of all the sub-bars adds up to the actual average life evaluations on which the rankings are based.
What do the latest data show for the 2013-2015 country rankings? Two main facts carry over from the previous editions of the World Happi-ness Report. First, there is a lot of year-to-year consistency in the way people rate their lives in different countries. Thus there remains a four-point gap between the 10 top-ranked and the 10 bottom-ranked countries. The top 10 countries in Figure 2.2 are the same countries that were top-ranked in World Happiness Report 2015, although there has been some swapping of places, as is to be expected among countries so closely grouped in average scores. Denmark, for example, was ranked first in World Happiness Report 2013, third in World Happiness Report 2015, and now first again in World Happiness Report 2016 Update. In Figure 2.2, the average ladder score differs only by 0.24 points between the top country and the 10th country. The 10 countries with the lowest average life evaluations are largely the same countries as in the 2015 rank-ing (identical in the case of the bottom 6). Compared to the top 10 countries in the current

20
Figure 2.2: Ranking of Happiness 2013-2015 (Part 1)
1. Denmark(7.526)2. Switzerland(7.509)3. Iceland(7.501)4. Norway(7.498)5. Finland(7.413)6. Canada(7.404)7. Netherlands(7.339)8. NewZealand(7.334)9. Australia(7.313)10. Sweden(7.291)11. Israel(7.267)12. Austria(7.119)13. UnitedStates(7.104)14. CostaRica(7.087)15. PuertoRico(7.039)16. Germany(6.994)17. Brazil(6.952)18. Belgium(6.929)19. Ireland(6.907)20. Luxembourg(6.871)21. Mexico(6.778)22. Singapore(6.739)23. UnitedKingdom(6.725)24. Chile(6.705)25. Panama(6.701)26. Argentina(6.650)27. CzechRepublic(6.596)28. UnitedArabEmirates(6.573)29. Uruguay(6.545)30. Malta(6.488)31. Colombia(6.481)32. France(6.478)33. Thailand(6.474)34. SaudiArabia(6.379)35. Taiwan(6.379)36. Qatar(6.375)37. Spain(6.361)38. Algeria(6.355)39. Guatemala(6.324)40. Suriname(6.269)41. Kuwait(6.239)42. Bahrain(6.218)43. TrinidadandTobago(6.168)44. Venezuela(6.084)45. Slovakia(6.078)46. ElSalvador(6.068)47. Malaysia(6.005)48. Nicaragua(5.992)49. Uzbekistan(5.987)50. Italy(5.977)51. Ecuador(5.976)52. Belize(5.956)53. Japan(5.921)
0 1 2 3 4 5 6 7 8
Explained by: GDP per capita
Explained by: social support
Explained by: healthy life expectancy
Explained by: freedom to make life choices
Explained by: generosity
Explained by: perceptions of corruption
Dystopia (2.33) + residual
95% confidence interval

W O R L D H A P P I N E S S R E P O R T 2 0 1 6 | U P D AT E
21
Figure 2.2: Ranking of Happiness 2013-2015 (Part 2)
0 1 2 3 4 5 6 7 8
54. Kazakhstan (5.919)55. Moldova (5.897)56. Russia (5.856)57. Poland (5.835)58. South Korea (5.835)59. Bolivia (5.822)60. Lithuania (5.813)61. Belarus (5.802)62. North Cyprus (5.771)63. Slovenia (5.768)64. Peru (5.743)65. Turkmenistan (5.658)66. Mauritius (5.648)67. Libya (5.615)68. Latvia (5.560)69. Cyprus (5.546)70. Paraguay (5.538)71. Romania (5.528)72. Estonia (5.517)73. Jamaica (5.510)74. Croatia (5.488)75. Hong Kong (5.458)76. Somalia (5.440)77. Kosovo (5.401)78. Turkey (5.389)79. Indonesia (5.314)80. Jordan (5.303)81. Azerbaijan (5.291)82. Philippines (5.279)83. China (5.245)84. Bhutan (5.196)85. Kyrgyzstan (5.185)86. Serbia (5.177)87. Bosnia and Herzegovina (5.163)88. Montenegro (5.161)89. Dominican Republic (5.155)90. Morocco (5.151)91. Hungary (5.145)92. Pakistan (5.132)93. Lebanon (5.129)94. Portugal (5.123)95. Macedonia (5.121)96. Vietnam (5.061)97. Somaliland region (5.057)98. Tunisia (5.045)99. Greece (5.033)100. Tajikistan (4.996)101. Mongolia (4.907)102. Laos (4.876)103. Nigeria (4.875)104. Honduras (4.871)105. Iran (4.813)106. Zambia (4.795)
Explained by: GDP per capita
Explained by: social support
Explained by: healthy life expectancy
Explained by: freedom to make life choices
Explained by: generosity
Explained by: perceptions of corruption
Dystopia (2.33) + residual
95% confidence interval

22
Figure 2.2: Ranking of Happiness 2013-2015 (Part 3)
0 1 2 3 4 5 6 7 8
Explained by: GDP per capita
Explained by: social support
Explained by: healthy life expectancy
Explained by: freedom to make life choices
Explained by: generosity
Explained by: perceptions of corruption
Dystopia (2.33) + residual
95% confidence interval
107. Nepal (4.793)108. Palestinian Territories (4.754)109. Albania (4.655)110. Bangladesh (4.643)111. Sierra Leone (4.635)112. Iraq (4.575)113. Namibia (4.574)114. Cameroon (4.513)115. Ethiopia (4.508)116. South Africa (4.459)117. Sri Lanka (4.415)118. India (4.404)119. Myanmar (4.395)120. Egypt (4.362)121. Armenia (4.360)122. Kenya (4.356)123. Ukraine (4.324)124. Ghana (4.276)125. Congo (Kinshasa) (4.272)126. Georgia (4.252)127. Congo (Brazzaville) (4.236)128. Senegal (4.219)129. Bulgaria (4.217)130. Mauritania (4.201)131. Zimbabwe (4.193)132. Malawi (4.156)133. Sudan (4.139)134. Gabon (4.121)135. Mali (4.073)136. Haiti (4.028)137. Botswana (3.974)138. Comoros (3.956)139. Ivory Coast (3.916)140. Cambodia (3.907)141. Angola (3.866)142. Niger (3.856)143. South Sudan (3.832)144. Chad (3.763)145. Burkina Faso (3.739)146. Uganda (3.739)147. Yemen (3.724)148. Madagascar (3.695)149. Tanzania (3.666)150. Liberia (3.622)151. Guinea (3.607)152. Rwanda (3.515)153. Benin (3.484)154. Afghanistan (3.360)155. Togo (3.303)156. Syria (3.069)157. Burundi (2.905)

W O R L D H A P P I N E S S R E P O R T 2 0 1 6 | U P D AT E
23
ranking, there is a much bigger range of scores covered by the bottom 10 countries. Within this group, average scores differ by as much as 0.8 points, or 24 percent of the average national score in the group. Second, despite this general consistency and stability, many countries have had, as we shall show later in more detail, substantial changes in average scores, and hence in country rankings, between 2005-2007 and 2013-2015.
When looking at the average ladder scores, it is important to note also the horizontal whisker lines at the right hand end of the main bar for each country. These lines denote the 95 percent confidence regions for the estimates, and coun-tries with overlapping errors bars have scores that do not significantly differ from each other. Thus it can be seen that the four top-ranked countries (Denmark, Switzerland, Iceland, and Norway) have overlapping confidence regions,
and all have national average ladder scores of 7.5 or slightly above. The next five countries (Fin-land, Canada, Netherlands, New Zealand and Australia) all have overlapping confidence regions and average ladder scores between 7.3 and 7.4, while the next two (Sweden and Israel) have almost identical averages just below 7.3.
The 10 countries with the lowest ladder scores 2013-2015 all have averages below 3.7. They span a range more than twice as large as do the 10 top countries, with the two lowest countries having averages of 3.1 or lower. Eight of the 10 are in sub-Saharan Africa, while the remaining two are war-torn countries in other regions (Syria in the Middle East and Afghanistan in South Asia).
Average life evaluations in the top 10 countries are more than twice as high as in the bottom 10, 7.4 compared to 3.4. If we use the first equation of Table 2.1 to look for possible reasons for these
Technical Box 3: Changes in Gallup World Poll research methods
As part of Gallup’s effort to continue to improve its research methods and global coverage, there have been changes to the World Poll’s methods over time that may have an impact on the happi-ness data.
In 2013, Gallup changed from face-to-face inter-viewing to telephone surveying (both cell phone and landline) in Malaysia, the United Arab Emirates, Saudi Arabia, Qatar, Kuwait, Bahrain, and Iraq. In addition, Gallup added interviews in English as a language of interview in addition to Arabic in the United Arab Emirates, Saudi Arabia, Qatar, Kuwait and Bahrain in an effort to reach the large, non-Arab expatriate popula-tion. Due to the three-year rolling average, this is the first report to no longer include face-to-face data from those countries. In addition, Gal-lup switched from face-to-face interviewing to telephone interviewing in Turkey in 2014. Cau-
tion should be used when comparing these data across time periods.
The United Arab Emirates was especially affect-ed by the changes in survey methods, in part be-cause of its newly sampled non-Emirati popula-tion. This has caused its ranking to drop for technical reasons unrelated to life in the UAE. Where the expatriate population is very large, it comes to dominate the overall averages based on the total resident population. The UAE provides a good example case, as it has the largest popula-tion share of expatriates among the Gallup coun-tries, and has sample sizes large enough to make a meaningful comparison. Splitting the UAE sample into two groups would give a 2013-2015 Emirati ladder average of 7.06 (ranking 15th in Figure 2.2), and a non-Emirati average 6.48 (ranking 31st), very close to the overall average of 6.57 (ranking 28th.)

24
very different life evaluations, it suggests that of the 4 point difference, 3 points can be traced to differences in the six key factors: 1.13 points from the GDP per capita gap, 0.8 due to differ-ences in social support, 0.5 to differences in healthy life expectancy, 0.3 to differences in freedom, 0.2 to differences in corruption, and 0.13 to differences in generosity. Income differ-ences are more than one-third of the total explanation because, of the six factors, income is the most unequally distributed among countries. GDP per capita is 25 times higher in the top 10 than in the bottom 10 countries.32
Overall, the model explains quite well the life evaluation differences within as well as between regions and for the world as a whole.33 However, on average the countries of Latin America have average life evaluations that are higher (by about 0.6 on the 10 point scale) than predicted by the model. This difference has been found in earlier work, and variously been considered to repre-sent systematic personality differences, some unique features of family and social life in Latin countries, or some other cultural differences.34 In partial contrast, the countries of East Asia have average life evaluations below those pre-dicted by the model, a finding that has been thought to reflect, at least in part, cultural differences in response style. It is also possible that both differences are in substantial measure due to the existence of important excluded features of life that are more prevalent in those countries than elsewhere.35 It is reassuring that our findings about the relative importance of the six factors are generally unaffected by whether or not we make explicit allowance for these regional differences.36
Changes in the Levels of Happiness
In this section we consider how life evaluations have changed. For life evaluations, we consider the changes from 2005-2007, before the onset of the global recession, to 2013-2015, the most recent three-year period for which data from the
Gallup World Poll are available. We present first the changes in average life evaluations.
In Figure 2.3 we show the changes in happiness levels for all 126 countries having sufficient numbers of observations for both 2005-2007 and 2013-2015.37
Of the 126 countries with data for 2005-2007 and 2013-2015, 55 had significant increases, ranging from 0.13 to 1.29 points on the 0 to 10 scale, while 45 showed significant decreases, ranging from -0.12 to -1.29 points, with the remaining 26 countries showing no significant change. Among the 20 top gainers, all of which showed average ladder scores increasing by 0.50 or more, eight are in the Commonwealth of Independent States and Eastern Europe, seven in Latin America, two in sub-Saharan Africa, Thailand and China in Asia, and Macedonia in Western Europe. Among the 20 largest losers, all of which showed ladder reductions of 0.44 or more, five were in the Middle East and North Africa, five were in sub-Saharan Africa, four were in Western Europe, three in Latin America and the Caribbean, two in Asia and one in the Commonwealth of Independent States.
These gains and losses are very large, especially for the 10 most affected gainers and losers. For each of the 10 top gainers, the average life evaluation gains exceeded those that would be expected from a doubling of per capita incomes. For each of the 10 countries with the biggest drops in average life evaluations, the losses were more than would be expected from a halving of GDP per capita. Thus the changes are far more than would be expected from income losses or gains flowing from macroeconomic changes, even in the wake of an economic crisis as large as that following 2007.
On the gaining side of the ledger, the inclusion of four Latin American countries among the top 10 gainers is emblematic of broader Latin American experience. The analysis in Figure

25
W O R L D H A P P I N E S S R E P O R T 2 0 1 6 | U P D AT E
Figure 2.3: Changes in Happiness from 2005-2007 to 2013-2015 (Part 1)
-1.5 -1.2 -0.9 -0.6 -0.3 0.0 0.3 0.6 0.9 1.2
-1.5 -1.2 -0.9 -0.6 -0.3 0.0 0.3 0.6 0.9 1.2
1. Nicaragua(1.285)2. SierraLeone(1.028)3. Ecuador(0.966)4. Moldova(0.959)5. Latvia(0.872)6. Chile(0.826)7. Slovakia(0.814)8. Uruguay(0.804)9. Uzbekistan(0.755)10. Russia(0.738)11. Peru(0.730)12. Azerbaijan(0.642)13. Zimbabwe(0.639)14. Thailand(0.631)15. Macedonia(0.627)16. ElSalvador(0.572)17. Georgia(0.561)18. Paraguay(0.536)19. China(0.525)20. Kyrgyzstan(0.515)21. Germany(0.486)22. Brazil(0.474)23. Tajikistan(0.474)24. Argentina(0.457)25. PuertoRico(0.446)26. Serbia(0.426)27. Philippines(0.425)28. Cameroon(0.413)29. Colombia(0.399)30. Zambia(0.381)31. Bulgaria(0.373)32. TrinidadandTobago(0.336)33. Bolivia(0.322)34. Kazakhstan(0.322)35. PalestinianTerritories(0.321)36. Romania(0.310)37. Mongolia(0.298)38. Kosovo(0.298)39. SouthKorea(0.295)40. Indonesia(0.295)41. Haiti(0.274)42. BosniaandHerzegovina(0.263)
Changes from 2005–2007 to 2013–2015 95% confidence interval

26
-1.5 -1.2 -0.9 -0.6 -0.3 0.0 0.3 0.6 0.9 1.2
Figure 2.3: Changes in Happiness from 2005-2007 to 2013-2015 (Part 2)
Changes from 2005–2007 to 2013–2015 95% confidence interval
-1.5 -1.2 -0.9 -0.6 -0.3 0.0 0.3 0.6 0.9 1.2
43. Israel(0.258)44. Mexico(0.225)45. Turkey(0.216)46. Guatemala(0.211)47. Panama(0.191)48. Taiwan(0.190)49. Bangladesh(0.170)50. Belarus(0.165)51. Estonia(0.165)52. Kuwait(0.164)53. Benin(0.154)54. Nepal(0.135)55. CzechRepublic(0.126)56. Togo(0.100)57. Singapore(0.099)58. Poland(0.098)59. Norway(0.082)60. Nigeria(0.075)61. DominicanRepublic(0.070)62. Hungary(0.070)63. Mali(0.059)64. Lebanon(0.059)65. Mauritania(0.052)66. Cambodia(0.045)67. SriLanka(0.037)68. Switzerland(0.035)69. Albania(0.021)70. Australia(0.002)71. Austria(-0.003)72. Sweden(-0.017)73. Chad(-0.025)74. Montenegro(-0.035)75. Canada(-0.041)76. Slovenia(-0.044)77. Kenya(-0.044)78. HongKong(-0.053)79. Lithuania(-0.069)80. Liberia(-0.080)81. NewZealand(-0.097)82. Netherlands(-0.119)83. Malaysia(-0.132)84. Niger(-0.144)85. UnitedKingdom(-0.161)86. UnitedArabEmirates(-0.161)
27
W O R L D H A P P I N E S S R E P O R T 2 0 1 6 | U P D AT E
-1.5 -1.2 -0.9 -0.6 -0.3 0.0 0.3 0.6 0.9 1.2
Figure 2.3: Changes in Happiness from 2005-2007 to 2013-2015 (Part 3)
87. BurkinaFaso(-0.170)88. CostaRica(-0.171)89. Malawi(-0.205)90. Armenia(-0.226)91. Ireland(-0.238)92. Finland(-0.259)93. UnitedStates(-0.261)94. Portugal(-0.282)95. Madagascar(-0.285)96. Vietnam(-0.299)97. Belgium(-0.311)98. Namibia(-0.312)99. Senegal(-0.328)100.Croatia(-0.333)101.France(-0.336)102.Laos(-0.344)103.Uganda(-0.356)104.Pakistan(-0.374)105.Honduras(-0.375)106.Denmark(-0.401)107.Japan(-0.446)108.Tanzania(-0.460)109.Belize(-0.495)110. Iran(-0.507)111. Ghana(-0.600)112. Jordan(-0.638)113. SouthAfrica(-0.686)114. Cyprus(-0.692)115. Jamaica(-0.698)116.Rwanda(-0.700)117. Ukraine(-0.701)118. Spain(-0.711)119. Italy(-0.735)120.India(-0.750)121. Yemen(-0.754)122.Venezuela(-0.762)123. Botswana(-0.765)124.SaudiArabia(-0.794)125. Egypt(-0.996)126.Greece(-1.294)
-1.5 -1.2 -0.9 -0.6 -0.3 0.0 0.3 0.6 0.9 1.2
Changes from 2005–2007 to 2013–2015 95% confidence interval

28
3.10 of Chapter 3 of World Happiness Report 2015 showed that Latin Americans in all age groups reported substantial and continuing increases in life evaluations between 2007 and 2013. Five transition countries are also among the top 10 gainers, matching the rising average life evalua-tions for the transition countries taken as a group. The appearance of sub-Saharan African countries among the biggest gainers and the big-gest losers reflects the variety and volatility of experiences among the 25 sub-Saharan coun-tries for which changes are shown in Figure 2.3.
The 10 countries with the largest declines in average life evaluations typically suffered some combination of economic, political and social stresses. Three of the countries (Greece, Italy and Spain) were among the four hard-hit euro-zone countries whose post-crisis experience was analyzed in detail in World Happiness Report 2013. A series of recent annual declines has now pushed Ukraine into the group of 10 largest happiness declines, joining India, Venezuela, Saudi Arabia, two North African countries, Egypt and Yemen, and Botswana.
Looking at the list as a whole, and not just at the largest gainers and losers, what were the circum-stances and policies that enabled some countries to navigate the recession, in terms of happiness, better than others? The argument was made in World Happiness Report 2013 and World Happiness Report 2015 that the strength of the underlying social fabric, as represented by levels of trust and institutional quality, affects a society’s resilience in response to economic and social crises. We gave Greece, which remains the biggest happi-ness loser in Figure 2.3 (improved from World Happiness Report 2015, but still almost 1.3 points down from 2005-2007 to 2013-2015), special attention, because the well-being losses were so much greater than could be explained directly by economic outcomes. The report provided evi-dence of an interaction between social capital and economic or other crises, with the crisis providing a test of the quality of the underlying social fabric.38 If the fabric is sufficiently strong,
then the crisis may even lead to higher subjec-tive well-being, in part by giving people a chance to work together towards good purpose, and to realize and appreciate the strength of their mutual social support; and in part because the crisis will be better handled and the underlying social capital improved in use.
For this argument to be convincing requires examples on both sides of the ledger. It is one thing to show cases where the happiness losses were very big and where the erosion of the social fabric appeared to be a part of the story. But what examples are there on the other side? With respect to the post-2007 economic crisis, the best examples of happiness maintenance in the face of large external shocks are Ireland and especially Iceland. Both suffered decimation of their banking systems as extreme as anywhere, and yet have suffered incommensurately small happiness losses. In the Icelandic case, the post-shock recovery in life evaluations has been great enough to put Iceland third in the global rankings for 2013-2015. That there is a continu-ing high degree of social support in both coun-tries is indicated by the fact that of all the coun-tries surveyed by the Gallup World Poll, the percentage of people who report that they have someone to count on in times of crisis is excep-tionally high in Iceland and Ireland.39
If the social context is important for happi-ness-supporting resilience under crisis, it is likely to be equally applicable for non-economic crises. There is now research showing that levels of trust and social capital in the Fukushima region of Japan were sufficient that the Great East Japan Earthquake of 2011 actually led to increased trust and happiness in the region.40 The happiness effects of crisis response may also be mediated through generosity triggered by a large natural disaster, with the additional generosity adding to happiness.41
What can be learned by using the six-variable explanation of Table 2.1 to explain happiness

29
W O R L D H A P P I N E S S R E P O R T 2 0 1 6 | U P D AT E
changes between 2005-2007 and 2013-2015 in countries and global regions? We have per-formed this exercise on a population-weighted basis to compare actual and predicted regional changes in happiness, and find that the equation provides a significant part of the story, while leaving lots of remaining puzzles. As shown in Table 31 of the Statistical Appendix, the model does best in explaining the average increase of 0.4 points in the Commonwealth of Indepen-dent States, and the average decreases of 0.23 points in Western Europe and North America & ANZ countries. For the Commonwealth of Independent States, the gains arise from im-provements in all six variables. For Western Europe, meanwhile, expected gains from im-provements in healthy life expectancy and corruption combined with no GDP growth and declines in the other three variables to explain more than half of the actual change of 0.23 points. The largest regional drop (-0.6 points) was in South Asia, in which India has by far the largest population share, and is unexplained by the model, which shows an expected gain based on improvements in five of the six variables, offset by a drop in social support.
The same framework can be used to try to explain the changes for the two groups of 10 countries, the biggest gainers and the biggest losers. For the group of 10 countries with the largest gains, on average they had increases in all six variables, to give an expected gain of 0.29 points, compared to the actual average increase of 0.9 points.42 For the group of 10 countries with the largest drops, GDP per capita was on average flat, expected gains in healthy life expectancy (which are driven by long term trends not responsive to current life circum-stances) were offset by worsening in each of the four social variables, with the biggest predicted drops coming from lower social support and losses in perceived freedom to make life choices. Of the average loss equal to 0.8 points, 0.17 was predicted by the partially offsetting effects from changes in the six variables.
The World Happiness Report 2015 also considered evidence that good governance has enabled countries to sustain or improve happiness during the economic crisis. Results presented there suggested not just that people are more satisfied with their lives in countries with better governance, but also that actual changes in governance quality since 2005 have led to significant changes in the quality of life.43 For this report we have updated that analysis using an extended version of the model that includes country fixed effects, and hence tries to explain the changes going on from year to year in each country. Our new results, as shown in Table 11 of the Statistical Appendix, show GDP per capita and changes in governmental quality to have both contributed significantly to changes in life evaluations over the 2005 to 2015 period.
Inequality and Happiness
The basic argument in this section is that in-equality is best measured by looking at the distribution of life evaluations across those with very low, medium and high evaluations. If it is true, as we have argued before, that subjective well-being provides a broader and more inclu-sive measure of the quality of life than does income, then so should the inequality of subjec-tive well-being provide a more inclusive and meaningful measure of the distribution of well-being among individuals within a society.
However, although there has been increasing and welcome attention in recent years to ques-tions of distribution and inequality, that atten-tion has been almost entirely focused on the nature and consequences of economic equality, especially the distribution of income and wealth. The United Nations,44 the World Bank,45 and the OECD46 have produced reports recently on the risks of rising economic inequality, and several prominent researchers have published recent books.47 All have concentrated on the sources and consequences of economic inequal-ity, principally relating to the distribution of

30
income and wealth. There have also been studies of inequality of health care and out-comes48, access to education, and equality of opportunity49 more generally.
Much has and can be learned from these studies of inequality in different aspects of life. But would it not be helpful to have a measure of distribution that has some capacity to bring the different facets of inequality together, and to assess their joint consequences? Just as we have argued that subjective well-being provides a broader and more appropriate measure of human progress, so does the distribution of happiness provide a parallel and better measure of the consequences of any inequalities in the distribution of key variables, e.g. incomes, health, education, freedom and justice, that underpin the levels and distribution of human happiness.
In the middle of the 20th Century, Simon Kuznets surveyed data from economic history over the preceding decades to expose a pattern whereby economic inequality would increase in the early stages of industrialization, principally driven by the transfer of some workers from lower-paid rural to higher paid urban industrial jobs.50 He hypothesized that when this transfer was largely accomplished, attention would turn, as it did in many industrial countries in the middle decades of the 20th century, to the design of social safety nets, and more widely available health care and education, intended to spread the benefits of economic growth more evenly among the popula-tion. Thus the so-called Kuznets curve, with economic inequality at first growing and then declining as economic growth proceeds. Among the industrial countries of the OECD, that pattern was largely in evidence for the first three-quarters of the 20th Century. But then, for reasons that are varied and still much debated,51 the inequality of incomes and wealth has grown significantly in most of these same countries. The OECD esti-mates that during the period from the mid-1980s to 2013, income inequality grew significantly in 17 of 22 countries studied, with only one country showing a significant decrease.52
For the majority of the world’s population living outside the OECD countries, economic growth and industrialization has happened much later. This might suggest, if the Kuznets analysis were still to hold, that income inequality would have kept growing for longer before turning around. This appears to have been the case, with the United Nations reporting that for most countries in the world income inequality rose from 1980 to 2000 and then fell between then and 2010.53 World Bank data for subsequent changes in within-nation income inequality are still rather patchy, and show a mixed picture from which it is too early to construct a meaningful average.54
What are the consequences of inequality for subjective well-being? There are arguments both ethical and empirical suggesting that humans are or at least ought to be happier to live where there is more equality of opportuni-ties and generally of outcomes as well. Beyond such direct links between inequality and subjec-tive well-being, income inequalities have been argued to be responsible for damage to other key supports for well-being, including social trust, safety, good governance, and both the average quality of and equal access to health and education, - important, in turn, as supports for future generations to have more equal opportunities. Others have paid more direct attention to inequalities in the distribution of various non-income supports to well-being, without arguing that these inequalities were driven by income inequality.
If we are right to argue that broadening the policy focus from GDP to happiness should also entail broader measures of inequality, and if it is true that people are happier living in more equal societies, then we should expect to find that well-being inequality is a better predictor of average well-being levels than is the inequality of income. Comparative evidence on the relative information content of different measures of inequality is relatively scarce. For international comparison of the prevalence of poverty, an important channel though which inequality

W O R L D H A P P I N E S S R E P O R T 2 0 1 6 | U P D AT E
31
affects well-being, it has been argued that people’s own subjective assessments of the quality of their lives, including access to food and other essential supports, should supplement and may even be preferable to the construction of poverty estimates based on the comparison of money incomes.55
Thus the broader availability and possibly more relevant measurement of well-being inequalities should help them to perform better as factors explaining life evaluations. There is, however, only a short span of historical data available for such comparisons. One recent study, based on data from the World Values Survey and panel data from several industrial countries, reported evidence of a ‘great moderation’ in the inequali-ty of well-being, with downward trends evident in most countries.56 That was argued to repre-sent a favorable outcome, on the assumption that most people would prefer more equality. The data we shall present later on recent trends in well-being inequality suggest a less sanguine view. Countries with significantly greater in-equality of life evaluations in the 2012-2015 period, compared to the 2005-2011 base period, are five times more numerous than countries with downward trends.
A companion research paper57 compares income inequality (as measured by the Gini coefficient) with well-being inequality (measured by the standard deviation of the distribution of life evaluations), as predictors of life evaluations, making use of three international surveys and one large domestic US survey. In each case well-being inequality is estimated to have a stronger negative impact of life evaluations than does the inequality of income. To buttress this evidence, which is subject to the possibilities of measurement bias arising from the limited number of response categories, two ancillary tests were run. First, it was confirmed that the estimated effects of well-being inequality are greater for those individuals who said they wish to see inequalities reduced. 58 A second test made use of the established indirect linkage run-
ning from inequality to reduced social trust, with subsequent implications for well-being. If well-being inequality is a better umbrella mea-sure of inequality than income inequality, then it might also be expected to be a better predictor of social trust. This is an especially appropriate test since the inequality of income has been a long-established explanation for international differences in social trust, 59 and several forms of trust have been found to provide strong support for subjective well-being. 60 In all three international surveys, trust was better predicted by a country’s inequality of life evaluations than by its inequality of incomes.61 These auxiliary tests provide assurance that there are likely to be real effects running, both directly and indi-rectly, from well-being inequality to the level of well-being.
We have also tested the inequality of life evaluations and the inequality of income in the context of the equation of Table 2.1, and find a significant negative effect running from the inequality of well-being to average life evalua-tions.62 The effects from income inequality are mixed, depending on which measure is used.63 The strongest equations come from using the inequality of life evaluations along with the inequality of incomes varying each year based on the income data provided by the respon-dents to the Gallup World Poll. Both inequality measures are associated with lower average life evaluations.64
Having presented evidence that the inequality of well-being deserves more attention, we turn now to consider first the levels and then changes in the standard deviation of life evaluations.65 For the levels, Figure 2.4 shows population-weighted regional estimates, and Figure 2.5 the national estimates for each country’s standard deviations of ladder answers based on all available surveys from 2012-2015. In part because we combine data from four years, to increase the sample size, we are able to identify significant in-ter-country differences.66 The standard devia-tions are negatively correlated with the average

32
ladder estimates,67 and we have already shown that they contribute significantly in explaining average happiness, above and beyond what is captured by the six main variables in Table 2.1. There is a positive correlation between income inequality and well-being inequality in our data, but we would naturally expect well-being in-equality to be explained also by the inequalities in the distribution of all the other supports for better lives and it would be nice to be able to see if well-being inequality could itself be explained. Unfortunately most of the other supports for well-being are not yet measured in a way that can show the inequality of their distribution among members of a society.68
Figure 2.4 shows that two regions – the Middle East & North Africa, and Latin America & Caribbean – have significantly more inequality of life assessments within their regions than is true for the world population as a whole. All of the other regions have significantly less inequali-ty, with the three most equal regions, in order, being Western Europe, Southeast Asia, and East Asia. The fact that well-being inequality is greater for the world as a whole than in most global regions is another reflection of the fact that regions, like the countries within them,
tend to have life circumstances that are more similar within the country or region than they are to conditions elsewhere in the world.
Figure 2.5 shows that the country rankings for equality of well-being are, like the regional rankings, quite different from those of average life evaluations. Bhutan, which ranks of the middle of the global distribution of average life evaluations, has the top ranking for equality. From an inequality average below 1.5 in Bhutan, Comoros and the Netherlands, the standard deviations rise up to values above 3.0 in the three most unequal countries, South Sudan, Sierra Leone and Liberia. The least unequal countries, as measured the standard deviation of life evaluations, contain a mix of countries from various parts of the happiness rankings shown in Figure 2.2. Of the 20 most equal countries, seven also appear in the top 20 countries in terms of average happiness. Of the 20 least equal, none except for Puerto Rico are among the top twenty in happiness, and most are in the bottom half of the world distribution, except for a few countries in Latin America and the Carib-bean, where life evaluations and inequality are both higher than average.
Standard deviation 2012–2015 95% confidence interval
0.0 0.5 1.0 1.5 2.0 2.5
1. WesternEurope(1.944)
2. SoutheastAsia(1.963)
3. EastAsia(2.000)
4. NorthernAmerica&ANZ(2.016)
5. TheCommonwealthofIndependentStates(2.073)
6. SouthAsia(2.087)
7. Sub-SaharanAfrica(2.115)
8. CentralandEasternEurope(2.152)
9. World(2.243)
10. LatinAmerica&Caribbean(2.329)
11. MiddleEast&NorthAfrica(2.452)
Figure 2.4: Ranking of Standard Deviation of Happiness 2012-2015, by Region
33
W O R L D H A P P I N E S S R E P O R T 2 0 1 6 | U P D AT E
0.0 0.5 1.0 1.5 2.0 2.5 3.0 3.5
Figure 2.5: Ranking of Standard Deviation of Happiness by Country 2012-2015 (Part 1)
Standard deviation 2012–2015 95% confidence interval
0.0 0.5 1.0 1.5 2.0 2.5 3.0 3.5
1. Bhutan(1.294)2. Comoros(1.385)3. Netherlands(1.397)4. Singapore(1.538)5. Iceland(1.569)6. Luxembourg(1.574)7. Switzerland(1.583)8. Senegal(1.598)9. Afghanistan(1.598)10. Finland(1.598)11. Vietnam(1.599)12. Mauritania(1.600)13. Rwanda(1.601)14. Sweden(1.604)15. Madagascar(1.616)16. Congo(Kinshasa)(1.619)17. Belgium(1.647)18. NewZealand(1.649)19. Azerbaijan(1.649)20. Tajikistan(1.656)21. Myanmar(1.661)22. Denmark(1.674)23. Norway(1.677)24. Israel(1.685)25. Laos(1.696)26. Indonesia(1.702)27. Mongolia(1.705)28. Niger(1.705)29. Canada(1.726)30. Australia(1.756)31. Benin(1.757)32. Guinea(1.794)33. Kyrgyzstan(1.798)34. Ireland(1.801)35. Thailand(1.803)36. Germany(1.805)37. Austria(1.819)38. France(1.845)39. Somalilandregion(1.848)40. Lithuania(1.848)41. Moldova(1.850)42. HongKong(1.854)43. Chad(1.855)44. Latvia(1.862)45. Turkmenistan(1.874)46. UnitedKingdom(1.875)47. Algeria(1.877)48. Taiwan(1.878)49. Ethiopia(1.884)50. Japan(1.884)51. Estonia(1.888)52. Spain(1.899)
0.0 0.5 1.0 1.5 2.0 2.5 3.0 3.5

34
0.0 0.5 1.0 1.5 2.0 2.5 3.0 3.5
Figure 2.5: Ranking of Standard Deviation of Happiness by Country 2012-2015 (Part 2)
Standard deviation 2012–2015 95% confidence interval
0.0 0.5 1.0 1.5 2.0 2.5 3.0 3.5
53. Morocco(1.916)54. Belarus(1.930)55. Mali(1.933)56. Poland(1.935)57. Paraguay(1.937)58. SriLanka(1.941)59. Slovakia(1.942)60. Suriname(1.948)61. BurkinaFaso(1.954)62. Kazakhstan(1.962)63. Ukraine(1.964)64. Mauritius(1.964)65. Bolivia(1.965)66. CzechRepublic(1.972)67. Italy(1.973)68. Croatia(1.974)69. Nigeria(1.976)70. Bangladesh(1.980)71. Malta(1.981)72. Georgia(1.986)73. China(1.986)74. IvoryCoast(1.991)75. Uganda(1.992)76. Gabon(2.001)77. UnitedArabEmirates(2.018)78. Nepal(2.038)79. Kenya(2.041)80. Argentina(2.046)81. Russia(2.048)82. Malaysia(2.052)83. Hungary(2.053)84. Chile(2.060)85. UnitedStates(2.066)86. Slovenia(2.077)87. Togo(2.079)88. Zimbabwe(2.084)89. Uzbekistan(2.088)90. India(2.091)91. Bulgaria(2.103)92. Tunisia(2.114)93. Pakistan(2.122)94. Kuwait(2.127)95. SouthAfrica(2.143)96. SouthKorea(2.155)97. Mexico(2.157)98. Peru(2.157)99. CostaRica(2.163)100.TrinidadandTobago(2.163)101.Bahrain(2.176)102.Sudan(2.176)103.Uruguay(2.190)104.Armenia(2.191)105.Qatar(2.204)

35
0.0 0.5 1.0 1.5 2.0 2.5 3.0 3.5
W O R L D H A P P I N E S S R E P O R T 2 0 1 6 | U P D AT E
Figure 2.5: Ranking of Standard Deviation of Happiness by Country 2012-2015 (Part 3)
Standard deviation 2012–2015 95% confidence interval
0.0 0.5 1.0 1.5 2.0 2.5 3.0 3.5
106.Haiti(2.205)107.Ghana(2.216)108.Burundi(2.216)109.Botswana(2.230)110.Cambodia(2.235)111. Angola(2.238)112. Brazil(2.242)113. Tanzania(2.247)114. Egypt(2.249)115. Serbia(2.254)116.Ecuador(2.256)117. Cameroon(2.262)118. Kosovo(2.265)119.PalestinianTerritories(2.266)120.Turkey(2.267)121. Macedonia(2.290)122.Lebanon(2.307)123. Yemen(2.321)124.BosniaandHerzegovina(2.333)125. Romania(2.335)126.Portugal(2.359)127.Montenegro(2.363)128.Colombia(2.372)129.Greece(2.379)130.NorthCyprus(2.385)131. Jordan(2.414)132. SaudiArabia(2.417)133. Somalia(2.418)134. Panama(2.430)135. ElSalvador(2.448)136.Albania(2.452)137. Belize(2.455)138. Cyprus(2.456)139.Libya(2.460)140.Zambia(2.463)141. PuertoRico(2.475)142.Venezuela(2.481)143. Iran(2.558)144.Syria(2.563)145. Philippines(2.580)146.Nicaragua(2.674)147.Iraq(2.695)148.Congo(Brazzaville)(2.717)149.Guatemala(2.719)150.Namibia(2.725)151. Malawi(2.734)152. Jamaica(2.769)153. Honduras(2.819)154. DominicanRepublic(2.874)155. Liberia(3.003)156.SierraLeone(3.008)157. SouthSudan(3.044)

36
To measure changes in the distribution of happiness, we compare the standard deviation of life evaluations using all of the Gallup World Poll data from 2005 to 2011 (the period covered by our assessment of the inequality of subjective well-being in the first World Happiness Report) to the average for the four subsequent survey years, 2012 to 2015.69 This is done for the world as a whole and 10 global regions in Figure 2.6, and for individual countries in Figure 2.7. In both figures we order the regions and countries by the size of the change in inequality from 2005-2011 to 2012-2015, starting at the top with the regions and countries where inequality has fallen the most or increased the least.
For the world as a whole, our population-weight-ed estimates show inequality of well-being growing significantly from 2005-2011 to 2012-2015, by an amount equaling about 5 percent of the estimated 2005-2011 standard deviation. The Latin American and Caribbean region shows an insignificantly small reduction in inequality, and Central and Eastern Europe an insignificantly small increase. All of the other regions show significant increases in well-being inequality. The two regions with the sharpest increases in
inequality are the Middle East and North Africa and sub-Saharan Africa. The biggest relative increase in well-being inequality was in sub-Sa-haran Africa, where it grew by 15 percent of its 2005-2011 level. The corresponding increase was 13 percent in the Middle East & North Africa.
Looking at the national-level inequality-change data for the 149 countries with sufficient data to make the calculations, about a tenth had signifi-cant reductions in happiness inequality, while more than half had significant increases. The remaining one-third of countries showed no significant change. It is perhaps noteworthy that Iceland, the country showing the second largest reduction in inequality, was a country that was facing a deep banking crisis in 2008, but had managed to accept the consequences and rebuild average happiness by 2012-2013, when the second round of surveys was taken. 70 Iceland was noted earlier to have a very high fraction of the population having someone they could count on in times of trouble; the build-up and aftermath of the banking crisis put the Icelandic social fabric to a serious test. The subsequent recovery of average happiness suggests that the test was passed. It is perhaps significant that the happiness
Changes in standard deviation 95% confidence interval
0.0 0.5 1.0 1.5 2.0 2.5
1. LatinAmerica&Caribbean(-0.004)
2. CentralandEasternEurope(0.027)
3. WesternEurope(0.059)
4. EastAsia(0.064)
5. TheCommonwealthofIndependentStates(0.098)
6. World(0.123)
7. NorthernAmerica&ANZ(0.125)
8. SouthAsia(0.152)
9. SoutheastAsia(0.199)
10. Sub-SaharanAfrica(0.272)
11. MiddleEast&NorthAfrica(0.290)
Figure 2.6: Changes in Population-Weighted Standard Deviation of Happiness from 2005-2011 to 2012-2015, for the World and 10 Regions

W O R L D H A P P I N E S S R E P O R T 2 0 1 6 | U P D AT E
37
0.0 0.5 1.0 1.5
Figure 2.7: Changes in Standard Deviation of Happiness from 2005-2011 to 2012-2015 (Part 1)
Changes in standard deviation 95% confidence interval
1. Pakistan(-0.425)2. Iceland(-0.376)3. Malta(-0.232)4. Afghanistan(-0.221)5. DominicanRepublic(-0.201)6. Chile(-0.182)7. Paraguay(-0.178)8. Israel(-0.156)9. Azerbaijan(-0.153)10. PuertoRico(-0.138)11. Comoros(-0.124)12. Lithuania(-0.113)13. Moldova(-0.106)14. Taiwan(-0.096)15. Peru(-0.090)16. Colombia(-0.072)17. Spain(-0.071)18. Mauritania(-0.068)19. Slovenia(-0.060)20. Croatia(-0.053)21. Japan(-0.052)22. Congo(Kinshasa)(-0.046)23. Luxembourg(-0.045)24. Nicaragua(-0.043)25. NewZealand(-0.043)26. Poland(-0.042)27. HongKong(-0.041)28. Mexico(-0.037)29. Germany(-0.034)30. Lebanon(-0.031)31. Botswana(-0.030)32. Argentina(-0.025)33. Somalilandregion(-0.024)34. Ukraine(-0.023)35. Brazil(-0.020)36. Switzerland(-0.017)37. Hungary(-0.015)38. Sweden(-0.014)39. Ireland(-0.001)40. Rwanda(0.001)41. PalestinianTerritories(0.004)42. UnitedKingdom(0.004)43. Mauritius(0.007)44. SouthKorea(0.011)45. Turkey(0.013)46. Slovakia(0.017)47. Canada(0.017)48. TrinidadandTobago(0.019)49. CzechRepublic(0.020)50. Mongolia(0.024)
-0.6 -0.3 0.0 0.3 0.6 0.9 1.2 1.5

38
-0.6 -0.3 0.0 0.3 0.6 0.9 1.2 1.5
51. Angola(0.025)52. Russia(0.029)53. Norway(0.030)54. Italy(0.034)55. Ecuador(0.034)56. Egypt(0.035)57. Thailand(0.043)58. Singapore(0.050)59. Australia(0.052)60. Austria(0.053)61. Gabon(0.057)62. Georgia(0.059)63. Guinea(0.059)64. Uruguay(0.059)65. Senegal(0.061)66. Yemen(0.064)67. Finland(0.070)68. Belarus(0.072)69. Latvia(0.076)70. France(0.080)71. Indonesia(0.089)72. Benin(0.093)73. Bolivia(0.094)74. Belgium(0.095)75. CostaRica(0.096)76. Estonia(0.099)77. Macedonia(0.107)78. ElSalvador(0.111)79. Turkmenistan(0.111)80. Honduras(0.112)81. Romania(0.113)82. China(0.119)83. Netherlands(0.122)84. SriLanka(0.127)85. Bulgaria(0.134)86. Vietnam(0.135)87. Tajikistan(0.136)88. UnitedStates(0.142)89. Kazakhstan(0.145)90. UnitedArabEmirates(0.148)91. Zimbabwe(0.148)92. Greece(0.155)93. Bangladesh(0.159)94. Bahrain(0.167)95. Serbia(0.168)96. Nigeria(0.177)97. SouthAfrica(0.181)98. BosniaandHerzegovina(0.185)99. Uganda(0.186)100.Venezuela(0.188)
0.0 0.5 1.0 1.5
Figure 2.7: Changes in Standard Deviation of Happiness from 2005-2011 to 2012-2015 (Part 2)
Changes in standard deviation 95% confidence interval

W O R L D H A P P I N E S S R E P O R T 2 0 1 6 | U P D AT E
39
0.0 0.5 1.0 1.5
-0.6 -0.3 0.0 0.3 0.6 0.9 1.2 1.5
101.Armenia(0.192)102.Denmark(0.193)103.Kyrgyzstan(0.195)104.Ghana(0.198)105.Madagascar(0.198)106.Algeria(0.226)107.Panama(0.230)108.India(0.231)109.Montenegro(0.254)110.Niger(0.256)111. Portugal(0.257)112. Togo(0.259)113. Jordan(0.271)114. Qatar(0.273)115. Uzbekistan(0.277)116.Chad(0.287)117. Kosovo(0.288)118. Mali(0.291)119.Cyprus(0.311)120.Philippines(0.324)121. Syria(0.326)122.Nepal(0.347)123. Morocco(0.359)124.Iran(0.370)125. Sudan(0.377)126.Haiti(0.393)127.Tunisia(0.401)128.Tanzania(0.409)129.Belize(0.415)130.Malawi(0.429)131. Malaysia(0.430)132. Kenya(0.436)133. Guatemala(0.438)134. SaudiArabia(0.447)135. BurkinaFaso(0.451)136.Cameroon(0.466)137. IvoryCoast(0.510)138. Albania(0.550)139.Kuwait(0.577)140.Zambia(0.580)141. Jamaica(0.600)142.Burundi(0.616)143. Laos(0.635)144.Congo(Brazzaville)(0.709)145. Cambodia(0.791)146.SierraLeone(0.913)147.Iraq(0.963)148.Namibia(1.218)149.Liberia(1.341)
Figure 2.7: Changes in Standard Deviation of Happiness from 2005-2011 to 2012-2015 (Part 3)
Changes in standard deviation 95% confidence interval

40
inequality created in part by the banking boom and bust was erased in the subsequent recovery of well-being, suggesting a high degree of social resilience in Iceland.
The 10 countries with the largest increases in well-being inequality have all been undergoing significant political, social and economic diffi-culties. To what extent these inequality increases can be explained by changes in the underlying inequalities of income, social supports, health, generosity, corruption, freedom cannot be estimated on the basis of data currently avail-able. This is because many of the key variables are not yet measured using scales with sufficient numbers of categories to permit measures of their inequality to be computed. Thus there remains much to be learned. It is perhaps enough, at this stage, to have made the case for taking well-being inequality seriously, and to have provided evidence on its levels and trends in nations, regions, and the world.
Summary and Conclusions
In presenting and explaining the national-level data in this chapter, we make primary use of people’s own reports of the quality of their lives, as measured on a scale with 10 representing the best possible life and 0 the worst. We average their reports for the years 2013 to 2015, provid-ing a typical national sample size of 3,000. We then rank these data for 157 countries, as shown in Figure 2.2. The 10 top countries are once again all small or medium-sized western indus-trial countries, of which seven are in Western Europe. Beyond the first ten, the geography immediately becomes more varied, with the second 10 including countries from four of the 10 global regions.
In the top 10 countries, life evaluations average 7.4 on the 0 to 10 scale, while for the bottom 10 the average is less than half that, at 3.4. The lowest countries are typically marked by low values on all of the six variables used here to
explain international differences – GDP per capita, healthy life expectancy, social support, freedom, generosity and absence of corruption – and often subject in addition to violence and disease. Of the 4-point gap between the 10 top and 10 bottom countries, more than three-quar-ters is accounted for by differences in the six variables, with GDP per capita, social support and healthy life expectancy the largest contributors.
When we turn to consider life evaluation chang-es for 126 countries between 2005-2007 and 2013-2015, we see lots of evidence of movement, including 55 significant gainers and 45 signifi-cant losers. Gainers especially outnumber losers in Latin America, the Commonwealth of Inde-pendent States and Central and Eastern Europe. Losers outnumber gainers in Western Europe and to a lesser extent in sub-Saharan Africa, Middle East and North Africa. Changes in the six key variables explain a significant proportion of these changes, although the magnitude and natures of the crises facing nations since 2005 have been such as to move some countries into poorly charted waters. We continue to see evidence that major crises have the potential to alter life evaluations in quite different ways according to the quality of the social and institu-tional infrastructure. In particular, as shown in World Happiness Report 2013 and World Happiness Report 2015, there is evidence that a crisis im-posed on a weak institutional structure can actually further damage the quality of the sup-porting social fabric if the crisis triggers blame and strife rather than co-operation and repair. On the other hand, economic crises and natural disasters can, if the underlying institutions are of sufficient quality, lead to improvements rather than damage to the social fabric.71 These im-provements not only ensure better responses to the crisis, but also have substantial additional happiness returns, since people place real value to feeling that they belong to a caring and effective community.
With respect to the inequality of well-being, as measured by the standard deviation of life

W O R L D H A P P I N E S S R E P O R T 2 0 1 6 | U P D AT E
41
evaluations within each country, we find that it varies among countries quite differently from average happiness, and from the inequality of income. We have argued that just as subjective well-being provides a broader and more inclu-sive measure of the quality of life than does income, then so should the inequality of subjec-tive well-being provide a more inclusive and meaningful measure of the distribution of well-being among individuals within a society. We then measured changes since the 2005-2011 averages reported in the first World Happiness Report. We find, in contrast to some earlier evidence of global convergence in happiness equality, that from the first to the second half of our data there has been increased inequality of happiness within most countries, almost all regions, and for the world as a whole. Only one-tenth of countries showed a significant reduction in happiness inequality, while more than half showed a significant increase. The world as a whole and 8 of 10 global regions showed significant increases in well-being inequality from 2005-2011 to 2012-2015. We also found evidence that greater inequality of well-be-ing contributes to lower average well-being.
Discussions about the inequality of income and wealth, and what to do about them, typically include reference to the transfer of resources from richer to poorer to achieve greater equality. Increasing the equality of happiness does not in general require transfer, since building happi-ness for some does not require reduction in the happiness of others. Indeed, one of the side benefits of broadening the focus of policy atten-tion from income and wealth to subjective well-being is that there are many more options for improving average happiness, and increasing equality by improving the lot of those at the bottom, without others being worse off.
Targeting the non-material sources of well-be-ing, which is encouraged by considering a broader measure of well-being, opens possibili-ties for increasing happiness while simultane-ously reducing stress on scarce material resourc-
es. Much more research is needed to fully understand the interplay of factors that deter-mine the inequality of well-being, but there is every hope that simply changing the focus from income inequality to well-being inequality will speed the arrival of a time when the distribution of well-being can be improved, for the benefit of current and future generations in all countries.

42
1 Diener, Lucas, & Oishi (2016) estimate the number of new scientific articles on subjective well-being to have grown by about two orders of magnitude in the past 25 years, from about 130 per year in 1980 to almost 15,000 in 2014.
2 See OECD (2013).
3 As foreshadowed by an OECD case study in the first WHR, and more fully explained in the OECD Chapter in WHR 2013. See Durand & Smith (2013).
4 See Ryff & Singer (2008). The first use of a question about life meaning or purpose in a large-scale international survey was in the Gallup World Poll waves of 2006 and 2007. It was also introduced in the third round of the European Social Survey (Huppert et al. 2009). It has since become one of the four key well-being questions asked by the UK Office for National Statistics (Hicks, Tinkler, & Allin, 2013).
5 Stiglitz, Sen, & Fitoussi (2009, p. 216).
6 OECD (2013, p. 164).
7 The latest OECD list of reporting countries is available as an online annex to this report. See http://worldhappiness.report/wp-content/uploads/sites/2/2015/04/Updat-ed-slide-use-and-implementation.pptx
8 See Helliwell, Layard, & Sachs (2015, Chapter 2, p.14-16). That chapter of World Happiness Report 2015 also explained, on pp. 18-20, why we prefer direct measures of subjective well-being to various indexes of well-being.
9 The Gallup Organization kindly agreed to include the life satisfaction question in 2007 to enable this scientific issue to be addressed. Unfortunately, it has not yet been possible, because of limited space, to establish satisfaction with life as a core question in the continuing surveys.
10 See Table 10.1 of Helliwell, Barrington-Leigh, Harris, & Huang (2010, p. 298).
11 See Table 1.2 of Diener, Helliwell, & Kahneman (2010), which shows at the national level GDP per capita cor-relates more closely with WVS life satisfaction answers than with happiness answers. See also Figure 17.2 of Helliwell & Putnam (2005, p. 446), which compares partial income responses within individual-level equations for WVS life satisfaction and happiness answers. One difficulty with these comparisons, both of which do show bigger income effects for life satisfaction than for happi-ness, lies in the different response scales. This provides one reason for differing results. The second, and likely more important, reason is that the WVS happiness question lies somewhere in the middle ground between an emotional and an evaluative query. Table 1.3 of Diener et al. (2010) shows a higher correlation between income and the ladder than between income and life satisfaction using Gallup World Poll data, but this is shown, by Table 10.1 of Helliwell et al. (2010), to be because of using non-matched sets of respondents.
12 See, for an example using individual-level data, Kahneman & Deaton (2010), and for national-average data Table 2.1 of Helliwell, Huang, & Wang (2015, p. 22) or Table 2.1 of this chapter.
13 Barrington-Leigh (2013) documents a significant upward trend in life satisfaction in Québec, compared to the rest of Canada, of a size accumulating over 25 years to an amount equivalent to more than a trebling of mean household income.
14 See Lucas (2007) and Yap, Anusic, & Lucas (2012).
15 See Lucas et al. (2003) and Clark & Georgellis (2013).
16 See Yap et al. (2012) and Grover & Helliwell (2014).
17 See International Organization for Migration (2013, chapter 3) and Frank, Hou, & Schellenberg (2015).
18 See Stone, Schneider, & Harter (2012) and Helliwell & Wang (2015). The presence of day-of-week effects for mood reports is also shown in Ryan, Bernstein, & Brown (2010).
19 See Stone et al. (2012), Helliwell & Wang (2014) and Boni-kowska, Helliwell, Hou, & Schellenberg (2013).
20 Table 2.1 of this chapter shows that a set of six variables descriptive of life circumstances explains 74 percent of the variations over time and across countries of national average life evaluations, compared to 50 percent for a measure of positive emotions and 21 percent for negative emotions.
21 Using a global sample of roughly 650,000 individual responses, a set of individual-level measures of the same six life circumstances (using a question about health problems to replace healthy life expectancy) explains 19.5 percent of the variations in life evaluations, compared to 7.4 percent for positive affect, and 4.6 percent for negative affect.
22 As shown in Table 2.1 of the first World Happiness Report. See Helliwell, Layard, & Sachs (2012, p. 16).
23 For these comparisons to be meaningful, it should be the case that life evaluations relate to life circumstances in roughly the same ways in diverse cultures. This important issue was discussed some length in World Happiness Report 2015. The burden of the evidence presented was that the data are internationally comparable in structure despite some identified cultural differences, especially in the case of Latin America. Subsequent research by Exton, Smith, & Vandendriessche (2015) confirms this conclusion.
24 Gallup weights sum up to the number of respondents from each country. To produce weights adjusted for population size in each country for the period of 2012-2015, we first adjust the Gallup weights so that each country has the same weight (one-country-one-vote) in the period. Next we multiply total population aged 15+ in each country in 2013 by the one-country-one-vote weight.

W O R L D H A P P I N E S S R E P O R T 2 0 1 6 | U P D AT E
43
We also produce the population weights for the period of 2005-2011, following the same process, but using total population in 2008 for this period. Total population aged 15+ is equal to the proportion of population aged 15+ (=one minus the proportion of population aged 0-14) multiplied by the total population. To simplify the analysis, we use population in 2008 for the period of 2005-11 and population in 2013 for the period of 2012-2015 for all the countries/regions. Data are mainly taken from WDI (2015). Specifically, the total population and the proportion of population aged 0-14 are taken from the series “Population ages 0-14 (percent of total)” and “Population, total” respectively from WDI (2015). There are a few regions which do not have data in WDI (2015), such as Nagorno-Karabakh, Northern Cyprus, Somalil-and, and Taiwan. In this case, other sources of data are used if available. The population in Taiwan is 23,037, 031 in 2008 and 23, 373, 517 in 2013, and the aged 15+ is 19,131,828 in 2008 and 20,026,916 in 2013 respectively (Statistical Yearbook of the Republic Of China 2014). The total population in 2013 in Northern Cyprus is 301,988 according to Economic and Social Indicators 2014 published by State Planning Organization of Northern Cyprus in December 2015 (p. 3). The ratio of population 0-14 is not available in 2013, so we use the one in 2011, 18.4 percent, calculated based on the data in 2011 Population Census, reported in Statistical Yearbook 2011 by State Planning Organization of Northern Cyprus in April 2015 (p. 13). There are no reliable data on population and age structure in Nagorno-Karabakh and Somaliland region, therefore these two regions are not included in the calculation of world or regional distributions.
25 The statistical appendix contains alternative forms without year effects (Appendix Table 9), and a repeat version of the Table 2.1 equation showing the estimated year effects (Appendix Table 8). These results confirm, as we would hope, that inclusion of the year effects makes no significant difference to any of the coefficients.
26 As shown by the comparative analysis in Table 7 of the Statistical Appendix.
27 The definitions of the variables are shown in the notes to Table 2.1, with additional detail in the online data appendix.
28 This influence may be direct, as many have found, e.g. De Neve, Diener, Tay, & Xuereb (2013). It may also embody the idea, as made explicit in Fredrickson’s broaden-and-build theory (Fredrickson, 2001), that good moods help to induce the sorts of positive connections that eventually provide the basis for better life circumstances.
29 We put the contributions of the six factors as the first elements in the overall country bars because this makes it easier to see that the length of the overall bar depends only on the average answers given to the life evaluation question. In World Happiness Report 2013 we adopted a different ordering, putting the combined Dystopia+resid-ual elements on the left of each bar to make it easier to compare the sizes of residuals across countries. To make that comparison equally possible in World Happiness
Report 2015 and World Happiness Report 2016 Update, we include the alternative form of the figure in the on-line statistical appendix (Appendix Figures 1-3) .
30 These calculations are shown in detail in Table 13 of the on-line Statistical Appendix.
31 The prevalence of these feedbacks was documented in Chapter 4 of World Happiness Report 2013, De Neve et al. (2013).
32 The data and calculations are shown in detail in Table 14 of the Statistical Appendix. Annual per capita incomes average $44,000 in the top 10 countries, compared to $1,600 in the bottom 10, measured in international dollars at purchasing power parity. For comparison, 94 percent of respondents have someone to count on in the top 10 countries, compared to 60 percent in the bottom 10. Healthy life expectancy is 71.6 years in the top 10, compared to 53 years in the bottom 10. 93 percent of the top 10 respondents think they have sufficient freedom to make key life choices, compared to 63 percent in the bottom 10. Average perceptions of corruption are 36 percent in the top 10, compared to 74 percent in the bottom 10.
33 Actual and predicted national and regional average 2013-2015 life evaluations are plotted in Figure 4 of the on-line Statistical Appendix. The 45 degree line in each part of the Figure shows a situation where the actual and predicted values are equal. A predominance of country dots below the 45 degree line shows a region where actual values are below those predicted by the model, and vice versa.
34 Mariano Rojas has correctly noted, in partial exception to our earlier conclusion about the structural equivalence of the Cantril ladder and satisfaction with life, that if our figure could be drawn using satisfaction with life rather than the ladder it would show an even larger Latin American premium (based on data from 2007, the only year when the GWP asked both questions of the same respondents). It is also true that looking across all countries, satisfaction with life is on average higher than the Cantril ladder scores, by an amount that is higher at higher levels of life evaluations.
35 For example, see Chen, Lee, & Stevenson (1995).
36 One slight exception is that the negative effect of corruption is estimated to be slightly, larger, although not significantly so, if we include a separate regional effect variable for Latin America. This is because corruption is worse than average in Latin America, and the inclusion of a special Latin American variable thereby permits the corruption coeffi-cient to take a higher value. We also find that the separate regional variable for Latin America also sharply and significantly increases the estimated negative well-being impact of the standard deviation of life evaluations.

44
37 There are thus, as shown in Table 15 of the Statistical Appendix, 31 countries that are in the 2013-2015 ladder rankings of Figure 2.2 but without changes shown in Figure 2.3. These countries for which changes are missing include some of the 10 lowest ranking countries in Figure 2.2. Several of these countries might well have been shown among the 10 major losers had their earlier data been available.
38 See Helliwell, Huang, & Wang (2014).
39 In the 2013-15 GWP surveys, Iceland and Ireland are ranked first and fifth, respectively, in terms of social support, with over 95 percent of respondents having someone to count on, compared to an international average of 80 percent.
40 See Yamamura, Tsutsui, Yamane, Yamane, & Powdthavee (2015) and Uchida, Takahashi, & Kawahara (2014).
41 See Ren & Ye (2016) for an assessment of the happiness effects of the increased generosity following the 2008 Wenchuan earthquake.
42 As shown in Tables 19-20 of the Statistical Appendix, these results are based on treating each country equally when assembling the averages.
43 Those results were drawn from Helliwell, Huang, Grover, & Wang (2014).
44 See United Nations (2013).
45 The World Bank (2014) has emphasized the measure-ment and eradication of extreme poverty.
46 See Keeley (2015) for a survey of recent OECD data and research on inequality.
47 See Atkinson (2015), Atkinson & Bourguignon (2014), Deaton (2013), Piketty (2014), Stiglitz (2013, 2015), and Wilkinson and Pickett (2009). For an earlier review from a sociological perspective, see Neckerman & Torche (2007).
48 See, e.g. Marmot, Ryff, Bumpass, Shipley, & Marks (1997).
49 See Roemer & Trannoy (2013) for a theoretical survey, and Putnam (2015) for data documenting declining equality of opportunity in the United States. For a survey of research on intergenerational mobility, see Corak (2013).
50 See Kuznets (1955).
51 For a review of the arguments and evidence, see Keeley (2015).
52 See OECD (2015), p. 34.
53 See United Nations (2013, Figure 2.1). If the national Gini coefficients are weighted by national population, the global measure has been declining continuously, mainly through the impact of China. Still using population weights, but excluding China, the global average peaked in 2010 (just as did the unweighted average) and fell more rapidly than the unweighted average to a level that was nonetheless slightly higher in 2010 than it was in 1980.
54 See the World Bank data portal http://data.worldbank.org/indicator/SI.POV.GINI?order=wbapi_data_val-ue_2010+wbapi_data_value+wbapi_data_val-ue-last&sort=asc&page=1.
55 This is because it is almost impossible to compare price levels when there is very little overlap in the products consumed to sustain standards of living in different countries. See Deaton (2010).
56 See Clark, Flèche, & Senik (2014).
57 See Goff, Helliwell, & Mayraz (2016).
58 This proposition was first advanced and tested by Alesina, Di Tella, & MacCulloch (2004) to explain why income inequality was estimated by them to have a greater impact on subjective well-being in Europe than in the United States.
59 See Rothstein & Uslaner (2005).
60 See Helliwell & Wang (2011).
61 See Goff et al. (2016), Table 6.
62 The negative effect of well-being inequality becomes significant only when regional dummy variables are also included, as also found by Goff et al. (2016). That paper includes income and regional dummy variables for all regions, but none of the other variables used in Table 2.1. We find that the only necessary regional variable is for Latin America, which has inexplicably high life evalua-tions (i.e. most countries have actual ladder values above those predicted by the equation of Table 2.1) and also unusually high inequality of subjective well-being. The coefficient on well-being inequality rises if the variables for freedom and social support are removed, showing that these are in part the likely routes via which well-being inequality reduces well-being. If the Latin American countries are compared with each other, people are nonetheless happier in those countries with more equal distributions of well-being, consistent with earlier findings by Graham & Felton (2006).

W O R L D H A P P I N E S S R E P O R T 2 0 1 6 | U P D AT E
45
63 We test two different measures of income inequality in our Table 2.1 equation. The first is from the World Bank, the same source used by Goff et al. (2016), and it shows for us, as it generally did for them, no significant negative effect, whether or not the inequality of well-being is also included in the equation. The second measure, as described in the Statistical Appendix, is based on Gini coefficients constructed from the incomes reported by individual respondents to the Gallup World Poll. That variable attracts a significant negative coefficient whether or not subjective well-being inequality is included, and it is stronger than the subjective well-being inequality when the two measures are both included, as shown in Table 10 of the Statistical Appendix.
64 See Table 10 of the Statistical Appendix.
65 We use the standard deviation as our preferred measure of well-being inequality, following Kalmijn & Veenhoven (2005) and Goff et al (2016). See also Delhey & Kohler (2011) and Veenhoven (2012). Since we are anxious to avoid mechanical negative correlation between average well-being and our measure of inequality, the standard deviation is a more conservative choice than the coeffi-cient of variation, which is the standard deviation divided by the mean, and the Gini, which mimics the coefficient of variation very closely.
66 The 95 percent confidence intervals for standard deviations and changes in standard deviations are all estimated by bootstrapping methods (1,000 times).
67 The cross-sectional correlation between the average ladder for 2013-2015 and the standard deviations of within-country ladder scores is -0.25.
68 If the Gallup World Poll questions relating to corruption, freedom and social support had been asked on a 0 to 10 scale, rather than as either 0 or 1, we might have been able to see if the inequality of life evaluations was based on some combination of the inequalities of the main supporting variables.
69 Figure 2.4 in the first World Happiness Report shows the 2005-2011 values for the standard deviations of the ladder data in each country. Table 2.8 in World Happiness Report 2013 shows changes in the income Ginis by global region.
70 Note also the wide standard error bars for the Icelandic changes, reflecting the relative infrequency and some-times half-size of the survey samples there. Even with these smaller samples, the change shown in Figure 2.7 for Iceland is significantly positive.
71 See Dussaillant & Guzmán (2014). In the wake of the 2010 earthquake in Chile, there was looting in some places and not in others, depending on initial trust levels. Trust subsequently grew in those areas where helping prevailed instead of looting.

46
References
Alesina, A., Di Tella, R., & MacCulloch, R. (2004). Inequality and happiness: Are Europeans and Americans different? Journal of Public Economics, 88(9), 2009-2042.
Atkinson, A. B. (2015). Inequality: What can be done? Cam-bridge: Harvard University Press.
Atkinson, A. B., & Bourguignon, F. (Eds.) (2014). Handbook of income distribution (Vols. 2A & 2B). Elsevier.
Barrington-Leigh, C. P. (2013). The Quebec convergence and Canadian life satisfaction, 1985–2008. Canadian Public Policy, 39(2), 193-219.
Becchetti, L., Massari, R., & Naticchioni, P. (2014). The drivers of happiness inequality: Suggestions for promoting social cohesion. Oxford Economic Papers, 66(2), 419-442.
Bonikowska, A., Helliwell, J. F., Hou, F., & Schellenberg, G. (2013). An assessment of life satisfaction responses on recent Statistics Canada Surveys. Social Indicators Research, 118(2), 1-27.
Cantril, H. (1965). The pattern of human concerns. New Brunswick: Rutgers University Press.
Chen, C., Lee, S. Y., & Stevenson, H. W. (1995). Response style and cross-cultural comparisons of rating scales among East Asian and North American students. Psychological Science, 6(3), 170-175.
Clark, A., Flèche, S., & Senik, C. (2014). The great happiness moderation: Well-being inequality during episodes of income growth. In A. Clark & C. Senik (Eds.), Happiness and economic growth: Lessons from developing countries (pp. 32-139). Oxford: Oxford University Press.
Clark, A. E., & Georgellis, Y. (2013). Back to baseline in Britain: Adaptation in the British Household Panel Survey. Economica, 80(319), 496-512.
Corak, M. (2013). Income inequality, equality of opportunity, and intergenerational mobility. The Journal of Economic Perspectives, 27(3), 79-102.
Deaton, A. (2010). Price indexes, inequality, and the measure-ment of world poverty. American Economic Review, 100(1), 5-34.
Deaton, A. (2013). The great escape: Health, wealth, and the origins of inequality. Princeton University Press.
Delhey, J., & Kohler, U. (2011). Is happiness inequality immune to income inequality? New evidence through instrument-effect-corrected standard deviations. Social Science Research, 40(3), 742-756.
De Neve, J. E., Diener, E., Tay, L., & Xuereb, C. (2013). The objective benefits of subjective well-being. In J. F. Helliwell, R. Layard, & J. Sachs (Eds.), World happiness report 2013 (pp. 54-79). New York: UN Sustainable Development Solutions Network.
Diener, E., Gohm, C. L., Suh, E., & Oishi, S. (2000). Similarity of the relations between marital status and subjective well-being across cultures. Journal of cross-cultural psychology, 31(4), 419-436.
Diener, E., Helliwell, J., & Kahneman, D. (Eds.) (2010). International differences in well-being. Oxford University Press.
Diener, E., Lucas, R. & Oishi, S. (2016). Advances and open questions in the science of well-being. Unpublished manu-script.
Durand, M., & Smith, C. (2013). The OECD approach to measuring subjective well-being. In J. F. Helliwell, R. Layard, & J. Sachs (Eds.), World happiness report 2013 (pp. 112-137). New York: UN Sustainable Development Solutions Network.
Dussaillant, F., & Guzmán, E. (2014). Trust via disasters: The case of Chile’s 2010 earthquake. Disasters, 38(4), 808-832.
Exton, C., Smith, C., & Vandendriessche, D. (2015). Compar-ing happiness across the world: Does culture matter? OECD Statistics Working Papers, 2015/04, Paris: OECD Publishing. http://dx.doi.org/10.1787/5jrqppzd9bs2-en
Frank, K., Hou, F., & Schellenberg, G. (2015). Life satisfaction among recent immigrants in Canada: comparisons to source-country and host-country populations. Journal of Happiness Studies, 1-22. http://doi.org/10.1007/s10902-015-9664-2
Fredrickson, B. L. (2001). The role of positive emotions in positive psychology: The broaden-and-build theory of positive emotions. American psychologist, 56(3), 218-226.
Gandelman, N., & Porzecanski, R. (2013). Happiness inequali-ty: How much is reasonable? Social Indicators Research, 110(1), 257-269.
Goff, L., Helliwell, J., & Mayraz, G. (2016). The welfare costs of well-being inequality. NBER Working Paper 21900.
Graham, C., & Felton, A. (2006). Inequality and happiness: Insights from Latin America. Journal of Economic Inequality, 4(1), 107-122.
Grover, S., & Helliwell, J. F. (2014). How’s life at home? New evidence on marriage and the set point for happiness. NBER Working Paper 20794.
Helliwell, J. F., Barrington-Leigh, C., Harris, A., & Huang, H. (2010). International evidence on the social context of well-being. In E. Diener, J. F. Helliwell, & D. Kahneman (Eds.), International differences in well-being (pp. 291-327). Oxford: Oxford University Press.
Helliwell, J. F., Bonikowska, A. & Shiplett, H. (2016). Immigration as a test of the set point hypothesis: Evidence from Immigration to Canada. Unpublished manuscript.

W O R L D H A P P I N E S S R E P O R T 2 0 1 6 | U P D AT E
47
Helliwell, J. F., Huang, H., Grover, S., & Wang, S. (2014). Good governance and national well-being: What are the linkages? OECD Working Papers on Public Governance, No. 25, Paris: OECD Publishing. DOI: http://dx.doi.org/10.1787/5jxv9f651hvj-en.
Helliwell, J. F., Huang, H., & Wang, S. (2014). Social capital and well-being in times of crisis. Journal of Happiness Studies, 15(1), 145-162.
Helliwell, J. F., Layard, R., & Sachs, J. (Eds.). (2012). World happiness report. New York: UN Sustainable Development Solutions Network.
Helliwell, J. F., Layard, R., & Sachs, J. (Eds.). (2015). World happiness report 2015. New York: UN Sustainable Development Solutions Network.
Helliwell, J. F., & Wang, S. (2013). World happiness: Trends, explanations and distribution. In J. F. Helliwell, R. Layard, & J. Sachs (Eds.), World happiness report 2013 (pp. 8-37). New York: UN Sustainable Development Solutions Network.
Helliwell, J.F., & Wang, S. (2014). Weekends and subjective well-being. Social Indicators Research, 116(2), 389-407.
Helliwell, J. F., & Wang, S. (2015). How was the weekend? How the social context underlies weekend effects in happi-ness and other emotions for US workers. PlOS ONE, 10(12), e0145123.
Hicks, S., Tinkler, L., & Allin, P. (2013). Measuring subjective well-being and its potential role in policy: Perspectives from the UK Office for National Statistics. Social Indicators Research, 114(1), 73-86.
Huppert, F. A., Marks, N., Clark, A., Siegrist, J., Stutzer, A., Vittersø, J., & Wahrendorf, M. (2009). Measuring well-being across Europe: Description of the ESS well-being module and preliminary findings. Social Indicators Research, 91(3), 301-315.
International Organization for Migration (2013). World migration report 2013. http://publications.iom.int/system/files/pdf/wmr2013_en.pdf.
Kahneman, D., & Deaton, A. (2010). High income improves evaluation of life but not emotional well-being. Proceedings of the National Academy of Sciences, 107(38), 16489-16493.
Kalmijn, W., & Veenhoven, R. (2005). Measuring inequality of happiness in nations: In search for proper statistics. Journal of Happiness Studies, 6(4), 357-396.
Keeley, B. (2015). Income inequality: The gap between rich and poor. OECD Insights, Paris: OECD Publishing.
Kuznets, S. (1955). Economic growth and income inequality. American Economic Review, 45(1), 1-28.
Lucas, R. E. (2007). Adaptation and the set-point model of subjective well-being: Does happiness change after major life events? Current Directions in Psychological Science, 16(2), 75-79.
Lucas, R. E., Clark, A. E., Georgellis, Y., & Diener, E. (2003). Reexamining adaptation and the set point model of happi-ness: reactions to changes in marital status. Journal of Personality and Social Psychology, 84(3), 527-539.
Marmot, M., Ryff, C. D., Bumpass, L. L., Shipley, M., & Marks, N. F. (1997). Social inequalities in health: Next questions and converging evidence. Social Science & Medicine, 44(6), 901-910.
Neckerman, K. M., & Torche, F. (2007). Inequality: Causes and consequences. Annual Review of Sociology, 33, 335-357.
OECD. (2013). OECD guidelines on measuring subjective well-being. Paris: OECD Publishing.
OECD (2015). In it together: Why less inequality benefits all. Paris: OECD Publishing. DOI: http://dx.doi.org/10.1787/9789264235120-en.
Piketty, T. (2014). Capital in the 21st Century. Cambridge: Harvard University Press.
Putnam, R. D. (2015). Our kids: The American dream in crisis. New York: Simon and Schuster.
Ren, Q., & Ye, M. (2016). Donations make people happier: Evidence from the Wenchuan earthquake. Social Indicators Research, 1-20.
Rothstein, B., & Uslaner, E. M. (2005). All for all: Equality, corruption, and social trust. World Politics, 58(1), 41-72.
Roemer, J. E., & Trannoy, A. (2013). Equality of opportunity. Cowles Foundation Working Paper No 1921. http://papers.ssrn.com/sol3/papers.cfm?abstract_id=2345357 (Forthcoming in Handbook of Income Distribution)
Ryan, R. M., Bernstein, J. H., & Brown, K. W. (2010). Weekends, work, and well-being: Psychological need satisfac-tions and day of the week effects on mood, vitality, and physical symptoms. Journal of Social and Clinical Psychology, 29(1), 95-122.
Ryff, C. D., & Singer, B. H. (2008). Know thyself and become what you are: A eudaimonic approach to psychological well-being. Journal of Happiness Studies, 9(1), 13-39.
Stiglitz, J. E. (2013). The price of inequality: How today’s divided society endangers our future. New York: W. W. Norton & Company.
Stiglitz, J. E. (2015). The great divide: Unequal societies and what we can do about them. New York: W. W. Norton & Company.
Stiglitz, J., Sen, A., & Fitoussi, J. P. (2009). The measurement of economic performance and social progress revisited: Reflections and overview. Paris: Commission on the Measurement of Economic Performance and Social Progress.
Stone, A. A., Schneider, S., & Harter, J. K. (2012). Day-of-week mood patterns in the United States: On the existence of ‘Blue Monday’, ‘Thank God it’s Friday’ and weekend effects. Journal of Positive Psychology, 7(4), 306-314.

48
Uchida, Y., Takahashi, Y., & Kawahara, K. (2014). Changes in hedonic and eudaimonic well-being after a severe nationwide disaster: The case of the Great East Japan Earthquake. Journal of Happiness Studies, 15(1), 207-221.
United Nations (2013). Inequality matters. New York: UN Department of Economic and Social Affairs.
Veenhoven, R. (2012). The medicine is worse than the disease: Comment on Delhey and Kohler’s proposal to measure inequality in happiness using ‘instrument-effect-corrected’ standard deviations. Social Science Research, 41(1), 203-205.
Wilkinson, R., & Pickett, K. (2009). The spirit level: Why greater equality makes societies stronger. New York: Bloomsbury Press.
Wirtz, D., Kruger, J., Scollon, C. N., & Diener, E. (2003). What to do on spring break? The role of predicted, on-line, and remembered experience in future choice. Psychological Science, 14(5), 520-524.
World Bank (2014). Policy research report 2014: A measured approach to ending poverty and boosting shared prosperity: Concepts, data, and the twin goals. Washington: World Bank.
Yamamura, E., Tsutsui, Y., Yamane, C., Yamane, S., & Powdthavee, N. (2015). Trust and happiness: Comparative study before and after the Great East Japan Earthquake. Social Indicators Research, 123(3), 1-17.
Yap, S. C., Anusic, I., & Lucas, R. E. (2012). Does personality moderate reaction and adaptation to major life events? Evidence from the British Household Panel Survey. Journal of Research in Personality, 46(5), 477-488.

W O R L D H A P P I N E S S R E P O R T 2 0 1 6 | U P D AT E
49

50
RICHARD LAYARD
Chapter 3
PROMOTING SECULAR ETHICS
Richard Layard, Director, Well-Being Programme, Centre for Economic Performance, London School of Economics and Political Science
Richard Layard is extremely grateful to the US National Institute of Aging (R01AG040640) and the John Templeton Foundation for financial support.

W O R L D H A P P I N E S S R E P O R T 2 0 1 6 | U P D AT E
51
What should be the purpose of our lives and what is the source of our ethical obligations? In the 19th century most people would have given a broadly similar answer to these questions: “We should live as God commands and, if we do, we shall find our reward in the life hereafter.”1 These beliefs were sustained by frequent attendance at church, mosque or temple, which provided a combination of uplift, comfort, social support and, in some cases, fear.
Since the 19th century things have changed substantially, especially in the West. Modern science has challenged the belief in a God who intervenes, and in a life after death. Though 59% of the world’s population still describe them-selves as religious, the proportion has fallen in most parts of the world, and this trend is likely to continue.2 Where religious belief declines, a new view of ethics emerges. The rules of be-haviour are then seen as made by man rather than by God in order to improve the quality of our human life together.
But how well can these rules survive without the religious sanction? To some extent they persist by force of habit. But their hold is weakening. In 1952 half of all Americans thought people led “as good lives - moral and honest - as they used to.” There was no majority for the view that things are going to the dogs. But, as the table shows, by 1998 there was a three-to-one majority for precisely that view - that people are less moral than they used to be.3
Percentage saying that people lead “as good lives-moral and honest-as they used to” (United States)
1952 51
1965 43
1976 32
1998 27
Clearly there has developed, to a degree, a moral vacuum, into which have stepped some quite unwholesome ideas.
Many of these ideas are highly individualistic, with an excessive emphasis on competition and on personal success as the key goal in life. In this view each person’s main obligation is to themselves. An extreme proponent of this view is the writer Ayn Rand, who became the favour-ite guru of the U.S. Federal Reserve Chairman Alan Greenspan. In this world individuals do of course collaborate sometimes, but only when it is in their own individual interest. There is no concept of the common good, and life is largely a struggle for places on the ladder of success.
But such a struggle is a zero-sum game, since if one person rises another must fall. In such a world it is impossible that all should progress. Instead, if all are to progress, it has to be through a positive-sum game where success for one brings success for others.
So we need a new ethics which incorporates the best values to be found in all religions, but which is equally convincing to people with no religious faith at all. As the Dalai Lama has put it,
“For all its benefits in offering moral guidance and meaning in life, religion is no longer adequate as a basis for ethics. Many people no longer follow any religion. In addition, in today’s secular and multicultural societies, any religion-based answer to the problem of our neglect of inner values could not be universal, and so would be inadequate. We need an approach to ethics that can be equally acceptable to those with religious faith and those without. We need a secular ethics.”4
So there are two key questions that need answering.
First, what ethical beliefs could best represent universal values in a way that is based on human need and not divine command?
And, second, what kinds of secular organisa-tion are needed to promote and sustain ethical living in the way that churches, mosques and temples can?

52
The greatest happiness principle
So, first, what ethical idea based on human need can best fill the moral vacuum left by the decline of religious belief? The answer must surely be the great central idea of the 18th century An-glo-Saxon Enlightenment on which much of modern Western civilisation is based.5 This can be expressed in three propositions.
We should assess human progress by the extent to which people are enjoying their lives—by the prevalence of happiness and, conversely, the absence of misery.
Therefore, the objective of governments should be to create conditions for the great-est possible happiness and the least possible misery. As Thomas Jefferson put it, “The care of human life and happiness … is the only legitimate object of good government”.6
Likewise the obligation of each of us is to create the greatest amount of human happi-ness that we can in the world and the least misery. (Overall happiness of course includes our own.)
And in all of this it is more important to reduce unhappiness (or misery) than to increase the happiness of those who are already higher up the scale.7
These three propositions are what may be called the “greatest happiness principle”. It was Propo-sition 1 which inspired many organisations, like the OECD, the EU and many governments, to reassess their answer to the question: what is progress? And it was Propositions 1 and 2 which have mainly inspired the production of succes-sive World Happiness Reports - our hope has been to display enough of the new science of happiness to enable policy-makers to make happiness a practical goal of policy.8 But it is Proposition 3 that we wish to promote in this chapter, because we believe it should be the
central principle which inspires those billions worldwide for whom religion no longer provides the answer to how we should live.9
The principle is frequently misunderstood.10 For example, it does not assume that people are only concerned about their own happiness. On the contrary, if people only pursued their own happiness, this would not produce a very happy society. Instead the greatest happiness principle exhorts us to care passionately about the happi-ness of others. It is only if we do so that true progress (as we have defined it) can occur.
But what is so special about happiness? Why not judge our progress by our wealth or our freedom or our health or education, and not just our happiness? Clearly many things are good. But different goods are often in competition. My spending more on health may mean spending less on education. Or wealth-creation may require some limitations on freedom. So we have to ask why different things are good? And in most cases we can give sensible answers. For example ‘Wealth makes people feel good’ or ‘Ill health makes people feel bad.’ But if we ask why it matters how people feel—why happiness is good—we can give no answer. It is just self-evi-dent. So happiness is revealed as the overarch-ing good, and other goods obtain their goodness from the fact that they contribute to happiness. And that is why an “impartial spectator” would judge a state of human affairs by the happiness of the people.11
The greatest happiness principle has a universal appeal. It has the capacity to inspire, by mobilis-ing the benevolent part of every human being. In the language of Jews, Christians and Mus-lims, it embodies the commandment to Do as you would be done by, and to Love your neigh-bour as yourself. In the language of Hinduism and Buddhism, it embodies the principle of compassion—that we should in all our dealings truly wish for the happiness of all of those we can affect, and we should cultivate in ourselves an attitude of unconditional benevolence.12

W O R L D H A P P I N E S S R E P O R T 2 0 1 6 | U P D AT E
53
Is there any prospect that we can achieve such a caring way of life? Many people are skeptical. They believe that human nature is inherently selfish and we should just accept that fact. After all, it is the fittest who survive, and those must be the people who put No 1 first. But this crude form of Darwinism is quite contrary to the modern understanding of human nature and of human evolution, since it is the human instinct to cooperate which has given humans their extraordinary power over most other vertebrate species.13 The fact is that we have two natures, one selfish and one altruistic, and it is the function of our ethical culture to promote the altruist within us over the egotist.
In this context, an ethical system that favours not only others’ happiness but also our own has a much better chance of being implemented than one that is pure hair-shirt. It is therefore a huge advantage of the greatest happiness princi-ple that it requires self-compassion as well as compassion towards others.
Organisations for ethical living
Not all readers will agree with the greatest happiness principle. But we can all agree on one thing. In an ever more secular society we urgent-ly need non-religious organisations which promote ethical living in a way that provides inspiration, uplift, joy and mutual support—through regular meetings of like-minded people.Such organisations should not be anti-religious—they should simply meet a human need which, for many people, religion cannot meet.
There are as yet surprisingly few secular organi-sations that perform this role. Sunday Assem-blies are one attempt.14 ‘Humanist’ organisations are another, but many of these focus mainly on attacking religion. Increasingly, Westerners are turning for spiritual support to non-theistic Buddhist or mindfulness groups. Other support-ive organisations include Alcoholic Anonymous
and other anonymous groups, but they cater only to people with specific problems. Then there are of course millions of charities like the Red Cross/Red Crescent which provide inspiring examples of ethical living, but again they are devoted to fairly specific causes. There are also general purpose ethical organisations like Rotary International or the Freemasons, but they have limited membership.
By contrast, churches, mosques and temples are open to all and their message is universal—it relates to every aspect of life and provides a sense of meaning, uplift and connection. We need equivalent secular organisations. There must be many more such organisations than I have mentioned, and by the end of this century they will surely be everywhere.
Action for Happiness
One such pioneering organisation is Action for Happiness (www.actionforhappiness.org), founded five years ago. Each member pledges to “try to create more happiness and less unhappi-ness in the world around me.” To support this, the movement offers online a combination of modern positive psychology and traditional wisdom from both West and East. And, to facilitate the development of groups which meet regularly face-to-face, it offers an 8-session course on Exploring What Matters, which can be led by any well-motivated volunteer. After the first sessions these groups continue to meet regularly, drawing on a standard format suggested by the movement.
The patron of the movement is the Dalai Lama, who views it as a practical organisation promot-ing many of his views on happier living. To date 60,000 people in 170 countries have joined and made the pledge.
It is impossible to foresee what pattern of secular spiritual organisations will develop over

54
the century. But history shows the necessity for humans of some organised form of spiritual life and regeneration. I would welcome information from other secular organisations which see this as their role.
Conclusion
We live in an increasingly irreligious age, but we have to ensure that it becomes more, and not less, ethical. So the world needs an ethical system that is both convincing and inspiring. In this chapter we offer the principle of the greatest happiness as one which can inspire and unite people of all ages from all backgrounds and all cultures. But to sustain people in living good lives, we need more than a principle. We need living organisations in which people meet regularly for uplift and mutual support. To create secular organisations of this type is surely one of the biggest challenges of the 21st century.
1 In Hinduism there are many gods, and in the stricter forms of Buddhism there are none. But in both faiths there is a reward in the next life.
2 WIN/Gallup International Global Index of Religiosity and Atheism (2012), Table 3 gives data comparing 2012 with 2005 for 39 countries. In the majority religiosity had fallen. In the U.S. for example the proportion who called them-selves religious fell from 73% to 60%. Similarly, weekly U.S. attendance at a place of worship fell from 43% to 36% (see Gallup Historical Trends www.gallup.com/poll/1690/religion.aspx ). Cross-sectional evidence within countries worldwide shows that religious people are on average poorer, less-educated and older. This may help to explain the overall downward trend in religious belief. For evidence on whether religion improves happiness and why, see Diener et al. (2011).
3 Putnam (2000), p.139.
4 Dalai Lama (2012).
5 See for example McMahon (2006), Bentham (1789), Mill (1861).
6 Jefferson (1809).
7 The 18th century writers like Bentham used average happiness as the sole criterion for evaluating a state of affairs but we believe that the dispersion of happiness should also be given (negative) weight. See O’Donnell et al. (2014), Chapter 4.
8 For further discussion, see O’Donnell et al. (2014).
9 For a similar view, see Dalai Lama (2012).
10 For further discussion, see Layard (2011), Chapter 15.
11 For the idea of the impartial spectator, see Singer (1993).
12 Jinpa (2015).
13 See for example Ricard (2015).
14 These have regular gatherings in 68 chapters across 8 countries www.sundayassembly.com .

W O R L D H A P P I N E S S R E P O R T 2 0 1 6 | U P D AT E
55
REFERENCES
Bentham, J. (1789). An Introduction to the Principles of Morals and Legislation (1996 ed. J. H. B. a. H. L. A. Hart). Oxford: Clarendon Press.
Dalai Lama. (2012). Beyond Religion: Ethics for a Whole World: Houghton Mifflin Harcourt.
Diener, E., Tay, L., & Myers, D. G. (2011). The religion paradox: if religion makes people happy, why are so many dropping out? Journal of Personality and Social Psychology, 101(6), 1278-1290.
Jefferson, T. (1809). Letter to the Maryland Republicans: in The Writings of Thomas Jefferson (1903-1904) Memorial Edition (Lipscomb and Bergh, editors) 20 Vols., Washington, D.C: ME 16:359.
Jinpa, T. (2015). A Fearless Heart: How the Courage to Be Compassionate Can Transform Our Lives: Avery Publishing Group.
Layard, R. (2011). Happiness: lessons from a new science (Second Edition ed.). London: Penguin.
McMahon, D. (2006). The Pursuit of Happiness: A History from the Greeks to the present. London: Allen Lane/Penguin.
Mill, J. S. (1861). Utilitarianism (1993 ed. G. Williams). London: Everyman.
O’Donnell, G., Deaton, A., Durand, M., Halpern, D., & Layard, R. (2014). Wellbeing and policy. London: Legatum Institute.
Putnam, R. (2000). Bowling Alone: The Collapse and Revival of American Community. New York: Simon and Schuster.
Ricard, M. (2015). Altruism: The Power of Compassion to Change Yourself and the World: Little, Brown and Company.
Singer, P. (1993). Practical Ethics (2nd ed.): Cambridge University Press.

56
JEFFREY D. SACHS
Chapter 4
HAPPINESS AND SUSTAINABLE DEVELOPMENT: CONCEPTS AND EVIDENCE
Jeffrey D. Sachs, Director of the Earth Institute and the UN Sustainable Development Solutions Network, Special Advisor to United Nations Secretary-General Ban Ki-moon on the Sustainable Development Goals
W O R L D H A P P I N E S S R E P O R T 2 0 1 6 | U P D AT E
57
The study of Politics, Aristotle declared, is “to consider what form of political community is best of all for those who are most able to realize their ideal of life” (The Politics, Book II, 1). This question has vexed philosophers, statesmen, politicians, and citizens from Aristotle’s time until ours. Machiavelli gave guidance to the Prince on maintaining power; Bentham gave guidance to the legislators on promoting “the greatest happiness of the greatest number”; and Rawls and Nozick tried to establish principles of justice, for Rawls’ tested according to a “veil of ignorance,” and for Nozick according to the libertarian idea of consensual exchange. But largely missing from this long and great tradi-tion of moral and political philosophy has been empirical evidence. The new science of Happi-ness therefore adds critical empirical evidence to the search for the ideal political community.
John Helliwell’s path-breaking work, featured in this and past World Happiness Reports (2013, 2015, 2016), has documented that people’s own report of their life satisfaction – that is their Subjective Well-being (SWB) – reflects several dimensions of their lives. Happiness depends on individual factors such as personality, in-come, health, and the individual’s perceived freedom to make important life choices. Happi-ness also depends on social determinants such as the degree of trust in the community, and on political factors such as the government’s adherence to the rule of law. There is some evidence, discussed below, that happiness depends directly on nature as well, whether because of biophilia (love for nature as a facet of human nature) or because of the natural services provided by the environment.
When economists think about human happi-ness, they of course tend to emphasize the role of personal income; libertarians emphasize personal freedoms; sociologists emphasize social capital including generalized trust in the society; and political scientists emphasize the constitutional order and the control of corrup-tion. Yet none of these disciplines do justice to
the fact that happiness is multivalent, and that no single goal of society – economic efficiency, personal freedom, community trust, constitu-tional rule, or others – by itself delivers the “good society” sought by Aristotle.
Happiness plays three roles on the path to the good society. First, as Aristotle emphasized, it is the Summum Bonum, the supreme good. Defin-ing the sources of happiness has engaged the labors of philosophers since Aristotle first set out the goal in The Politics and The Nichomache-an Ethics. Yet human happiness has remained the end goal, the telos of social organization.
Second, happiness has become metric, a quanti-tative benchmark. Thanks to the work of hun-dreds of psychologists and other social scientists in recent decades, we have arrived at systematic, tested and widely accepted measurements of self-reported (or subjective) happiness. The World Happiness Report has emphasized the two main dimensions of happiness: evaluative and affective. Evaluative happiness, for example as measured by the Cantril Ladder featured in the World Happiness Reports, asks individuals for an evaluation of the overall quality of one’s life. Affective happiness, by contrast, measures the fluctuating emotions at a point of time, includ-ing both positive and negative emotions.
Third, happiness metrics offers a way to test alternative theories of happiness and the social good. Moral philosophers from ancient times until now could argue their case, but not test their theories. Now we can use survey data on happiness to weigh alternative theories of “the good society.” In effect, happiness studies represent an important advance of moral philos-ophy since age-old questions about human well-being can now be tested.
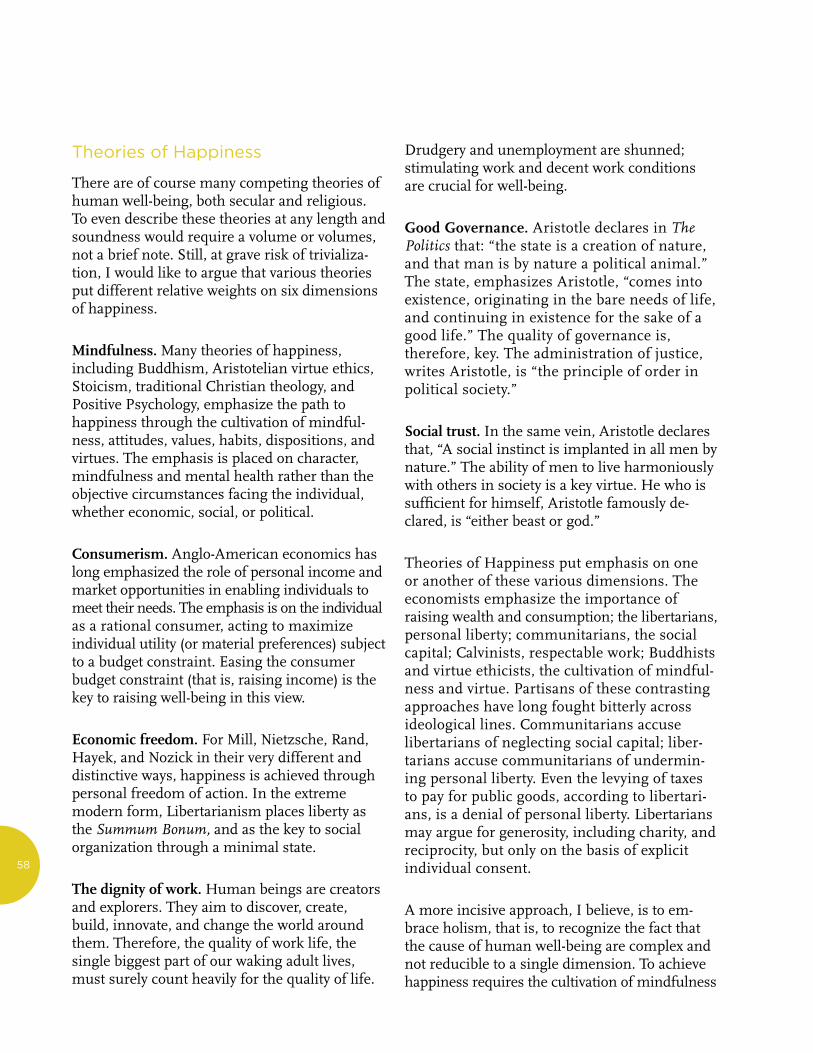
58
Theories of Happiness
There are of course many competing theories of human well-being, both secular and religious. To even describe these theories at any length and soundness would require a volume or volumes, not a brief note. Still, at grave risk of trivializa-tion, I would like to argue that various theories put different relative weights on six dimensions of happiness.
Mindfulness. Many theories of happiness, including Buddhism, Aristotelian virtue ethics, Stoicism, traditional Christian theology, and Positive Psychology, emphasize the path to happiness through the cultivation of mindful-ness, attitudes, values, habits, dispositions, and virtues. The emphasis is placed on character, mindfulness and mental health rather than the objective circumstances facing the individual, whether economic, social, or political.
Consumerism. Anglo-American economics has long emphasized the role of personal income and market opportunities in enabling individuals to meet their needs. The emphasis is on the individual as a rational consumer, acting to maximize individual utility (or material preferences) subject to a budget constraint. Easing the consumer budget constraint (that is, raising income) is the key to raising well-being in this view.
Economic freedom. For Mill, Nietzsche, Rand, Hayek, and Nozick in their very different and distinctive ways, happiness is achieved through personal freedom of action. In the extreme modern form, Libertarianism places liberty as the Summum Bonum, and as the key to social organization through a minimal state.
The dignity of work. Human beings are creators and explorers. They aim to discover, create, build, innovate, and change the world around them. Therefore, the quality of work life, the single biggest part of our waking adult lives, must surely count heavily for the quality of life.
Drudgery and unemployment are shunned; stimulating work and decent work conditions are crucial for well-being.
Good Governance. Aristotle declares in The Politics that: “the state is a creation of nature, and that man is by nature a political animal.” The state, emphasizes Aristotle, “comes into existence, originating in the bare needs of life, and continuing in existence for the sake of a good life.” The quality of governance is, therefore, key. The administration of justice, writes Aristotle, is “the principle of order in political society.”
Social trust. In the same vein, Aristotle declares that, “A social instinct is implanted in all men by nature.” The ability of men to live harmoniously with others in society is a key virtue. He who is sufficient for himself, Aristotle famously de-clared, is “either beast or god.”
Theories of Happiness put emphasis on one or another of these various dimensions. The economists emphasize the importance of raising wealth and consumption; the libertarians, personal liberty; communitarians, the social capital; Calvinists, respectable work; Buddhists and virtue ethicists, the cultivation of mindful-ness and virtue. Partisans of these contrasting approaches have long fought bitterly across ideological lines. Communitarians accuse libertarians of neglecting social capital; liber-tarians accuse communitarians of undermin-ing personal liberty. Even the levying of taxes to pay for public goods, according to libertari-ans, is a denial of personal liberty. Libertarians may argue for generosity, including charity, and reciprocity, but only on the basis of explicit individual consent.
A more incisive approach, I believe, is to em-brace holism, that is, to recognize the fact that the cause of human well-being are complex and not reducible to a single dimension. To achieve happiness requires the cultivation of mindfulness

W O R L D H A P P I N E S S R E P O R T 2 0 1 6 | U P D AT E
59
and virtue, to be sure; but it also requires an adequate command over material resources, as emphasized by economists; decent work; per-sonal freedoms; good governance; and strong social ties. Of course there are difficult and unsolved complexities in meeting this multi-di-mensional challenge, especially in a world of 193 countries and 7.3 billion individuals.
In 2015, two important documents – one reli-gious, one secular – aimed to offer holistic approaches to human well-being. In his encycli-cal Laudato Si’, Pope Francis calls for a “sustain-able and integral development” (paragraph 13). The Pope’s emphasis “integral” reflects the need to consider the human person in all contexts: as a moral agent, a member of society, an agent in the economy, and a part of nature itself, bound by natural laws and highly vulnerable to the degradation of the physical environment. In the encyclical, Pope Francis notes that, “Interdepen-dence obliges us to think of one world with a common plan” (164). One can say that the Pope’s call for a common plan was met by the second holistic document, Transforming Our World: the 2030 Agenda for Sustainable Development, which was adopted by the 193 UN member states on September 25, 2015 to guide global cooperation during the period January 1, 2016 to December 31, 2030. At the core of the 2030 Agenda are 17 Sustainable Development Goals (SDGs).
Laudato Si’
Pope Francis issued an encyclical Laudato Si’ to “to enter into a dialogue with all people,” Catho-lics and non-Catholics, “about our common home.” In this encyclical, Pope Francis unravels the mystery of a world that enjoys unprecedented technological prowess and yet is beset by pro-found and growing anxieties, pervasive marginal-ization of the vulnerable (such as migrants and those caught in human trafficking), fear of the future, and environmental destruction.
Francis centers the problem on a false belief of the modern age that has put technocratic ap-proaches and profits above all other human concerns. He terms this a “misguided anthropo-centrism” that has given rise to a “cult of unlim-ited power,” and the rise of a moral relativism “which sees everything as irrelevant unless it serves one’s own immediate interests. “The culture of relativism is the same disorder which drives one person to take advantage of another, to treat others as mere objects, imposing forced labour on them or enslaving them to pay their debts.” (123)
Instead, Francis calls for a new holism that he terms “integral ecology” and “integral human development.” By this he means an anthropolo-gy (theory of human nature) that recognizes each person’s deep interconnections with others and with physical nature (“The Creation”). Francis bemoans the fact that specialization, “which belongs to technology,” also “makes it difficult to see the larger picture.” (110)
What is the larger picture? That “we can once more broaden our vision. We have the freedom needed to limit and direct technology; we can put it at the service of another type of progress, one which is healthier, more human, more social, more integral.” We break free from the dominant technocratic paradigm, writes Francis, when “technology is directed primarily to resolving people’s concrete problems, truly helping them live with more dignity and less suffering.” (112)
Such steps are crucial to return to the possibili-ties of happiness. “There is also the fact,” writes Francis, “that people no longer seem to believe in a happy future; they no longer have blind trust in a better tomorrow based on the present state of the world and our technological abilities. There is a growing awareness that scientific and technological progress cannot be equated with the progress of humanity and history… Let us refuse to resign ourselves to this, and continue to wonder about the purpose and meaning of everything.” (113)

60
Where lie the answers for Pope Francis? He places his emphasis on an integral ecology that cares for the poor, protects culture, directs technologies towards their highest purposes, overcomes consumerism, returns dignity to work, and protects the environment. An overar-ching theme is that the unifying principle of social ethics is “the common good,” which he quotes the Second Vatican Ecumenical Council’s definition as “the sum of those conditions of social life which allow social groups and their individual member’s relatively thorough and ready access to their own fulfillment.” Society as a whole is “obliged to defend and promote the common good.” (156)
It is worth noting Francis’ special emphasis on work as an empowering source of well-being. Francis writes as follows:
We need to remember that that men and women have ‘the capacity to improve their lot, to further their moral growth and to develop their spiritual endowments’ (quoting Pope Paul VI, 1967). Work should be the setting for this rich personal growth, where many aspects of life enter into play: creativity, planning for the future, developing our talents, living out our values, relating to others, giving glory to God. It follows that, in the reality of today’s global society, it is essential that “we continue to prioritize the goal of access to steady employment for everyone” (quoting Benedict XVI), no matter the limited interests of business and dubious economic reasoning. (128)
The 2030 Agenda for Sustainable Development
The affinity between the 2030 Agenda and Lauda-to Si’ is striking. While Pope Francis speaks of integral development, the UN member states adopted the language of “sustainable develop-ment” (a term that Francis also uses on occasion in Laudato Si’). By this term they mean the same
holistic approach to economy, society, and envi-ronment emphasized by Francis. The agenda is bold, multi-dimensional, and universal in cover-age, meaning that all nations have agreed to participate so that no one is “left behind.”
Here is what the nations mean by sustainable development:
We resolve, between now and 2030, to end poverty and hunger everywhere; to reduce ill health, physical and mental; to combat inequalities within and among countries; to build peaceful, just and inclusive societies; to protect human rights and promote gender equality and the empowerment of women and girls; and to ensure the lasting protection of the planet and its natural resources. We resolve also to create conditions for sustainable, inclusive and sustained economic growth, shared prosperity and decent work for all, taking into account different levels of national development and capacities.
While the language of the 2030 Agenda is about goals, timelines, human rights, and sovereign responsibilities, the agenda clearly embodies an implicit theory of human well-being, specifically that human well-being will be fostered by a holistic agenda of economic, social, and environ-mental objectives, rather than a narrow agenda of economic growth alone. As spelled out in the 17 Sustainable Development Goals, this implicit theory of happiness includes fighting poverty (SDG 1), promoting gender equality (SDG 5), emphasizing decent work for all (SDG 8), narrowing gaps of income and wealth in society (SDG 10), promoting environmental sustainabil-ity (SDGs 11, 12, 13, 14, 15), fostering peaceful and inclusive societies (SDG 16) and enhancing global cooperation (SDG 17).

W O R L D H A P P I N E S S R E P O R T 2 0 1 6 | U P D AT E
61
Using Happiness Data to Examine Alternative Visions of Well-being
Happiness data offer a powerful new tool for examining alternative visions of human well-be-ing. We can measure countries according to competing theories of happiness. I will focus on three prevalent theories: Economic Freedom (lib-ertarianism), Wealth Generation (consumerism), and Sustainable Development (holism).
Libertarians champion economic freedom, meaning the absence of coercion in resource allocation, including opposition to taxes and government spending as a matter of principle. The Wall Street Journal and the Libertarian-ori-ented Heritage Foundation (Washington, D.C.) produced an Index of Economic Freedom (IEF) as a measure of each country’s adherence to standards of economic freedom.
Economists emphasize real consumption and full employment as key conditions of happiness. The main societal goal is towards economic growth, which is seen as raising the consump-tion possibilities of members of the society. The World Economic Forum produces an annual Global Competitiveness Index (GCI) that aims to capture the ability of each country to generate good jobs and high incomes for the population.
Sustainable Development advocates claim that the happiness is achieved through a multi-di-mensional focus on economic, social, and environmental objectives. The 17 SDGs express the idea that the “good society” should focus on the triple bottom line of economic prosperity, social inclusion, and environmental sustainabili-ty. The UN Sustainable Development Solutions Network (UN SDSN), which publishes the World Happiness Report, has created an SDG Index (SDGI) to track each country’s progress towards the 17 SDGs.
If we consider these three alternative measures (IEF, GCI, and SDGI) as embodying alternative
underlying “theories of happiness,” we can ask whether these alternative indexes help to explain the cross-country average levels of happiness. For example, are the countries that excel in economic freedom (with low tax rates, free trade, and few regulations) according to the IEF also those that achieve higher levels of happiness? Are countries that are more economically com-petitive according to the GCI also the happier countries on average? Are countries that are farther along towards the SDGs according to the SDGI also higher on the happiness scale?
A quick summary of these indicators is as follows.
The IEF aims to assess “the liberty of individuals to use their labor or finances without undue restraint and government interference.” It is composed of 10 sub-indexes that may be grouped into four broad categories: Rule of law (property rights, freedom from corruption); Government size (fiscal freedom, government spending); Regulatory efficiency (business freedom, labor freedom, monetary freedom); and Market openness (trade freedom, invest-ment freedom, financial freedom). The Wall Street Journal and the Heritage Foundation in Washington, D.C. jointly author the IEF.
The GCI aims to measure the factors that contrib-ute to a country’s global competitiveness, which the authors define as “the set of institutions, policies, and factors that determine the level of productivity of an economy, which in turn sets the level of prosperity that the country can earn.” As the Global Competitiveness Report describes, “the GCI combines 114 indicators that capture concepts that matter for productivity. These indicators are grouped into 12 pillars: institutions, infrastructure, macroeconomic environment, health and primary education, higher education and training, goods market efficiency, labor market efficiency, financial market development, technological readiness, market size, business sophistication, and innovation.” The World Economic Forum authors the GCI.

62
The SDG Index aims to measure SDG achieve-ment across the 17 goals, using currently avail-able national cross-country data. For each goal, one or more cross-country indicators are select-ed and averaged to produce one sub-index per SDG. In turn, the 17 sub-indexes are then aggregated to produce an overall measure of SDG achievement. In this paper we aggregate
the sub-indexes as a geometric average (that is, the 17 sub-indexes are multiplied together and then raised to power 1/17). The purpose is to assess each country’s achievement across the economic, social, and environmental objectives of the SDGs. The Sustainable Development Solutions Network Secretariat authors the SDG Index.
Table 1. Sustainable development and well-being regression results
Cantril Ladder (1)
Cantril Ladder (2)
Cantril Ladder (3)
Cantril Ladder (4)
Cantril Ladder (5)
SDG Index (SDSN) 0.051 *** (13.46)
- - 0.029 *** (5.22)
0.019 ** (2.62)
GCI (Global Competitiveness Index 2015-2016)
- 1.267 *** (13.31)
- 0.705 *** (4.21)
0.115 (0.57)
IEF (Index of Economic Freedom 2016)
- - 0.069 *** (8.18)
-0.001 (-0.06)
0.009 (0.92)
LGDPpc (GDP per capita)
- - - - 0.488 *** (4.05)
Unemployment Rate (IEF Data Set)
- - - - -0.037 *** (-3.67)
Adjusted R-squared 0.604 0.599 0.359 0.67 0.735
N 119 119 119 119 109
Notes: t-statistics are reported in parentheses. ***, **, and * indicate significance at the 1, 5 and 10 percent levels respectively.
The basic regression results are shown in Table 1. The LHS variable is the Cantril Ladder (CL) indicator of evaluative happiness as calculated by Helliwell et al in Chapter 2. The RHS variables in the initial regressions are the 2015 GCI, 2016 IEF, and 2016 SDGI. In the case of the SDGI, which is built up from roughly 40 individual indicators, I make one adjustment, to remove the Cantril Ladder from the SDG Index itself, since CL is included among the individual indicators. The SDG Index used in the regres-sions is therefore slightly different from the SDG Index as reported by the SDSN (2016). Note that constant terms are included in all regressions but not reported in the table.
There are 119 countries with data for CL, GCI, IEF, and SDGI. In bivariate regressions of CL on the three indexes, both the SDGI and GCI account for around 60 percent of the variation of CL (regressions 1 and 2), while the IEF is a much weaker explanatory variable, accounting for only around 36 percent (regression 3). When all three indexes are included in regression (4), the GCI and SDGI are highly significant, while the IEF is not significant and has a negative sign. In other words, economic freedom per se does not seem to explain much, if anything, about cross-country happiness after controlling for national competitiveness (GCI) and progress towards the SDGs (SDGI).

W O R L D H A P P I N E S S R E P O R T 2 0 1 6 | U P D AT E
63
This simple cross-country evidence suggests that both economic competitiveness and SDG achievement, but not economic freedom, explain aspects of well-being. To understand whether GCI and SDGI are capturing determinants of happiness beyond the standard macroeconomic determinants, we next add national income per capita and the unemployment rate to the regres-sion. Do the GCI and SDGI help to explain cross-national happiness beyond their correla-tion with national income per capita and with unemployment?
In regression (5) we see the results. Higher national income per capita and a lower unem-ployment rate both contribute significantly to explaining cross-national variations in happi-ness. Once those two variables are included on the RHS, the GCI lacks explanatory power, while SDGI remains statistically significant. The SDG Index contains information about well-being that goes beyond these two macroeconomic variables, while GCI does not. This finding is in line with the basic premise that that happiness depends not only on economic variables but on social and environmental factors as well.
Future research will attempt to incorporate additional aspects of sustainable development into the research framework established in Chapter 2. Using the panel data reported in Chapter 2, Helliwell et al have already demon-strated that health and social factors (trust, generosity, corruption) are key determinants of cross-country happiness. Notably, both healthy life expectancy and corruption are part of the current SDG Index. In future studies we will examine whether other dimensions of the SDG Index – for example gender equality, clean air and water, and urban sustainability – add further explanatory power to the cross-country happi-ness results in the panel data. We should also stress that some issues, such as the importance of mental health, can only be studied if we move from comparison between countries to compari-sons between individuals.
Conclusions and Follow Up
As Helliwell et al (2013, 2015, 2016) emphasize, happiness is the product of many facets of society. Income per capita matters, as econo-mists emphasize, but so too do social condi-tions, work conditions, health, pollution, and values (e.g. generosity). The libertarian argu-ment that economic freedom should be champi-oned above all other values decisively fails the happiness test: there is no evidence that eco-nomic freedom per se is a major direct contribu-tor of human well-being above and beyond what it might contribute towards per capita income and employment. Individual freedom matters for happiness, but among many objectives and values, not to the exclusion of those other considerations. Sustainable development and related holistic concepts (such as Pope Francis’s integral human development) are a better overarching guide to human wellbeing than the single-minded pursuit of income, or economic freedom, or other one-dimensional objective.
We still have many crucial things to learn about the deep sources of human well-being. I believe that we should explore more deeply the specific characteristics of work that are favorable or unfavorable to happiness, for as Pope Francis emphasizes, the satisfaction with work is a fundamental source of human well-being. Arduous, dangerous labor, such as the physically difficult work of countless smallholder farmers, is likely to impinge directly and adversely on subjective well-being. We also need to explore in much more detail how the cultivation of mind-fulness and personal virtues may contribute to long-term happiness. We should examine whether environmental degradation (e.g. air pollution) directly lowers well-being beyond the effects on human health and productivity. We have only touched the surface concerning the relationship of happiness and sustainable development, but the preliminary evidence is heartening: the SDGs are likely to help us move along a path of higher well-being as expressed by the world’s people themselves.

64
Data Annex
All variables are for the most recent years. They are taken from the following sources:
GCI: The Global Competitiveness Report (2015-2016). The World Economic Forum. http://reports.weforum.org/global-competi-tiveness-report-2015-2016/
IEF: Index of Economic Freedom (2016). The Wall Street Journal and The Heritage Foundation. http://www.heritage.org/index/about
LGDPpc (Log GDP per capita): Helliwell, J. F., Huang, H., & Wang, S. (2015). The geography of world happiness, World Happiness Report 2015. New York: Sustainable Development Solutions Network. http://worldhappiness.report/download/
Unemployment: Index of Economic Freedom (2016). The Wall Street Journal and the Heritage Foundation. http://www.heritage.org/index/about
SDG Index: Sustainable Development Solutions Network. Preliminary Sustainable Development Goal (SDG) Index and Dashboard (2016). http://unsdsn.org/resources/publications/sdg-index/

W O R L D H A P P I N E S S R E P O R T 2 0 1 6 | U P D AT E
65
References
Aristotle, Jowett, B., & Davis, H. W. C. (1920). Aristotle’s Politics. Oxford: At the Clarendon Press.
Bentham, J. (1789). An Introduction to the Principles of Morals and Legislation. Oxford: Clarendon Press.
Helliwell, J. F., Huang, H., & Wang, S. (2015). The Geography of World Happiness. In World Happiness Report 2015. New York: Sustainable Development Solutions Network. http://worldhappiness.report/download/
Helliwell, J. F., Huang, H., & Wang, S. (2016). The Distribu-tion of World Happiness. In World Happiness Report 2016 Update (Vol. I). New York: Sustainable Development Solutions Network. http://worldhappiness.report/download/
Helliwell, J. F., & Wang, S. (2013). World Happiness: Trends, Explanations and Distribution. In World Happiness Report 2013. New York: Sustainable Development Solutions Network. http://unsdsn.org/wp-content/uploads/2014/02/WorldHappi-nessReport2013_online.pdf
Index of Economic Freedom (2016). The Wall Street Journal and The Heritage Foundation. http://www.heritage.org/index/about
Machiavelli, N. (1513). The Prince.
Nozick, R. (1974). Anarchy, State, and Utopia. New York: Basic Books.
Pope Francis. (2015). Laudato Si’. https://laudatosi.com/watch
Pope Paul. (1967). Populorum Progressio. Encyclical of Pope Paul VI On The Development of Peoples. http://w2.vatican.va/content/paul-vi/en/encyclicals/docu-ments/hf_p-vi_enc_26031967_populorum.html
Rawls, J. (1971). A Theory of Justice. Cambridge, Mass: Belknap Press.
The Global Competitiveness Report (2015-6). The World Economic Forum. http://reports.weforum.org/global-competitiveness-report-2015-2016/
Sustainable Development Solutions Network (2016). Prelimi-nary Sustainable Development Goal (SDG) Index and Dash-board. http://unsdsn.org/resources/publications/sdg-index/

Edited by John Helliwell, Richard Layard and Jeffrey Sachs
This publication may be reproduced using the following reference: Helliwell, J., Layard, R., & Sachs, J. (2016). World Happiness Report 2016, Update (Vol. I). New York: Sustainable Development Solutions Network.
World Happiness Report management by Sharon Paculor and Anthony Annett, copy edit by Jill Hamburg Coplan, Aditi Shah and Saloni Jain, design by John Stislow and Stephanie Stislow, cover design by Sunghee Kim.
Full text and supporting documentation can be downloaded from the website:http://worldhappiness.report/ #happiness2016
ISBN 978-0-9968513-3-6 Volume I
SDSN
The Sustainable Development Solutions Network (SDSN) engages scientists, engineers, business and civil society leaders, and development practitioners for evidence based problem solving. It promotes solutions initiatives that demonstrate the potential of technical and business innovation to support sustainable development (www.unsdsn.org).
Sustainable Development Solutions Network314 Low Library 535 W 116th StreetNew York, NY 10027USA


WORLD HAPPINESS REPORT 2016 | VOLUME IUpdate

Edited by Jeffrey Sachs, Leonardo Becchetti and Anthony Annett
WORLD HAPPINESSREPORT 2016 | VOLUME II
Special Rome Edition


1
TABLE OF CONTENTS
1. Inside the Life Satisfaction Blackbox 2
Leonardo Becchetti, Luisa Corrado and Paola Samà
2. Human Flourishing, the Common Good, and Catholic Social Teaching 38 Anthony Annett
3. The Challenges of Public Happiness: An Historical-Methodological Reconstruction 66 Luigino Bruni and Stefano Zamagni
4. The Geography of Parenthood and Well-Being: Do Children Make Us Happy, Where and Why? 88 Luca Stanca
5. Multidimensional well-being in contemporary Europe: An analysis of the use of a Self-Organizing Map applied to SHARE data. 104 Luca Crivelli, Sara Della Bella and Mario Lucchini
WORLD HAPPINESS REPORT 2016 Edited by Jeffrey Sachs, Leonardo Becchetti and Anthony Annett
UpdateSpecial Rome Edition
The World Happiness Report was written by a group of independent experts acting in their personal capacities. Any views expressed in this report do not necessarily reflect the views of any organization, agency or program of the United Nations.

LEONARDO BECCHETTI, LUISA CORRADO AND PAOLA SAMÀ
Chapter 1
INSIDE THE LIFE SATISFACTION BLACKBOX
2Leonardo Becchetti, Department of Economics, Law and Institutions (DEDI), University of Rome Tor Vergata (Italy). E-mail: [email protected]
Luisa Corrado, Department of Economics, Law and Institutions (DEDI), University of Rome Tor Vergata (Italy) and University of Cambridge (UK). E-mail: [email protected]; [email protected]
Paola Samá, Department of Economics, Law and Institutions (DEDI), University of Rome Tor Vergata (Italy). E-mail: [email protected]

W O R L D H A P P I N E S S R E P O R T 2 0 1 6 | S P E C I A L R O M E E D I T I O N
3
Executive summary
We propose an alternative measure of life satisfaction to the standard, synthetic cognitive well-being question, based on the specific contribution of 11 life-satisfaction sub-compo-nents (including satisfaction about the past, life opportunities, hope for the future, vitality, control over one’s life, meaning of life). The alternative measure is either estimated as a latent factor, obtained as a simple unweighted average from the above mentioned sub-compo-nents, or extracted with principal component analysis. We document that the new dependent variable fits much better standard socio-demo-graphic controls and corrects the “Danish life satisfaction bias” in the direction suggested by the vignette approach. These findings do not reject our theoretical assumption that the alter-native measures derived from the life satisfac-tion sub-components are less noisy and less culturally biased and therefore perform better than the standard self-reported life satisfaction. The straightforward policy advice of the paper is to introduce the above-mentioned sub-compo-nents (similarly to what happens with sub-ques-tions used to calculate the General Health Questionnaire score) in an additional question to measure more effectively subjective well-being.
Introduction
Investigation into the determinants of life satisfaction has boomed in recent years due to the availability of worldwide information on subjective well-being at the individual level in many well-known surveys (such as the German Socioeconomic Panel, the British Household Panel Survey, and the Gallup World Poll). The topic is of particular importance for at least four reasons. First, it provides an alternative independent source (beyond experimental evidence) for testing previously undemonstrat-ed assumptions about the human preferences (or social norms) affecting subjective well-be-ing, which are at the basis of all theoretical economic models. Second, it provides valuable evidence of a widening range of factors affect-ing life satisfaction, beyond the dimension of observed choices. This helps us to understand the importance of, among other factors, relative comparisons, hedonic adaptation, experienced utility, and the relationship between expecta-tions and realizations.1 Third, it sheds lights on as-yet-unexplored and important aspects of economic reality (i.e. the measurement of the shadow value of non-market goods2) with relevant policy insights. Fourth, it provides information and evidence for the debate on reforming well-being indicators: If straightfor-wardly maximising happiness is not a good idea for various reasons, happiness studies may provide stimulating insights on what the well-being indicators that have been currently adopted may have left behind.
In spite of the great potential of the findings of life-satisfaction literature, many methodological problems challenge its validity. These problems are related to the interpersonal and inter-country comparability of the standard measure, self-de-clared subjective well-being, which lacks of cardinality. The vignette approach is a recent attempt to overcome the problem.3 The approach corrects for individual heterogeneity by using differences across individuals to evaluate a common situation (the vignette), with the same

4
response categories as the self-assessment question. However, as is well known, even this approach has limits, since the two hypotheses on which it hinges (vignette equivalence and response consistency4) are often rejected by empirical tests.5
Our paper’s contribution is to define a theoreti-cal framework which aims to improve upon standard subjective well-being measures, and predicts that three alternative measures of life satisfaction will be superior in terms of their capacity to reduce the dependent variable noise and cultural biases captured by country dum-mies. The approach is based on the measuring of 11 life-satisfaction sub-components.
Our main argument is that, when asked to formulate their life-satisfaction score, individu-als intuitively weight different sub-components (evaluation of past life, opportunities for the future, overall meaning of their own life, vitality, etc.). Since the operation is not easy, the general, abstract life-satisfaction question incorporates much more noise and measurement error than a latent variable, which may be extracted by using direct answers to each of the abovemen-tioned, implicit sub-components.
A second argument supporting our main as-sumption is that the sub-component questions are much more straightforward and easy to answer when they are formulated on a 1–4 range (as in the SHARE database we use in this pa-per), in which any number is associated with an adjective whose meaning can be grasped imme-diately. On the contrary, in the standard 0–10 life-satisfaction questions, there is no verbal correspondence for each of the scale’s numerical values. Finally, we postulate that the sub-compo-nent approach also offers an additional advan-tage: Country-specific cultural biases (also due to the different nuances of the translation of the term “life satisfaction” in different languages) tend to be much larger on the general questions than when averaging sub-components, or
extracting from them the error-free, latent life-satisfaction factor.
We test our hypothesis on data from the SHARE database where, to the standard life-satisfaction question, “How satisfied are you with your life, all things considered?” with responses on a scale from 0 (completely dissatisfied) to 10 (complete-ly satisfied),we add an additional question on the life-satisfaction sub-component. The question relates to 11 items:
1. How often do you think your age prevents you from doing the things you would like to do?
2. How often do you feel that what happens to you is out of your control?
3. How often do you feel left out of things?
4. How often do you feel that you can do the things that you want to do?
5. How often do you feel that family responsi-bilities prevent you from doing what you want to do?
6. How often do you feel that a shortage of money stops you from doing the things that you want to do?
7. How often do you look forward to another day?
8. How often do you feel that your life has meaning?
9. How often, on balance, do you look back to your life with a sense of happiness?
10. How often do you feel full of energy these days?
11. How often do you feel that life is full of opportunities?
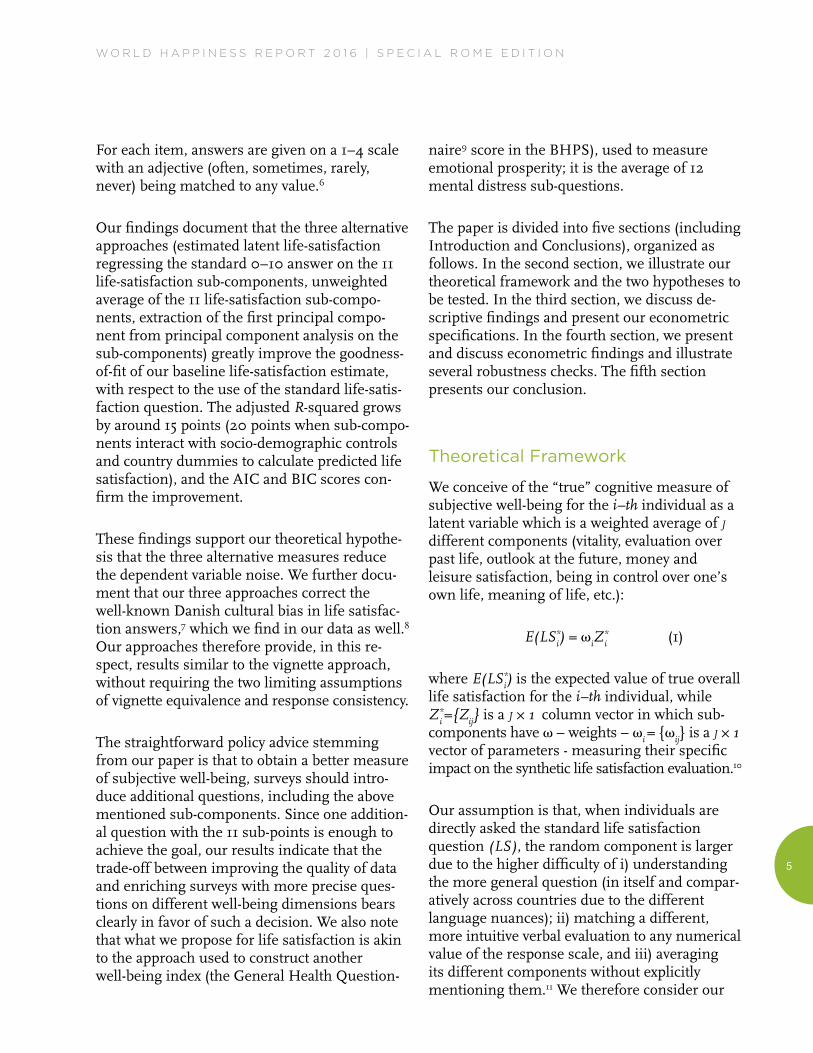
W O R L D H A P P I N E S S R E P O R T 2 0 1 6 | S P E C I A L R O M E E D I T I O N
5
For each item, answers are given on a 1–4 scale with an adjective (often, sometimes, rarely, never) being matched to any value.6
Our findings document that the three alternative approaches (estimated latent life-satisfaction regressing the standard 0–10 answer on the 11 life-satisfaction sub-components, unweighted average of the 11 life-satisfaction sub-compo-nents, extraction of the first principal compo-nent from principal component analysis on the sub-components) greatly improve the goodness-of-fit of our baseline life-satisfaction estimate, with respect to the use of the standard life-satis-faction question. The adjusted R-squared grows by around 15 points (20 points when sub-compo-nents interact with socio-demographic controls and country dummies to calculate predicted life satisfaction), and the AIC and BIC scores con-firm the improvement.
These findings support our theoretical hypothe-sis that the three alternative measures reduce the dependent variable noise. We further docu-ment that our three approaches correct the well-known Danish cultural bias in life satisfac-tion answers,7 which we find in our data as well.8 Our approaches therefore provide, in this re-spect, results similar to the vignette approach, without requiring the two limiting assumptions of vignette equivalence and response consistency.
The straightforward policy advice stemming from our paper is that to obtain a better measure of subjective well-being, surveys should intro-duce additional questions, including the above mentioned sub-components. Since one addition-al question with the 11 sub-points is enough to achieve the goal, our results indicate that the trade-off between improving the quality of data and enriching surveys with more precise ques-tions on different well-being dimensions bears clearly in favor of such a decision. We also note that what we propose for life satisfaction is akin to the approach used to construct another well-being index (the General Health Question-
naire9 score in the BHPS), used to measure emotional prosperity; it is the average of 12 mental distress sub-questions.
The paper is divided into five sections (including Introduction and Conclusions), organized as follows. In the second section, we illustrate our theoretical framework and the two hypotheses to be tested. In the third section, we discuss de-scriptive findings and present our econometric specifications. In the fourth section, we present and discuss econometric findings and illustrate several robustness checks. The fifth section presents our conclusion.
Theoretical Framework
We conceive of the “true” cognitive measure of subjective well-being for the i–th individual as a latent variable which is a weighted average of j different components (vitality, evaluation over past life, outlook at the future, money and leisure satisfaction, being in control over one’s own life, meaning of life, etc.):
E(LS*i) =
iZ*
i (1)
where E(LS*i) is the expected value of true overall
life satisfaction for the i–th individual, while Z*
i ={Z
ij} is a j ∑ 1 column vector in which sub-
components have – weights – i = {
ij} is a j ∑ 1
vector of parameters - measuring their specific impact on the synthetic life satisfaction evaluation.10
Our assumption is that, when individuals are directly asked the standard life satisfaction question (LS), the random component is larger due to the higher difficulty of i) understanding the more general question (in itself and compar-atively across countries due to the different language nuances); ii) matching a different, more intuitive verbal evaluation to any numerical value of the response scale, and iii) averaging its different components without explicitly mentioning them.11 We therefore consider our

6
dependent variable,12 the standard life-satisfac-tion question, as characterised by measurement error within the classical errors-in-variables framework, and by a fully observed, continuous dependent variable.13 Hence, when the standard question is formulated, surveys capture the following variable:
LSi = LS*
i + v
i (2)
where vi represents the measurement error and
E(vi) ≠ 0. More specifically, we assume that v
i
has a country specific (c) and an individual
specific (i) bias.
vi =
c +
i (3)
Conversely, when individual i-th is asked about the j-th components we obtain:
Zij = Z*
i + v~
ij (4)
where
v~ij = ~
cj + ~
ij
is also a measurement error which captures individual bias ~
ij (i.e. due to a misunderstand-
ing of the specific Z question or to a difficulty of the individuals in evaluating correctly his/her situation) and country-specific bias ~
cj (i.e. due to
cultural and linguistic differences in the way the life satisfaction sub-component question is understood in different countries or to strategic answering that is a social/cultural tendency to overestimate or underestimate own levels of life satisfaction for each sub-component).
We assume, however, that the bias disappears when using individual components as far as the number of components increases and the number of interviewed individuals grows so that EZ
i EZ*
i where Z
i = {Z
ij}. As stressed by Bound
et al.,14 in the presence of exogenous determi-
nants of the error ridden variables,15 or, in some cases, multiple indicators of the same outcome, it is possible to use them as instruments to infer the “true” value of life satisfaction. Hence, using Z
i as the set of instruments for LS*
i we assume
that E(LS*i | Z*
i) is a strict linear function of Z
*i so
that these multiple indicators are orthogonal to the error implying Cov(Z*
i , v~
i)=0 and there is no
measurement error, hence E (v~i)=0.
The measurement error term of the synthetic question LS
i does not go to zero as far as the
number of interviewed individuals grows, implying E(v
i) ≠ 0 for at least three reasons.
First, the life satisfaction term is more abstract than a straightforward question on its compo-nents (vitality, evaluation of part life, etc.). Second, it requires a quick calculus of (1) and of the weights of the individual Z
i components
which is not easy and intuitive. It is for instance highly likely that cultural differences affect the more abstract life satisfaction question, while they cancel out when using the more straightfor-ward set of Zi
questions. Finally, the sub-compo-nent questions are much more straightforward and easy to answer when they are formulated on a 1–4 range since in this instance any number is associated to an adjective whose meaning can be grasped immediately. On the contrary, in the 1–10 scale life-satisfaction question there is no verbal correspondence for each of the scale values. This is why the conditional expectation of the error term, v
i, may be significantly different from
zero when we adopt the synthetic question on life satisfaction. Hence, a more articulated set of questions on the set of Z
i components may
produce a much richer and accurate measure of cognitive subjective well-being.
To understand the implications of measurement errors when we adopt a synthetic answer on life satisfaction, suppose that we estimate the following relationship for life satisfaction:
LS*i =
0 + ' d
i + ' X
i +
i (5)

W O R L D H A P P I N E S S R E P O R T 2 0 1 6 | S P E C I A L R O M E E D I T I O N
7
i = 1,…, N c = 1,…, C – 1 (6)
where 0 denotes a constant, d
i =
{d
ic} is a
(C– 1) ∑ 1 vector of country dummies, with d
ic = 1 if individual i is resident in country c and
is the corresponding (C– 1) ∑ 1 vector of coefficients. X
i = {X
ik} with k=1, …, K denotes a
(K–1) ∑ 1 vector of controls and is the corre-sponding K ∑ 1 vector of coefficients. Finally,
i
is an individual error term which is normally distributed with E(
i) = 0.
If the synthetic answer for life satisfaction is observed with error we get:
LSi =
0 + ' d
i + ' X
i + e
i (7)
Notice that the error term is now ei =
i +
v
i. This
means that if we estimate the model, we would see the error in measurement appearing in the new error term. If the measurement error is correlated with the independent variables, this also implies a violation of the assumption that the conditional expectation of the error should be zero.
By the OLS assumptions, i should be uncorrelat-
ed with the covariates and consequently should not present any problem.16 Looking at the measurement error, v
i, if it is independent from
the regressors Cov(Xi , v
i)=0 and E(v
i) ≠ 0, the
estimate of the coefficients will still be unbiased but measured with less precision. However, if both E(v
i) ≠ 0 and Cov(X
i , v
i) ≠ 0, the endogene-
ity between vi and X
i induced by the measure-
ment error implies that the estimates of the coefficients may also be biased.
The other main problem comes from inference since var (
i + v
i ) = 2
+ 2
v > 2
. The last
inequality means that the estimated variance is larger than when using the true life satisfaction measure, which means that inference is liable to type I error. Collecting more data in the form of multiple components for the dependent
variable could be a solution also to this problem, since more observations imply a better estima-tor of variance, and consequently reduce errors in inferences.
In this instance, the SHARE questions allow us to measure some fundamental components of the life-satisfaction evaluation such as: vitality, a negative evaluation of the past life, a positive look at the future, absence of monetary con-straints, sensation that life is meaningless, feeling in control of one’s own life, sense of not being left out, perception of having time beyond family duties, and freedom of choice. As it is clear from these attributes, the components of life satisfaction in the survey include an outlook on the past and on the future, money and leisure satisfaction, vitality and control over one’s own life, plus an eudaemonic definition of life satis-faction (meaning of life). This is why they can be considered a good deal richer than the simple, standard cognitive synthetic question. An additional advantage of the question on sub-components is that a unique and different verbal modality is attached to each numerical value of the ordinal scale. This makes the an-swer easier and more intuitive and may help to counteract the measurement error, v
i.
What we propose is the use of the estimated latent life satisfaction:
LS*i =
0 + ' Z
i +
i (8)
where is a j ∑ 1 vector of coefficients. Here, the use of multiple components allows the counter-action of the measurement error in the sub-com-ponents as defined in (4) implying E(
i)=0. We
use the predicted value of life satisfaction:
L̂S*i
= ̂0 + ̂' Z
i (9)
as the dependent variable of our benchmark estimate in (5) which is a more correct measure of LS*
i than the observed synthetic question

8
LSi
= LS*i + v
i under the assumption that the
weights in (7) are correctly estimated i.e. ̂ij
= ij
i, j.
Alternatively, our second approach consists of simply averaging the sub-components to obtain:
which is equal to the previous measure under the assumption that
ij = 1. The limit of this
second approach is that it is contradicted by empirical evidence in case the –weights are different from one. The advantage is that it has less noise if, for some reasons (i.e. endogeneity), we think that the estimated weights do not coincide with actual weights ( ̂
ij ≠
ij ).
A third approach which may overcome the problem of overlaps and correlations among the different components of life satisfaction is the principal component approach. On the basis of the approach, we will extract the first orthogonal factor accounting for the higher share of the variance and use such a variable as dependent variable in our estimate (see section 3).
Hypothesis Testing
Given our assumptions, a first testable hypothe-sis is that the goodness-of-fit of the model using the latent variable LS*
i is better than that of the
model using the declared life satisfaction LSi. In
fact, in the presence of measurement error in a model for declared life satisfaction, LS
i, the
variance of residual grows, implying that both the Akaike Information Criterion (AIC) and the Bayesian Information Criterion (BIC) will be higher, while the adjusted R2 will be lower, indicating a poorer performance.17
A second testable hypothesis related to country dummies is that our approach should be effec-tive in reducing country bias (measured by the significance of country dummies in vignette responses) in the expected direction.
Descriptive Finding and Benchmark Model Specification
We use data from the second wave of SHARE (which covers only European citizens over 50) including interviews run between 2006 and 2007,18 which is the only wave including the crucial information on the 11 happiness sub-com-ponents. Table 1 provides the list of variables and Figure 1 reports the histogram of self-reported life satisfaction, while Table 2 illustrates some descriptive findings of our sample.
Self-reported life satisfaction has the usual right-skewed distribution, with a mean of 7.54 and about 60 percent of respondents declaring a self-reported life satisfaction above 6 (Figure 1). All answers to the 11 life satisfaction sub-ques-tions have averages between 2.5 and 3.5 (the range is 1–4) with the lowest average for the sub-components related to age-preventing activities, and lack of money (items 1 and 5 of the 11 sub-questions, see introduction) (Table 2). The sample is almost perfectly balanced in terms of gender characteristics (females are 49.9 percent), while the average years of educa-tion are 10.5. Half of the sample is between 50 and 60 years old. Average household size is 2.25 (Table 2).
Our baseline estimate of life satisfaction is
LSi =
0 + ' d
i + ' X
i + e
i (10)
As is well known, the dependent variable (self-reported life satisfaction) is ordinal, so its estimation would require something like an ordered logit or probit. However, as Ferrer–i–Carbonell and Frijters19 (2004) argue, cardinal

W O R L D H A P P I N E S S R E P O R T 2 0 1 6 | S P E C I A L R O M E E D I T I O N
9
estimation seems to perform just as well as ordinal estimation in this context.20
Regressors used are those standard in this literature and include a gender dummy (taking value one if the respondent is male), years of education, household size, the number of children, and the number of grandchildren. Marital status is measured by five dummies (married, divorced, separated, widowed, living with regular partner) with single status as the reference category. Age is controlled for with six age class dummies with age 50–55 as the refer-ence category. Four dummies (big city, large town, small town, and suburbs, with rural as the reference category) capture characteristics of the place of residence.
The SHARE database gives us the opportunity to control for a large number of health factors, such as various physical disabilities and a number of reported illnesses. We measure them synthetically with three variables, which sum many specific single items in the three domains (see Table 1 for details). We finally add a set of variables measuring voluntary work, religious attendance, participation in sports and social activity, helping in families, and leaving an inheritance.
As is well known, the SHARE database has a very large number of individuals who refuse to report income, and many missing values for other important variables. We therefore follow an approach that is standard in previous empiri-cal studies on this dataset by using Christelis’ data on imputed gross total household income included in the Share database,21 and calculated following the Fully Conditional Specification methods (FCS) of Van Buuren et al.22 The imputations23 are country-specific in the sense that they are made separately for each country,24 and the sample is representative of the popula-tion aged 50 and above. The main scope of this procedure is to generate the distribution of the missing value of a specific variable, conditional
on the value of the observed values of other non-missing variables in the dataset. The SHARE database provides data obtained with this procedure by creating five imputed datasets. We therefore end up having five different values (one for each iteration) of the imputed variables. In what follows, we propose estimates using just one of them, while performing robustness checks using the other four iterated values. Variables with imputed variables in our specifi-cation are the log of household income, and a number of other variables characterised by item non-response: number of children; number of grandchildren; number of rooms in the main residence; and whether the respondent lives in a big city, suburbs/outskirts of a big city, large town, small town, or rural area or village.25
Econometric Findings
In the benchmark estimate where the dependent variable is the 0–10 standard life-satisfaction question, the adjusted R-squared is .217 and the AIC and BIC criteria are equal to 112,824.6 and 112,924.4 respectively (Table 3, column 1). The model includes many controls, but the Variance Inflation Factor (VIF) shows that there are no significant problems of multicollinearity.26 The log of imputed household income and education years are positive and significant as expected. Consistent with the empirical literature, we find that being married and living with a partner significantly increase life satisfaction compared to being single. The household size has a nega-tive sign, presumably a proxy for the impact of household size on the individual portion of gross total household income. Living in big cities impacts positively, while the age-dummy effects grow with age.27 The number of grand-children positively affects self-declared life satisfaction, while the number of children does not. All three variables indicating health prob-lems are negative and significant, while those measuring social life (participation in sports, helping members of the family, doing volunteer work) are mostly positive and significant. Inheri-

10
tance transmission during life is also positively associated to our dependent variable. Most country dummies are significant and are expect-ed to include two components: country-specific omitted variables affecting life satisfaction (such as climate, institutions, and cultural effects) and heterogeneity in life satisfaction scales (country bias). We will try to identify country bias in what follows by testing whether country dummies are significant when the dependent variable is the respondents’ evaluation of the same vignette.
To produce estimates from the first alternative approach, we estimate the latent life satisfaction factor with the following specification
LS*i =
0 + ' Z
i +
i (11)
in which the standard life satisfaction variable is regressed on the 11 life satisfaction sub-compo-nents (the Z-variables) described in the introduc-tion and = {
j} with j = 1,…, 11 denotes the
corresponding 11 ∑ 1 vector of coefficients. Note that the correlation matrix of the different happiness components displays a maximum correlation between the future good and oppor-tunities variables (around .63). Other strong correlations are between vitality and, respective-ly, future good (around .54) and opportunities (56 percent) (Table 4).
All the regressors are strongly significant as expected and the adjusted R-squared is around 39 percent (Table 5, column 1). The VIF shows that there are no multicollinearity problems in this estimate. The most important component is future perspectives (future good), but the evalua-tion of the past (past good) is also strongly significant, confirming that life satisfaction is the product of a weighted average of different sub-components including an evaluation of the present, the past, and the perspective on one’s future life (future perspectives). For an idea of the magnitude of these effects, when the model is re-estimated as an ordered logit, a unit in-crease in future perspectives adds 3.3 percent to
the likelihood of declaring the highest level of life satisfaction, while positive evaluation of the past only adds 2.4 percent (Table 5, column 3).
The predicted value of the regression in (2):
L̂S*i
= ̂0 + ̂'Z
i (12)
is then used as dependent variable in the base-line model in (1) which becomes
L̂S*i
= 0 + 'd
i + 'X
i + ~e
i (13)
The baseline model with the modified depen-dent variable has a much better goodness-of-fit (from .217 to .342). The AIC and BIC (76,647.54 and 76,747.01) are also considerably improved (Table 3, column 2).
When comparing the sign and significance of the regressors between standard and alternative models we find that: i) life satisfaction is not increasing with age anymore; ii) the magnitude of income and the significant marital status variables (married and with regular partner) is reduced, even though the regressors remain significant; iii) house size becomes significant; iv) the significance of geographical dummies changes. Magnitudes and signs of all the other variables remain remarkably stable.
The first alternative method has several limits. First, it still uses in the first stage the dependent variable whose limit we want to overcome. Second, the estimated coefficients in the regres-sion used to calculate the predicted latent life satisfaction variable may be biased by omitted variables, endogeneity or multicollinearity (even though we documented that the last problem is not severe).
We therefore test the robustness of our theoreti-cal hypotheses with two other alternatives. The first is a simple unweighted average of the life-satisfaction sub-components. We are aware

W O R L D H A P P I N E S S R E P O R T 2 0 1 6 | S P E C I A L R O M E E D I T I O N
11
that, in this way, we overcome the limit of the latent life satisfaction estimate even though, by using an unweighted average, we assume quite restrictively that the different sub-components have unit weights.
The estimate of the baseline model with the sub-components unweighted average dependent variable provides a goodness-of-fit which is very close to that of our benchmark alternative approach in terms of R-squared (34.2 percent), while improving further in terms of AIC and BIC (35,813.61 and 35,813.49 respectively) (Table 3, column 3).
The other alternative which avoids the arbitrary choice of equal weights is the extraction of a principal component from the life-satisfaction sub-components. The approach has the addition-al advantage of correcting for correlation and potential multicollinearity among different life-satisfaction sub-components (i.e. the answer to the meaning of one’s own life may be correlat-ed with feeling in control, not feeling left out, having a good perspective on the future, etc.). The principal component analysis documents that the first extracted component accounts for 37 percent of the variability of the selected variable. The first component has its strongest correlation with the sub-questions about future perspectives (.38), life opportunities (.37) and vitality (.36) (Tables 6 and 7). The Kaiser-Mey-er-Olin measure of sampling adequacy (.76)28 rejects the hypothesis that the selected variables have too little in common to implement a factor analysis.
When using the first principal component as dependent variable (our third alternative meth-od), we find that the goodness-of-fit is around .35 (Table 3, column 4) with significance and signs of regressors very close to those of the two previous approaches.
The comparison of the goodness-of-fit among the standard model and our three alternatives, in terms of AIC and BIC values, tells us that the best model is the one in which the dependent variable is the unweighted average of sub-com-ponents followed by the one in which we use the predicted life satisfaction estimated on the 11 sub-components. The ranking of the models in terms of adjusted R-squared is, however, differ-ent—since all three models are very close, and outperform by far the standard one, with the unweighted average doing slightly worse. The reason for the different ranking is that the unweighted average model has, by far, the smallest residual sum of squares (which is the crucial factor for AIC and BIC), but also a much smaller total sum of squares (which is the factor on which progress in goodness-of-fit is scaled for when using adjusted R-squared).
Finally, we aim to check whether our approach can correct for country bias. We tackle this issue in the most conservative and simple way. We first average the values of the two life-satisfac-tion vignettes included in the SHARE,29 and then regress the variable on the country dum-mies with/without socio-demographic controls. France is the omitted reference country. The Danish dummy is the highest in magnitude and significance (around .627, t-stat 14.08), followed by the Czech dummy (.474, t-stat 10.50) and the German dummy (.332, t-stat 8.42), indicating that respondents from these three countries overevaluate the common vignette situations in terms of life satisfaction vis à vis the French, who are the reference category. The Danish dummy result is consistent with what is found in the vignette literature as noted in the introduc-tion.30 This gives us confidence in the fact that a cultural bias exists, at least for this country.
We therefore check whether our three approach-es correct country biases in the expected direc-tion. The inspection of the country dummies in the first column of Table 3 (standard life-satisfac-tion estimate) compared with those in the other three columns of the same Table 3 (our three

12
alternative approaches) documents that all of the three approaches correct the Danish effect in the desired direction. The Danish dummy is, in fact, .798 in the standard life-satisfaction estimate. It falls to .321 under our first alternative method (life satisfaction predicted on the 11 sub-compo-nents), to .135 when using the second alternative method (unweighted average of sub-compo-nents), and to .454 when using the third alterna-tive method (principal component analysis). Confidence intervals of the Danish dummy from the three alternative methods do not overlap with those of the standard life satisfaction estimate. Note as well that both the Czech and German dummies are corrected in the expected direction (reduction of the positive magnitude) in five out of six cases by the three alternative approaches.
Robustness Check and Discussion
We perform several robustness checks to control whether our main findings are robust to pertur-bations of the benchmark model. First of all we want to control their sensitivity to the imputa-tion variables. We therefore report, for simplici-ty, only goodness-of-fit statistics (and not full regression estimates), considering imputed variable values from the other four iterations. The results are very close to those of the first iteration, consistent with what is found in the literature using the same data (Table 8).
Since the number of observations in the second model is slightly lower than that in the first model, due to some missing values on the life-satisfaction sub-component questions which do not match with missing values on baseline regressors (21,680 against 22,494), we repeat the first estimate with exactly the same valid observations of the second. We find that our con-clusions remain unchanged (Table 9).
In a third robustness check of our first approach, we re-estimate the latent life-satisfaction factor by assuming that the impact of the 11 sub-com-
ponents is not the same according to different countries or crucial sociodemographic factors. More specifically, we interact the sub-compo-nents with all country dummies, age classes, and gender according to the following specifica-tion.
(14)
where dic (c = 1,…, C) denote the country dum-
mies, dia (a = 1,…, A) denote the age dummies
and dig denotes the gender dummy. The good-
ness-of-fit of the estimate jumps to .40 (highest among all models) even though the AIC is almost unchanged with respect to Table 3, column 2 where we use predicted life satisfac-tion from (2) (Table 11). This indicates that there is a clear trade-off with the capacity of correcting country dummies in the right direction. The result is consistent with the fact that overparam-etrization improves goodness-of-fit (as it gener-ally does) at the cost of creating noise on the coefficient values, since the values of the predict-ed life-satisfaction component used as depen-dent variable are affected by many insignificant interacted variables (while the 11 sub-compo-nents in the simple model in Table 5 are all significant).
In another robustness check, we re-estimate the benchmark model from Table 3, excluding the health variables which may be suspected of endogeneity. Last, we eliminate from our specifi-cation all the variables imputed with the Christe-lis et al. (2011) approach,31 to check whether our findings are sensitive to such imputation. Our main findings are robust to these changes (Tables 12 and 13).
Consider, finally, that a peculiarity of our work is that we are comparing models in terms of alternative dependent variables and not, as usually occurs, nested or non-nested models on the basis of differences in the considered set of regressors. An observationally equivalent interpretation of our findings could therefore be

W O R L D H A P P I N E S S R E P O R T 2 0 1 6 | S P E C I A L R O M E E D I T I O N
13
that the selected regressors are spurious and that the “true” set of life-satisfaction determi-nants could, in principle, yield a superior goodness-of-fit when using the standard life-sat-isfaction dependent variable. In such a case, the superior goodness-of-fit of the alternative model does not demonstrate, per se, that our alterna-tive dependent variables capture better factors affecting life satisfaction.
What might be argued against this interpreta-tion is that we use regressors (marital status, income, gender, education, etc.) which are standard in the life-satisfaction literature. Fur-thermore, their sign and magnitude does not vary much between the standard and the alterna-tive models. Hence, it is much more reasonable to assume that the considered regressors are the true observable determinants of life satisfaction, and that our alternative dependent variable can be measured with less bias and noise than the standard one, as we assume in our theoretical framework. Last but not least, we demonstrate that the superior goodness-of-fit of the alterna-tive models is robust to several changes in the set of regressors. On such basis, it is hard to imagine an alternative set of observable and “true” life-satisfaction determinants that we did not consider which could justify the observation-ally equivalent interpretation of our result which we mention above.
Conclusion
The standard life-satisfaction question used in surveys is likely to suffer from serious problems of abstraction, complexity of calculus, and cultural bias. Abstraction depends on the fact that its 0–10 scale prevents intuitive correspon-dence with verbal modalities. Complexity of calculus originates from the problem that the overall life-satisfaction evaluation is implicitly derived from a weighted sum of sub-compo-nents affecting it (i.e. money satisfaction, sense of life, outlook at the past, perspectives on the future, vitality, etc.). Cultural bias depends on
the fact that different linguistic nuances in the meaning of the term may enhance differences in answers across individuals from different countries which do not depend on true differ-ences in life satisfaction.
The point we raise in our paper is that the richness of direct and simpler information on the life-satisfaction sub-questions (answers on 1–4 scale on each item with correspondence between an adjective and each numerical value) may significantly reduce these three problems, thereby improving goodness-of-fit and reducing the noise component of country dummies. We articulate our alternative strategy under three different approaches (estimation of the latent life satisfaction regressing the standard life satisfaction variable on the above-mentioned sub-components, simple unweighted average of the subcomponents, extraction of the first principal component among the subcomponents with principal component analysis).
Our findings do not reject the above-mentioned hypotheses. The goodness-of-fit is greatly en-hanced under all of the three alternative ap-proaches. The well known Danish cultural bias, which we find also in our data consistently with similar findings in the vignette literature, is corrected in the desired direction by all of our three approaches.
What our results suggest is that the use of a small set of less-abstract and comprehensive life satisfaction sub-questions increases the share of subjective well-being accounted for by observ-able life events. Since this improvement can be obtained by merely adding one demand to standard surveys (hence a reasonable cost more than compensated by the documented benefits), our straightforward political advice is that new life-satisfaction surveys should all contain such sub-questions. The suggestion we make is very close to what is currently done to calculate a (mental) health index (the General Health Questionnaire score), which has been used as an

14
alternative to self-declared life-satisfaction as a proxy for subjective well-being.32 The index is the unweighted average of 12 mental distress ques-tions and therefore closely follows one of our alternative approaches.
An important element which should be taken into account is that our findings are obtained on a database (SHARE) which includes only indi-viduals aged 50 and above. Future research
should verify whether our findings are equally valid when younger age cohorts are included. This will, however, not be possible until the additional question on life-satisfaction sub-com-ponents is added. We also suggest additional reflection on whether the range of questions applied to the 50+ sample are also applicable to the younger cohorts, or whether a different set of questions should be considered.
Table 1: Variable Legend
VARIABLE DESCRIPTION
Female Dummy var. =1 if respondent is female; =0 otherwise.
Log income Log of household total gross income. Its value is equal to the sum over all household members of the individual-level values of: annual net income from employment and self-employment (in the previous year); Annual public old age/early or pre-retirement/disability pension (or sickness benefits); Annual public unemployment benefit or insurance, public survivor pension from partner; Annual war pension, private (occupational) old age/early retirement/disability pension, private(occupational) survivor pension from partner’s job, public old age supplementary pension/public old age/public disability second pension, secondary public survivor pension from spouse or partner, occupational old age pension from a second and third job; Annual public and private long-term insurance payments; Annual life insurance payment, private annuity or private personal pension, private health insurance payment, alimony, payments from charities received; Income from rent. Values of the following household level variables are added: Annual other hhd members’ net income; Annual other hhd members’ net income from other sources; Household bank accounts, government and corporate bonds, stocks/shares; mutual funds (imputed as in Christelis, 2011).
Education years Years the respondent has been in full time education.
Household size Household size.
Age class Respondent’s age class: = 1 if respondent’s age < 55; = 2 if resp.’s age = [55,59]; = 3 if resp.’s age = [60,64]; = 4 if resp.’s age = [64,69]; = 5 if resp.’s age = [69,74]; = 6 if resp.’s age = [74,79]; = 7 if age > 79.
Leaving inheritance Respondent’s answer to the question: including property and other valuables, what are the chances that you or your husband/wife/partner will leave an inheritance totaling 50,000 euro or more? The possible answers range from 0 to 100.
Married Dummy =1 if the respondent lives with spouse.
Registered partnership
Dummy =1 if the respondent lives with a partner.
Widowed Dummy =1 if the spouse is died.
Divorced Dummy =1 if respondent is divorced.
Separated Dummy =1 if the respondent lives separated from spouse.
Single Dummy =1 if the respondent lives as a single.
N.of children Respondent’s number of children (imputed as in Christelis, 2011).
N.of grandchildren Respondent’s number of grandchildren (imputed as in Christelis,2011).
Hrooms Number of rooms in the main residence (imputed as in Christelis, 2011).
Big city Dummy =1 if the respondent lives in a big city (imputed as in Christelis, 2011).
Suburbs Dummy =1 if the respondent lives in suburbs/outskirts of a big city (imputed as in Christelis, 2011).
Large town Dummy var.=1 if the respondent lives in a large town (imputed as in Christelis, 2011).
Small town Dummy =1 if the respondent lives in a small town (imputed as in Christelis, 2011).
Rural area Dummy =1 if the respondent lives in a rural area or village (imputed as in Christelis,2011).

W O R L D H A P P I N E S S R E P O R T 2 0 1 6 | S P E C I A L R O M E E D I T I O N
15
Long-term illness Dummy =1 if the respondent declares any long-term health problems, illness, disability or infirmity.
Survey question: some people suffer from chronic or long-term health problems. By long-term we mean it has troubled you over a period of time or is likely to affect you over a period of time.
Do you have any long-term health problems, illness, disability or infirmity?
No limited activities Dummy =1 if the respondent has not been limited because of a health problem in activities people usually do. Survey question: for the past six months at least,to what extent have you been limited because of a health problem in activities people usually do?
Numb illnesses It is the sum of illnesses the respondent is currently being treated for or bothered (A heart attack including myocardial infarction or coronary thrombosis or any other heart problem including conges-tive heart failure; high blood pressure or hypertension; high blood cholesterol; a stroke or cerebral vascular disease diabetes or high blood sugar; chronic lung disease such as chronic bronchitis or emphysema; asthma; arthritis, including osteoarthritis, or rheumatism; osteoporosis; cancer or malignant tumor, including leukaemia or lymphoma, but excluding minor skin cancer; stomach or duodenal ulcer, peptic ulcer; Parkinson disease; cataracts; hip fracture or femoral fracture; Alzheimer disease, dementia, organic brain syndrome, senility or any other serious memory impairment; benign tumor).
Life satisfaction Respondent degree of life satisfaction. Survey question: On a scale from 0 to 10 where 0 means completely dissatisfied and 10 means completely satisfied, how satisfied are you with your life?
Age no prevent Respondent degree of statements that have used to describe their lives or how they feel. Survey question: How often do you think your age prevents from doing the things you would like to do? For each item answers are given on a 1-4 scale where an adjective (often, sometimes, rarely, never) is matched to any value.
No out control Respondent degree of statements that have used to describe their lives or how they feel. Survey question: How often do you feel that what happens to you is out of control? For each item answers are given on a 1-4 scale where an adjective (often, sometimes, rarely, never) is matched to any value.
No feel left out Respondent degree of statements that have used to describe their lives or how they feel. Survey question: How often do you feel left out of things? For each item answers are given on a 1-4 scale where an adjective (often, sometimes, rarely, never) is matched to any value.
Fred. choice Respondent degree of statements that have used to describe their lives or how they feel. Survey question: How often do you feel that you can do the things that you want to do? For each item answers are given on a 1-4 scale where an adjective (often, sometimes, rarely, never) is matched to any value.
No fam.responsibility Respondent degree of statements that have used to describe their lives or how they feel. Survey question: How often do you feel that family responsibilities prevent you from doing what you want to do?. For each item answers are given on a 1-4 scale where an adjective (often, sometimes, rarely, never) is matched to any value.
No lack money Respondent degree of statements that have used to describe their lives or how they feel. Survey question: How often do you feel that shortage of money stops you from doing the things that you want to do?. For each item answers are given on a 1-4 scale where an adjective (often, sometimes, rarely, never) is matched to any value.
Life meaningful Respondent degree of statements that have used to describe their lives or how they feel. Survey question: How often do you feel that your life has meaning? For each item answers are given on a 1-4 scale where an adjective (often, sometimes, rarely, never) is matched to any value.
Past good Respondent degree of statements that have used to describe their lives or how they feel. Survey question: How often on balance, do you look back to your life with a sense of happiness? For each item answers are given on a 1-4 scale where an adjective (often, sometimes, rarely, never) is matched to any value.
Vitality Respondent degree of statements that have used to describe their lives or how they feel. Survey question: How often do you feel full of energies these days? For each item answers are given on a 1-4 scale where an adjective (often, sometimes, rarely, never) is matched to any value.
Opportunities Respondent degree of statements that have used to describe their lives or how they feel. Survey question: How often do you fell that life is full of opportunities? For each item answers are given on a 1-4 scale where an adjective (often, sometimes, rarely, never) is matched to any value.
Voluntary Dummy =1 if respondent has done voluntary or charity work in the last month.
Table 1: Variable Legend (continued)

Religion attendance Dummy =1 if respondent has taken part in activities of a religious organization (church, synagogue, mosque etc.) in the last month.
Political participation Dummy =1 if the respondent has taken part in a political or community-related organization in the last month.
Help to family Dummy =1 if the respondent has provided help to family,friends or neighbors in the last month.
Cared for sick Dummy =1 if the respondent has cared for a sick or disabled adult in the last month.
Attended education Dummy =1 if the respondent has attended an educational or training course in the last month.
Sport social Dummy =1 if the respondent has gone to a sport, social or other kind of club in the last month.
Figure 1. Distribution of Self Reported Life Satisfaction
16
Table 1: Variable Legend (continued)
De
nsi
ty
1.5
0 2 4 6 8 10
1
.5
lifesat

W O R L D H A P P I N E S S R E P O R T 2 0 1 6 | S P E C I A L R O M E E D I T I O N
17
Imputation n.1
VARIABLE Mean Max Min S.dev. N.
Life satisfaction 7.54 10.00 0.00 1.78 32412
Female 0.49 1.00 0.00 0.50 33280
Married 0.71 1.00 0.00 0.45 33254
Log income 10.60 15.32 3.00 1.42 32957
Education years 10.50 25.00 0.00 4.28 32712
Household size 2.25 14.00 1.00 1.08 33280
Age class 3.64 7.00 1.00 1.91 33271
Leaving inheritance 0.58 1.00 0.00 0.43 31428
Married 0.71 1.00 0.00 0.45 33254
Widowed 0.15 1.00 0.00 0.35 33254
Divorced 0.07 1.00 0.00 0.25 33254
Separated 0.01 1.00 0.00 0.11 33280
Registered partner 0.01 1.00 0.00 0.12 33254
Sociability 0.10 0.88 0.00 0.13 32517
Voluntary 0.12 1.00 0.00 0.33 32517
Religion attendance 0.11 1.00 0.00 0.31 32517
Political participation 0.04 1.00 0.00 0.20 32517
Help to family 0.17 1.00 0.00 0.38 32517
Cared for sick 0.07 1.00 0.00 0.26 32517
Attended education 0.07 1.00 0.00 0.26 32517
Sport social 0.20 1.00 0.00 0.40 32517
Age no prevent 2.63 4.00 1.00 1.03 32504
No out control 2.84 4.00 1.00 0.96 32339
No feelleftout 3.05 4.00 1.00 0.96 32400
Fred choice 3.23 4.00 1.00 0.89 32458
No fam. Resp. prevent 3.03 4.00 1.00 0.97 32458
No lack money 2.56 4.00 1.00 1.10 32467
Life meaningful 3.55 4.00 1.00 0.72 32265
Past good 3.38 4.00 1.00 0.76 32172
Vitality 3.15 4.00 1.00 0.86 32486
Opportunities 3.09 4.00 1.00 0.87 32290
Future good 3.07 4.00 1.00 0.88 32077
Long-term illness 0.48 1.00 0.00 0.50 33166
Limitedactivities 0.43 1.00 0.00 0.50 33166
Numbillnesses 1.41 13.00 0.00 1.44 33280
Table 2: Descriptive Statistics

18
Table 3: The Determinants of Life Satisfaction Under Standard and Alternative Dependent Variables
VARIABLES Self reported latent life satisfaction
Predicted life satisfaction
Life satisfaction average 11 subcomponents
Principal component: 11 subcomponents
Female 0.022 -0.033 -0.016 -0.066
(0.021) (0.027) (0.013) (0.049)
Log income 0.113*** 0.086*** 0.037*** 0.131***
(0.022) (0.013) (0.006) (0.022)
Education years 0.024*** 0.027*** 0.012*** 0.048***
(0.008) (0.006) (0.003) (0.011)
Household size -0.037** -0.025*** -0.016*** -0.034**
(0.014) (0.007) (0.004) (0.013)
Age class 55-59 0.058** 0.079*** 0.033*** 0.100***
(0.022) (0.015) (0.008) (0.028)
Age class 60-64 0.092* 0.118*** 0.048** 0.149**
(0.047) (0.033) (0.017) (0.065)
Age class 65-69 0.150*** 0.118*** 0.053** 0.124*
(0.045) (0.036) (0.018) (0.069)
Age class 70-74 0.191** 0.095* 0.034 0.028
(0.068) (0.050) (0.025) (0.092)
Age class 75-79 0.204*** 0.052 0.010 -0.110
(0.063) (0.048) (0.025) (0.086)
Age class above 79 0.211** -0.058 -0.056* -0.417***
(0.073) (0.057) (0.028) (0.101)
Leaving inheritance 0.317*** 0.262*** 0.119*** 0.431***
(0.045) (0.025) (0.011) (0.042)
Married 0.479*** 0.185*** 0.067*** 0.309***
(0.079) (0.034) (0.016) (0.060)
Widowed 0.079 0.034 0.016 0.049
(0.065) (0.040) (0.019) (0.072)
Divorced -0.010 -0.060 -0.025 -0.048
(0.082) (0.058) (0.026) (0.100)
Separated -0.104 -0.029 -0.017 -0.011
(0.099) (0.071) (0.033) (0.121)
Registered partner 0.533*** 0.201*** 0.078*** 0.354***
(0.080) (0.042) (0.019) (0.071)
N. of children 0.014 -0.011 -0.008** -0.010
(0.009) (0.007) (0.004) (0.013)
N.of grandchildren 0.011** 0.006** 0.003** 0.008*
(0.005) (0.002) (0.001) (0.004)

W O R L D H A P P I N E S S R E P O R T 2 0 1 6 | S P E C I A L R O M E E D I T I O N
19
Hrooms 0.020 0.026** 0.009** 0.037**
(0.012) (0.008) (0.004) (0.014)
Big city 0.105** 0.041 0.016 0.080
(0.047) (0.031) (0.016) (0.058)
Suburbs 0.021 0.055** 0.024* 0.100**
(0.066) (0.023) (0.011) (0.041)
Large town 0.121** 0.084** 0.041** 0.147**
(0.055) (0.035) (0.016) (0.063)
Town 0.123* 0.106* 0.053* 0.185**
(0.058) (0.049) (0.024) (0.085)
Long-term illness -0.206*** -0.142*** -0.068*** -0.267***
(0.029) (0.020) (0.010) (0.036)
Limited activities -0.543*** -0.434*** -0.232*** -0.882***
(0.048) (0.036) (0.018) (0.068)
Numb. Illnesses -0.133*** -0.100*** -0.051*** -0.196***
(0.010) (0.009) (0.005) (0.016)
Voluntary 0.103*** 0.103*** 0.057*** 0.212***
(0.029) (0.020) (0.008) (0.032)
Religion attendance 0.157** 0.110*** 0.044** 0.182**
(0.053) (0.034) (0.019) (0.062)
Political participation 0.152*** 0.087** 0.040** 0.173**
(0.044) (0.036) (0.015) (0.062)
Help to family 0.103*** 0.087*** 0.037*** 0.197***
(0.029) (0.016) (0.009) (0.032)
Cared for sick -0.053* -0.039* -0.043*** -0.059
(0.028) (0.020) (0.010) (0.039)
Attended education 0.023 0.027 -0.001 0.057
(0.038) (0.025) (0.013) (0.045)
Sport social 0.115*** 0.122*** 0.061*** 0.251***
(0.030) (0.024) (0.012) (0.043)
Austria 0.490*** 0.291*** 0.116*** 0.388***
(0.033) (0.027) (0.012) (0.047)
Belgium 0.226*** 0.042*** -0.008** -0.040***
(0.011) (0.007) (0.003) (0.013)
Czech Rep. -0.346*** -0.443*** -0.226*** -0.796***
(0.035) (0.033) (0.015) (0.055)
Switzerland 0.846*** 0.419*** 0.173*** 0.678***
(0.028) (0.015) (0.007) (0.024)
Table 3: The Determinants of Life Satisfaction Under Standard and Alternative Dependent Variables (continued)

20
Spain 0.245*** -0.010 -0.024 -0.093
(0.041) (0.032) (0.015) (0.057)
Germany 0.340*** 0.236*** 0.104*** 0.310***
(0.016) (0.007) (0.003) (0.012)
Greece -0.216*** -0.386*** -0.253*** -0.787***
(0.037) (0.027) (0.013) (0.046)
Denmark 0.798*** 0.321*** 0.135*** 0.454***
(0.046) (0.028) (0.013) (0.048)
Italy 0.059 -0.209*** -0.161*** -0.511***
(0.035) (0.030) (0.015) (0.054)
Netherlands 0.553*** 0.582*** 0.251*** 0.876***
(0.012) (0.006) (0.003) (0.010)
Poland -0.316*** -0.078** -0.053*** -0.135**
(0.053) (0.032) (0.015) (0.058)
Sweden 0.590*** 0.064* 0.016 0.049
(0.059) (0.036) (0.016) (0.060)
Constant 5.54*** 6.22*** 2.57*** -1.84***
(0.26) (0.17) (0.07) (0.29)
Observations 30325.000 29414.000 30427.00 29414.000
R-squared 0.217 0.342 0.342 0.353
Log-Likelihood -56400.000 -38312.000 -17895.00 -55924.000
AIC 112824.600 76647.540 35813.610 111871.800
BIC 112924.400 76747.010 35913.490 111971.300
Robust standard errors in parentheses *** p<0.01, ** p<0.05, *p<0.1Reference Categories: Age class: 50-54; Marital Status: Single; Urban area: Rural; Country: France.
Table 3: The Determinants of Life Satisfaction Under Standard and Alternative Dependent Variables (continued)
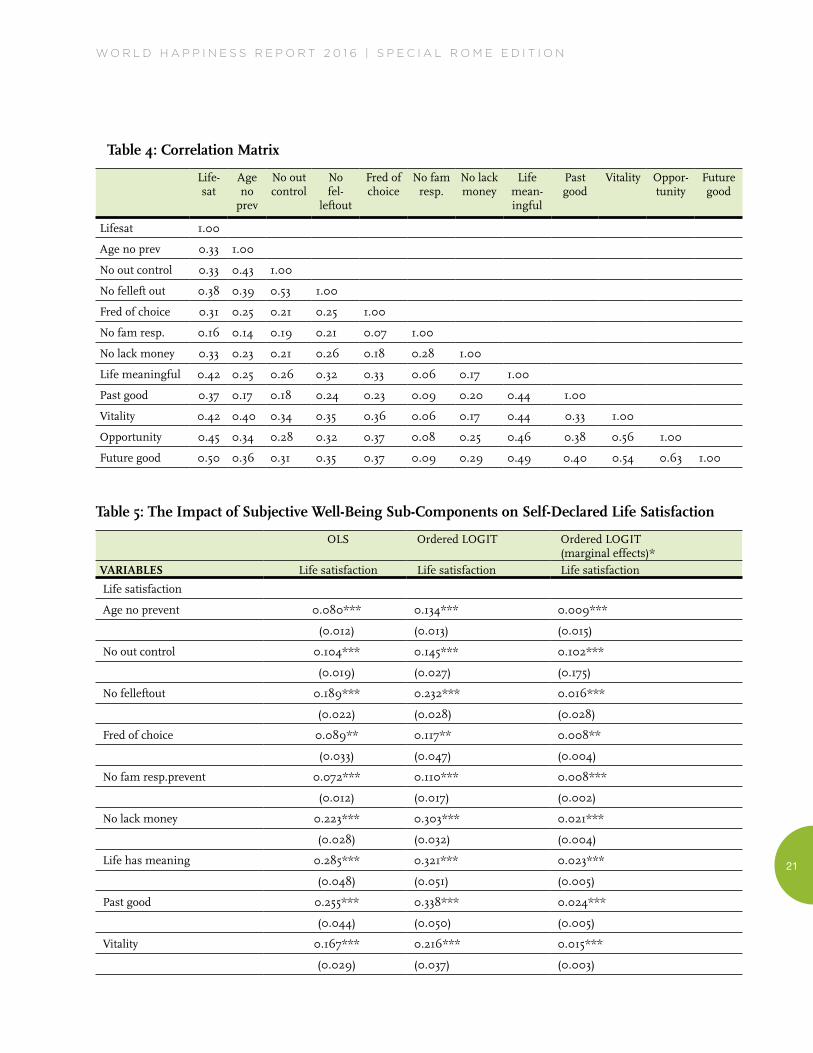
W O R L D H A P P I N E S S R E P O R T 2 0 1 6 | S P E C I A L R O M E E D I T I O N
21
Table 4: Correlation Matrix
Life-sat
Age no
prev
No out control
No fel-
leftout
Fred of choice
No fam resp.
No lack money
Life mean-ingful
Past good
Vitality Oppor-tunity
Future good
Lifesat 1.00
Age no prev 0.33 1.00
No out control 0.33 0.43 1.00
No felleft out 0.38 0.39 0.53 1.00
Fred of choice 0.31 0.25 0.21 0.25 1.00
No fam resp. 0.16 0.14 0.19 0.21 0.07 1.00
No lack money 0.33 0.23 0.21 0.26 0.18 0.28 1.00
Life meaningful 0.42 0.25 0.26 0.32 0.33 0.06 0.17 1.00
Past good 0.37 0.17 0.18 0.24 0.23 0.09 0.20 0.44 1.00
Vitality 0.42 0.40 0.34 0.35 0.36 0.06 0.17 0.44 0.33 1.00
Opportunity 0.45 0.34 0.28 0.32 0.37 0.08 0.25 0.46 0.38 0.56 1.00
Future good 0.50 0.36 0.31 0.35 0.37 0.09 0.29 0.49 0.40 0.54 0.63 1.00
Table 5: The Impact of Subjective Well-Being Sub-Components on Self-Declared Life Satisfaction
OLS Ordered LOGIT Ordered LOGIT (marginal effects)*
VARIABLES Life satisfaction Life satisfaction Life satisfaction
Life satisfaction
Age no prevent 0.080*** 0.134*** 0.009***
(0.012) (0.013) (0.015)
No out control 0.104*** 0.145*** 0.102***
(0.019) (0.027) (0.175)
No felleftout 0.189*** 0.232*** 0.016***
(0.022) (0.028) (0.028)
Fred of choice 0.089** 0.117** 0.008**
(0.033) (0.047) (0.004)
No fam resp.prevent 0.072*** 0.110*** 0.008***
(0.012) (0.017) (0.002)
No lack money 0.223*** 0.303*** 0.021***
(0.028) (0.032) (0.004)
Life has meaning 0.285*** 0.321*** 0.023***
(0.048) (0.051) (0.005)
Past good 0.255*** 0.338*** 0.024***
(0.044) (0.050) (0.005)
Vitality 0.167*** 0.216*** 0.015***
(0.029) (0.037) (0.003)

22
Opportunity 0.157*** 0.210*** 0.015***
(0.026) (0.034) (0.003)
Future good 0.367*** 0.472*** 0.033***
(0.030) (0.031) (0.006)
Constant 1.38*** - -
(0.37) - -
Observations 31185.000 31185.000 31185.000
R-squared 0.388 - -
Pseudo R-squared - 0.127 -
Log-Likelihood -54388.000 -50699.000 -
AIC 108799.700 101421.400 101421.400
BIC 108899.900 101521.500 101521.500
Robust standard errors in parentheses *** p<0.01, ** p<0.05, * p<0.1 Reference Categories: Age class: 50-54; Marital Status: Single; Urban area: Rural; Country: France.
Table 6: Principal Component Analysis (PCA)
Component Eigenvalue Difference Proportion Cumulative
Comp1 4.10 2.78 0.37 0.37
Comp2 1.32 0.31 0.12 0.49
Comp3 1.01 0.22 0.09 0.59
Comp4 0.80 0.08 0.07 0.66
Comp5 0.72 0.04 0.07 0.72
Comp6 0.68 0.09 0.06 0.78
Comp7 0.58 0.06 0.05 0.84
Comp8 0.52 0.06 0.05 0.88
Comp9 0.46 0.02 0.04 0.93
Comp10 0.44 0.08 0.04 0.97
Comp11 0.37 - 0.03 1.00
Table 5: The Impact of Subjective Well-Being Sub-Components on Self-Declared Life Satisfaction (continued)

W O R L D H A P P I N E S S R E P O R T 2 0 1 6 | S P E C I A L R O M E E D I T I O N
23
Table 7: Correlations with the First Five Principal Components
Variable Comp1 Comp2 Comp3 Comp4 Comp5
Age no prevent 0.30 0.23 -0.36 0.19 -0.27
No out control 0.29 0.38 -0.39 -0.23 0.08
No feel left out 0.31 0.33 -0.25 -0.26 0.14
Fred. choice 0.27 -0.15 0.00 0.57 0.68
No fam. resp. 0.12 0.55 0.48 -0.05 0.36
No lack money 0.22 0.34 0.50 0.31 -0.44
Life has meaning 0.33 -0.27 0.11 -0.31 0.18
Past good 0.28 -0.23 0.36 -0.53 0.03
Vitality 0.36 -0.18 -0.16 0.11 -0.10
Opportunity 0.37 -0.24 0.07 0.13 -0.19
Future good 0.38 -0.20 0.08 0.09 -0.20
Table 8: The Determinants of Differences in Evaluating Vignettes
OLS OLOGIT
Variables Average-vignettes Vignette 1 Vignette 2
Female 0.017 0.026 0.046
(0.016) (0.047) (0.047)
Log income -0.028*** -0.076*** -0.051*
(0.009) (0.029) (0.028)
Education years -0.002 -0.015** 0.009
(0.002) (0.007) (0.007)
Household size -0.003 -0.011 0.001
(0.009) (0.027) (0.028)
Age class 55-59 -0.072*** -0.068 -0.243***
(0.025) (0.076) (0.077)
Age class 60-64 -0.044* -0.010 -0.183**
(0.026) (0.078) (0.080)
Age class 65-69 -0.121*** -0.232*** -0.312***
(0.029) (0.086) (0.088)
Age class 70-74 -0.155*** -0.241** -0.423***
(0.032) (0.095) (0.097)
Age class 75-79 -0.154*** -0.244** -0.441***
(0.036) (0.108) (0.110)
Age class above 79 -0.124*** -0.163 -0.389***
(0.036) (0.109) (0.110)

24
Leaving inheritance 0.016 0.047 0.048
(0.019) (0.056) (0.057)
Married -0.067* -0.235* -0.140
(0.040) (0.121) (0.123)
Widowed -0.089** -0.235* -0.223
(0.045) (0.135) (0.137)
Divorced -0.107** -0.397*** -0.111
(0.047) (0.143) (0.147)
Separated -0.075 -0.212 -0.168
(0.084) (0.258) (0.260)
Registered partner -0.041 -0.210 -0.010
(0.074) (0.225) (0.225)
N. of children 0.012 0.044* 0.011
(0.008) (0.023) (0.024)
N. of grandchildren -0.005 -0.000 -0.020*
(0.004) (0.011) (0.011)
Hrooms 0.003 0.016 -0.006
(0.006) (0.016) (0.017)
Big city -0.019 -0.077 -0.025
(0.026) (0.079) (0.078)
Suburbs -0.000 -0.117 0.120
(0.024) (0.073) (0.073)
Large town 0.006 0.018 0.030
(0.023) (0.068) (0.070)
Small town 0.041* 0.021 0.165**
(0.022) (0.065) (0.065)
Long-term illness -0.068*** -0.212*** -0.089
(0.019) (0.057) (0.057)
Limited activities 0.039** 0.111* 0.058
(0.019) (0.057) (0.058)
Numb illnesses -0.012** -0.014 -0.041**
(0.006) (0.019) (0.019)
Voluntary -0.010 -0.061 -0.018
(0.024) (0.071) (0.072)
Religion attendance 0.017 0.094 0.009
(0.025) (0.076) (0.076)
Political participation -0.018 -0.039 0.019
(0.037) (0.111) (0.114)
Table 8: The Determinants of Differences in Evaluating Vignettes (continued)

W O R L D H A P P I N E S S R E P O R T 2 0 1 6 | S P E C I A L R O M E E D I T I O N
25
Help to family -0.029 -0.109* -0.018
(0.021) (0.061) (0.063)
Cared for sick -0.007 0.023 -0.013
(0.029) (0.085) (0.087)
Attended education 0.057* 0.065 0.166*
(0.030) (0.089) (0.091)
Sport social -0.010 -0.122** 0.051
(0.019) (0.058) (0.059)
Belgium 0.213*** 0.032 0.920***
(0.041) (0.124) (0.122)
Czech Rep. 0.474*** 1.064*** 1.101***
(0.045) (0.136) (0.134)
Spain 0.075 -0.220 0.512***
(0.049) (0.150) (0.144)
Germany 0.332*** 1.045*** 0.506***
(0.039) (0.119) (0.115)
Greece 0.137*** 0.384*** 0.137
(0.048) (0.147) (0.142)
Denmark 0.627*** 1.402*** 1.540***
(0.045) (0.135) (0.133)
Italy -0.040 -0.431*** 0.260**
(0.044) (0.135) (0.128)
Netherlands 0.135*** 0.528*** 0.221*
(0.045) (0.135) (0.134)
Poland 0.257*** 0.338** 0.794***
(0.046) (0.140) (0.138)
Sweden 0.147*** 0.071 0.556***
(0.051) (0.153) (0.149)
Constant 3.30*** - -
(0.05) - -
Observations 7154.000 7134.000 7131.000
R-squared 0.090 - -
Pseudo R-squared - 0.035 0.027
Log-Likelihood -6747.000 -8406.000 -8438.000
Standard errors in parentheses *** p<0.01, ** p<0.05, * p<0.1 Reference Categories: Age class:50-54; Marital Status:Single; Urban area:Rural; Country:France.
Table 8: The Determinants of Differences in Evaluating Vignettes (continued)

26
VARIABLES Self reported latent life satisfaction
Predicted life satisfaction
Life satisfaction average 11 subcomponents
Principal component: 11 subcomponents
Imputation 2
Observations 30325 29411 30427 29411
R-squared 0.216 0.342 0.342 0.353
AIC 112843 76645.56 35823.81 111860.7
BIC 112942.8 76745.03 35923.69 111960.1
Imputation 3
Observations 30328 29414 30430 29414
R-squared 0.217 0.342 0.341 0.353
AIC 112826.2 76666.37 35836.53 111890.9
BIC 112926 76765.84 35936.41 111990.4
Imputation 4
Observations 30316 29404 30418 29404
R-squared 0.217 0.342 0.342 0.353
AIC 112809.2 76626.13 35807.17 111842.6
BIC 112909.1 76725.6 35907.04 111942.1
Imputation 5
Observations 30330 29416 30432 29416
R-squared 0.216 0.342 0.342 0.353
AIC 112856.5 76644.37 35819.32 111875
BIC 112956.3 76743.84 35919.2 111974.5
Table 10: Robustness Check of Table 3 with the Same Number of Observations (goodness of fit only)
VARIABLES Self reported latent life satisfaction
Predicted life satisfaction
Life satisfaction average 11 subcomponents
Principal component: 11 subcomponents
Imputation 1
Observations 29354 29354 29354 29354
R-squared 0.218 0.341 0.342 0.352
Log-Likelihood -54462 -38221 -17149 -55796
AIC 108947.2 76466.86 34321.46 111616
BIC 109046.7 76566.31 34420.91 111715.4
Table 9: Robustness Check of Table 3 Estimates with the Four Alternative Imputations (goodness of fit only)

W O R L D H A P P I N E S S R E P O R T 2 0 1 6 | S P E C I A L R O M E E D I T I O N
27
Table 11: Benchmark Model Estimated With Extended Predicted Life Satisfaction (11 sub-components interacted with country, gender, age and education dummies)
VARIABLES Happypred VARIABLES Happypred
Female -0.053* Number grandchildren 0.007**
(0.027) (0.003)
Log income 0.083*** Hrooms 0.025**
(0.015) (0.008)
Education years 0.025*** Big city 0.042
(0.006) (0.026)
Household size -0.027*** Suburbs 0.055**
(0.006) (0.019)
Age class 55-59 0.089*** Large town 0.081**
(0.017) (0.035)
Age class 60-64 0.126*** Small town 0.091**
(0.036) (0.041)
Age class 65-69 0.125*** Voluntary 0.102***
(0.038) (0.023)
Age class 70-74 0.097* Religion attendance 0.107***
(0.046) (0.032)
Age class 75-79 0.045 Political participation 0.063*
(0.044) (0.032)
Age class above 79 -0.055 Help to family 0.081***
(0.051) (0.016)
Leaving inheritance 0.250*** Austria 0.502***
(0.032) (0.029)
Married 0.201*** Belgium 0.280***
(0.044) (0.008)
Widowed 0.041 Czech Rep. -0.316***
(0.040) (0.033)
Divorced -0.028 Switzerland 0.881***
(0.055) (0.020)
Separated -0.005 Spain 0.241**
(0.072) (0.039)
Registered partner 0.220*** Germany 0.352***
(0.046) (0.007)
N. of children -0.012 Greece -0.172***
(0.008) (0.029)
Long-term illness -0.140*** Denmark 0.879***
(0.021) (0.037)

28
Limited activities -0.427*** Italy 0.811**
(0.044) (0.033)
Numb. illnesses -0.096*** Netherlands 0.583***
(0.010) (0.006)
Cared for sick -0.036 Poland -0.359***
(0.021) (0.042)
Attended education 0.029 Sweden 0.715***
(0.025) (0.041)
Sport social 0.121***
(0.027)
Constant 6.068***
(0.219)
Observations - 29414.000
R-squared - 0.404
AIC - 76365.050
BIC - 76464.520
Log-Likelihood - -38171.520
Robust standard errors in parentheses *** p<0.01,** p<0.05, * p<0.1 Reference Categories: Age class: 50-54; Marital Status: Single; Urban area: Rural; Country: France.
Table 12: The Determinants of Life Satisfaction Under Standard and Alternative Dependent Vari-ables (base model from table 3 estimated without health variables)
VARIABLES Self reported latent life satisfaction
Predicted life satisfaction
Life satisfaction average 11 subcomponents
Principal component: 11 subcomponents
Female -0.019 -0.064* -0.031** -0.127**
(0.023) (0.030) (0.014) (0.055)
Log income 0.126*** 0.097*** 0.042*** 0.152***
(0.026) (0.016) (0.007) (0.026)
Education years 0.034*** 0.034*** 0.016*** 0.061***
(0.009) (0.008) (0.004) (0.013)
Household size -0.033* -0.021*** -0.014*** -0.027**
(0.015) (0.007) (0.004) (0.011)
Age class 55-59 0.004 0.039* 0.012 0.021
(0.024) (0.018) (0.009) (0.035)
Age class 60-64 -0.005 0.042 0.010 -0.001
(0.049) (0.037) (0.019) (0.073)
Table 11: Benchmark Model Estimated With Extended Predicted Life Satisfaction (11 sub-components interacted with country, gender, age and education dummies) (continued)

W O R L D H A P P I N E S S R E P O R T 2 0 1 6 | S P E C I A L R O M E E D I T I O N
29
Age class 65-69 -0.005 0.001 -0.008 -0.107
(0.057) (0.045) (0.023) (0.089)
Age class 70-74 -0.029 -0.072 -0.053 -0.303**
(0.082) (0.060) (0.031) (0.115)
Age class 75-79 -0.067 -0.154** -0.097*** -0.518***
(0.078) (0.058) (0.031) (0.111)
Age class above 79 -0.111 -0.308*** -0.185*** -0.913***
(0.084) (0.060) (0.032) (0.110)
Leaving inheritance 0.367*** 0.299*** 0.139*** 0.505***
(0.051) (0.029) (0.013) (0.050)
Married 0.451*** 0.162*** 0.055*** 0.262***
(0.079) (0.035) (0.016) (0.059)
Widowed 0.020 -0.013 -0.007 -0.044
(0.064) (0.042) (0.020) (0.076)
Divorced -0.064 -0.099* -0.047* -0.125
(0.078) (0.054) (0.023) (0.092)
Separated -0.123 -0.038 -0.024 -0.028
(0.092) (0.068) (0.032) (0.114)
Registered partner 0.521*** 0.187*** 0.073** 0.325***
(0.089) (0.051) (0.025) (0.088)
N. of children 0.018* -0.008 -0.006 -0.005
(0.009) (0.007) (0.004) (0.013)
N. of grandchildren 0.003 0.000 -0.000 -0.003
(0.004) (0.002) (0.001) (0.005)
Hrooms 0.029** 0.033*** 0.013** 0.051***
(0.013) (0.010) (0.005) (0.017)
Big city 0.150** 0.077** 0.034* 0.152**
(0.050) (0.032) (0.017) (0.059)
Suburbs 0.053 0.078** 0.037** 0.147**
(0.069) (0.027) (0.013) (0.050)
Large town 0.142** 0.100** 0.050** 0.180**
(0.061) (0.041) (0.019) (0.073)
Small town 0.150* 0.126* 0.063** 0.226**
(0.070) (0.059) (0.029) (0.103)
Voluntary 0.131*** 0.123*** 0.068*** 0.251***
(0.031) (0.024) (0.010) (0.039)
Religion attendance 0.147** 0.102** 0.041* 0.166**
(0.055) (0.035) (0.019) (0.065)
Table 12: The Determinants of Life Satisfaction Under Standard and Alternative Dependent Vari-ables (base model from table 3 estimated without health variables) (continued)

30
Political participation 0.147*** 0.083** 0.039** 0.165**
(0.047) (0.038) (0.016) (0.065)
Help to family 0.108*** 0.089*** 0.039*** 0.200***
(0.029) (0.017) (0.009) (0.034)
Cared for sick -0.071* -0.054** -0.050*** -0.089*
(0.034) (0.023) (0.012) (0.043)
Attended education 0.038 0.038 0.006 0.079
(0.034) (0.026) (0.014) (0.048)
Sport social 0.157*** 0.156*** 0.078*** 0.320***
(0.028) (0.023) (0.011) (0.039)
Austria 0.486*** 0.284*** 0.112*** 0.369***
(0.036) (0.029) (0.013) (0.051)
Belgium 0.197*** 0.018* -0.022*** -0.089***
(0.011) (0.008) (0.004) (0.015)
Czech Rep. -0.499*** -0.562*** -0.290*** -1.035***
(0.039) (0.033) (0.015) (0.054)
Switzerland 0.937*** 0.487*** 0.208*** 0.812***
(0.029) (0.016) (0.007) (0.026)
Spain 0.267*** 0.004 -0.015 -0.063
(0.046) (0.036) (0.017) (0.065)
Germany 0.270*** 0.184*** 0.075*** 0.205***
(0.019) (0.011) (0.005) (0.018)
Greece -0.092* -0.293*** -0.205*** -0.605***
(0.042) (0.030) (0.014) (0.052)
Denmark 0.721*** 0.264*** 0.104*** 0.340***
(0.055) (0.032) (0.015) (0.056)
Italy 0.053 -0.215*** -0.164*** -0.524***
(0.037) (0.031) (0.015) (0.055)
Netherlands 0.526*** 0.559*** 0.237*** 0.824***
(0.013) (0.008) (0.005) (0.014)
Poland -0.486*** -0.211*** -0.121*** -0.400***
(0.046) (0.027) (0.013) (0.048)
Sweden 0.536*** 0.021 -0.007 -0.037
(0.068) (0.041) (0.018) (0.070)
Constant 4.910*** 5.746*** 2.325*** -2.782***
(0.284) (0.187) (0.083) (0.318)
Observations 30334.000 29422.000 30436.000 29422.000
R-squared 0.159 0.256 0.245 0.252
Table 12: The Determinants of Life Satisfaction Under Standard and Alternative Dependent Vari-ables (base model from table 3 estimated without health variables) (continued)

W O R L D H A P P I N E S S R E P O R T 2 0 1 6 | S P E C I A L R O M E E D I T I O N
31
AIC 115002.200 80282.000 39996.020 116151.900
BIC 115102.000 80381.480 40095.900 116251.400
Log-Likelihood -57489.000 -40129.000 -19986.000 -58064.000
Robust standard errors in parentheses *** p<0.01,** p<0.05, * p<0.1 Reference Categories: Age class: 50-54; Marital Status: Single; Urban area: Rural; Country: France.
Table 13: The Determinants of Life Satisfaction Under Standard and Alternative Dependent Variables (base model from Table 3 estimated without health and social activity variables)
VARIABLES Self reported latent life satisfaction
Predicted life satisfaction
Life satisfaction average 11 subcomponents
Principal component: 11 subcomponents
Female -0.016 -0.062* -0.031* -0.125**
(0.024) (0.030) (0.014) (0.057)
Log income 0.131*** 0.102*** 0.044*** 0.161***
(0.026) (0.017) (0.007) (0.027)
Education years 0.037*** 0.037*** 0.017*** 0.068***
(0.009) (0.008) (0.004) (0.013)
Household size -0.034** -0.024*** -0.015*** -0.032**
(0.014) (0.007) (0.004) (0.011)
Age class 55-59 0.005 0.036* 0.011 0.014
(0.025) (0.019) (0.010) (0.036)
Age class 60-64 0.003 0.045 0.012 0.003
(0.049) (0.037) (0.019) (0.073)
Age class 65-69 0.007 0.008 -0.004 -0.098
(0.056) (0.043) (0.023) (0.087)
Age class70-74 -0.020 -0.069 -0.050 -0.300**
(0.080) (0.059) (0.030) (0.112)
Age class 75-79 -0.073 -0.162** -0.100*** -0.540***
(0.075) (0.056) (0.030) (0.107)
Age class above 79 -0.143* -0.339*** -0.199*** -0.983***
(0.079) (0.057) (0.030) (0.101)
Leaving inheritance 0.379*** 0.312*** 0.144*** 0.531***
(0.052) (0.031) (0.015) (0.054)
Married 0.443*** 0.163*** 0.055*** 0.267***
(0.079) (0.033) (0.016) (0.059)
Widowed 0.022 -0.008 -0.006 -0.033
(0.069) (0.043) (0.021) (0.079)
Table 12: The Determinants of Life Satisfaction Under Standard and Alternative Dependent Vari-ables (base model from table 3 estimated without health variables) (continued)

32
Divorced -0.073 -0.094 -0.045* -0.113
(0.080) (0.055) (0.024) (0.094)
Separated -0.125 -0.030 -0.022 -0.016
(0.087) (0.069) (0.032) (0.114)
Registered partner 0.512*** 0.184*** 0.072** 0.322***
(0.093) (0.052) (0.026) (0.092)
N. of children 0.018* -0.007 -0.006 -0.004
(0.009) (0.007) (0.004) (0.013)
N. of grandchildren 0.003 0.000 -0.000 -0.002
(0.003) (0.002) (0.001) (0.005)
Hrooms 0.034** 0.038*** 0.015*** 0.062***
(0.013) (0.010) (0.005) (0.017)
Big city 0.145** 0.068** 0.030 0.136**
(0.053) (0.031) (0.017) (0.058)
Suburbs 0.046 0.068** 0.032** 0.132**
(0.071) (0.029) (0.014) (0.055)
Large town 0.138** 0.097** 0.049** 0.175**
(0.063) (0.042) (0.020) (0.074)
Small town 0.151* 0.126* 0.063* 0.225*
(0.073) (0.061) (0.030) (0.107)
Austria 0.479*** 0.281*** 0.109*** 0.363***
(0.034) (0.026) (0.012) (0.046)
Belgium 0.202*** 0.024*** -0.021*** -0.077***
(0.011) (0.007) (0.003) (0.012)
Czech Rep. -0.553*** -0.608*** -0.312*** -1.130***
(0.042) (0.034) (0.016) (0.058)
Switzerland 0.965*** 0.515*** 0.219*** 0.866***
(0.031) (0.017) (0.008) (0.028)
Spain 0.223*** -0.031 -0.032* -0.140**
(0.044) (0.032) (0.015) (0.059)
Germany 0.260*** 0.180*** 0.072*** 0.195***
(0.017) (0.010) (0.005) (0.017)
Greece -0.105** -0.310*** -0.214*** -0.647***
(0.041) (0.027) (0.012) (0.045)
Denmark 0.746*** 0.286*** 0.114*** 0.385***
(0.057) (0.034) (0.015) (0.059)
Italy 0.010 -0.251*** -0.181*** -0.599***
(0.035) (0.028) (0.013) (0.050)
Table 13: The Determinants of Life Satisfaction Under Standard and Alternative Dependent Variables (base model from Table 3 estimated without health and social activity variables) (continued)

W O R L D H A P P I N E S S R E P O R T 2 0 1 6 | S P E C I A L R O M E E D I T I O N
33
Netherlands 0.563*** 0.593*** 0.252*** 0.894***
(0.011) (0.008) (0.004) (0.013)
Poland -0.545*** -0.256*** -0.142*** -0.494***
(0.044) (0.021) (0.010) (0.038)
Sweden 0.569*** 0.051 0.005 0.025
(0.064) (0.040) (0.018) (0.068)
Constant 4.898*** 5.725*** 2.317*** -2.824***
(0.288) (0.197) (0.086) (0.339)
Observations 30519.000 29593.000 30624.000 29593.000
R-squared 0.154 0.247 0.236 0.242
AIC 116016.800 81147.490 40658.840 117308.600
BIC 116116.800 81247.030 40758.790 117408.100
Log-Likelihood -57996.000 -40561.740 -20317.000 -58642.000
Robust standard errors in parentheses *** p<0.01,** p<0.05, * p<0.1Reference Categories: Age class: 50-54; Marital Status: Single; Urban area: Rural; Country: France.
Table 13: The Determinants of Life Satisfaction Under Standard and Alternative Dependent Variables (base model from Table 3 estimated without health and social activity variables) (continued)

34
1. Frey and Stutzer (2002a, 2002b).
2. The main contributions in this field are those valuing air pollution (Welsch, 2002), terrorist activity (Frey et al., 2009), noise nuisance (van Praag & Baarsma, 2005) and flood disasters (Luechinger & Raschky, 2009).
3. King and Wand (2007); Corrado and Weeks (2010).
4. Vignette equivalence requires that the scenarios in the vignettes are perceived with no systematic differences across respondents. Response consistency requires that individuals use the response category in the self-assess-ment question in the same way as when they evaluate hypothetical scenarios in the vignettes.
5. Bago d’Uva et al. (2011); Ferrer-i-Carbonell et al. (2010); Corrado and Weeks (2010).
6. In order to harmonize the response scale of the 11 sub-components with the response scale of the synthetic question on life satisfaction we have re-ordered the response scale of the five sub-components denoting positive dimensions of well-being (questions 4 and 7-11) as follows: never=1, rarely=2, sometimes=3, often=4. For the five sub-components denoting negative dimensions of well-being (questions 1-3 and 5-6) the response scale are left unchanged: 1=often, 2=sometimes, 3=rarely, 4=never.
7. Inglehart and Klingemann (2000); Eurobarometer (2002); Corrado and Weeks (2010); Kapteyn, Smith, & Soest (2007).
8. Corrado and Weeks (2010) examine the use of vignettes to correct for the different use of response scales when rating life satisfaction. They show that these additional questions can, under certain conditions, be used to correct for the resultant biases in model parameters. The bias is found especially for top ranked countries such as Denmark thereby confirming that country rankings reflect not just the true variation in life satisfaction but a different use of the response scales and more optimistic evaluations of life of certain countries and cultures (see also Kapteyn, Smith, and Soest, 2007).
9. See Golderberg and Williams (1988).
10. For simplicity and without lack of generality we assume that the weights are common to each individual. The idea of happiness fundamentals that are common to all individuals in different countries is, in some way, supported by the empirical literature showing that determinants of subjective wellbeing are quite similar across different countries and time periods (Becchetti et al., 2010).
11. In the context of attitudinal surveys where observed responses are often discrete, the disjunction between what is observed and the underlying latent measurement error in the dependent variable is generally understood as
arising from an error in either recording or reporting of a response. Corrado and Weeks (2010) analyse different solution methods to correct for response scale heteroge-neity when responses are discrete.
12. If measurement error affects one or more explanatory variables, this will generate biased and inconsistent parameter estimates, with a general tendency towards attenuation. Kreider (1999) discusses the problem of measurement error for self-reported health and in particular work disability in the context of models of labour force participation. However, the focus here is the impact of likely overreporting of disability on parameter estimates associated with one or more explanatory variables whereas our focus is on measurement error affecting the dependent variable.
13. Life satisfaction is ordinal, so that its panel estimation would require something like a ordered probit or conditional fixed effect logit (as in Clark, 2003). However, as Ferrer–i–Carbonell and Frijters (2004) argue, Cardinal estimation seems to perform just as well as ordinal estimation when life satisfaction is measured on the 0-10 scale (Ferrer–i–Carbonell & Frijters, 2004).
14. See Bound, J., Brown, C., & Mathiowetz, N. (2001).
15. All the above-mentioned methods involve introducing external information. A number of authors have suggested instrumental variable estimators that use third or higher moments of the variables as instruments for or (Cragg, 1997; Dagenais & Dagenais, 1997; Lewbel, 1997). Alternatively, Wald (1940) suggested an estimator which involves grouping the data. However, unless some external information can be used to form groups (i.e. an instrument) is available, the resulting estimator will typically be no less biased than OLS (Pakes, 1982).
16. In a non-linear regression model, such as a probit model, the effects of measurement error are more severe. If the dependent variable is binary, measurement error takes the form of misclassification errors; some observations where the variable is truly a 1 will be misclassified as a 0 and vice versa. In this case the measurement error is negatively correlated with the true variable. This can lead to coefficient estimates that are biased and inconsistent.
17. The Akaike Information Criterion (AIC) is defined as and the Bayesian Incformation Criterion (BIC) as where denotes the number of observations, is the number of parameters and denotes the Residual Sum of Squares In presence of measurement error the Residual Sum of Squares will be higher, hence both the and will be higher indicating a poorer fit of the model. The adjusted defined as will be, instead, lower.
18. Last Release 2.5.0: May 24, 2011 available at http://cdata8.uvt.nl/sharedatadissemination/releases/show/ w2_250/All+CAPI+modules/stata.

35
19. See Ferrer-i-Carbonell, A., & Frijters, P. (2004).
20. See also Ferrer-i-Carbonell (2004, 2008) on this point.
21. The dataset used is “ sharew2_rel2-5-0_imputations”.
22. Van Buuren, S., Brand, J.P.L., Groothuis-Oudshoorn, C.G.M., & Rubin, D.B. (2006).
23. A key aspect of the FCS method is that it operates under the missing at random (MAR) assumption where the missing-ness of each variable depends only on other variables in the system and not on the values of the variable itself. In the iteration process, the initial conditions of the first iteration are derived by imputing the first variable in the system based only on the variables that are never missing (age, gender and geographic location), then the variables in the second iteration are calculated based on the first and the non-missing variables, in order to achieve a complete set of values for these initial conditions. In this calculation the fully imputed demographic variables are used as predictors for the economic variables; in the imputation of a specific wave, large part of information that comes from other waves is taken into account. The imputation in SHARE also allows an initial burn-in period in order to decrease the dependence of the chain on the initial values. Five burn-in iterations are used by evaluating the Gelman-Ru-bin criterion from the seventh iteration on. For more details see Christelis (2011).
24. Ireland is excluded from this procedure.
25. The imputed datasets are available from SHARE at http://cdata8.uvt.nl/sharedatadissemination/releases/show/.
26. w2_250/Generated+Variables/Imputations/stata.
27. As it is well known the VIF (variance inflation factor) formula is where is the -squared obtained by regress-ing each independent variable on all other independent variables (Marquardt, 1970). If is low (tends to zero) the VIF test is low (equal to one).
28. Since our sample is made by people aged above 50, this apparently surprising result may capture the ascending part of the U-shaped relationship between age and happiness (see among others Clark et al., 1996 and Frijters and Beatton, 2008).
29. See Kaiser, H., & Rice J. (1974).
30. The first vignette is “John is 63 years old. His wife died 2 years ago and he still spends a lot of time thinking of her. He has 4 children and 14 grandchildren who visit him regularly. John can make ends meet but cannot make for extra such as expensive gifts for his grandchildren. He has had to stop working recently due to heart problems. He gets tired easily. Otherwise he has not serious health conditions.” The second vignette is “ Carry is 72 years old and a widow. Her total after tax income is about 1,100 per month. She owns the house she lives in and has a large circle of friends. She plays bridge twice a week and goes on vacation regularly with some friends. Lately she has been suffering from arthritis, which makes working in the house and garden painful.”
31. See Inglehart and Klingemann (2000); Eurobarometer (2002); Corrado and Weeks (2010) Kapteyn, Smith, & Soest (2007).
32. See Christelis, D. (2011).
33. See Goldberg, D., & Williams, P. (1988).
W O R L D H A P P I N E S S R E P O R T 2 0 1 6 | S P E C I A L R O M E E D I T I O N

36
References
Bago D’Uva, T., Lindeboom, M., O’Donnell, O., & Van Doorslaer, E. (2011): Slipping anchor? Testing the vignettes approach to identification and correction of reporting heterogeneity, Journal of Human Resources, 46(4).
Leonardo, B., Riccardo, M., & Naticchioni, P. (2014). The drivers of happiness inequality: suggestions for promoting social cohesion. Oxford Economic Papers, 66(2), 419–42.
Bound, J., Brown, C., & Mathiowetz, N. (2001). Measurement error in survey data. In Heckman, J. & Leamer, E. (Eds.). Handbook of Econometrics, 5.
Clark, A. E., Oswald, A.J., & P.B. Warr (1996). Is job satisfac-tion u-shaped in age?, Journal of Occupational and Organiza-tional Psychology, 69, pp. 57 –81.
Corrado, L., & Weeks, M. (2010). Identification strategies in survey response using vignettes (Working Paper in Economics No. 1031). Cambridge: Faculty of Economics, University of Cambridge.
Christelis, D., (2011). Imputation of missing data in waves 1 and 2 of SHARE (Working Paper Series 01, 2011). Survey of Health, Aging, and Retirement in Europe.
Cragg, J. G., (1997). Using higher moments to estimate the simple errors-in-variables model. RAND Journal of Economics, 28, pp. 571–91.
Dagenais, M. G., & Dagenais, D. L. (1997). Higher moment estimators for linear regression rodels with errors in the variables. Journal of Econometrics, 76, pp. 193 –221.
Eurobarometer. (2002). Public opinion in the European Union. Retrieved from http://europa.eu.int/comm/publi-copinion=archives=eb=eb57=eb57en:pdf.
Frey, B. S., & Stutzer, A. (2000). Happiness, economy and institutions. The Economic Journal, 110, pp. 918–938.
Frey, B., & Stutzer, A. (2002a). What can economists learn from happiness research. Journal of Economic Literature, 40, pp. 402 –435.
Frey, B., & Stutzer, A. (2002b). Happiness and economics. How the economy and institutions affect well-being. Princeton, NJ: Princeton University Press.
Frey, B. S., Luechinger, S., & Stutzer, A. (2009). The life satisfaction approach to the value of public goods: The case of terrorism. Public Choice, 138, pp.317–345.
Ferrer-i-Carbonell, A., & Frijters, P. (2004). How important is methodology for the estimates of the determinants of happiness? The Economic Journal, 114, pp. 641–659.
Ferrer-i-Carbonell, A., Van Praag, B. M. S., & Theodossiou, I. (2011). Vignette equivalence and response consistency: The case of job satisfaction (IZA Discussion Paper No. 6174).
Frijters, P., & Beatton, T. (2008). The mystery of the u-shaped relationship between happiness and age (NCER Working Paper Series 26). National Centre for Econometric Research.
Goldberg, D., & Williams, P. (1988). A user’s guide to the general health questionnaire. Windsor, UK: NFER-Nelson.
Hu, Y. J., Stewart-Brown, S., Twig, L., & Weich, S. (2007). Can the 12-item general health questionnaire be used to measure positive mental health? Psychological Medicine, 37(7), pp. 1005–1013.
Inglehart, R. F., & Klingemann, H. D. (2000). Subjective Well-Being Across Cultures. In Genes, Culture, Democracy and Happiness, pp. 165–184. MIT Press.
Kapteyn, A., J.P. Smith, & Van Soest, A. (2007). Vignettes and self-reports of work disability in the United States and the Netherlands. American Economic Review, 97(1), 461–472.
Kaiser, H., & Rice, J. (1974). Little Jiffy, Mark IV. Journal of Educational and Psychological Measurement, 34, pp. 111–117.
King, G., & Wand, J. (2007). Comparing incomparable survey responses: New tools for anchoring vignettes. Political Analysis, 15, pp. 46–66.
Lewbel, A. (1997). Constructing instruments for regressions with measurement error when no additional data are avail-able, with an application to patents and R&D. Econometrica, 65, pp. 1201–1213.
Luechinger, S., & Raschky, P. (2009). Valuing flood disasters using the life satisfaction approach. Journal of Public Econom-ics, 93(3-4), pp. 620–633.
Marquardt, D. W. (1970). Generalized inverses, ridge regres-sion, biased linear estimation, and nonlinear estimation. Technometrics, 12, pp. 591–612.
Pakes, A. ( 1982). On the asymptotic bias of wald-type estimators of a straight line when both variables are subject to error. International Economic Review, 23, pp. 491–497.
SHARE (2011). Survey of health, ageing and retirement in europe, guide to release 2.5.0 waves 1 and 2. Mannheim Research Institute for the Economics of Aging.
Van Buuren, S., Brand, J.P.L., Groothuis-Oudshoorn, C.G.M., & Rubin, D.B. (2006). Fully conditional specification in multivariate imputation. Journal of Statistical Computation and Simulation, 76(12), pp. 1049–1064.

W O R L D H A P P I N E S S R E P O R T 2 0 1 6 | S P E C I A L R O M E E D I T I O N
37
Van Praag, B.M.S. & Baarsma, B.E. (2005). Using happiness surveys to value intangibles: The case of airport noise. The Economic Journal, 115, pp. 224–246.
Wald, A. (1940). The fitting of straight lines if both variables are subject to error. Annals of Mathematical Statistics. 11, pp. 284–300.
Welsch, H. (2002). Preferences over prosperity and pollution: Environmental valuation based on happiness surveys. Kyklos, 55(4), pp. 473–494.

38
ANTHONY ANNETT
Chapter 2
HUMAN FLOURISHING, THE COMMON GOOD, AND CATHOLIC SOCIAL TEACHING
Anthony M. Annett, Climate Change and Sustainable Development Advisor, Earth Institute, Columbia University; and Religions for Peace.

W O R L D H A P P I N E S S R E P O R T 2 0 1 6 | S P E C I A L R O M E E D I T I O N
39
Something is profoundly wrong with the way we live today. For 30 years we have made a virtue out of the pursuit of material self-interest: Indeed, this pur-suit now constitutes whatever remains of our sense of collective purpose. We know what things cost but have no idea what they are worth. We know longer ask of a judicial ruling or a legislative act: Is it good? Is it fair? Is it just? Is it right? Will it help to bring about a better society or a better world? Those used to be the political questions, even if they invited no easy answers. We must learn once again to pose them.
Tony Judt, Ill Fares the Land1
This chapter’s title betrays its intention. It makes three claims. First, that human beings are by their nature oriented toward eudaimonistic notions of happiness, and this is intimately tied to the common good. Second, that with the post-Enlightenment turn toward the individual, political and economic developments have stripped the common good of all substantive content. Third, that by restoring the centrality of the common good, Catholic social teaching offers a path toward authentic human flourishing in the context of the modern global economy.
Eudaimonia and The Common Good
It is our contention that human beings are inclined to seek a deeper sense of happiness than mere hedonistic notions of pleasure and the absence of pain. This is the eudaimonistic notion of happiness, and it centers on human flourishing, prioritizing living well and actualiz-ing one’s potentials through personal develop-ment. Eudaimonia focuses on living in accord with what is intrinsically worthwhile to human beings—purpose, meaningful relationships, good health, and contribution to the communi-ty.2 Martha Nussbaum defines it as “a kind of living that is active, inclusive of all that has
intrinsic value, and complete, meaning lacking in nothing that would make it richer or better.”3 Alasdair MacIntyre is more succinct: eudaimonia is “the state of being well and doing well in being well.”4
To fully appreciate eudaimonia, we must under-stand its roots in Aristotle’s virtue ethics—cen-tered on his teleological worldview whereby all things have a telos or a purpose. And since human beings are distinguished by their capaci-ty for reason, their purpose is to successfully exercise reason embodied in the virtues, both intellectual and moral. Exercising the virtues in accordance with excellence is a necessary condi-tion for achieving eudaimonia, for a life well lived, which Aristotle conceived of as a lifelong quest.5 Clearly, this cannot be equated with wealth—as Aristotle himself said, “Wealth is obviously not the good that we are seeking, because it serves only as a means; i.e. for getting something else.”6
A teleological view of human nature is inherent-ly dynamic. In the words of moral and political philosopher Alasdair MacIntyre, this teleological view maps out the journey between “man-as-he-happens-to-be” and “man-as-he-could-be-if-he-realized-his-essential-nature.”7 Aristotelian virtue ethics is about transitioning from the former to the latter—to help people become who they are meant to be. This presupposes that we are not born virtuous. The virtues can only be achieved through education or habitual exercise.
Another key aspect of the Aristotelian view of happiness is that the good life is a life of rela-tionships. Human beings seek not only the good life for themselves, but the good life with others. This sense of mutual flourishing is embedded in the notion of the common good, which Jesuit theologian David Hollenbach defines as “the good realized in the mutual relationships in and through which human beings achieve their well-being.”8 Thus the individual and the com-mon good are inseparable, and the whole is

40
greater than the parts. And while the common good is distinguished from the good of the individual, furthering the common good in turn furthers the good of the individual.9
Accordingly, the good life is the telos not only of the individual but of the political community, too.10 And this actually is the highest good—as Aristotle put it, “If all communities aim at some good, the state or political community, which is the highest of all, and which embraces all the rest, aims at good in a greater degree than any other, and at the highest good.”11 This is an expansive vision of a “good society”—the sum-mum bonum—and social institutions are called upon to support and direct themselves toward this good.
In recent times, Alasdair MacIntyre sought to ground the Aristotelian framework more explicit-ly in a teleological view of human psychology.12 To this end, he defines the all-important concept of a practice as “any coherent and complex form of socially established cooperative human activity through which goods internal to that activity are realized.” In MacIntyre’s view, human beings seek to excel in practices, which means subordi-nating themselves to their norms and expecta-tions, and acquiring the virtues that enable them to achieve the goods internal to practices. This approach reflects a basic psychological need in human beings to seek intrinsic rewards within the social context. It is a conception by which the self is situated in particular social worlds, and in which the goods intrinsic to the practice feed into the common good of society.
Is this relational and teleological view of human nature convincing? Some would argue that it is naïve and out of date, having been superseded many times over. Yet in a very real sense, the old is new again, especially in light of the burgeon-ing interest in happiness and well-being, com-bined with an increasing realization that some-thing has gone dramatically wrong with our social and economic interactions.
The empirical evidence from happiness studies offers some support for this view. The World Happiness Report itself shows that differences in happiness across countries can be accounted for by six key variables—income per capita, healthy life expectancy, social support, freedom to make life choices, generosity, and the absence of corruption. This evidence tallies with the Aristo-telian idea that money cannot buy happiness, and that happiness makes little sense outside of our human interactions. While the results are based on subjective well-being—measured as both immediate emotional satisfaction and overall sense of life satisfaction—they nonethe-less point toward broader eudaimonistic notions of happiness in the sense that: (i) human beings are social and relational; (ii) human beings are purposeful and teleological.
Other supportive evidence comes from the psychological literature, affirming the strong pro-social tendencies of human beings, includ-ing through empathy and compassion.13 Empa-thy is the ability to put oneself in another’s shoes, to enter into resonance with the other in a way that dissolves interpersonal differences. Some claim that humans are hardwired to link empathically with others.14 Compassion runs deeper. It involves not only being sensitive to the emotions of others, but actually caring about them, being motivated to help them when they are in need. Compassion does not require empathy, but empathy can spark compassion. Furthermore, while it is possible to reach “empa-thy fatigue,” this is never the case with compas-sion.15 This is closely related to Amartya Sen’s distinction between “sympathy” and “commit-ment.”16 For Sen, “sympathy” plays the role of empathic connection, and the response can actually correspond to self-interest. Not so with commitment, which is less about empathic connection and more about an other-regarding response to rectify a wrong—and which prompts the person to act in a way that leads to lower personal welfare than an alternative option.

W O R L D H A P P I N E S S R E P O R T 2 0 1 6 | S P E C I A L R O M E E D I T I O N
41
One conclusion, therefore, is that human beings have strong tendencies toward altruism—even toward strangers or in large groups.17 Matthieu Ricard lists two essential components of altru-ism—valuing the other and being concerned about his or her situation.18 This altruistic attitude manifests itself as benevolence toward others and a willingness to take care of them. Altruism does not necessarily require sacrifice, although it frequently rises to heroic dimen-sions. Adam Smith summed up this innate tendency toward altruism well when he wrote that “how selfish soever man may be supposed, there are evidently some principles in his na-ture, which interest him in the fortune of others, and render their happiness necessary to him, though he derives nothing from it except the pleasure of seeing it.”19
There is copious evidence for the deeply rela-tional nature of human beings.20 Studies tend to confirm that of the determinants of happiness, relatedness is nearly always near the top of the list. Quite simply, social engagement makes people happy. For example, studies have shown that a sense of belonging to community has the same effect on life satisfaction as trebling of household income.21 Some would actually argue that the very idea of happiness makes little sense in an atomistic context. “It takes (at least) two to be happy” as Stefano Zamagni put it.22 Relation-ship is so central to well-being than researchers are paying increased attention to so-called “relational goods,”, long neglected in modern economics.23 These are goods that can only be enjoyed if shared reciprocally, are characterized by gratuitousness, and where the source of the good lies in the relationship itself. And as intrinsically worthwhile, possession of these goods contributes to eudaimonia.
A lot of the evidence that human beings act on pro-social inclinations comes from studies of economic games that typically involve a division of resources.24 These games suggest at least three conclusions. First, people value fairness. Even when there is no possibility of retaliation,
they will share rather than seek maximal gain for themselves.25 Second, when there is a possi-bility of retaliation, people tend to split the pile evenly and reject offers perceived as unfair, even it this entails a personal loss.26 Third, people trust and reward trust—pro-social behavior has a “multiplier effect.”27
These results point to strong social norms surrounding altruism, fairness and reciprocity. People reward trust and kindness, and they punish cheating and callousness. Samuel Bowles and Herbert Gintis argue that human beings are motivated by “strong reciprocity,” which they define as a “propensity to cooperate and share with others similarly disposed, even at a personal cost, and a willingness to punish those who violate cooperative and other social norms, even when punishing is personally costly and cannot be expected to result in net personal gains in the future.”28 This implies that humans desire cooperation for mutual benefit—and this can often mean foregoing the maximum person-al benefit to give something to others, trusting that such a blessing will be returned.29 This is the way social capital is generated and nur-tured.30 Indeed, strong reciprocity has the potential to lead almost universal cooperation, but this depends crucially on the enforcement of social norms.31
The question remains: what explains these other-regarding tendencies? A common answer is evolution. The hypothesis is that elements of altruism proved useful in the early development of the human species, and so natural selection endows us with certain “altruistic genes.” The starting point is the importance of parental nurture, and humans experience a longer child-hood than other animals. One dominant theory is “kin selection”—the idea that a gene survives and reproduces when others who bear that same gene survive and reproduce.32 Others have stressed “reciprocal altruism”—the idea being that the repeated nature of interpersonal interaction gives rise to mechanisms for rewarding cooperation and punishing cheating or free riding.33

42
But others still think “group selection” is a more likely candidate, as the other theories have difficulties explaining the evolution of altruism in large groups.34 This is the idea that human groups exceling at cooperating and upholding moral norms gained an advantage over other groups—as E.O. Wilson puts it, “selfish mem-bers win within groups, but groups of altruists best groups of selfish members.”35 The propo-nents of this view argue that early humanity was characterized by inter-group conflict and faced severe environmental challenges. This predomi-nance of inter-group conflict therefore gives rise to something like strong reciprocity.36 It suggests that ethical behavior is hardwired, and is not merely a means toward personal gain.37
In further support of the evolutionary approach, there is a lot of evidence that animals and babies can exhibit altruistic tendencies.38 And young children tend to have a strong “equality bias.” But there are limits. Animals are far less in-clined to show benevolence toward strangers. Children only start to really hone their pro-social instincts, through sharing for example, when they grow older—suggesting that socialization plays a key role.
So while the evolutionary basis for altruism has its merits, it also has its limitations. And our evolutionary inheritance comes with a dark side. Humans have a strong tendency to separate into “in” and “out” groups, and experiments show that the thresholds for group loyalty can be very low. This can lead to demonizing the other, which in extreme cases leads to denying their humanity. For example, the emotion of disgust, which many think evolved to protect us from parasites and pests, can be perverted and turned against people in the out group.39
It is clear, then, that nature endows us with both pro-social and anti-social instincts. Human beings are capable of the heights of kindness and the depths of brutality.40 They are capable of being “primed” to act in certain ways. This
demonstrates the limits of basing moral deci-sions on mere sentiments or gut feelings. Sentiment must be tempered by the exercise of reason. This, after all, was the insight of Aristot-le, whose theory of flourishing is founded on the notion that the exercise of reason is proper to humans, what distinguishes us from animals, and from untutored children, too.41 Stephen Pinker argues persuasively that reason alone can extend the reach of empathy beyond favored groups to the whole of humanity.42
We have argued so far that the relational dimen-sion of eudaimonia coheres with human nature. But what about its other pillar—purpose, mean-ing, self-actualization? Here too, the evidence is supportive. Studies have shown that people exhibit a “teleological bias,” or a “general cogni-tive bias to view the world in terms of agency, purpose, and design.”43 Martin Seligman, one of the leaders of the “positive psychology” move-ment, argues that human flourishing is related to five distinct factors: (i) positive emotion, which is mainly genetic, but can be boosted by training; (ii) engagement, which happens when a person’s highest strengths match the highest challenges that come his or her way; (iii) rela-tionships; (iv) meaning and purpose in life; and (v) accomplishment and achievements.44 Three of these five core factors support a teleological view of the structure of human psychology. Similarly, “self-determination theory” posits that three basic psychological needs are fundamental to eudaimonia—autonomy, competence, and relatedness.45 Again, these tally with our two building blocks of human flourishing: a sense of purpose and a sense of community.
The loss of the common good
We have argued that since the flourishing of the individual and the flourishing of the community are interlinked, then eudaimonia points toward the common good. This is a “good” that we all strive for, and it is a good that we hold in “com-mon.” Yet with the emergence of modernity, this
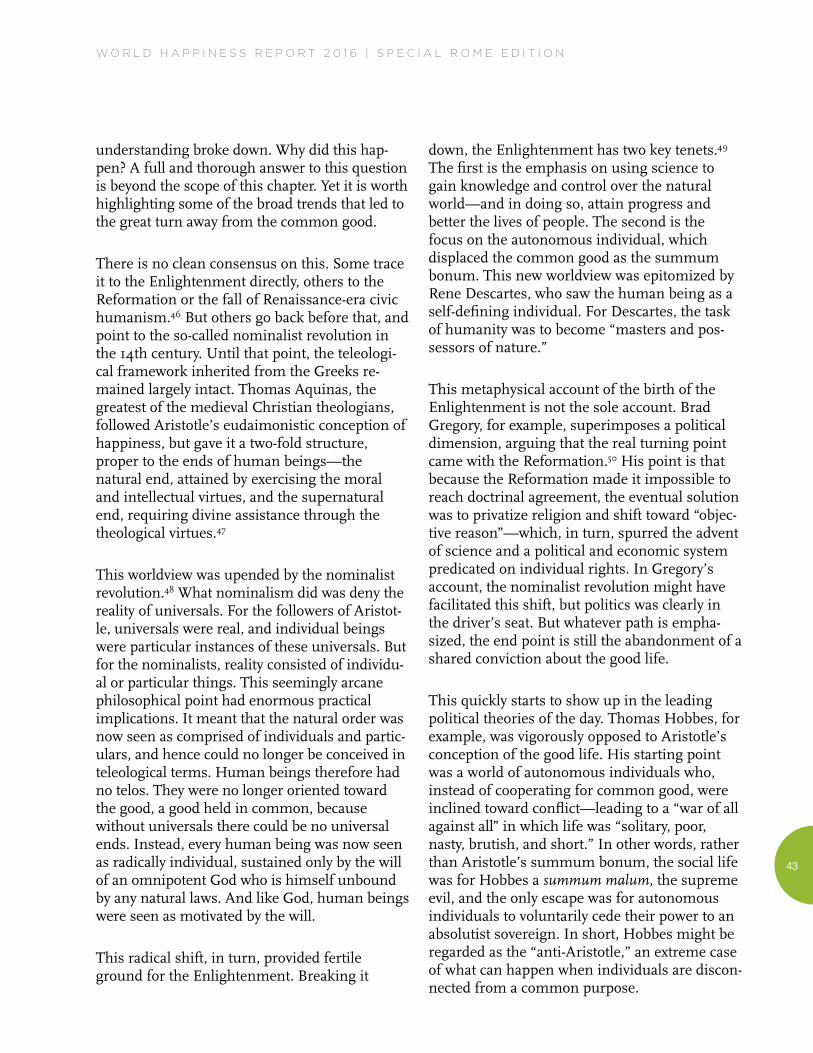
W O R L D H A P P I N E S S R E P O R T 2 0 1 6 | S P E C I A L R O M E E D I T I O N
43
understanding broke down. Why did this hap-pen? A full and thorough answer to this question is beyond the scope of this chapter. Yet it is worth highlighting some of the broad trends that led to the great turn away from the common good.
There is no clean consensus on this. Some trace it to the Enlightenment directly, others to the Reformation or the fall of Renaissance-era civic humanism.46 But others go back before that, and point to the so-called nominalist revolution in the 14th century. Until that point, the teleologi-cal framework inherited from the Greeks re-mained largely intact. Thomas Aquinas, the greatest of the medieval Christian theologians, followed Aristotle’s eudaimonistic conception of happiness, but gave it a two-fold structure, proper to the ends of human beings—the natural end, attained by exercising the moral and intellectual virtues, and the supernatural end, requiring divine assistance through the theological virtues.47
This worldview was upended by the nominalist revolution.48 What nominalism did was deny the reality of universals. For the followers of Aristot-le, universals were real, and individual beings were particular instances of these universals. But for the nominalists, reality consisted of individu-al or particular things. This seemingly arcane philosophical point had enormous practical implications. It meant that the natural order was now seen as comprised of individuals and partic-ulars, and hence could no longer be conceived in teleological terms. Human beings therefore had no telos. They were no longer oriented toward the good, a good held in common, because without universals there could be no universal ends. Instead, every human being was now seen as radically individual, sustained only by the will of an omnipotent God who is himself unbound by any natural laws. And like God, human beings were seen as motivated by the will.
This radical shift, in turn, provided fertile ground for the Enlightenment. Breaking it
down, the Enlightenment has two key tenets.49 The first is the emphasis on using science to gain knowledge and control over the natural world—and in doing so, attain progress and better the lives of people. The second is the focus on the autonomous individual, which displaced the common good as the summum bonum. This new worldview was epitomized by Rene Descartes, who saw the human being as a self-defining individual. For Descartes, the task of humanity was to become “masters and pos-sessors of nature.”
This metaphysical account of the birth of the Enlightenment is not the sole account. Brad Gregory, for example, superimposes a political dimension, arguing that the real turning point came with the Reformation.50 His point is that because the Reformation made it impossible to reach doctrinal agreement, the eventual solution was to privatize religion and shift toward “objec-tive reason”—which, in turn, spurred the advent of science and a political and economic system predicated on individual rights. In Gregory’s account, the nominalist revolution might have facilitated this shift, but politics was clearly in the driver’s seat. But whatever path is empha-sized, the end point is still the abandonment of a shared conviction about the good life.
This quickly starts to show up in the leading political theories of the day. Thomas Hobbes, for example, was vigorously opposed to Aristotle’s conception of the good life. His starting point was a world of autonomous individuals who, instead of cooperating for common good, were inclined toward conflict—leading to a “war of all against all” in which life was “solitary, poor, nasty, brutish, and short.” In other words, rather than Aristotle’s summum bonum, the social life was for Hobbes a summum malum, the supreme evil, and the only escape was for autonomous individuals to voluntarily cede their power to an absolutist sovereign. In short, Hobbes might be regarded as the “anti-Aristotle,” an extreme case of what can happen when individuals are discon-nected from a common purpose.

44
Yet this is a particularly dark view, no doubt informed by Hobbes’ experience of living through a period of major political and climatic upheaval. The ideas of his contemporary John Locke proved sunnier. Locke argued that cooper-ation should be governed by a social contract, which he saw as a voluntary agreement between autonomous individuals. He also honed the idea of individual freedom, defined in a negative sense as freedom from coercion. Importantly, Locke’s theory of individual rights flowed direct-ly from the voluntarism that is a natural conse-quence of a nominalist worldview. For just as God “owns” human beings because he created them, so human beings can “own” whatever they create, so long as they do not violate God’s will as embedded in the natural law. This notion of the “free” individual who is the author of a voluntary social contract proved enduring. The Aristotelian conception of natural sociability is replaced with the idea that society is held togeth-er by an artificial pact.
This turn toward the individual was also reflect-ed by the Utilitarians. While utilitarianism was a teleological philosophy, identifying the good with the greatest happiness of the greatest number, it nonetheless viewed society as an agglomeration of individuals, rejecting the notion of the common good. As Jeremy Ben-tham said with his trademark bluntness: “The community is a fictitious body, composed of the individual persons who are considered as consti-tuting as it were its members. The interest of the community then is, what?—the sum of the interests of the several members who compose it.”51 Utilitarianism also delivered a mortal blow to eudaimonistic notion of happiness, by turn-ing toward a crude form of hedonism.
From an early stage, utilitarianism was criticized for failing to adequately respect the differences between people, and for its seeming willingness to ride roughshod over individual rights to achieve the general happiness. For this reason, John Stuart Mill sought to make utilitarianism compatible with individual rights—he argued
that freedom from coercion, provided one’s actions do not harm another, was the surest route to happiness, at least in the long run. This melding of (negative) freedom with utility would prove enduring, influencing in particular the development of modern economics.
A defining feature of this post-Enlightenment settlement was the dethroning of the (common) good in favor of the (individual) right. This was given even greater force with the advent of Immanuel Kant’s deontological framework. This framework was predicated on the notion that people are free and independent agents who must choose their own ends. To insist on some particular conception of the good would be to impinge upon their autonomy. A direct implica-tion of this is that “the right is prior to the good,” meaning that individual rights should not be sacrificed for the common good, and—even more than this—that the very principles of justice animating these rights should not pre-suppose any particular conception of the good life.52 Otherwise, it would fail to give due respect to the individual as an end in himself.
This elevation of the right over the good is deeply embedded in the modern worldview, and it transcends the right/left divide. Modern egalitarianisms, for example, tend to stress individual autonomy over altruism. John Rawls, the major proponent of this kind of egalitarian-ism, was a Kantian through and through. His egalitarianism stems from his views on the moral desert of market outcomes. By claiming that differences in assets and talents among people boil down to mere luck, he concludes that they are not attached to any moral desert. From this, he asks what autonomous individuals would choose under fair conditions (conceptual-ized by the famous veil of ignorance in the original position). His answer is that justice would lean egalitarian, permitting social and economic inequality only to the extent that it benefits the least-advantaged person.53 This is not altruistic—it is based on each person choos-ing out of self-interest, on the understanding

W O R L D H A P P I N E S S R E P O R T 2 0 1 6 | S P E C I A L R O M E E D I T I O N
45
that they themselves might be the least-advan-taged person.
Of course, libertarians dispute these conclusions, but they do so on the same terrain. Robert Nozick, for example, argued that anything more than a minimal state “violates persons’ rights not to be forced to do certain things, and is unjusti-fied.”54 Thus Nozick contends that the libertarians are the true heirs of Kant, as they are the ones refusing to treat individuals as merely a means rather than an end. At the crux of the libertarian idea is the radically individualistic notion of self-ownership—and if people own themselves, they are entitled to the fruits of their labor.55
In this sense, both Rawlsian egalitarianism and Nozickean libertarianism stem from the same individualistic root. As Alasdair MacIntyre put it, “It is, from both standpoints, as though we had been shipwrecked on an uninhabited island with a group of other individuals, each of whom is a stranger to me and to all the others.”56 Yet even so, it is not hard to see that libertarianism is far more socially destructive, far more antithetical to the common good, than is Rawlsian egalitarian-ism. For while Rawls rejects the idea of a com-mon good, his conclusions nonetheless mimics aspects of it. Not so with the libertarians. As Nozick himself said, “There is no social entity with a good that undergoes some sacrifice for its own good. There are only individual people, different individual people, with their own individual lives. Using one of these people for the benefit of others, uses him and benefits the others. Nothing more.”57 This kind of hyper-indi-vidualism reached its degenerative apotheosis with Ayn Rand, who regarded selfishness as the supreme virtue.
In later work, John Rawls recognized the clear limits of the Kantian metaphysical framework.58 His mature views held that people differed not only in their conceptions of the good, but also in their motivating moral convictions. For Rawls, the highest virtue was tolerance. When people
enter the public square, they are asked to respect pluralism, to support an “overlapping consen-sus” whereby people can agree on principles of justice for different reasons. But this is a tall order. It asks the citizen to live a bifurcated life, and is naïve to assume that people can agree on principles that are entirely disconnected from conceptions of the good life.59 Rawls also explic-itly rejects the idea of a common good, which he argues is “no longer a political possibility for those who accept the constraints of liberty and toleration of democratic institutions.”60 For Rawls, with echoes of Hobbes, this could only be accomplished by an oppressive state.
What these worldviews all have in common is the notion of what political philosopher Michael Sandel calls the “unencumbered self”—“a self understood as prior to and independent of its purposes and ends.”61 Such a person has no ties to the community, and is not bound up in any conception of a common good. In such a con-text, Margaret Thatcher’s famous quip that “There are individual men and women and there are families…there is no such thing as society” makes perfect sense.
So far, we have attempted to paint, in broad-brush strokes, some of the main developments in political philosophy since the Enlightenment. We will now turn to parallel developments in the field of economics. Modern economics is typical-ly traced to Adam Smith’s proposition that the benefits of market exchange stemmed from self-interest rather than benevolence. Yet Smith’s views were more nuanced than is often appreciated, and were at least partially rooted in older traditions of virtue ethics.62 In fact, Smith’s point about self-interest is limited to the narrow question of exchange, rather than broader issues of distribution or production.63 More generally, as noted already, Smith was a major proponent of altruistic motivation in societal interaction, encompassing “generosity, humanity, kindness, compassion, mutual friendship and esteem, all the social and benevolent affection.”64

46
It makes sense to trace the roots of modern economics to utilitarianism, but a particularly crimped form of utilitarianism—one that rules out interpersonal comparisons. Pareto, one of the early pioneers, held that there was simply no objective way to compare utility across different people. He insisted on taking people’s tastes and preferences as given, bracketing the question of whether they contributed to human flourishing. For this reason, he was vigorously opposed to the idea of economics “taking morality into account,” which he said would be “like accusing the theory of the game of chess of not taking culinary art into account.”65
Pareto’s big breakthrough was to show that the market made interpersonal comparisons of utility redundant. People could now reveal their preferences through market trades—what Pareto referred to as the “measuring rod of money.”66 The “good” is now simply equated with satisfac-tion of preferences, and the market is “efficient” in the sense that it exhausts all voluntary trades that can satisfy these preferences.67 And follow-ing these insights, economists derived the so-called welfare theorems, heralding the virtues of unfettered and competitive markets in leading to the most efficient outcomes.
Neoclassical economics therefore developed as a strange stepchild of utilitarianism and libertari-anism. Such a framework is not really compati-ble with the eudaimonistic notion of happiness rooted in the common good. It is egotistical rather than altruistic, assuming that people are motivated solely by satisfying their own desires and preferences.68 It is materialistic, equating happiness with the consumption of goods and services acquired through market transactions, discounting relational, cultural, and spiritual goods. And it takes people as they are—or as they are assumed to be—with regard to their tastes and preferences, with no role for self-im-provement brought about by the cultivation of the virtues.69
It is our contention that homo economicus, this self-centered, utility-maximizing robot, is not only unnatural—or even a “social moron”70—but also dangerous. It teaches people to think that the best pro-social behavior is actually anti-social behavior. As Clifford Longley puts it, it is an “alchemy” that aims “to turn bad into good, dross into gold.”71 This matters because the psychological literature confirms that people can be primed to think and act in a certain way. In this case, evidence from economic games shows that economists and economics students differ consistently from everyone else—they are more selfish and less pro-social,72 And when bankers are primed to think of themselves as bankers rather than inhabiting other social roles, they are more inclined toward dishonesty.73 Again, this goes back to the insights of Aristotle—vice as well as virtue can become habituated.
Where does all of this lead us? According to Alasdair MacIntyre, it leads to an emotivist culture. By emotivism he means “the doctrine that all evaluative judgments and more specifi-cally all moral judgments are nothing but expres-sions of preference, expressions of attitude or feeling, insofar as they are moral or evaluative in character.”74 In an emotivist culture, there is an understanding that people will not agree on values. This certainly fits with the idea that rights have priority over the good, and that the state must remain neutral about the ends. It fits with the character of homo economicus, who cares only about maximizing his preferences in the narrowest possible sense, and who is unmo-tivated by all notions of virtue, values, and purpose. It fits with the idea that social relation-ships become manipulative as people show a preference for extrinsic goods like money, power, and fame over intrinsic goods that are sought for their own sake. It fits with a consum-erist mentality without an acquisitive ceiling, where desires can be molded, and where the “goods society” replaces the “good society.”75 It fits with the reality that public debate is both rancorous and unresolved, obsessed with scan-dal and celebrity. And it fits with the idea that

W O R L D H A P P I N E S S R E P O R T 2 0 1 6 | S P E C I A L R O M E E D I T I O N
47
the dominant ideology of the age is self-ab-sorbed and unreflective libertarianism.76
A key trait of an emotivist culture, according to MacIntyre, is that it separates means from ends, and even turns means into ends. As evidence, consider the premium placed by modern society on “management”—a skill that brackets all ques-tions of purpose and value, and instead focuses exclusively on technical efficiency and effective-ness. This mindset can also explain the divorce between ethics and economics. Famously, Lionel Robbins drew a sharp distinction between “positive” and “normative” economics: “econom-ics deals with ascertainable facts, ethics with valuations and obligations.”77 In this view, economics is supposed to be value-neutral, which has the effect once again of turning means—efficiency and economic growth—into ends. Politics, too, becomes about bureaucratic competence rather than the common good.
We have spent a lot of time with MacIntyre, because his 1981 book seems prophetic in light of developments over the past few decades.78 MacIntyre sees the emotivist culture as the apotheosis of the Enlightenment project, which he thinks faces a massive self-contradiction. The reason is that the Enlightenment thinkers all began with an investigation of human nature as it is, not as it could be, while at the same time applying moral precepts inherited from an earlier tradition—whose purpose was to “correct, improve, and educate” human nature through the exercise of the virtues.
Gregory’s conclusion is less dark, but also boils down to a contradiction. For him the abandon-ment of virtue ethics was less a deliberate assault by Enlightenment philosophy than a causality of theological conflict—in an era of hardened theological dispute, the Aristotelian system was tarnished by its association with the Catholic Church. He argues that the only real tie left to bind society together is “consumerist acquisitiveness,” but this in turn cannibalizes
the shared beliefs, norms, and values that inform social cohesion and the vitality of public life.
The Principles of Catholic Social Teaching
So far, we have made the case for a vision of human flourishing rooted in the common good, and argued that such a vision has dimmed since the Enlightenment. But if the current economic and social model is so flawed, what should replace it? Here, many of the critics are on thin ground. MacIntyre, for example, argues that we are living in the new dark ages, and the only response is to effectively drop out—by creating self-sustaining small communities and awaiting the arrival of a new St. Benedict.79 This is no answer at all, especially in the era of globaliza-tion and sustainable development. And many of these critics tend to dismiss the market altogeth-er, although they do not offer any realistic alternative.80 This clearly won’t do.
This kind of critique can also be overly tinged with nostalgia for an idealized past. This won’t do either. We must be honest about the failures of the pre-Enlightenment world to put noble principles into practice. And we must be honest about the achievements of the Enlightenment—both the scientific and technological advances that have brought enormous improvements in human health and well-being, and the slow but steady advance of universal human rights.
Our main argument is that there is no need to upend the economic system, as that would prove impossible to achieve and disastrous to attempt. Rather, we wish to present Catholic social teach-ing as a way to break the impasse.81 It is not our intention to defend the confessional claims of the Catholic faith, even if Catholic social teaching is certainly founded on these claims. Our aim is more modest—to present Catholic social teach-ing as a way to put humpty dumpty together again in the context of the modern global econo-

48
my. Of course, Catholic social teaching is not the only valid path. Amartya Sen, for example, makes a persuasive case that the values deriving from the Buddhist tradition have enduring relevance for modern problems.82 And the dominance of the Nordic countries in the happiness rankings surely suggests the viability of a more secular conception of the common good.
What appeals about Catholic social teaching, though, is that it has inherited and internalized the older Aristotelian tradition, seasoning it with centuries of Christian insight. It offers a coher-ent and internally consistent framework that applies universal principles to particular situa-tions and circumstances. And its two founda-tional pillars are the dignity of the human person and the supremacy of the common good.
In this sense, Catholic social teaching takes direct aim at some of the sacred cows of the Enlightenment—the use of science to achieve mastery over the natural world, and the suprem-acy of the individual. Pope Francis, for example, criticizes an unsustainable economic model based on the “technocratic paradigm”—assess-ing interventions in nature solely on grounds of utility and efficiency, always in the service of the self.83 In this, he echoes MacIntyre’s criticism of how modern society prizes managerial compe-tence without reference to the good.
The first pillar of Catholic social teaching is the dignity of each individual. This is predicated on the theological notion that every human being is made in the image and likeness of God, and therefore possesses innate worth and dignity. Christianity holds that because God became a human being, the human being has been forever “divinized” in the sense that he or she receives a personal call to share in the life of God himself.84 Accordingly, human beings are called asked to see Christ in the face of the other, and to treat the other as another self.85
The second pillar of Catholic social teaching is the familiar notion of the common good, de-fined as “the sum of those conditions of social life which allow social groups and their individu-al members relatively thorough and ready access to their own fulfillment.”86 Eudaimonia is therefore alive and well—the common good is the good in and through which all can flourish. While the post-enlightenment tradition reduces the common good to the mere aggregation of individual goods, this restores the old idea that the individual’s own good is intrinsically linked to the good of others. In this sense, it can be better represented as a geometric rather than an algebraic sum.87
This also coheres with how Aquinas viewed the bonum commune—each person wills the other’s well-being for the other’s sake, which gives rise to a true “common” good, not reducible to the good of either taken separately or summed.88 There is an element of sacrifice involved—only by giving up and risking some individual good can we build something in common.89 The Christian metaphor of the Body of Christ is useful here. Just as injury to one part of the body injures the whole body, so injury to one person or one part of society injures the whole of society.
As with human dignity, the common good is deeply rooted in Christian notions of the person. It goes beyond Aristotelian notions of human beings as social creatures. Rather, it reflects the conception of the Trinity as a communion of persons understood as “pure relationality.” Therefore imago dei also implies imago trinita-tis—the human person is called upon to model the communion of persons in the Trinity by living a communal life based on mutual, recipro-cal love and equality.90 This does not entail loss of individual identity, but rather a “profound interpenetration.”91 The distinction between the individual and the person is useful here. While an “individual” is defined by his or her autono-my, a “person” is always a “being in relation.” The person, therefore, is intrinsically linked to the common good. As Jacques Maritain put it,

W O R L D H A P P I N E S S R E P O R T 2 0 1 6 | S P E C I A L R O M E E D I T I O N
49
“The common good is common because is received in persons, each of whom is a mirror of the whole.”92
There is a profound reciprocity at play here. Just as each is called to contribute to the common good, each, in turn, is supported by it. When people are able to flourish and live the good life, this builds up social capital. In turn, when these social bonds are strong, individuals are more easily able to flourish. The good of the individual and the good of social institutions nourish each other. This is the great internal dynamic of the common good.
Thinking practically, it is helpful to envisage two dimensions of the common good: “the common conditions of social life” and “the attainment of the good life by all, at least to a minimum degree.”93 The former comprises the conditions that are needed as a basis for flourishing, but which no individual alone can provide—exam-ples include security, economic opportunity, social cohesion, and a sustainable environment. The latter ensures that no one is impeded or pre-vented from flourishing, including the poor and the marginalized.
A commitment to the common good is a com-mitment to “integral human development”—de-fined as the development of the whole person and all people.94 This implies the development of the person in all dimensions—cultural, social, economic, political, emotional, intellectual, aesthetic, and religious—and the development of every single person without exception or exclusion. It is a eudaimonistic vision. It recog-nizes that every person, in line with his or her dignity, is called to flourishing and self-actualiza-tion, and it presumes a common duty to make this a reality. It promotes not only access to material goods, but also relational goods, cultur-al goods, and spiritual goods. It seeks to build up not only physical capital, but also human capital, social capital, and natural capital.
It is clear that this holistic view of human flourishing differs substantively from post-En-lightenment frameworks. Yet once again there are gradations of difference. Furthest away would be libertarianism, with its radical rejec-tion of reciprocity and common purpose, and its purely negative and value-free notion of free-dom. For a libertarian, not only is there no common good, but the very exercise of freedom itself must be divorced from any notion of the good. As Friedrich Hayek put it, “freedom granted only when it is known beforehand that its effects will be beneficial is not freedom.”95
Rawlsian egalitarianism is closer, as it adopts a more positive notion of freedom—the freedom to pursue a person’s conception of the good. For Rawls, this requires what he calls primary goods, goods that all would want whatever their self-chosen end—goods he identifies with “rights, liberties and opportunities, income and wealth, and the social bases for self-respect.”96 Rawls calls this a “thin theory of the good,” based on the principle that people prefer more primary goods to less.
This conception of the good was “thickened” somewhat with the advent of the capabilities approach associated with Amartya Sen and Martha Nussbaum. For Sen, what matters is not so much the primary goods themselves but the “conversion of primary goods into the person’s ability to promote her ends.”97 Sen therefore shifts his attention to what he calls “function-ings,” defined as the things a person values doing or being. In that sense, “capability” refers to the range of feasible functionings—what people are actually capable of doing and being. With its emphasis on agency and self-actualiza-tion, the capability approach has some overlap with eudaimonia. This is most clear with Nuss-baum’s idea of capability as a “thick vague theory of the good,” whereby it is possible to identify core elements of human life all that could agree were worthwhile.98 Unlike Sen, Nussbaum has produced a list of 10 central capabilities, includ-ing eudaimonistic notions like practical reason

50
and affiliation. In more recent work, however, Nussbaum has edged away from this Aristote-lian framing and back toward Rawls—conceiv-ing of her central capabilities less as a “thick vague theory of the good” and more as an expanded and deepened version of Rawls’s primary goods.99
So even with the capability approach, the focus is ultimately on the individual, and freedom is detached from the common good. While community is important for individual development, it remains purely instrumental.100 A more Aristotelian account would seek to demonstrate how relationship and mutuality can help unfold capability.101 The concept of the good in Catholic social teaching is therefore “thicker” than these alternative paradigms. Not only does it embrace a more “positive” conception of freedom, but it shifts the ground from “freedom to pursue your own good” to “freedom to pursue the common good.”
For Catholic social teaching, the path to the common good runs through the principle of solidarity. Solidarity is, in the words of Pope John Paul II, “a firm and persevering determination to commit oneself to the common good; that is to say to the good of all and of each individual, because we are all really responsible for all.”102 Solidarity is the moral response to an interdepen-dent human society—a response actually in accord with human nature. And as globalization expands, so must solidarity—otherwise globaliza-tion turns into a “globalization of indifference.”103 The ecological crisis also demands a heightened sense of solidarity—not only with the world’s poor and excluded, but also with future genera-tions and even with creation itself.104
Solidarity is also linked to the Catholic under-standing of rights. Indeed, theologian Meghan Clark argues that as a social virtue, solidarity is habituated by practicing respect for human rights.105 Unlike conceptions of rights predicated on the autonomous individual, Catholic social teaching instead argues that rights are intimate-
ly linked to duties, and must be exercised within the social context. Rights therefore flow directly from first pillar of Catholic social teaching—the innate dignity of every human being—and are always oriented toward the second pillar—the common good.
The most detailed account of rights in the Catholic tradition can be found in Pope John XXIII’s landmark encyclical, Pacem in Terris..106 He begins with the following basic rights: “Man has the right to live. He has the right to bodily integrity and to the means necessary for the proper development of life, particularly food, clothing, shelter, medical care, rest, and, finally, the necessary social services. In consequence, he has the right to be looked after in the event of illhealth; disability stemming from his work; widowhood; old age; enforced unemployment; or whenever through no fault of his own he is deprived of the means of livelihood.” He goes on to enunciate a wide array of rights, including the right to be respected, to share in the benefits of culture, to religious freedom, to freely choose one’s state in life, to meet and form associa-tions. On the economic front, he recognizes the right be to given the opportunity to work, to take personal initiative, to private property, to just remuneration for work effort, and to emi-grate. Taken together, this list of rights linked to reciprocal duties—and cemented together by solidarity—lays out the preconditions for hu-man flourishing.
This is also related to how Catholic social teach-ing approaches justice, which is a virtue predi-cated on giving others what is owed to them. In the Catholic tradition, justice is rooted in solidar-ity and in reciprocal rights and duties. It is exercised through mutuality and reciprocal interdependence; and is always geared toward promoting human dignity and facilitating full participation in the community.107
In this, Catholic social teaching appeals not only to Aristotle, but also to the store chest of wisdom contained in the Hebrew Scriptures. This tradi-

W O R L D H A P P I N E S S R E P O R T 2 0 1 6 | S P E C I A L R O M E E D I T I O N
51
tion lays great emphasis on the need to stand in right relationship with God, with our fellow human beings, and with the land and measures justice by how the poor and marginalized are treated.108 In his recent encyclical, Laudato Si’, Pope Francis revived the ancient idea that human life is grounded in these three relation-ships, presenting his idea of integral ecology—meaning that when one of these relationships is ruptured, the others are ruptured too.109 Catholic notions of justice are also rooted in the New Testament, especially in the Christian notion of love of neighbor, especially the poor.110
Catholic social teaching conceives of three distinct form of justice, pertaining to the various relationships between individuals and the community.111 Commutative justice is the justice between individuals—this is the basic justice of contracts, agreements, and promises. Distribu-tive justice is the justice pertaining to what the community owes each and every individual—how the fruits of the earth and human labor are to be apportioned. And social justice relates to the institutional framework that allows each to participate in the common good and to share in its benefits.112
These interlinked notions of justice relate to how Catholic social teaching approaches the issue of property. A libertarian would recognize commutative justice only—or argue that the justice of the marketplace presupposes distribu-tive justice, premised on the belief that efficient outcomes are fair outcomes.113 A Rawlsian would place a high premium on distributive justice. But none would go as far as Catholic social teaching in stressing reciprocal cooperation and participation in the universal common good.
From this encompassing concept of justice flows one of the central principles of Catholic social teaching—the universal destination of goods. This is the principle that the goods of creation are destined for every single person without excep-tion and without exclusion. This ancient teaching
was formalized by Aquinas, who argued that private ownership is never absolute, and must always be subordinated to “common use”—meaning that the goods in one’s possession must be used to benefit others, not just the self. The universal destination of goods implies that the right to own private property is a conditional right, legitimate only to the extent that each person gets what is owed him or her from the world’s resources. In other words, private proper-ty always comes with a “social mortgage.”114
Note that this approach to property is antithetical to both socialist collectivism and individualistic libertarianism—what Pope Pius XI referred to as the “twin rocks of shipwreck.”115 The universal destination of goods is a reflection of solidari-ty;116 specifically, the notion of solidarity as a virtue characterized as the mean between the vices of excess and deficiency—in this case, collectivism and individualism.117 Neither of these extremes respects the dignity of the hu-man person and obligation to the common good. Collectivism suppresses private ownership in favor of common use, while libertarianism suppresses common use in favor of private ownership. Collectivism elevates duties and neglects rights, while libertarianism upholds rights and neglects duties. Collectivism treads on individual dignity, while libertarianism treads on solidarity. Neither is deemed acceptable.
So while the Church has consistently con-demned Marxist collectivism, it also condemns the “errors of individualist economic thinking”118 and the idea of “profit as the chief spur to economic progress, free competition as the guiding norm of economics, and private owner-ship of the means of production as an absolute right.”119 In this vein, Pope Francis has criticized the “magical conception of the market,” arguing that this ideology represents a “crude and naïve trust in the goodness of those wielding econom-ic power and in the sacralized workings of the prevailing economic system.”120

52
The universal destination of goods is also linked to preferential option for the poor. This harks back to the ancient principle that justice is measured by how it treats the poor and the marginalized. And it has a specifically Christian dimension, grounded in a God who identified intimately with the poor, and in whose faces all people are called upon to see the face of Christ. Pope John Paul II referred to the preferential option for the poor as a “special form of primacy in the exercise of Christian charity, to which the whole tradition of the Church bears witness.”121 And Pope Francis ties this directly to solidari-ty—“solidarity must be lived as the decision to restore to the poor what belongs to them.”122
There remains an equally important principle of Catholic social teaching not yet discussed—sub-sidiarity. Subsidiarity calls for decisions to be made at the lowest level possible and the highest level necessary. More formally, it says that higher-order associations should never usurp the authority and freedom of lower-order associ-ations, but should instead help them achieve their ends.123 Subsidiarity presupposes that there are different levels of authorities, each with their own rights and duties with regard to the com-mon good.124 The link to eudaimonia is clear, as subsidiarity respects and nurtures the agency of the human person as he or she seeks to become who they are meant to be. In this sense, subsid-iarity “fosters freedom and participation through assumption of responsibility.”125
Just like solidarity, subsidiarity should be regard-ed as a bulwark against the dominant individual-ism of our age. While human beings flourish in social settings, the emergence of the modern economy has gone hand in hand with “the near extinction of the rich social life which was once highly developed through associations of various kinds.”126 Ironically, the counterpoint to the Promethean individual turns out to be the exalted state. Subsidiarity seeks to fill the space between the individual and the state with a vibrant civil society and a rich associational life.
Solidarity and subsidiarity are bound together tightly. If solidarity is the principle orienting society toward the common good, subsidiarity is the principle grounding all action in human dignity. Solidarity without subsidiarity can degenerate into paternalism, while subsidiarity without solidarity can lead to privatism. In this sense, a keen attention to subsidiarity can help habituate the virtue of solidarity and avoid the vices of individualism and collectivism.
Putting Principle Into Practice
How can these principles be put into practice? To answer this question, the best place to start is where modern Catholic social teaching started—with the means of governing relationships between workers and employers. From the beginning, Catholic social teaching stressed that participating in the universal common good implied a cooperative relationship between the various social entities and associations.
Behind this lies the notion of vocation. Both workers and business owners are called to live out their vocations, which differ in substance but have common ends. This accords with the teleological nature of human psychology—what MacIntyre would refer to as the orientation toward the goods internal to the various practices.127
For Catholic social teaching, work is regarded as a universal calling—through work, says Pope John Paul II, a person “achieves fulfillment as a human being and indeed, in a sense, becomes ‘more a human being.’”128 In the words of Pope Francis, “Work is a necessity, part of the mean-ing of life on this earth, a path to growth, human development and personal fulfillment.”129 Work, therefore, is intrinsic to eudaimonistic notions of flourishing. It is the path to self-actualization. There is therefore a duty to work, which means there is a corresponding right to be given the opportunity to work.
W O R L D H A P P I N E S S R E P O R T 2 0 1 6 | S P E C I A L R O M E E D I T I O N
53
It follows that the relationship between employ-ers and workers should be governed by the relationships of justice. But this is not the justice of the marketplace. As far back as 1891, Pope Leo XIII invoked a “more imperious and an-cient” concept of justice to call upon employers to pay a just wage, as otherwise workers would be victims of “force and injustice.”130. This is a radical critique of the notion that justice lies in the mutual consent of two voluntarist agents. It goes against both the libertarian position, which prioritizes freedom of choice, and the utilitarian underpinning of modern economics, which argues that mutual exchange leads to mutual gain. Rather, the Catholic position makes two points. First, it stresses that consent does not constitute justice when bargaining power is skewed. As Pope Paul VI put it, “when two parties are in very unequal positions, their mutual consent alone does not guarantee a fair contract.”131 Second, paying workers less than a living wage degrades their dignity, treating them as a mere means—a “factor of production”— rather than an end in themselves. Overall, this kind of imbalance inhibits the flourishing of the worker and violates the mutuality inherent in the common good.
A just remuneration for work is therefore regarded as the best way to achieve the universal destination of goods in practice.132 The Catholic tradition also supports other social benefits—in-cluding pensions, healthcare, family support, adequate rest, and vacation time, and work environments that do not impede health, safety, or moral integrity.
The social and relational nature of the person also finds expression in the domain of work. This is why the Catholic tradition emphasizes the right to organize and bargain collectively. Unions are regarded as the arenas where soli-darity and subsidiarity meet. They demonstrate solidarity because workers are united in com-mon purpose—“to protect their just rights vis-à-vis the entrepreneurs and the owners of the means of production.” And they demonstrate
subsidiarity, because they embody the kind of associational life in which civic virtue is habitu-ated—they are an “indispensible element of social life.”133
Business too is regarded by Catholic social teaching as a vocation, a “noble vocation, direct to producing wealth and improving our world.”134 It too is a practice, with goods internal to it. But to achieve its end, it must orient its activity toward the common good. That, in turn, means putting the interests of others ahead of self-interest. This is a radical departure from the current business model that emphasizes maxi-mizing profits, typically identified with share-holder value.
In contrast, a virtuous business strives for three dimensions of the good: good goods, good work, and good wealth.135 An emphasis on “good goods” means that businesses are called upon to produce goods and services that fulfill real human needs and facilitate real human flourish-ing, instead of feeding a consumerist mentality of constant novelty, “a whirlwind of needless buying and spending.”136
The second dimension is “good work.” Given the primacy of the vocation of work, business is called upon to prioritize the goal of employment. Indeed, ownership of the means of production is considered just and legitimate only to the extent that it serves “useful work.”137 To that end, prizing short-term financial return over invest-ment in people—including by viewing human beings as interchangeable with machines—is regarded as a social bad.138
The third way business serves the common good is by producing “good wealth.” While the Catho-lic tradition sees profit as legitimate, this cannot be the exclusive—or even primary—goal of business. To truly serve the common good, business must embrace a wider sense of respon-sibility—not just to shareholders, but also to workers, suppliers, consumers, the natural

54
environment, and broader society, too.139 Catho-lic social teaching also advocates for a blurring of borders between profit-making and non-profit entities, so that businesses can simultaneously earn profits and serve a social function.140
A focus on short-term financial return also works against sustainability. An obsession with profit above all fails to account for the harm done to the environment, to the rhythms of nature, to biodi-versity and complex ecosystems—and to the lives of the poor. To truly fulfill its vocation, business is called upon to bear the full social cost of its environmental activity, to use the earth’s resourc-es in a sustainable manner, and to invest in sustainable development solutions.141
And with its theme of joint vocation, Catholic social teaching also puts a strong emphasis on cooperation within the business venture itself, breaking down the rigid divide between capital and labor that too often leads to cross-purpose and conflict. It therefore endorses joint owner-ship of the means of work—letting workers participate in the management of businesses and giving them a share of the profits. In the words of Pope John Paul II, “each person is fully entitled to consider himself a part-owner of the great workbench at which he is working with everyone else.”142 Indeed, the happiness litera-ture points to the importance of a harmonious relationship between employers and workers. One study suggests that when trust in manage-ment is just one point higher (on a 10-point scale), this has the same effect on life satisfac-tion as a one-third higher salary.143
The focus so far has been on the relative rights and duties of the social partners. What role does the state play? Catholic total teaching suggests that its role is both activist and circumscribed—activist because the good achieved by the com-mon life is higher than the good achieved by the individual; circumscribed because human dignity requires that the autonomy and agency of subsidiary associations be respected.
Catholic social teaching repudiates the common-place belief that the state bears sole responsibili-ty for solidarity, with the economy guided by the law of the market. Pope Benedict XVI made this point explicit. He argued that “authentically human social relationships of friendship, soli-darity and reciprocity” should be conducted within economic activity, and not just “outside it” or “after it.”144 He argues that this “binary model of market-plus-state is corrosive of soci-ety.” Since business is a vocation, it must be a domain of virtue. It is therefore a duty of private economic actors to place solidarity and reciproci-ty ahead of self-interest. It is not the role of government to clean up the mess left behind by homo economicus.
But Catholic social teaching clearly has no truck with the minimalist government of the libertari-ans, either. Indeed, it regards “the whole raison d’etre of the state” as “the realization of the common good in the temporal order,” which implies that the state cannot “hold aloof from economic matters.”145 Accordingly, “the right ordering of economic life cannot be left to a free competition of forces.” Instead, it requires “a true and effective directing principle.”146 All of this suggests a number of core functions that balance solidarity and subsidiarity: ensuring that the basic needs of all are met; fostering a fair distribution of resources and opportunities, including by correcting unbalanced power relationships; and laying down favorable founda-tions for a virtuous economy, including by intervening in areas where market autonomy could impede human flourishing.
In turn, this yields some specific obligations. First off, the government is called upon to provide basic goods that a market economy would underprovide.147 It is called upon to ensure that the basic needs of all are met in line with basic human rights— including healthcare,148 education, housing, nutrition, and some protection against the inevitable fluctuations of a market economy. While the government is not necessarily obliged to

W O R L D H A P P I N E S S R E P O R T 2 0 1 6 | S P E C I A L R O M E E D I T I O N
55
provide these services itself, it is obliged to make sure that they are provided.
Given the centrality of work in Catholic social teaching, the government is also duty bound to prioritize employment. The evidence shows that unemployment is corrosive to human flourish-ing—not only does it lead to a loss of lifetime earnings, but it also worsens health and mortali-ty, impedes the educational achievement of children, and depletes trust and social capital.149 Temporary financial help for the unemployed, while vitally important, can never truly substi-tute for fulfilling work. And if social assistance fails to respect subsidiarity, it can lead to depen-dency and alienation, which inhibits participa-tion and hurts human dignity.150 This suggests a preference for program implementation at a lower level.151
Government must therefore prioritize policies that generate and retain jobs. It could do this by creating conditions favorable to the exercise of economic activity;152 letting monetary policy target employment rather than price stability alone; and implementing active labor market policies such as job search assistance, job train-ing schemes, employment subsidies, and public sector job creation. When economic conditions deteriorate, short-term work programs can prove effective—this is when workers agree to volun-tary reductions in hours, employers agree not to lay people off, and governments agree to subsi-dize the wage bill.153 This kind of agreement represents a perfect blend of solidarity and subsidiarity. And by finding a pro-social solu-tion, this kind policy is likely to enhance subjec-tive well-being.154
Catholic social teaching also advocates for limiting the autonomy of certain sectors and industries, where autonomy of action can impede human flourishing. Protecting the environment presents an obvious case. While it falls within the vocation of business to habituate ecological virtues, it is the responsibility of government to implement appropriate regulato-
ry and carbon pricing mechanisms.155 Govern-ment is also duty-bound to protect the rights of workers, including their right to bargain collec-tively and to exercise joint ownership of the productive process.
Another key area where restrictions are warrant-ed is the financial sector, where—time and time again—pursuit of short-term financial gain has proven catastrophic for human well-being. This has been a consistent concern of Catholic social teaching. Pope Pius XI made this point after the Great Depression and Pope Benedict XVI reiter-ated it after the global financial crisis. For too long, the world of finance has been a “virtue-free zone,” the domain of homo economicus on steroids. Recently, Pope Francis urged people to say “no to a financial system which rules rather than serves.”156 As with the environment, the financial sector itself must pursue the internal goods proper to its practice—and in doing so, serve the common good. But once again, govern-ment has a complementary role to play, by laying down the foundations most conducive to ethical practice—including enhanced regulatory over-sight, limits on firm size and scale, and taxes on short-term financial transactions. Government might also consider corporate governance reforms to discourage short-term thinking and make corporations accountable to a wider range of stakeholders.
The state also has a defined role when it comes to distributive justice. Of course, part of this entails making sure that the needs of all are met. But it goes beyond that. Catholic social teaching has long stressed fairness in the distribution of the gains from material progress. Pope John XXIII, for example, argued that while productive efficiency is important, it is equally important that “riches produced be distributed fairly among all members of the political community.”157
When Catholic social teaching reflects on in-equality, it often does so through an Aristotelian lens—the idea being that excess inequality undermines the civic virtues and severs the
56
sense of shared purpose necessary for the com-mon good. Pope Benedict XVI made this point when he argued that inequality depletes social capital and undermines the norms of reciproci-ty.158 Similarly, Pope Francis argued that inequali-ty leads to a “throwaway culture” in which the sense of common purpose has become so impov-erished that the excluded are no longer even considered part of society. It is for this reason that he calls inequality “the root of social ills.”159
This coheres with psychological evidence that richer people are less likely to engage in pro-so-cial behavior—they tend to behave less generous-ly, display less empathy, and are more likely to lie or cheat.160 The purported reason is that they regard selfish and greedy behavior as acceptable. Just like economists haunted by homo economic-us, or bankers identifying predominantly as bankers, they are primed by the prevailing mindset to behave in anti-social ways.161 This is a textbook case of how the good of the person and the good of the community are inseparable. Inequality not only inhibits the flourishing of the poor; it also inhibits the flourishing of the rich. It creates a true vicious rather than a virtuous circle. And not surprisingly, the evidence also suggests that inequality harms well-being—one study shows that a 1 percent increase in the income share of the top 1 percent has the same effect on life evaluation as a 1.4 percent increase in the unemployment rate.162
This presents an Aristotelian argument for raising taxes on the rich, especially on unearned income and wealth, on the grounds that a more equal society is more favorable to the cultivation of virtue and contributes to greater well-being.163 Some more radical options floated include a global tax on capital164 or policies geared toward equalizing the ownership of capital.165 But this problem cannot be solved by tax policy alone. It is tied to the concentration of economic power in ways that frequently violate the principle of subsidiarity. This tends to undermine the com-mon good, as large and powerful corporations become increasingly distant from the people
they deign to serve, which tempts them to use their power to pursue their own financial inter-ests—thus perpetuating inequality and further undermining that bond that binds the commu-nity in common purpose. One antidote to the imbalance caused by a large and powerful corporation structure is a large and powerful government. But this this is an unsatisfactory solution—combined economic and bureaucratic concentration could smother the vibrant associa-tional life that incubates the social virtues and seeds social capital.166
This also exposes the limits of the viewing the social world as the mere interaction of autono-mous individuals, which ignores the reality that peoples’ lives are lived in and through institu-tions. With the concentration of corporate and bureaucratic power, institutional scale ends up dwarfing the individual, making the good life harder to attain. Institutions are in effect dis-abled and the common good is corrupted. The solution is greater dispersion of economic power and ownership, which would allow all to partici-pate in the goods of society.167
Of course, all of this becomes dramatically more complicated in a world where capital—and increasingly, high-income workers—can glide seamlessly across borders. It is well known that globalization has the potential to undermine the common good, as the authority of the state to reduce imbalances is limited a “race to the bottom” in terms of taxation and regulation. As Daniel Bell put it, the nation state is now too big for small problems, and too small for big prob-lems.168 It is for this reason that subsidiarity operates upwards as well as downwards. In some areas, the proper level is the supranational level. In tandem with subsidiarity, solidarity in a more interdependent world must also take on a more global dimension—a globalization of solidarity rather than indifference.169
This has been yet another consistent theme of Catholic social teaching, especially following

W O R L D H A P P I N E S S R E P O R T 2 0 1 6 | S P E C I A L R O M E E D I T I O N
57
Pope John XXIII’s call for a political authority of the world community to address issues affecting the global common good.170 And in the aftermath of the global financial crisis, Pope Benedict XVI resurrected this call for a world political authority to support the development of peoples in this era of globalization.171 What areas are proper to the supranational dimension? One obvious candi-date is financial sector regulation. Another is global development, especially since inequality is more prominent by location (between-country inequality) than class (within-country inequali-ty).172 Clearly, the implementation of the sustain-able development agenda and the Paris agree-ment to limit carbon emissions require global commitment and cooperation.173 As Pope Francis puts it, “interdependence obliges us to think of one world with a common plan.”174
To apply Aristotle’s logic, the good of the global community is a higher good than the good of the nation state.175 This is not a call for a new cosmopolitanism to take precedence over other communities, local and national. Rather, it is about recognizing the common humanity of all inhabitants of our common home, sharing a common human dignity, and bonded together in common purpose. It is about making sure that all can participate in the interdependent good of an interdependent world.
Conclusion
This chapter has made the case for Catholic social teaching as a framework for happiness—specifically, happiness in the eudaimonistic sense of living a life of purpose, meaning, sociality, and mutuality. This vision of happiness is intrinsically linked with the common good, but this vision of the common good has been dismembered by the post-Enlightenment turn to the atomistic individual. Catholic social teaching offers a concrete and practical way to restore the best aspects of this vision in the context of the global market economy, without in any way diminishing any of the true gains of modernity.
Fundamentally, Catholic social teaching is grounded in the reciprocal cooperation between different sectors and social partners in the service of the common good. Each entry is called upon to pursue its own internal goods, which is always linked to the common good. As always with the habituation of virtue, this requires leadership, education, role models, positive reinforcement, a vigorous civil society, and quality public discourse and deliberation.
The good news is that government can play a reinforcing role. The role of government is both direct and indirect, in line with the twin pillars of solidarity and subsidiarity. Its direct duties include making sure the needs of all are met. Its indirect role is to help subsidiary entities attain their own ends. Of course, this can only go so far—virtue cannot be legislated. Even so, government policy can help by laying down the foundations most conducive to human flourishing—by giving virtue a nudge, as it were. Modern economics focuses a lot on incentives, but not nearly enough on intrinsic motivation. Yet both are important. And the best kind of policies can, depending on their design, influence not only incentives but also this kind of intrinsic motivation.
Against this backdrop, we have advocated for a broad spectrum of economic policy priorities: reducing income and wealth disparities; protect-ing labor rights; prioritizing labor market poli-cies; internalizing the social costs of economic activity; curbing the activities of the financial sector; reducing corporate size and scale; and introducing governance reforms to expand the range of stakeholders, encourage the use profit for social ends, and facilitate shared ownership of the means of production.
These policies should contribute to subjective well-being. More than that, they should contrib-ute to human flourishing. And even more than that, they should serve the common good.

58
1 Judt (2010).
2 Deci and Ryan (2008).
3 Nussbaum (2005).
4 MacIntyre (1981).
5 Kraut, (2001).
6 Aristotle (1953).
7 MacIntyre (1981).
8 Hollenbach (2002).
9 Etzioni (2015).
10 Miller (2011).
11 Aristotle, (1885).
12 MacIntyre (1981).
13 See Bloom (2013); Ricard (2015); World Bank (2015).
14 Pfaff (2015).
15 It is no accident that the notion of compassion for all suffering beings is foundational to Buddhism—see Ricard (2015).
16 Sen (1977).
17 Batson (2011), Ricard (2013).
18 Ricard (2015).
19 Smith (1759).
20 See Becchetti, Bruni, and Zamagni (2014).
21 Helliwell (2012).
22 Zamagni (2005).
23 Bruni and Zamagni (2007); Bruni (2012).
24 Miller (2015); Wight (2015); Bloom (2013); Becchetti, Bruni, and Zamagni (2014).
25 In dictator games, people offer an average of 20–30 percent of resources, even there were no consequences to being selfish.
26 In ultimatum games, people offer around 50 percent, and offers less than 20 percent are typically rejected.
27 In trust games, two-thirds trust the other by turning over the decision to them, and two-thirds in turn reward the trust by playing pro-socially. And in public goods games, 60 to 70 percent are willing to contribute to a common pool for the common gain of all, knowing that they would lose out from too many non-cooperative free riders.
28 Bowles (2012).
29 Bruni and Zamagni (2007); Bruni (2012).
30 See Sachs (2015).
31 See Fehr, Fischbacher, and Gaechter (2002).
32 Dawkins (1976).
33 Bloom (2013). Note, however, that reciprocal altruism is rather different from strong reciprocity. A reciprocal altruist is fundamentally self-interested, and is only willing to incur short-term costs in the anticipation of long-term benefits (see Fehr, Fischbacher, & Gaechter, 2002).
34 Bowles and Gintis (2011), Wilson (2014), Wilson (2015).
35 Wilson (2014).
36 See Bowles and Gintis (2011). But Ricard (2013 argues that warfare was rare for most of human prehistory.
37 Gintis et al (2008).
38 Bloom (2013), Ricard (2015).
39 See Haidt (2013) and Bloom (2013).
40 The psychologist Stanley Milgram is famous for two very different types of experiment. In one, designed to assess kindness, he found that over half of the stamped addressed envelopes he deliberately dropped on the street were picked up and mailed. But in another experiment, he found that people would go to extreme lengths to obey authority—over half of his test subjects were willing to administer what they thought was a lethal electronic shock to a subject they could hear but not see. See Bloom (2013).
41 There is also direct evidence that reasoning wisely in itself leads to greater happiness, especially when it helps people overcome social conflict—see Grossman et al (2011).
42 Pinker (2012).
43 Banerjee and Bloom (2014).
44 Seligman (2012).
45 Ryan, Huta, and Deci, (2008).
46 See Zamagni (2008) on the last point.

W O R L D H A P P I N E S S R E P O R T 2 0 1 6 | S P E C I A L R O M E E D I T I O N
59
47 This latter consisted in union with God after death, and should be regarded not so much as distinct from the natural end but as “a kind of surpassing perfection” of it (McInerny & O’Callaghan, 2014).
48 This account leans heavily on Gillespie (2008).
49 See Shapiro (2003).
50 Gregory (2012).
51 Bentham (1789).
52 See Sandel (2005).
53 Rawls (1971).
54 Nozick (1974).
55 See Sandel (2009).
56 McIntyre (1981).
57 Nozick (1974).
58 Rawls (1993).
59 Sandel (2005).
60 Rawls (1993).
61 Sandel (2005).
62 McCloskey (2008).
63 Sen (1993).
64 Yet Bruni (2012) faults Smith for downplaying the relational nature of the marketplace. In his view, Smith saw the impersonal marketplace as a blessed escape from the hierarchical and exploitative relations of the time. But by taking relationship out of exchange, he is throwing the baby out with the bathwater.
65 Pareto (1909).
66 See Wight (2015).
67 This obliterates the egalitarian instincts of earlier utilitari-anism, which came from the combination of interpersonal comparisons of utility and the assumption of diminishing marginal utility.
68 Making Sen’s distinction, this might be compatible with sympathy, but never commitment (Sen, 1977).
69 See Sachs (2013); Becchetti, Zamagni, and Bruni (2014).
70 Sen (1977).
71 Longley (2014).
72 Etzioni (2016).
73 Sachs (2015).
74 MacIntyre (1981).
75 Gregory (2012).
76 Lilla (2014).
77 Robbins (1935).
78 See also Judt (2010).
79 MacIntyre (1981).
80 Bruni and Sugden (2013).
81 By Catholic social teaching, we mean the body of social encyclicals issued by successive popes that address moral questions related to the functioning of the modern industrial, and increasingly globalized, economy—from Pope Leo XIII’s Rerum Novarum in 1891 to Pope Francis’ Laudato Si’ in 2015. For an excellent overview of (most of) these encyclicals, see Himes (2005).
82 Sen (2014).
83 Pope Francis (2015).
84 As Saint Athanasius put it, “God became man so that we might become God.”
85 There is an interesting debate about over the extent to which Catholic conceptions of the person influenced the development of modern human rights. Moyn (2015) argues that it was only in the twentieth century that human rights came to be grounded in the dignity of the person, a development influenced by Catholic intellectuals like Jacques Maritain.
86 This definition comes from one of the main documents of the Second Vatican Council, Gaudium et Spes—the Pastoral Constitution of the Church in the Modern World—promulgated in 1965.
87 Zamagni (2010).
88 Finnis (2011).
89 Minnerath (2008); Bruni (2012).
90 Clark (2014).
91 Pope Benedict XVI (2009).
92 Maritain (1947).
93 Michel (1937); Finn (2013).
94 Pope Paul VI (1967).
95 Hayek (1960).
96 Rawls (1971).
97 Sen (1999).

60
98 Nussbaum (1990).
99 Nussbaum (2003); Deneulin (2011).
100 Clark (2014).
101 Deneulin (2011).
102 Pope John Paul II (1987).
103 Pope Francis (2013).
104 Pope Francis (2015).
105 Clark (2014).
106 Pope John XXIII (1963).
107 Hollenbach (1977).
108 Donohue (1977).
109 Pope Francis (2015).
110 Pope Benedict XVI (2009) argued that justice comes prior to charity, and indeed, should be considered the minimal measure of charity. But charity transcends and completes justice. A good society, therefore, needs not only relation-ships characterized by rights and duties, but also relation-ships characterized by gratuitousness, mercy and communion.
111 See Hollenbach (1977) and Finn (2013) for detailed elaborations of the different modes of justice.
112 Hollenbach (2002).
113 Hayek, for example, mocked the idea of social justice, calling it a “quasi-religious belief with no context whatso-ever”. See Hayek (1973).
114 Pope John Paul II (1987).
115 Pope Pius XI (1931).
116 As Pope Francis puts it, “solidarity is a spontaneous reaction by those who recognize that the social function of property and the universal destination of goods are realities which come before private property” (Pope Francis, 2013).
117 See Clark (2014).
118 Pope Pius XI (1931).
119 Pope Paul VI (1967).
120 Pope Francis (2013, 2015).
121 Pope John Paul II (1987).
122 Pope Francis (2013).
123 Subsidiarity received its fullest treatment in Pope Pius XI’s 1931 encyclical, Quadragesimo Anno.
124 Hittinger (2008).
125 Pope Benedict XVI (2009).
126 Pope Pius XI (1931).
127 MacIntyre (1981). Note, however, that MacIntyre was skeptical of the idea that the kind of work done in the modern economy could be viewed as a practice with goods internal to it.
128 Pope John Paul II (1981)
129 Pope Francis (2015).
130 Pope Leo XIII (1891).
131 Pope Paul VI (1967). He argued that this principle governed relations not only between individuals, but between nations too.
132 Pope John Paul II (1981).
133 See Pope John Paul II (1981).
134 Pope Francis (2013).
135 See Pontifical Council for Justice and Peace (2014).
136 Pope Francis (2015).
137 Pope John Paul II (1991).
138 Pope Francis (2015).
139 Pope Benedict XVI (2009).
140 One concrete application of this idea lies in the “economy of communion,” whereby business profits are divided in three ways—re-investment in the business, giving to those in need, and funding the infrastructure to promote a culture of giving and reciprocity—see Gold (2010).
141 Pope Francis (2015).
142 Pope John Paul II (1981). A good example of this model is the German principle of co-determination, which gives workers the right to participate in management. The German model of industrial relations was heavily influenced by Catholic social teaching—see Daly (2011).
143 Helliwell and Huang (2010).
144 Pope Benedict XVI (2009).
145 Pope John XXIII (1961).
146 Pope Pius XI (1931).
147 See Sachs (2011).
148 The right to healthcare—so central to human flourish-ing—has been flagged as particularly important—Catholic social teaching calls for it to be provided “cheap or even free of charge”—see Pope John Paul II (1981).

W O R L D H A P P I N E S S R E P O R T 2 0 1 6 | S P E C I A L R O M E E D I T I O N
61
149 Dao and Loungani (2010).
150 Pope John Paul II (1991).
151 Daly (2009) argues that the welfare states inspired by Christian Democratic traditions in postwar Europe showed how to blend solidarity and subsidiarity in practical way. In this model, the public sector authorizes and finances social programs, while private associations take responsibility for delivery of services and benefits. In Germany, for example, social assistance laws require public bodies to enlist churches, religious communities, and “free welfare associations” (some of which are religious in nature, both Catholic and Protestant). The Netherlands instituted a similar model based on a Dutch Calvinist theology.
152 Pope John Paul II (1991).
153 This kind of scheme prevented the global financial crisis from leading to major job losses in countries like Germa-ny—see Dao and Loungani (2010).
154 Helliwell (2012).
155 Pope Francis (2015).
156 Pope Francis (2013).
157 Pope John XXIII (1961).
158 Pope Benedict XVI (2009).
159 Pope Francis (2013).
160 The idea that wealth corrodes virtue is an old idea in Christianity. Pope Francis, for example, is fond of quoting St. Basil’s claim that “money is the devil’s dung.”
161 Szalavitz (2012, 2013); Sachs (2015).
162 Burkhauser, De Neve, and Powdthavee (2016).
163 This is related to Thomas Piketty’s point that progressive taxes in the United States in the early twentieth century were justified not on revenue grounds, but out of fear that oligarchic domination would undermine the democratic foundations of society (Piketty, 2014).
164 Piketty (2014).
165 Milanovic (2016).
166 Sandel (2005).
167 See Bellah et al (1992).
168 Quoted in Bellah et al. (1992).
169 This also touches on self-interest. Wright (2000), for example, argues that as the world becomes more interdependent, benevolence toward strangers becomes more important.
170 Pope John XXIII (1963).
171 Pope Benedict XVI (2009).
172 Milanovic (2016).
173 See Sachs (2016) in the companion Volume I, World Happiness Report 2016 Update.
174 Pope Francis (2015).
175 See Hollenbach (2002).

62
References
Aristotle. (1885). The politics (Jowett, B., Trans.). Oxford: Clarendon Press.
Aristotle. (1953). The nichomachean ethics (Thomson, J.A.K., Trans.). London: Penguin.
Banerjee, K., & P. Bloom. (2012). Why did this happen to me? Religious believers’ and non-believers’ teleological reasoning about life events. Cognition, 133(1), 27–303.
Batson, C.D. (2011). Altruism in humans. Oxford University Press.
Becchetti, L., Bruni, L., & Zamagni, S. (2015). Human values, civil economy, and subjective well-being. In J. Helliwell, R. Layard, and J. Sachs (Eds.), World Happiness Report 2015. New York: Sustainable Development Solutions Network.
Bellah, R. N., Madsen, R., Tipton, S. M., Sullivan, W. M., & Swidler, A. (1992). The Good Society. New York: Alfred A. Knopf.
Bentham, J. (1789). An introduction to the principles of morals and legislation. Retrieved from http://socserv2.socsci.mcmas-ter.ca/econ/ugcm/3ll3/bentham/morals.pdf.
Bloom, P. (2013). Just babies: The origins of good and evil. New York: Crown
Bowles, S. (2012). The new economics of inequality and redistri-bution. Cambridge: Cambridge University Press.
Bowles, S., & Gintis, H. (2011). A cooperative species: Human reciprocity and its evolution. Princeton: Princeton University Press.
Bruni, L. (2012) The wound and the blessing. New York: New City Press.
Bruni, L., & Sugden, R. (2013). Reclaiming virtue ethics for economics. Journal of Economic Perspectives, 27(4), 141–164.
Bruni, L., & Zamagni, S. (2007) Civil economy: Efficiency, equity, public happiness. Bern: Peter Lang AG.
Burkhauser, R., De Neve, J., & Powdthavee, N. (2016). Top incomes and human well-being around the world (CEPR Discussion Paper No. 1400).
Clark, M. (2014). The vision of Catholic social thought: The virtue of solidarity and the praxis of human rights. Minneapolis: Fortress Press.
Daly, L. (2009). God’s economy: Faith-based initiatives and the caring state. Chicago: University of Chicago Press.
Daly, L. (2011). The church of labor. Retrieved from http://democracyjournal.org/magazine/22/the-church-of-labor/
Dao, M., & Loungani, P. (2010). The human cost of reces-sions: Assessing it, reducing it. IMF Staff Position Note, 10(17).
Dawkins, R. (1976). The selfish gene. Oxford: Oxford University Press.
Deci, E.L., & Ryan R.M. (2008). Hedonia, eudaimonia, and well-being: An introduction. Journal of Happiness Studies, 9, 1–11.
Deneulin, S. (2011). Recovering Nussbaum’s Aristotelian roots. Revista cultura economica, XXIX(81/82), 31–37.
Donoghue, J. R. (1977). Biblical perspectives on justice. In J.C. Haughey (Ed.), The faith that does justice: Examining the Christian sources for social change. Eugene: Wipf and Stock.
Etzioni A. (2015). Common good. In M.T. Gibbons (Ed.), The Encyclopedia of Political Thought. John Wiley and Sons.
Etzioni, A. (2016). How learning economics makes you antisocial. Retrieved from http://evonomics.com/how-learn-ing-economics-makes-you-antisocial/
Fehr, E., Fischbacher, U., & Gaechter, S. (2002). Strong reciprocity, human cooperation, and the enforcement of social norms. Human Nature, 13, 1–25.
Finn, D. (2013). Christian economic ethics: history and implica-tions. Minneapolis: Fortress Press.
Finnis, J. (2011). Aquinas’ moral, political, and legal philoso-phy. In E.N. Zalta (Ed.), Stanford encyclopedia of philosophy. Retrieved from http://plato.stanford.edu/entries/aquinas-mor-al-political/
Gillespie, M. A. (2008). The theological origins of modernity. Chicago: University of ChicagoPress.
Gintis, H., Henrich, J., Bowles, S., Boyd R., & Fehr, E. (2008). Strong reciprocity and the roots the roots of human morality. Social Justice Research, 21(2), 241–253.
Gold, L. (2010). New financial horizons: The emergence of an economy of communion. New York: New City Press.
Gregory, B.S. (2012). The unintended revolution: How a religious revolution secularized society. Cambridge: Belknap Press.
Grossman, I., Jinkyung, N., Varnum, M., Kitayama, S., & Nisbett, R. (2013). A route to well-being: Intelligence vs. wise reasoning. Journal of Experimental Psychology: General, 142(3), 944–953.
Haidt, J. (2013). The righteous mind: Why good people are divided by politics and religion. New York: Vintage.
Hayek, F. (1960). The constitution of liberty. Chicago: Universi-ty of Chicago Press.
Hayek, F. (1973). Law, legislation, and liberty. Chicago: University of Chicago Press.

63
Helliwell, J. (2012). Understanding and improving the social context of well-being (NBER Working Paper No. 18486).
Helliwell, J., & Huang, H. (2010). How’s the job? Well-being and social capital in the workplace. Industrial and Labor Relations Review, 63, 205–28.
Himes, K. R., (2005). Modern Catholic social teaching: Commen-taries and interpretations. Washington, DC: Georgetown University Press.
Hittinger, R. (2008). The coherence of the four basic princi-ples of Catholic social doctrine: An interpretation. In Pontifi-cal Academy of Social Sciences, Pursuing the common good: How solidarity and subsidiarity can work together. Vatican City
Hollenbach, D. (1977). Modern Catholic teachings concerning justice. In J.C. Haughey (Ed.), The faith that does justice: Examining the Christian sources for social change. Eugene: Wipf and Stock.
Hollenbach, D. (2002). The common good and Christian social ethics. New York: Cambridge University Press.
Judt, T., (2010). Ill fares the land. New York: Penguin.
Kraut, R. (2014). Aristotle’s ethics. In E.N. Zalta (Ed.), Stanford encyclopedia of philosophy. Retrieved from http://plato.stanford.edu/entries/aristotle-ethics/.
Lilla, M. (2014). The truth about our libertarian age. Retrieved from https://newrepublic.com/article/118043/our-libertari-an-age-dogma-democracy-dogma-decline
Longley, C. (2014). Just money: How Catholic social teaching can redeem capitalism. London: Theos.
MacIntyre, A. (1981). After virtue. London: Gerald Duckworth and Co. Ltd.
Maritain, J. (1947). The person and the common good. New York: Charles Scribner’s Sons.
McCloskey, D. (2008). Adam Smith, the last of the former virtue ethicists. History of Political Economy, 40(1), 43–71.
McInerny, R., & O’Callaghan, J. (2014). Saint Thomas Aquinas. In E.N. Zalta (Ed.), Stanford encyclopedia of philoso-phy. Retrieved from http://plato.stanford.edu/entries/aquinas/
Michel, V. (1937). Christian social reconstruction. Milwaukee: Bruce.
Milanovic, B. (2016). Global inequality: A new approach for the age of globalization. Cambridge: Belknap Press.
Miller, C. B. (2011). Distributive justice and empirical moral psychology. In E.N. Zalta (Ed.), Stanford encyclopedia of philosophy. Retrieved from http://plato.stanford.edu/entries/justice-moral-psych/
Miller, F. (2011). Aristotle’s political theory. In E.N. Zalta (Ed.), Stanford encyclopedia of philosophy. Retrieved from http://plato.stanford.edu/entries/aristotle-politics/.
Minnerath, R. (2008). The fundamental principles of social doctrine: The issue of their interpretation. In Pontifical Academy of Social Sciences, Pursuing the common good: How solidarity and subsidiarity can work together. Vatican City
Moyn, S. (2015). Christian human rights. Philadelphia: University of Pennsylvania Press.
Nozick, R. (1974). Anarchy, state, and utopia. New York: Basic Books.
Nussbaum, M. (1990). Aristotelian social democracy. In R. B. Douglass, G.M. Mara, & H.S. Richardson (Eds.), Liberalism and the good. London: Routledge.
Nussbaum, M. (2003). Capabilities as fundamental entitle-ments. Feminist Economics, 9(2-3), 33–59.
Nussbaum, M. (2005). Mill between Aristotle and Bentham. In L. Bruni & P.L. Porta (Eds.), Economics and happiness: Framing the analysis. New York: Oxford University Press.
Pareto, V. (1971). Manual of political economy. New York: Augustus Kelley (Original work published in 1909).
Pfaff, D. (2015). The altruistic brain: How we are naturally good. New York: Oxford University Press.
Piketty, T. (2014). Capital in the twenty-first century. Cambridge: Belknap Press.
Pinker, S. (2012). The better angels of our nature: Why violence has declined. New York: Penguin Books.
Pontifical Council for Justice and Peace. (2014). Vocation of the business leader: A reflection. Retrieved from http://www.iustitiaetpax.va/content/dam/giustiziaepace/VBL/Vocation_ENGLISH_4th%20edition.pdf
Pope Benedict XVI. (2009). Caritas in veritate. Retrieved from http://w2.vatican.va/content/benedict-xvi/en/encyclicals/documents/hf_ben-xvi_enc_20090629_caritas-in-veritate.html
Pope Francis. (2013). Evangelii gaudium. Retrieved from http://w2.vatican.va/content/francesco/en/apost_exhorta-tions/documents/papa-francesco_esortazione-ap_20131124_evangelii-gaudium.html
Pope Francis. (2015). Laudato si’. Retrieved from http://w2.vatican.va/content/francesco/en/encyclicals/documents/papa-francesco_20150524_enciclica-laudato-si.html
Pope John Paul II. (1981). Laborem exercens. Retrieved from http://w2.vatican.va/content/john-paul-ii/en/encyclicals/documents/hf_jp-ii_enc_14091981_laborem-exercens.html
W O R L D H A P P I N E S S R E P O R T 2 0 1 6 | S P E C I A L R O M E E D I T I O N

64
Pope John Paul II. (1987). Sollicitudo rei socialis. Retrieved from http://w2.vatican.va/content/john-paul-ii/en/encycli-cals/documents/hf_jp-ii_enc_30121987_sollicitudo-rei-social-is.html
Pope John Paul II. (1991). Centesimus annus. Retrieved from http://w2.vatican.va/content/john-paul-ii/en/encyclicals/documents/hf_jp-ii_enc_01051991_centesimus-annus.html
Pope John XXIII. (1961). Mater et magistra. Retrieved from http://w2.vatican.va/content/john-xxiii/en/encyclicals/documents/hf_j-xxiii_enc_15051961_mater.html
Pope John XXIII. (1963). Pacem in terris. Retrieved from http://w2.vatican.va/content/john-xxiii/en/encyclicals/documents/hf_j-xxiii_enc_11041963_pacem.html
Pope Leo XIII. (1891). Rerum novarum. Retrieved from http://w2.vatican.va/content/leo-xiii/en/encyclicals/documents/hf_l-xiii_enc_15051891_rerum-novarum.html
Pope Paul VI. (1967). Populorum progressio. Retrieved from http://w2.vatican.va/content/paul-vi/en/encyclicals/docu-ments/hf_p-vi_enc_26031967_populorum.html
Pope Pius XI. (1931). Quadragesimo anno. Retrieved from
http://w2.vatican.va/content/pius-xi/en/encyclicals/docu-ments/hf_p-xi_enc_19310515_quadragesimo-anno.html
Rawls, J. (1971). A theory of justice. Cambridge: Belknap Press.
Rawls, J. (1993). Political liberalism. New York: Columbia University Press.
Ricard, M. (2015). Altruism: The power of compassion to change yourself and the world. New York: Little, Brown and Company.
Robbins, H. (1935). An essay on the nature and significance of economic science. London: Macmillan.
Ryan, R., Huta, V, & Deci, E. (2008). Living well: a self-deter-mination theory perspective on eudaimonia. Journal of Happiness Studies, 9, 139–170.
Sachs, J. (2011). The price of civilization: Reawakening American virtue and prosperity. New York: Random House.
Sachs, J. (2013). Restoring virtue ethics in the quest for happiness. In J. Helliwell, R. Layard, & J. Sachs (Eds.), World Happiness Report 2013. New York: Sustainable Development Solutions Network.
Sachs, J. (2015). Investing in social capital. In J. Helliwell, R. Layard, & J. Sachs (Eds.), World Happiness Report 2015. New York: Sustainable Development Solutions Network.
Sachs, J. (2016). Happiness and Sustainable Development: Concepts and Evidence. In J. Helliwell, R. Layard, & J. Sachs (Eds.), World Happiness Report 2016 Update (Vol. I). New York: Sustainable Development Solutions Network.
Sandel, M. (2005). Public philosophy: Essays on morality in politics. Cambridge: Harvard University Press.
Sandel, M. (2009). Justice: What’s the right thing to do? New York: Farrar, Straus, and Giroux.
Seligman, M. (2012). Flourish: A visionary new understanding of happiness and well-being. New York: Atria.
Sen, A. (1977). Rational fools: A critique of the behavioral foundations of economic theory. Philosophy and Public Affairs, 9(4), 317–24.
Sen, A. (1993). Does business ethics make economic sense? Business Ethics Quarterly, 3(1), 45–55.
Sen, A. (1999). Development as freedom. New York: Anchor Books.
Sen, A. (2014). The contemporary relevance of Buddha. Ethics and International Affairs, 28(1), 15–27.
Shapiro, I. (2003). The moral foundations of politics. New Haven: Yale University Press.
Smith, A. (1759). The theory of moral sentiments. Retrieved from https://www.ibiblio.org/ml/libri/s/SmithA_MoralSenti-ments_p.pdf.
Szalavitz, M. (2012). Why the rich are less ethical: They see greed as good. http://healthland.time.com/2012/02/28/why-the-rich-are-less-ethical-they-see-greed-as-good/
Szalavitz, M. (2013). Wealthy selfies: How being rich increases narcissism. Retrieved from http://healthland.time.com/2013/08/20/wealthy-selfies-how-being-rich-increas-es-narcissism/
Wight, J. (2015) Ethics in economics: An introduction to moral frameworks. Stanford: Stanford University Press.
Wilson, D. S. (2015). Does altruism exist? Culture, genes, and the welfare of others. New Haven: Yale University Press.
Wilson, E. O. (2014). The meaning of human existence. New York: Norton.
World Bank. (2015). World development report 2015: Mind, society, and behavior. Washington, DC: World Bank.
Wright, R. (2000). Nonzero: The logic of human destiny. New York: Pantheon Book.
Zamagni, S. (2005). Happiness and individualism: A very difficult union. In L. Bruni & P.L. Porta (Eds.), Economics and happiness: Framing the analysis. New York: Oxford University Press.
Zamagni, S. (2008). Reciprocity, civil economy, common good. In Pontifical Academy of Social Sciences, Pursuing the common good: How solidarity and subsidiarity can work together. Vatican City

65
Zamagni, S. (2010). Catholic social thought, civil economy, and the spirit of capitalism. In D. Finn (Ed.), The true wealth of nations: Catholic social thought and economic life. Oxford: Oxford University Press.
W O R L D H A P P I N E S S R E P O R T 2 0 1 6 | S P E C I A L R O M E E D I T I O N

66
LUIGINO BRUNI AND STEFANO ZAMAGNI
Chapter 3
THE CHALLENGES OF PUBLIC HAPPINESS: AN HISTORICAL-METHODOLOGICAL RECONSTRUCTION
Luigino Bruni, LUMSA University, Rome, Italy. E-mail: [email protected]
Stefano Zamagni, University of Bologna. Italy. E-mail: [email protected]

W O R L D H A P P I N E S S R E P O R T 2 0 1 6 | S P E C I A L R O M E E D I T I O N
67
At a severe crisis, when lives in multi-tudes and wealth in masses are at stake, the political economists are helpless – practically mute: no demon-strable solution of the difficulty can be given by them, such as may convince or calm the opposing parties.
John Ruskin1
Man is a civil animal.
Leonardo Bruni2
Introduction: Old and New Happiness
The way contemporary economics and social sciences consider happiness is far from the classical tradition, and in general, too simplistic. This paper aims to make the use of the term happiness more intricate than in the present debates, showing the complexity of the concept in both philosophical (Aristotelian) and econom-ic traditions. Today happiness is often under-stood in context of the Utilitarian concept, ignoring the rich and very old discussions about the meaning and nature of human happiness. The social dimension is particularly ignored; what the Romans and the Italians called pubblica felicità, or public happiness, is almost totally absent from contemporary studies. We claim, instead, that a reconsideration of the classical concepts of public happiness and eudaimonia can offer important hints and critical tools for a better understanding of our well-being, individu-ally and collectively.
The classical tradition of political economy, with a journey of more than two centuries, began by investigating the means for living well under the hypothesis that economic variables such as income, wealth, or employment are important
goals for a good life, both individually and socially. Reducing unhappiness by means of reducing material poverty then became the telos of economics. In this way, political economy gained its ethical status in the modern period, after a middle age where its moral statute was often questioned.
The science of economics became known as the “science of wealth,” with the “hope that poverty and ignorance may gradually be extinguished” and “that all should start in the world with a fair chance of leading a cultured life, free from the pains of poverty and stagnating influences of excessive mechanical toil.”3 This hope inspired economists to study the “nature and causes of the wealth” of persons and nations, with the hope and promise that an ever-increasing num-ber of people can enjoy basic material needs, and therefore increase “public happiness.”
In the last few decades, however, something very subtle pertaining to human happiness has begun creeping into economic thought. Doubts have arisen about the moral value of economic growth and the ethical base of progress. A steady stream of critiques questioning the values of modernity and the market economy has charac-terised modernity since its very beginning. Jean-Jacques Rousseau, the main representative of this anti-modernity tradition, pointed out that the vice of the modern age was luxury, avarice, and the search for wealth.4 Not only socialism and Marxism, but also Utopian socialists and some branches of the cooperative movement have continued Rousseau’s radical critique of markets and the modern economy, in a tradition that flows parallel to the capitalistic river. During deep and long economic and social crises, this anti-market-economy tradition has always arisen, and gained popularity among the public, the media, and intellectuals.
The literature on the ‘paradoxes of happiness’ offers material for the present-day critique of capitalism. In this paper, we will try to show that

68
happiness poses to economic life and theory challenges which are numerous, complex, and old.
The expression “paradox of happiness” or “Easterlin paradox” refers to empirical data about two different and controversial issues. In a nutshell, the happiness paradox shows that per-capita income has risen sharply in most countries in recent decades, yet average happi-ness has stayed constant or has grown less than traditional economics claims.
Explanations for the paradox are many.5 An idea, however, is present in all economic theories: Economics, focused on its key variables (income, wealth, consumption) neglects some important things that affect people’s happiness. There are, in other words, some ‘happiness externalities’ that are not calculated in the standard economic analysis of income/wealth. In the ‘transforma-tion’ of economic goods into well-being something occurs to make the process more complex than standard economic theory supposes.
Today, in the technicalities of the debate on the economics of happiness, we find many nuances and interpretations. But apart from those techni-calities, a very sharp cultural message springs: In contemporary market societies, wealth and income, at the individual and social level, are linked in a deep relationship with well-being or happiness. The most important words about our lot are those embodied in the ‘transformation problem’ of goods into well-being, of wealth into weal. But mainstream economics shows, in general, no interest in the transformation of commodities into happiness. It stops its dis-course at the backyard of our well-being.
This paper tries to show some of the whys and hows of the lack of attention to this transfor-mation problem in economics, following the main stream of the history of the nexus of wealth-happiness, but also some minor de-tours from the main economic traditions (the Italian Civil economy and the Cambridge
tradition) where greater attention was paid to the translation of goods into well-being; in some cases, central attention.6
In the following sections, we start with an analy-sis of the Aristotelian idea of “eudaimonia.” Then we discuss the tradition of political economy, with special attention to the Cambridge tradition where the complexity of the transformation of goods/wealth into happiness remained central, despite the continued focus of mainstream political economy, following Adam Smith’s ideas, on wealth and disregarding the difficulty of transforming economic well-being into both individual and public happiness. We conclude with some considerations of the relational nature of happiness, and its policy implications.
The Old “Civil’ Happiness”: Aristotle’s Eudaimonia7
The Greek word eudaimonia is very often pres-ent today in papers dealing with happiness, in both the social sciences and psychology. Howev-er, the term is rarely used with an awareness of its complex meaning. In particular, there is an eudaimonia before Socrates, one in Socrates, and many after him. Here, we choose to start with the use of eudaimonia in Aristotle, given his weight in both Western tradition and con-temporary debates on happiness.
Enclosed in the term eudaimonia8 we find the fundamental coordinates marking the route for the research we describe in the following chap-ters. Socrates, Plato, and Aristotle, as well as all the classical schools of philosophy (i.e. Stoicism)
explored the diverse dimensions of happiness. The fundamental ideas they shared on happi-ness were: (a) happiness is the final, or ulti-mate, end of life: the highest good for the hu-man being; (b) happiness is self-sufficient, because there is nothing that, added to it, would increase its value; (c) there is an inseparable bond between happiness and the practice of

W O R L D H A P P I N E S S R E P O R T 2 0 1 6 | S P E C I A L R O M E E D I T I O N
69
virtues; (d) because virtues bear fruits regard-less of self-interest, happiness can be reached only as a by-product if it is sought in non-instru-mental ways, for example by seeking to be virtuous. On the other hand, differences be-tween Aristotle and the other classical Greek philosophers arose around such questions as the connection between the active and contemplative life, and then, over the role of sociality and civil virtues in order to reach the good life.
The Aristotelian meaning of the eudaimonia is semantically impoverished when translated into the English word happiness: The Greek expres-sion meant the highest end that humans can realize: “What is the highest of all goods achiev-able by action.”9 As a consequence, eudaimonia is an end “which is in itself worthy of pursuit more final than that which is worthy of pursuit for the sake of something else…for this we choose always for self and never for the sake of something else.”10 That makes happiness “the best, noblest, and most pleasant thing in the world.”11 All the other good things, including wealth, are only means for reaching happiness. Happiness, therefore, is never a means; on the contrary, it is the only goal that is impossible to instrumentalize, because of its very nature. For this reason it is the final end: something final cannot be an instrument for something else; there is nothing to be reached beyond it. Out of this comes the thesis that neither wealth nor health can ever be ultimate ends. They can only be important means (instruments) for living a good life. As the philosopher Martha Nussbaum writes: “Happiness is something like flourishing human living, a kind of living that is active, inclusive of all that has intrinsic value, and complete, meaning lacking in nothing that would make it richer or better.”12
Furthermore, eudaimonia is a multidimensional and diverse reality. First, one of the primary objectives of Aristotle was to distinguish eu-daimonia from the hedonism of Aristippus and his school: “To judge from the lives that men lead, most men, and men of the most vulgar
type, seem (not without some ground) to identi-fy the good, or happiness, with pleasure.”13 Eudaimonia, then, cannot be identified with pleasure, but also neither with honour nor money. This is why the neo-Aristotelian philoso-phers in the Anglo-Saxon world preferred to translate eudaimonia as “human flourishing” rather than happiness, because in common language today happiness also indicates mo-mentary euphoria, carefree content, a pleasur-able sensation or tout court pleasure.14
To Aristotle, pleasure is not the end of action, then, but only a sign that the action is intrinsical-ly good. Pleasure, instead, can signal the value of an activity, not its scope: “Virtuous actions must be in themselves pleasant.”15 Second, eu-daimonia is the end of politics: “what it is that we say political science aims at and what is the highest of all goods achievable by action…for both the general run of men and people of superior refinement say that it is happiness.”16 The aim of politics is happiness because politics “gives utmost attention in forming citizens in a certain way, that is to make them good and committed to carrying out beautiful actions.”17 What is more, political life is the only place in which happiness can be fully experienced: “It is natural, then, that we call neither ox nor horse nor any other of the animals happy; for none of them is capable of sharing in such activity.”18
As a third (and very crucial) element, eudaimonia is the indirect result, a by-product, of the practice of virtues. The word eudaimonia, in fact, origi-nally derived from “good demon” (eu daimon), which meant that only those who have a good demon or good fortune on their side can reach eudaimonia. So happiness and good fortune were used as synonymous words. Socrates, and after him Plato and Aristotle, invested the word eudaimonia with new meanings. The idea that even a person with bad luck could become happy by means of virtuous actions began to enter into the philosophical imagination.

70
Linked with the key connection between virtues and eudaimonia we find a fundamental tension regarding the whole Aristotelian theory of eudaimonia: Although the virtuous life is a way to happiness, virtues bear their fruit (happi-ness) only if sought non-instrumentally, and only if internalised as being intrinsically good. In fact, as soon as virtue is used as a means, it ceases to be a virtue. So happiness is the indi-rect result of practising virtues, which makes them, at the same time, means and ends—part of eudaimonia.
Virtues are means to happiness only if they are not only a means: this represents the basic happi-ness paradox by Aristotle or teleological paradox, which leans in the direction of associating virtues with gratuitousness and genuineness. Virtues lead to happiness only if practised genuinely for their intrinsic value (the virtuous action is its own reward).
Only if we keep in mind this fundamental tension in Aristotle’s vision of eudaimonia can we properly understand the Aristotelian ap-proach to the relationality–happiness nexus that nowadays receives emphasis in the literature on happiness. Interpersonal relations lead to happiness only if they are genuine expressions of the practice of virtues. Every relational theory of happiness, ancient and modern, is also related to this key idea. And finally, we find this Aristotelian paradox any time we deal with a genuinely civil approach to happiness.
This short analysis of Aristotle’s eudaimonia has shown that his vision of happiness is basically one of civil happiness. Following this idea, we find in the Nicomachean Ethics a strong point of attraction—perhaps the strongest in the entire Aristotelian ethics—for the civil or political nature of a good life, of happiness. Notice that Aristotle, like all classical thought, did not distin-guish between the civil, social, and political spheres; that is a typically modern distinction.
This focus on the civil or political nature of a
good life, of happiness, appears in one of Aristo-tle’s most quoted passages: “Surely it is strange, too, to make the supremely happy man a soli-tary; for no one would choose the whole world on condition of being alone, since man is a political creature and one whose nature is to live with others. Therefore even the happy man lives with others; for he has the things that are by nature good. And plainly it is better to spend his days with friends and good men than with strangers or any chance persons. Therefore the happy man needs friends.”19
For Aristotle, then, and in the whole Western civil tradition, there is an intrinsic value in relational and civil life, without which human life does not fully flourish. Though human life must be able to flourish autonomously, in the sense that it cannot be totally jeopardized by bad fortune, it is also true that in the Aristotelian line of thought, some of the essential compo-nents of the good life are tied to interpersonal relationships. Participation in civil life, having friends, loving and being loved, are essential parts of a happy life.20
By definition, we have said, eudaimonia cannot be reached instrumentally: it is the indirect result of virtuous actions, carried out for their intrinsic value. Nussbaum calls “friendship, love and political commitment”21 the three basic relational goods in Aristotle’s Ethics. Therefore, they have intrinsic value, are part of eu-daimonia, and cannot be used as just a means. This has been a common point of agreement for many philosophers throughout history and still today, despite other differences between their schools of thought.22
The peculiarity of Aristotle’s theory of the happiness-relationality nexus emerges from his analysis of the diverse forms of friendships found in the eighth book of the Nicomachean Ethics. Friendship, for Aristotle, “is besides most necessary with a view to living.”23 Thus, to him, true friendship is virtue-friendship. It is

W O R L D H A P P I N E S S R E P O R T 2 0 1 6 | S P E C I A L R O M E E D I T I O N
71
that which remains in the virtuous and happy person even after he has reached contemplation. It is not friendship “for the sake of pleasure” or “for the sake of utility,”24 but desired for the good of the friend. Because they are made of relationships, “relational goods” can be enjoyed only in reciprocity.25
So, by affirming the importance of relational goods in a happy life (“The happy man needs friends”), Aristotle brings happiness back under the influence of fortune.26
This internal tension in the Aristotelian eu-daimonia—that it must, at the same time, be the final end, self-sufficient, and fragile (because it depends on others) —marks the deepest differ-ence between the two approaches of the happi-ness-sociality nexus (i.e. the Aristotelian and the Platonic) that have characterised the whole West-ern cultural trajectory until now. Though Aristot-le agrees with Plato that the contemplative life is superior to the active life, at the same time he affirms the necessity of friends for every stage of life. In an Aristotelian approach, happiness, the good life, is at the same time constitutionally civil and therefore fragile. To renounce its fragility would mean we would have to renounce the good life itself.
This is the basic stress on which the happi-ness-sociality nexus leans. The awareness of the civic life’s fragility accompanies the trajectory of Western thought up to modern times, when the invention of the market economy was consid-ered the major tool for eliminating fragility from life in common.27 More than any other modern invention, the market emancipates us from dependence on other people. It frees us from the benevolence of our fellow citizens. The market emancipates us from dependence, but in doing so may remove the locus of genuine sociality. We’ll return to these issues at the end of the paper.
Roman and Italian Public Happiness
The Aristotelian idea of happiness/eudaimonia remained alive during the Middle Ages, in particular in the Thomistic tradition of virtue ethics and common good. A moment of a particularly relevant offspring of that tradition in modernity has been the Neapolitan Economia Civile, which is a strict and direct continuation of the Aristotelian and Roman conception of happiness and good life, with a substantial dimension of sociality.
In fact, while the fathers of American revolu-tion were writing the right to the “pursuit of happiness” in the opening of the Declaration of Independence, in Italy the first economists put “public happiness” as their motto for the new science.
Non sibi, sed domino gravis est, quae servit egestas: “A servant’s poverty is hard on the master, not the servant.” This sentence of Lucanus, put in esergo to his Lezioni di Economia Civil, represents a good synthesis of Antonio Genovesi’s idea of both Economia Civile and Pubblica Felicità. Genovesi, as an Enlightenment philosopher and reformer, had the sovereign as a privileged interlocutor. Not by chance, even Adam Smith, the founder of the modern political economy, wrote at the core of his Wealth of the Nations (the title of the book is also very telling): “Political œconomy, considered as a branch of the science of a statesman or legislator, proposes two dis-tinct objects: first, to provide a plentiful revenue or subsistence for the people, or more properly to enable them to provide such a revenue or subsistence for themselves; and secondly, to supply the state or commonwealth with a reve-nue sufficient for the public services. It proposes to enrich both the people and the sovereign.”28
From that point of view, civil economy is not only very similar to political economy, but also to late- mercantilism, physiocracy, and maybe cameralism, and the adjective civil can properly

72
be seen as just the Latin version of the Greek word political (or social). But actually, to ac-knowledge that moral philosophers and the first economists of modernity were writing with the aim of being useful to the policymakers of their times, to make their countries richer and powerful, is not a very interesting and fecund intellectual exercise. It is just to restate what the scholar of modern political and social ideas knew very well. Genovesi’s Economia Civile, however, is also something more.
Genovesi’s idea of public happiness has been surely influenced by the Roman felicitas publica, as many scholars knew and wrote.29
But, in spite of what D’Onofrio30 claims, Genovesi had no need to pass thought-out Germany to ground his theory in Roman and classical thought. The Lezioni di Commercio o sia di Economia Civile have hundreds of Greek and Latin sentences, languages that Genovesi mas-tered—he taught both in Latin and in Italian. In his Lezioni we find he quotes Cicero about 10 times, which becomes 45 in the Diceosina (a title that is an Italianization of the Greek “On the Just and Honest”); quotes Plato 40 times in Lezioni and 50 times in the Diceosina. He quotes Aristotle respectively 50 and 42 times, Homer about 30 times in each, Aquinas 10 times in the Diceosina and once in the Lezioni, and we could continue with tens of other Latin and Greek philosophers, poets, and historians. Counting quotations is not, in general, the best tool for determining the influences of one author on another. But when one finds hundreds of direct quotations of Latin and Greek authors on eu-daimonia and felicitas publica, and zero quota-tion of Wolff in either Lezioni or Diceosina, it becomes heroic to find serious bases for think-ing and even writing that “Genovesi’s particular version of natural law was deeply influenced by Wolff’s.”31 Genovesi was surely influenced by the natural law tradition, but his influences were the authors Locke, Grotius, Shaftsbury, Althusius; most of the modern philosophers including (essentially) Rousseau, Montesquieu; and the
French authors Mélon, Cary, and Vico. These were the fundamental references for Genovesi’s philosophy and for his civil economy (and totally absent in D’Onofrio’s reading). Among those, Genovesi surely knew the work of Wolff and maybe the Cameralist tradition,32 but from this, to arrive at the statement that Civil Economy was nothing new in Modern Europe, and that Genovesi was just repeating or applying northern or even Cameralist authors (or just a late mercan-tilist33) is unjustified, incorrect, simply wrong.
Furthermore, the concept of felicitas publica is a typical Latin concept. It is not the English happiness, even less the German glück that refers directly to good luck or fortune (happiness comes from hap, to happen). The prefix fe- in the word felicitas is the same of fecundus, femina, fetus, ferax. Felicitas then recalls the concept of fecundity, and hence the cultivation of humanity and virtues. The Latin verb feo means to produce. In the Roman culture infelix designates the sterile tree, and felix as the fertile one. Felicitas, then, means bringing fruits, something very different from good fortune. In the coins of Roman republic, it was very common to put in one side the inscription felicitas publica. But in the other side of those coins the icons were children, agriculture tools, women: life, genera-tion, cultivation.
Therefore, there is a strong continuity between the Roman pubblica felicità and the Aristotelian eudaimonia.
This Roman tradition of felicitas publica re-mained very alive in the European Middle Ages, and experienced a new revival during the Italian civil humanism of the 15th century and later in the Renaissance, when Roman civilization returned to play a central role. It was also very present and central in Vico, Genovesi’s master. Thus, Genovesi and Muratori had a direct link to the Roman tradition; no need to imagine or invent a North passage. Middle Age, comuni and the civiltà cittadina, civil humanism and his

W O R L D H A P P I N E S S R E P O R T 2 0 1 6 | S P E C I A L R O M E E D I T I O N
73
‘invention’ of Vita civile and Vita activa were alive and active in Italy in the 18th century. Felicitas publica and the civitas were in the DNA of modern Italian civilization, culture, philosophy.
That public happiness was an identity element in the Italian tradition of civil economy is evi-dent when one considers the titles of many books by Italian economists in the second half of the 18th century: Palmieri, Bianchi, Paoletti, and Verri, among others. Achille Loria, maybe the most influential Italian economist of the end of 19th century, wrote: “All our [Italian] economists, from whatever regional background, are dealing not so much, like Adam Smith, with the wealth of nations, but with Public Happiness.”34 The Neapolitan philosopher Paolo Mattia Doria’s book, Della vita civile,35 (a clear “civic humanist” heading) had an influence on Genovesi’s thought and that of the Neapolitan School in general. The book begins with the following words: “Without a doubt, the first object of our desire is human happiness.” And Pietro Verri: “The discussion on happiness has as its object a very common argument upon which many have written.”36 Was all this movement just an impor-tation or repetition of what Cameralists were doing in Germany? Obviously not.
Second, the idea of happiness in Genovesi is not only the “public happiness” in Muratori’s sense. Muratori’s conception of public happiness37 was present in all Europe at least since the old Romans. In Genovesi, there is also another idea of happiness, more ‘horizontal,’ directly linked to his vision of the person as a relational entity, and to the crucial role he assigned to interper-sonal relationships in human well-being. It would be enough to read his books—that, I know, are too huge and difficult to be read entirely and carefully: summaries and secondary literature are much easier—to find an impres-sive degree of attention to the Aristotelian idea of happiness related to interpersonal relation-ships, where the ‘happiness of others’ is essen-tial to one’s own happiness: “The more you work for interest, the more you must be virtuous,
unless you are a fool. It is a universal law that we cannot make ourselves happy without making others happy as well.”38
Wealth or Happiness of Nations?
Modern political economy is supposed to have been a by-product of the modern need to make the search for wealth and individual self-interest socially and morally legitimate. However, before Adam Smith published his Wealth of Nations in 1776, in which he defined wealth as the subject of a newborn discipline, a different approach had gained ground. In the mid-18th century in the French and Italian traditions, the issue placed at the core of modern economic reflection was “public happiness.” The first author who used the expression pubblica felicità as the title of one of his books was the Italian philosopher Ludovico Antonio Muratori (On Public Happi-ness) in 1749, and after him the term ‘happiness’ appeared in the title of many books and pam-phlets by Italian economists of that time: exam-ples include Giuseppe Palmieri’s 1788 Reflections on the Public Happiness, Pietro Verri’s 1781 Discourse on Happiness, and others. Happiness became a landmark of the Italian classical civil economy. The eighteenth-century Italian tradi-tion was in continuity with civic humanism, and with the idea in particular that comes from the Aristotlotelian-Tomistic tradition that happiness is ‘social’ by nature—man is a social animal and therefore, as Aristotle wrote, the “happy man needs friends.”39
It should also be noted that in Italy the theme of public happiness was coupled with the idea of ben-vivere sociale (the social weal), an association that had been characteristic of the Italian civic humanist tradition, from Francesco Petrarca to Leon Battista Alberti and Lodovico Antonio Muratori. A special Neapolitan echo of that tradition stayed alive in Naples, thanks to Giam-battista Vico, Pietro Giannone, and Paolo Mattia Doria.40 Some years later, in France, philoso-pher-economists such as Rousseau, Linguet,

74
Maupertuis, Necker, Turgot, Condorcet, and Sismondi all gave happiness a place in their analyses, and the felicitè publique was one of the key ideas of the French Enlightenment move-ment: “The mass of the [English] nation seems to forget, as do philosophers, that the increase in riches is not the end of political economy, but the means by which to provide the happiness for all.”41
Sismondi’s thesis has to be circumstantiated. In fact, if it is true that Smith or Ricardo did not attribute a central place in their economic theories to happiness, the issue of happiness was still far from absent in the British debate of their time. It suffices to remember that classical Utilitarianism was an offspring of that intellec-tual climate.42
Smith’s position is well-known. In his Theory of Moral Sentiments (TMS), one can find the classi-cal (Aristotelian) idea of happiness as the final goal of human life.43 Human happiness does not present a peculiar characteristic for human beings in respect of other creatures, and under the Stoic influence happiness is defined as “tranquillity and enjoyment.”44 Smith does not emphasize the idea that happiness is related to interpersonal relationships, although his moral system is built on relational categories such as “fellow-feeling” —categories absent, however, in his economic theory of wealth.
The key idea in the relationship between wealth and happiness is that wealth is instrumental to happiness; wealth is just a means for being happy,45 a thesis not far from the classical one. However, Smith’s vision of happiness in rela-tion to the economic field is more complex than the simple equivalence of more wealth = more happiness. The argument runs as follows: The emulation of the wealth and greatness of the rich is the engine of both social mobility and economic development. So the “poor man’s son” submits “to more fatigue of body and more uneasiness of mind [...] he labours night
and day to acquire talents superior to all his competitors.”46
This dynamic, however, is based upon a decep-tion; namely, the idea that the rich man is happier than the poor, or that he possesses “more means for happiness.”47 In reality, this is not true, but it is the engine of social and eco-nomic development (by means of the “invisible hand” argument). This ‘good deception’ (for the common good) is the core of Smith’s theory of the invisible hand.
Smith’s illustration of the workings of deceived human imagination is a piece of psychological analysis that finds its completion in the descrip-tion of the real and actual condition of the rich, as people paradoxically sharing the same lot as the poor:
It is to no purpose, that the proud and unfeel-ing landlord views his extensive fields, and without a thought for the wants of his breth-ren, in imagination consumes himself the whole harvest that grows upon them. The homely and vulgar proverb, that the eye is larger than the belly, never was more fully verified than with regard to him. The capacity of his stomach bears no proportion to the immensity of his desire, and will receive no more than that of the meanest peasant.”48
The fate of the rich, in fact, is merely that
“they only select from the heap what is most precious and agreeable. They consume little more than the poor, and in spite of their natural selfishness and rapacity, though they mean only their own conveniency, though the sole end which they propose from the labours of all the thousands whom they employ, be the gratification of their own vain and insatia-ble desires, they divide with the poor the produce of all their improvements. They are led by an invisible hand to make nearly the same distribution of the necessaries of life,
W O R L D H A P P I N E S S R E P O R T 2 0 1 6 | S P E C I A L R O M E E D I T I O N
75
which would have been made, had the earth been divided into equal portions among all its inhabitants, and thus without intending it, without knowing it, advance the interest of the society, and afford means to the multipli-cation of the species. When Providence divided the earth among a few lordly masters, it neither forgot nor abandoned those who seemed to have been left out in the partition. These last too enjoy their share of all that it produces. In what constitutes the real happi-ness of human life, they are in no respect inferior to those who would seem so much above them. In ease of body and peace of mind, all the different ranks of life are nearly upon a level, and the beggar, who suns him-self by the side of the highway, possesses that security which kings are fighting for.49
Smith’s use of the invisible hand metaphor in the TMS parallels the logic of the happiness paradox in the current literature. In Smith’s moral theory, the rich and the ambitious are moved by frivolous and temporary illusions. “Power and riches50 appear then to be, what they are, enor-mous and operose machines contrived to pro-duce a few trifling conveniences to the body . . . which in spite of all our care are ready every moment to burst into pieces, and crush in their ruins their unfortunate possessor.”51
In the Wealth of Nations, the issue of happiness is almost totally absent. The title of the book itself defines the object of the newborn political econo-my: it deals with wealth not with happiness, even if in Smith’s choice of the word ‘wealth’ instead of ‘riches’ one can rightly see the idea that wealth (weal or well-being) is more and something different from simply possessing riches.
Malthus’s happiness of nations
Malthus, “the first of the Cambridge’s econo-mists” as J.M. Keynes defined him,52 followed a different path. His Essay on Population53 reserves an important role for happiness, a word that
appears even in the title of the second, 1803 edition of the book.54 In a very central passage he writes:
The professed object of Dr. Adam Smith’s inquiry is the nature and causes of the wealth of nations. There is another inquiry however perhaps even more interesting, which he occasionally includes in his studies and that is the inquiry into the causes which affect the happiness of nations [...]. I am sufficiency aware of the near connection of these two subjects and that the causes which tend to increase the wealth of a state tend also, gener-ally speaking, to increase happiness […]. But perhaps Dr Adam Smith has considered these two inquiries as still more nearly connected than they really are.55
From this sentence, we have the main elements to understand the key points of Malthus’ idea of happiness and his evaluation of Smith’s posi-tion. To Malthus, happiness is not wealth, but in general, he agrees with Smith that more wealth leads to more happiness. According to Malthus, however, Smith was not sufficiently aware that the relation between these two concepts is complex and worth investigating on its own: he was aware, then, of the ‘happiness transforma-tion problem.’ In particular, Malthus belongs to those economists (Sismondi, Genovesi, and many Italians) who thought that “the happiness of the nations” was “another inquiry however, perhaps still more interesting” than that of wealth, as the modern theorists of happiness also think.
It is important to notice, however, that Malthus’s wish to directly study happiness as the object of political economy did not last long. In his Principles of Political Economy,56 there are no references to happiness, and the object of his inquires becomes wealth, as in Smith and the classical mainstream tradition of economics. (Something similar will occur also for Marshall, as we will see later). In particular, although Malthus was fully aware that by focusing on the

76
material and quantitative aspects of human interactions, political economy was losing important elements of well-being, he left outside all interpersonal dimensions of wealth:
A man of fortune has the means of [...] collect-ing at his table persons from whom he is likely to hear the most agreeable and instruc-tive conversation […]. It would not be denied, that these are some of the modes of employ-ing wealth, which are always, and most justly, considered as much superior in respectability, to the purchase of fine clothes, spending on furniture, or costly jewels […]. But it is a wide step in advance of these concessions, at once to place in the category of wealth, leisure, agreeable conversation […]. The fact really is, that if we once desert matter in definition of wealth, there is no subsequent line of demar-cation which has any tolerable degree of distinctness, or can be maintained with any tolerable consistency, till we have included such a mass of immaterial objects as utterly to confuse the meaning of the term, and render it impossible to speak with any approach towards precision, either of the wealth of different individuals, or different nations.57
In the Cambridge tradition, however, Malthus’s issues remained alive.
Alfred Marshall’s analysis of happiness, an expression that he uses synonymously with well-being, is strictly interrelated with his theory of sociality in economics. It is well-known that Marshall made room for altruism in his eco-nomics, denying, in contrast with economists such as Pantaleoni,58 that individualistic self-in-terest is an essential requisite of economic science. He wanted to study the “man in flesh and blood,” and therefore, any human dimen-sion could theoretically find its place within his economics.59 The only limitation of the econom-ic domain for Marshall is the possibility of monetary measurement of economic variables. Therefore, economic goods are those that “can be measurable by a money price.”60 It is a
methodological operation very close to that performed by Malthus in shaping the boundar-ies of economic wealth.
A few pages earlier we introduced Malthus’s position on happiness: Apart from the reference to a direct study of happiness that one can find in the Essay, we have shown that he sharply spotted the distinction between happiness and wealth, although in his economic analyses he chose to deal with wealth and only indirectly with happiness. This approach, by the founder of the Cambridge tradition, was continued by Marshall and his school (Pigou in particular). Marshall, opening his Principles, wrote:
“Political economy or economics is a study of mankind in the ordinary business of life; it examines that part of individual and social action which is most closely connected with the attainment and with the use of the materi-al requisites of well-being. Thus it is on the one side a study of wealth; and on the other, and more important side, a part of the study of man.”61
In this, Marshall was a really ‘neo’-classical, his approach fully in agreement with Malthus. Given his moral approach to economics, partially inherited from Ruskin and Carlyle, and his concern for poverty, he was very aware of the complexity of the happiness/wealth relationship. From the above passage, significantly placed at the beginning of his Principles, we get the basic elements of Marshall’s vision of economic agency: Economics does not deal directly with “well being” (which to Marshall is a substitute for happiness), but with the “material requisites” of it. We do not find the word happiness anymore, (which in England was linked to the utilitarian and hedonistic philosophy, from which Marshall wanted to distance himself). There is, however, the expression “well-being” (not completely new among economists of his time), later translated by his
follower Pigou into “welfare,” the key-cate-
gory of his Economics of Welfare.62

W O R L D H A P P I N E S S R E P O R T 2 0 1 6 | S P E C I A L R O M E E D I T I O N
77
The ‘material requisites’ of well-being essentially consist of ‘wealth’, in line with the Smithian classical tradition.
In the ‘Introduction’ to the Principles we also find the theoretical key for understanding Mar-shall’s idea of the relationship between happi-ness and wealth: “It is true that in religion, in the family affections and in friendship, even the poor may find scope for many of those faculties which are the source of the highest happiness. But the conditions which surround extreme poverty, especially in densely crowded places, tend to deaden the higher faculties. Those who have been called the Residuum of our large towns have little opportunity for friendship; they know nothing of the decencies and the quiet, and very little even of the unity of family life; and religion often fails to reach them.”63
Happiness, to Marshall, depends largely on extra-economic factors that are not wealth in the usual economic sense; and that do not pass through the market, such as religion, and, mainly, genuine interpersonal relationships, such as family affections and friendship. We still find in Marshall the classical (Aristotelian in particular) idea that happiness does not coincide with wealth, and also that happiness has a social nature.64
Anyone who knows Amartya Sen’s theory of the ‘the standard of living’65 will find a strong consonance between the two Cambridge economists: It is quite easy to be persuaded that being happy is an achievement that is valuable, and that is evaluating the standard of living, happiness is an object of value (or a collection of object of value, if happiness is seen in a plural form). The interesting ques-tion regarding this approach is not the legiti-macy of taking happiness to be valuable, which is convincing enough, but its exclusive legitimacy. Consider a very deprived person who is poor, exploited, overworked and ill, but who has been made satisfied with his lot by
social conditioning (trough, say, religion, political propaganda, or cultural pressure). Can we possibly believe that he is doing well just because is happy and satisfied? Can the living standard of a person be high in the life that he or she leads is full of deprivation? The standard of life cannot be so detached from the nature of the life the person leads.66
Marshall’s line of thought was followed by his heir in Cambridge, Arthur Cecil Pigou, who moved the fulcrum of the issue at hand toward the other magic word in economics: welfare. In his Economics of Welfare, Pigou states that he intends to deal only with the economic aspects of general welfare (what he calls “economic welfare”), or that part of total welfare that “can be expressed, directly or indirectly, by a money measure.”67
In this choice, that per se is legitimate; there was an important missing link: analysing how, and if, economic goods may become happiness, or well-being (without adjective). In fact, what we see today in the debate on economics and happi-ness is that the efforts to acquire material goods have systematic negative effects on the other com-ponents of wealth—in particular interpersonal relationships—and more income can lead (as the growing literature on the paradox of happiness shows) to less well-being. Such a line of thought was also developed by Keynes, in particular in his Economic Perspectives of our Grandchildren, where he distinguished between “basic” and “relative” (or relational) needs.68 To Keynes, economic or material growth can properly satisfy the basic needs, but the relative ones have only a tiny and indirect connection with income.
In Marshall’s Principles, however, there is also an intuition of this possible inverse (and perverse) tendency that was completely ignored by the founders of contemporary economics. It is his theory of the “standard of life,” the last chapter of his Principles.

78
In this chapter, with a full Aristotelian flavor, states that “the true key-note of economic prog-ress is the development of new activities rather than new wants,”69 specifying that the question that “is of special urgency in our generation” is “the connection between changes in the manner of living and the rate of earning.”70
In order to analyze this urgent question, he distinguishes between two concepts: “the stan-dard of life” and “the standard of comfort,” where “the standard of life is taken to mean the standard of activity adjusted to wants”71 and “the standard of comfort [is] a term that may suggest a mere increase of artificial wants, among which perhaps the grosser wants may predominate.”72,73
The main reason is clearly stated here for why the political economy avoided dealing with the interpersonal, qualitative aspects of economic transactions. Malthus was convinced not only that “enjoying conversations” with friends was an important, “superior” form of using wealth, but even that “leisure and agreeable conversa-tions” can rightly be considered components of a person’s wealth and welfare. However he considered these components too ill-defined to include them in the economic domain, which required data and objective measurement. I.e., needs ‘matter’—a methodological position very close to the Austrian school of Menger at the end of 19th century. Something had to be sacri-ficed at the altar of the new science of objective and scientific measurements, and one victim was the social and immaterial components of wealth. A science seeking to encompass the first “scientific” reflections on economic relations chose to concentrate its analyses upon objective elements such as labour value or redistribution of income. Such a science, however, does not have the tools to study the “happiness of na-tions,” as the young Malthus claimed.
Bentham and the New Name of Happiness
Cambridge’s approach to happiness did not become mainstream in England, nor in neoclas-sical economics. The University College, where Bentham founded the Utilitarian tradition and Jevons studied economics, took the lead. In fact, it is impossible to reconstruct the evolution of the idea of happiness in economics without taking into account Utilitarianism, built around the golden rule, “The greatest happiness for the greatest number.”
In Bentham’s idea of happiness, we immediately see that in his system, happiness is equal to “pleasure.” This comes straight from the very first lines of his An Introduction to the Principles of Morals and Legislation: “Nature has placed mankind under the governance of two sovereign masters, pain and pleasure.”74
The Benthamite vision of happiness can there-fore rightly be called psychological hedonism, having an individualistic nature; people are depicted as seekers of happiness-pleasure. This psychological feature is essential to the Utilitari-an programme in which social happiness is seen only as an aggregation, a sum of individual pleasures. John Stuart Mill, who on happiness diverges deeply from Bentham and from his father, James, in his Utilitarianism, explicitly states that in early Utilitarianism there was an identification between pleasure and happiness: “By happiness is intended pleasure.”75
Bentham’s other key word is “utility” (from which the term Utilitarianism came). His “principle of utility” (inherited from Beccaria’s Dei delitti e delle pene) is stated, appropriately, on the first page of his introduction to be “founda-tion of the present work.”76 In all Bentham’s works, the words happiness, pleasure, and utility are used interchangeably as different ways of expressing the same basic concept of Utilitarian-ism. In chapter I of An Introduction to the Princi-ples of Morals and Legislation, he wrote that by

W O R L D H A P P I N E S S R E P O R T 2 0 1 6 | S P E C I A L R O M E E D I T I O N
79
utility he meant “that property in any object, whereby it tends to produce benefit, advantage, pleasure, good or happiness.”77
With Bentham, the distinction between end (happiness) and means (wealth) disappeared. Happiness-pleasure also became the direct end of economic actions. Bentham’s approach to happiness, therefore, is far from both the classi-cal vision of happiness (from Aristotle to Genovesi) and the Cambridge tradition that kept the distinction between happiness (the final end) and wealth.
Bentham’s methodological project, as is well-known, nurtured economics, thanks mainly to the works of Jevons and Edgeworth. Most of the leaders of the new economics based their subjec-tivist approach to economics on a hedonistic philosophy. In Edgeworth’s early works up to his Mathematical Physics,78 the Utilitarian and hedonist philosophy had a great impact. To him, happiness means pleasure, and maximizing happiness means maximizing pleasure.79 Happi-ness entered neoclassical economics fully identified with utility, the new subject of the new economics. Jevons not only states the old Utili-tarian thesis that happiness is related to utility, but also that economics is the “calculus of pleasures and pain.80 To Jevons, pleasures are different “only in degree, not in kind.”81 Eco-nomics deals with the “lowest” pleasures, and he does not exclude the fact that that men can renounce pleasures from the economic domain for the sake of ethical or superior pleasures, but as in Bentham, his ethical rule is to maximize the sum of pleasures, both individually and socially. In the Theory he states: “The theory which follows is entirely based on a calculus of pleasure and pain and the object of economics is to maximize happiness by purchasing pleasure as it were, at the lowest cost of pain.”82 For British marginalist economists, economics became the science of the direct analysis of happiness/pleasure. The domain of economics was no longer wealth, but happiness/pleasure directly. While the classical economists were
dealing with objective, external aspects (“materi-al prerequisites”), Jevons or Edgeworth econom-ics came back to a “subjective” approach; the domain of economics is inside man’s mind.
Contemporary rational choice theory (based on the preference-satisfaction approach) is, from a methodological point of view, a continuation of the Benthamite approach: “The analysis as-sumes that individuals maximize welfare as they conceive it.”83 Contemporary rational choice theory is far from the classical/neoclassical economists and very close to Bentham or Jevons (more than they thought: Consider Hicks’ and Samuelson’s battle against hedonism in eco-nomics in the 1930s). Why? First, as for Jevons, the domain of economics is maximizing plea-sure (preferences); second, the place of pleasure has been taken by preferences-satisfaction, but the core elements of the utilitarian approach are still there:
(a) The domain of economics is no longer wealth or economic welfare (the material prerequisites), but to directly bring about happiness, which can be translated into concepts such as pleasure (old marginalists), ordinal utility or preferences (Hicks), or choices (Samuelson);
(b) The tools utilized for studying the ‘means’ (maximization, quantitative calculus, instru-mental rationality) are now used for specifical-ly studying ‘happiness.’
After Bentham, happiness/pleasure became the object of economics; therefore, it is not true that happiness is not central in neoclassical econom-ics. The reductionism of happiness/eudaimonia to utility/pleasure is the real breaking point in the history of happiness in economics: the distinction between material prerequisites and happiness. Cambridge’s and classical political economy’s cornerstone, has been lost.

80
Conclusion: Relational Goods
Cambridge’s epistemology was potentially open to making space for the analysis of some aspects of happiness within economics; the mainstream, however, has followed a completely different path, and the present resurgence of the ‘paradox of happiness’ is an eloquent sign that during the 20th century, mainstream economics has lost the methodological categories for even understand-ing the ‘happiness transformation problem.’
The reasons are many. The most obvious is the cultural atmosphere of the 1930s when modern microeconomics came to life. It was so much influenced by neo-positivism and behaviourism that it disregarded Marshall’s social consider-ations, and at the same time welcomed Paretian positive economics.
The word richness is a distant derivative of rex in Latin (king), therefore it has to do with power and even with disposing of people through money and goods. To possess riches has always been, and is still, deeply connected with the possession of people; the border line where democracy turns into plutocracy (the rule of the rich) is always quite faint, fragile, and lit-tle-guarded by those sentinels who are not paid by the plutocrats.
But richness also means wealth, and this English word comes from weal, meaning well-being, prosperity, individual and collective happiness. Adam Smith chose to use the word wealth (and not riches) for his economic study The Wealth of Nations also to suggest that economic richness is something more than the mere sum of material goods or our GDP.
From the second half of the 19th century, the tradition of pubblica felicità became an under-ground river, and the old idea of well-being understood as wealth gradually disappeared. And so in the whole of the West, the semantic range of richness became much poorer—and so
did we. We have created a financial type of capitalism that generated much of the wrong ‘richness’ that did not improve our lives or that of the planet. Then, maybe, the tradition of pubblica felicità can still have something import-ant to say.
One field, particularly relevant, where the tradition of public happiness/eudaimonia is alive again (almost always implicitly) is the recent debate on relational goods.
Thanks also to the emergence of both experimen-tal and behavioral economics, words typical of the civil tradition have been brought back to economic theories and models. Reciprocity, trust, intentions, fairness, esteem, and similar concepts can nowa-days be found even in the top economics journals, showing that something new really is going on.84 More generally, psychological studies offer plenty of data on the importance of relationality on happiness and life satisfaction, and these, more and more, are influencing the economics and happiness debate. There has been increasing appreciation within psychology of the fundamen-tal importance of supportive interpersonal rela-tionships for well-being and happiness. Especially within the eudaimonic approach, many authors see a universal association between the quality of relationships and well-being: “Evidence support-ing the link of relatedness to SWB is manifold. Studies suggest that, of all factors that influence happiness, relatedness is at or very near the top of the list ... Furthermore, loneliness is consistently negatively related to positive affect and life satis-faction.”85 Ryff et al.86 also reviewed evidence that positive relations predicted physiological function-ing and health outcomes: “Central among the core criterial goods comprising optimal living is having quality ties to others. Across time and settings, people everywhere have subscribed to the view that close, meaningful ties to others is an essential feature of what it means to be fully human.”87, 88
In economic theory, the new concept of relation-al goods is slowly but steadily emerging.89

W O R L D H A P P I N E S S R E P O R T 2 0 1 6 | S P E C I A L R O M E E D I T I O N
81
Uhlaner defined them as goods that “can only be ‘possessed’ by mutual agreement that they exist after appropriate joint actions have been taken by a person and non-arbitrary others.”90 Rela-tional goods are goods (in the economic sense) that cannot be produced, consumed, or acquired by a single individual because they depend on interaction with others, and are enjoyed only if shared with others. According to Uhlaner, “goods which arise in exchanges where anyone could anonymously supply one or both sides of the bargain are not relational.”91
In a study based on the data of World Values Survey,92 we found robust evidence about the nexus between happiness and relational goods. For example, membership of a voluntary organi-sation—used as a proxy for relational goods—is associated with a statistically significant in-crease in life satisfaction. It is interesting to observe that the effect of volunteering on life satisfaction is quantitatively the same as that of moving up by one decile in the income scale. These results suggest that the relational compo-nent of participation in voluntary organisations, represented by the actual interaction with other people, has an independent positive effect on life satisfaction. Furthermore, time spent with the family has the largest effect on life satisfac-tion, and time spent with friends and with people from sport activities have positive and significant coefficients.
To conclude we are convinced that, in contempo-rary market societies, the idea of a sharp separa-tion between market relations (seen as the domain of instrumental dealings) and non-mar-ket ones (conceived as the realm of reciprocity and genuine sociality) is not very useful for imagining a good society. Markets today occupy most of the social areas formerly covered by family, church, or community. Quality of life, perhaps, could improve if we also begin to conceive of market relations as a form of friend-ship, or of reciprocity, and then if we design civil institutions that could make this possible.
The aim of this paper is to suggest: “Complicate happiness.” More to the point, one stream of the tradition of economic science said that the experience of self-reported happiness is impor-tant, but is not enough for a good life: An Aristo-telian-inspired approach would say that it is important what we feel but even more, what we do with our freedom, rights, and capabilities that contribute to human flourishing even though they are associated with suffering and pain.
Finally, scholars of happiness—almost all econo-mists—are in continuity with the Benthamite idea of happiness. “I use the terms happiness, subjective well-being, satisfaction, utility, well-being, and welfare interchangeably.”93 For Frey and Stutzer, “Happiness research in Eco-nomics takes reported subjective well-being as a proxy measure for utility.”94 Ruut Veenhoven “use[s] the terms ‘happiness’ or ‘life satisfaction’ for the comprehensive judgement.”95 Subjective happiness is certainly important, but it alone is not sufficient to evaluate the goodness of life: the evaluation of well-being cannot be entrusted solely to self-evaluation.
Then, there is a tension and conflict between different dimensions of good human life: happi-ness (even Aristotle’s eudaimonia) is not everything. In modern times, there are other “ultimate ends”: freedom, dignity, the happiness of children. To be aware of this tension is a promising way for the future developments of happiness studies.

82
1 Ruskin (1862).
2 Bruni (1558).
3 Marshall (1945, pp. 3–4).
4 Bruni and Sugden (2013).
5 For a recent discussion on happiness paradox, its interpreta-tions and limits, see Easterlin (2015).
6 The paper is an elaboration and development of Bruni (2016). See also Bruni and Zamagni (2016).
7 This session is based on Bruni (2006).
8 In Greek philosophy there are many words for expressing the concept of what we now call in English happiness. In particular, the happy man is called Makar, Eudaimon, Olbios, or Eutyches. Nevertheless, in Plato, Aristotle, and also for Epicurean and Stoic philosophers, eudaimonia was by far the most used term (in the Gospels, the most used term was instead makar).
9 Aristotle, Nicomachean Ethics (NE), I, 4, 1095a.
10 Nicomachean Ethics (NE), I, 7, 1097a.
11 NE, I, 8, 1099a.
12 Nussbaum (2005, p. 171).
13 NE, I, 5, 1095b.
14 Following the same line of thought, the “Aristotelian” Thomas Aquinas wrote that the dilectatio (pleasure) is the very accidens of the virtuous life. The relationship between happiness and pleasure is conceived by the Aristotelian theory in a substantially different way than by hedonism and Utilitarianism.
15 NE, I, 8, 1099a.
16 I, 4, 1095a.
17 I, 9, 1099b.
18 I, 9, 1099b.
19 NE, IX, 9, 1169b.
20 We can’t help but recall Raffaello’s masterpiece, “The School of Athens”, as a splendid icon of these two souls of Greek philosophy. Plato, with Timaeus under his arm, pointing to the sky, expresses the contemplation of beauty in itself, while Aristotle, embracing the Nicomachean Ethics, indicates the polis, the civil life.
21 Nussbaum (1986).
22 The entire Ciceronian theory of friendship, later appropri-ated by Medieval monastic ethics (see The Spiritual Friendship by Aelred of Rielvaulx in the twelfth century), was based on the conviction that friendship cannot exist except among virtuous persons (summa amiciitia proprie non est nisi inter bonos). Thomas Aquinas called the virtue-friendship amor amicitiae.
23 Nicomachean Ethics VIII, 1, 1155a.
24 NE VIII, 1, 1155a.
25 This concept is well expressed by Martha Nussbaum: “Mutual activity, feeling, and awareness are such a deep part of what love and friendship are that Aristotle is unwilling to say that there is anything worthy of the name of love or friendship left, when the shared activities and the forms of communication that express it are taken away. The other person enters in not just as an object who receives the good activities, but as an intrinsic part of the love itself. But if this is so, then the components of the good life are going to be minimally self-sufficient. And they will be vulnerable in an especially deep and dangerous way.” (1986, p. 344).
26 It is not by chance, as Nussbaum remarks, that Aristotle gives particular attention to the catastrophes which can happen because of the philia, when he writes about catastrophes. He tries to deal with the problem by defining eudaimonia as a self-sufficient reality that is, however, dependent on other people.
27 Bruni (2012).
28 Smith (1976b, IV, p. 1).
29 See also Bruni (2006, cap. 4); Bruni (2012, 2013).
30 D’Onofrio (2015).
31 D’Onofrio (2015).
32 As De Matteis (1999) notes, Genovesi quotes Walff in his Latin book on philosophy (in 1745).
33 New Palgrave Dictionary of Economics II: 514 (Durlauf and Blume, 2008).
34 Loria (1904, p. 85).
35 Doria (1710).
36 Verri (1963, p. 3).
37 Muratori (1749).
38 Genovesi (2013, p. 449).
39 Aristotle, Nicomachean Ethics.
40 Bruni (2006).

W O R L D H A P P I N E S S R E P O R T 2 0 1 6 | S P E C I A L R O M E E D I T I O N
83
41 Sismondi (1819, p. 52).
42 At the same time, we must however recognize that British classical political economy did not choose public happiness as a direct object of its enquiries, focusing instead on the wealth of nations, its distribution, creation and growth.
43 Smith (1976a, p. 166).
44 Smith (1976a, p. 149).
45 Smith (1976a, p. 166).
46 Smith (1976a, p. 181).
47 Smith (1976a, p. 182).
48 Smith. (1976a, IV, 1, 10).
49 Smith. (1976a, 1, 10).
50 Smith. (1976a, 1, 8).
51 Smith. (1976a, 1, 9).
52 J.M. Keynes (1933, p. 95).
53 Malthus (1966).
54 In fact, the expression ‘Human happiness’ was not present in the first edition of the Essay.
55 Malthus (1966, pp. 303–4).
56 Malthus (1820).
57 Malthus (1820, pp. 31–2).
58 Bruni and Sugden (2007).
59 Marshall (1890, 27–ff.).
60 Marshall (1890, p. 33).
61 Marshall (1890, p. 1).
62 Pigou (1912).
63 Marshall (1890, p. 2).
64 Nevertheless, poverty, even if in itself does not necessarily mean unhappiness, determines those objective conditions that render it very difficult, if not impossible, to develop the dimensions of life and the interpersonal relationships on which happiness actually depends. Therefore, to Marshall the economists’ role in society is very important: to study the ways of increasing wealth or reducing poverty, far from being in contrast with general well-being or happiness, is a means for directly increasing the standard of life by fostering the interpersonal dimensions of life. In this direction goes the fact that Marshall (following the German writers) was the first to use, in the English language, the word ‘good’ for ‘commodity’ in his Principles.
65 Sen (1987).
66 Sen (1987, pp. 7–8).
67 Pigou (1920, p. 16).
68 Keynes (1930).
69 Marshall (1890, p. 688).
70 Marshall (1890).
71 Marshall (1890, p. 689).
72 Marshall (1890, p. 690).
73 A first application of this analysis is Marshall’s recommen-dation to reduce in general the hours of labour, which is likely to cause a little net material loss and much moral good; a case where a reduction of income can lead to a higher standard of life (happiness). At the end of the chapter Marshall explains why: “Even if we took account only of the injury done to the young by living in a home in which the father and the mother lead joyless lives, it would be in the interest of society to afford some relief to them also. Able workers and good citizen are not likely to come from homes, from which the mother is absent during a great part of the day; nor from homes to which the father seldom return till his children are asleep: and therefore society as a whole has a direct interest in the curtailment of extravagantly long hours of duty away from home.” (Marshall 1890, p. 721).
74 Bentham (1996, p. 11).
75 Mill (1963, p. 210).
76 Bentham (1996, p. 11).
77 Bentham (1996, p. 12).
78 Edgeworth (1881).
79 Edgeworth (1881, 7, 16). Jevons (1971) defined economics as the science of utility, explicitly stating his acceptance of the Utilitarian philosophy of Bentham.
80 Jevons (1970, ‘Introduction’).
81 Schabas (1990, p. 39).
82 Jevons (1970, p. 91).
83 Becker (1996, p.139).
84 Bruni and Porta (2016).
85 Deci and Ryan (2001, p. 154).
86 Ryff et al. (2001).
87 Ryff and Singer (2000, p. 30).

84
88 In particular, Ryff and her colleagues show empirical and theoretical evidence on the strict nexus between interper-sonal relationships–health–happiness: “Viewed from the standpoint of interpersonal flourishing and positive health, two key points emerge. First, studies of the beneficial and positive features of social relationships, be they secure attachments in childhood and adult- hood, or loving and intimate relationships in adulthood, are rarely connected to health. Second, when health or biology has entered the picture, it is overwhelmingly on the side of negative social interaction and adverse health consequences, including an expansive array of physiological systems.” (Ryff and Singer, 2000, p. 34). Furthermore, reduction of genuine interper-sonal relationships “predicted incident cardiovascular disease, decline in physical function, and decline in cognitive function.” (ibid: 38).
89 Gui and Sugden (2005).
90 Uhlaner (1989, p. 254).
91 Uhlaner (1989, p. 255).
92 Bruni and Stanca (2008).
93 Easterlin (2001, p.465).
94 Frey and Stutzer (2005, p. 116).
95 Veenhoven (2005, p. 245).

W O R L D H A P P I N E S S R E P O R T 2 0 1 6 | S P E C I A L R O M E E D I T I O N
85
References
Aristotle. (1980). The nicomachean ethics. Oxford: Oxford University Press.
Bartolini, S., Bilancini, E., & Sarracino, F., (2013). Predicting the trend of well-being in Germany: How much do compari-sons, adaption and sociability matter? Social Indicators Research, 114, pp. 169–191.
Becchetti, L., Massari, R., & Naticchioni, P. (2014). The drivers of happiness inequality: suggestions for promoting social cohesion. Oxford Economic Papers 66, pp. 419–442.
Becker, G. (1996) Accounting for tastes. Cambridge, MA: Harvard University Press.
Bentham, J. (1996). An introduction to the principles of morals and legislation. In Burns, J. H., & Hart, H. L. A. (Eds.) Oxford: Clarendon Press. (Original work published 1789).
Bianchini, L. (1845). Della scienza del ben vivere sociale e della economia degli stati. Palermo: Stamperia di Francesco Lao.
Bruni, L. (1558). Aristotelis Stagiritae Politicorum siue de republica libriocto Leonardo Aretino interprete cum D. Thomae Aquinatis explanatione. Venice: VenetiisVenetiis impressum, Lucantonio eredi.
Bruni, L. (2004). The ‘technology of happiness’ and the tradition of economic science. Journal of the History of Economic Thought, 26, 19 –43.
Bruni, L. (2006). Civil happiness. London: Routeledge.
Bruni, L. (2010). The happiness of sociality. Economics and eudaimonia: a necessary encounter. Rationality and Society, 22(4), 383-406.
Bruni, L. (2012). The genesis and ethos of the market. MacMil-lan-Palgrave, London.
Bruni, L. (2015). Economics, wealth and happiness in historical perspective. RISS, 1, 41-56.
Bruni, L. (2016). Public happiness in historical perspectives. Mimeo, Lumsa. Rome.
Bruni, L., & Porta, P. L. (2005). Economics and Happiness Framing the Analysis. Oxford University Press, 366.
Bruni, L., & Porta, P. (2016). Handbook of methods and researches in happiness and quality of life. Edward Elgar Publishing Ltd.
Bruni, L., & Sugden, R. (2007). The road not taken. How psychology was removed from economics, and how it might be brought back. The Economic Journal, 117. pp. 146–173.
Bruni, L., & Sugden, R. (2013). Reclaiming virtue ethics for economics. Journal of Economic Perspectives, 27 (4), 141-64
Bruni, L., & Stanca, L.M. (2008). Watching alone: Relational
goods, television and happiness, Journal of Economic Behavior and Organization.
Bruni, L., & Zamagni, S. (2016). Civil Economy. London: AgendaPub.
Carlyle, T. (1898). Latter-day pamphlets. (Original work published 1850). London: Chapman and Hall.
Deci, R.M. & Ryan, E.L. (2001). On happiness and human potentials: a review of research on hedonic and eudaimonic well-being. Annual Review of Psychology, 52, 141–166.
D’Onofrio, F. (2015). On the concept of ‘felicitas publica’ in eighteenth-century political economy. Journal of the History of Economic Thought, 27, 449-471.
Doria, P. M. (1710). Della vita civile. Augusta: Daniello Höpper.
Durlauf, S.N. & Blume, L. E. (Eds.) (2008) New Palgrave Dictionary of Economics, 2nd edition. Palgrave Macmillan.
Easterlin, R. (2015), Happiness and economic growth – the evidence. In Glatzer, W., Camfield, L., Møller, V., & Rojas, M. (Eds.) Global handbook of quality of life. exploration of well-being of nations and continents. London: Springer.
Edgeworth, F.Y. (1881). Mathematical psychics. London: Kegan.
Edgeworth, F.Y. (1970). Papers related to political economy. New York: Burt Franklin. (Original work published 1927).
Fontaine, P. (1997). Identification and economic behaviour. Sympathy and empathy in historical perspective. Economics and Philosophy, 13, 264-8.
Frank, R. (1999). Luxury fever. New York: The Free Press.
Frey, B., & Stutzer, A. (2002). Happiness in economics. Princeton: Princeton University
Genovesi, A. (2013). Lezioni di commercio o sia di economia civile. Daldegan, F. (Ed.) Milan: Vita e Pensiero (Original work published 1765).
Gui, B. & Sugden, R. (2005). Economics and social interaction, Cambridge: Cambridge University Press.
Henderson, W. (2000). John Ruskin’s political economy. London: Routledge.
Hobbes, T. (1954). Leviathan. London: Dent & Son. (Original work published 1651).
Jevons, W.S. (1970). The theory of political economy. New York: Penguin Books. (Original work published 1871)
Keynes, J.M. (1930). Essays in persuasion. London: Macmillan.
Keynes, M. (1933). Essays in biography. London: Macmillan.

86
Layard, R. (2005) Rethinking public economics: the implica-tions of rivalry and habit. In L. Bruni & P.L. Porta (Eds.), Economics and happiness: Framing the analysis. New York: Oxford University Press.
Loria, A. (1904). Verso la giustizia sociale. Milano: Societa` Editrice Libraria. (Original work published 1893).
Malthus, T. R. (1966). An essay on the principle of population. London: Macmillan. (Original work published 1798).
Malthus, T. (1986). Principles of political economy. Wrigley, E.A., & Souden, D. (Eds.). London: Pickering. (Original work published 1820).
Marshall, A. (1945). Principles of economics. London: Macmil-lan. (Original work published 1890)
Marshall, A. (1927). Industry and trade. London: Macmillan. (Original work published 1919)
Mill, J. S. (1963). Utilitarianism in the collected works of John Stuart Mill, vol. X. Robson, J. M., & Stillinger, J. (Eds.). Toronto: University of Toronto Press and London, Routledge & Kegan Paul. (Original work published 1861).
Moore, G. E. (1903). Principia ethica. London: Macmillan.
Muratori, L. A. (1749). Della pubblica felicità. Lucca [i.e. Venezia].
Ng, Y. K. (1997). A case for happiness, cardinalism, and interpersonal comparability. Economic Journal,107, pp. 1848–58.
Nussbaum, M. (1986). The fragility of goodness: luck and ethics in Greek tragedy and philosophy. Cambridge: Cambridge University Press.
Oslington, P. (2002). John Henry Newman, Nassau Senior, and the separation of political economy from theology in the nineteenth century. History of Political Economy. 33, pp. 825 –42.
Oswald, A. J. (1997). Happiness and economic performance. Economic Journal, 107, 1815 –31.
Palmieri, G. (1788). Riflessioni sulla pubblica felicità relativa-mente al Regno di Napoli. Milano:
Pirotta e Maspero.
Pigou, A. C. (1920). Economics of welfare. London: Macmillan.
Ruskin, J. (1862). Unto this last. London: Smith, Elder and Co.
Ryff, C.D.& Singer, B. (2000) “Interpersonal flourishing: a positive health agenda for the new millennium”. Personality and Social Psychology Review, 4, 30–44.
Ryff, C.D., Singer, B.H., Wing, E. & Love, G.D. (2001).
Elective affinities and uninvited agonies: mapping emotion with significant others onto health. In Ryff, C.D. and Singer, B.H. (eds) Emotion, Social Relationships, and Health: Third Annual Wisconsin Symposium on Emotion, New York: Oxford University Press.
Schabas, M. (1990) A world ruled by numbers: William Stabkey Jevons and the rise of mathematical conomics, Princeton: Princeton University Press.
Sen, A. (1991). The standard of living. Cambridge: Cambridge University Press.
Sen, A. (2000). Development as freedom. New York: A. Knopf.
Sidgwick, H. (1901). The methods of ethics. London: Macmillan. (Original work published 1874).
Sismondi, J., Sismondi, J. C. L. (1971). Nouveaux principes d’economie politique. Paris: Calmann-Lévy. (Original work published 1819)
Smith, A. (1976a). The theory of moral sentiments. Macfie, A. L. & Raphael, D. D. (Eds). Oxford: Oxford University Press. (Original work published 1759).
Smith, A. (1976b). An inquiry into the nature and causes of the wealth of nations. Campbell, R. H., Skinner, A. S., & Todd, W. B. (Eds). Oxford: Oxford University Press. (Original work published 1776).
Uhlaner, C.J. (1989). “Relational goods and participation: incorporating sociality into a theory of rational action”. Public Choice, 62, 253–285.
Veenhoven, R. (2005) Happiness in hardship. In L. Bruni & P.L. Porta. (Eds.) Economics and happiness: Framing the analysis. New York: Oxford University Press.
Verri, P. (1963). Il discorso sulla felicità. Milan: Feltrinelli. (Original work published 1763)

W O R L D H A P P I N E S S R E P O R T 2 0 1 6 | S P E C I A L R O M E E D I T I O N
87
88
LUCA STANCA
Chapter 4
THE GEOGRAPHY OF PARENTHOOD AND WELL-BEING: DO CHILDREN MAKE US HAPPY, WHERE AND WHY?
Luca Stanca, Economics Department, University of Milan-Bicocca, Piazza dell’Ateneo Nuovo 1, 20126, Milan, Italy. E-mail: [email protected]

W O R L D H A P P I N E S S R E P O R T 2 0 1 6 | S P E C I A L R O M E E D I T I O N
89
Executive Summary
This paper investigates the relationship between parenthood and subjective well-being, focusing on cross-country spatial heterogeneity. Using a large sample of individuals from more than 100 countries, we find that life satisfaction is higher, ceteris paribus, among those without children. The negative parenthood premium is stronger for females and it turns positive for older age groups and for widowers. Across countries, the sensitivi-ty of well-being to parenthood is significantly related to macroeconomic conditions: The nega-tive relationship between parenthood and life satisfaction is stronger in countries with higher GDP per capita or a higher unemployment rate.
Introduction
Children are arguably one of the most important parts of life. Yet despite the importance of fertility decisions for households and individu-als, the literature has only recently started to investigate the effects of parenthood on well-be-ing.1 Quite surprisingly, a number of studies indicate that, controlling for economic and socio-demographic characteristics, parenthood is negatively related to subjective well-being.
In a recent paper using individual-level data for 94 countries, Stanca finds that parenthood is negatively related to life satisfaction.2 To shed light on this puzzling finding, the present paper investigates the cross-country distribution of the effects of parenthood on subjective well-being, using a larger sample of individuals and coun-tries from the World Values Survey (WVS). We focus on how parenthood’s effects on subjective well-being at the individual level vary across countries throughout the world. This allows us to investigate the link between country-level socio-economic characteristics and the relation-ship between parenthood and subjective well-being.
The findings indicate a worldwide negative relationship between parenthood and life satis-faction. This relationship is stronger for females, turning positive only for older age groups and for those who have been widowed. At the coun-try level, a negative relationship between parent-hood and life satisfaction is found in 66 percent of the countries under investigation. We do not find evidence of spatial dependence in the cross-country distribution of the effects of parenthood on subjective well-being. The nega-tive effect of parenthood on life satisfaction is significantly stronger in countries with a higher GDP per capita or a higher unemployment rate.
The paper is structured as follows: Section 2 discusses the related literature. Sections 3 and 4 describe the data and methods. Section 5 pres-ents the results. Section 6 presents conclusions.
Related Literature
Until recently, the literature on the determi-nants of happiness has largely neglected the role of parenthood.3 Early studies of the rela-tionship between parenthood and well-being include McLanahan and Adams, Umberson, and Umberson and Gove.4 More recent studies generally obtain mixed findings, which are sensitive to the type of data used, the definition and measurement of the key variables, and the methods of investigation.
Clark and Oswald5 find that parenthood is not associated with well-being in longitudinal analyses, once individual fixed effects are con-trolled for. Nomaguchi and Milkie6 study the effects of parenthood on social integration, self-esteem, self-efficacy, hours of housework, marital conflict, and depression, finding that having children can have positive or negative effects depending on parents’ social position. Tao7 uses data from the Taiwan Panel Study of Family Dynamics to study whether an optimal number of children exists, and find that the
90
number of children is not significantly related to marital happiness. Kohler et al.8 analyze the impact of parenthood on well-being using a data set of monozygotic twins, thus controlling for unobserved characteristics related to genetic dispositions. Their findings indicate that the first child has a large and positive effect on happiness, whereas additional children do not affect happiness. Frey and Stutzer9 and Haller and Hadler10 find a positive relationship between parenthood and well-being.
Hansen et al.11 explore the effects of parental status on a range of psychological well-being outcomes, using individual-level data for Nor-way. Their results indicate that childless women report significantly lower life satisfaction and self-esteem, whereas motherhood is not related to affective well-being. Among men, parental status is unrelated to any well-being indicator. Angeles12 investigates the effects of having children at home on individual happiness, using a large panel of British households from 1991 to 2005. On average, the study finds the number of children negatively related to individual happi-ness, but controlling for individuals’ characteris-tics, the effect is found to be positive. Aassve et al.13 use data from the European Social Survey to study the relationship between parenthood and happiness across European countries. They find a positive and significant association between parenthood and subjective well-being.
More recently, Baetschmann et al.14 investigate the relationship between parenthood and life satisfaction, focusing on the issue of self-selec-tion into motherhood. By exploiting the extend-ed longitudinal dimension of the German Socio-Economic Panel, the study finds that motherhood is associated with substantial positive gains in subjective well-being. In a study closely related to the present one, Stanca15 investigates the effects of parenthood on individ-ual well-being, using World Values Survey data for 94 countries. The results indicate that having children is negatively related to subjective well-being. Controlling for individual character-
istics can only partially explain this finding. The paper shows that the overall negative effect of parenthood on well-being can be explained by a large adverse impact on financial satisfaction, which more than offsets the positive impact on non-financial satisfaction. Nelson et al.16 pro-vides evidence from three studies that aim to test parenthood’s effects on different dimen-sions of well-being. Their results indicate that parenthood is associated with higher levels of happiness, positive emotion, and meaning in life. Yet when Bhargava et al.17 re-examine that analysis, they reach the opposite conclusion (see also the counter-argument from Nelson et al.).18 Hank and Wagner19 use pooled cross-sectional data from the first two waves of the Survey of Health, Ageing, and Retirement in Europe to assess the effects of parenthood on various dimensions of well-being in old-age. The results indicate that childless individuals do not report lower economic, psychological, or social well-be-ing than parents. Pollmann-Schult20 uses data from the German Socio-Economic Panel to investigate the role of the cost of raising children on the relationship between parenthood and life satisfaction. He finds that parenthood has substantial positive effects on life satisfaction, which are offset by the financial and time costs of parenthood.
Herbst and Ifcher21 examine the relationship between parenthood and happiness among US individuals, using data from the General Social Survey and the DDB Lifestyle Survey. Their findings indicate that parents become happier over time relative to non-parents, while non-parents’ happiness declines absolutely, and estimates of the parental happiness gap are sensitive to the time-period analyzed. Beja22 uses individual-level data from the 4th and 5th waves of the World Values Survey to disentan-gle the direct and indirect effects of parenthood on happiness. The findings indicate that par-enthood’s overall impact on happiness is generally negative because the negative indirect impact more than offsets the positive direct effect on happiness.

W O R L D H A P P I N E S S R E P O R T 2 0 1 6 | S P E C I A L R O M E E D I T I O N
91
Table 1. Descriptive statistics, individual-level
Variable Mean Std. Dev. Min. Max. N
Life satisfaction 66.98 24.17 10 100 421782
Happiness 30.48 7.41 10 40 416422
Parent dummy 0.72 0.45 0 1 406842
No children 0.28 0.45 0 1 406842
1 child 0.16 0.37 0 1 406842
2 children 0.27 0.44 0 1 406842
3 children 0.14 0.35 0 1 406842
4 children 0.07 0.25 0 1 406842
5 children or more 0.08 0.27 0 1 406842
Income 4.72 2.38 1 10 379297
Unemployed 0.08 0.28 0 1 416237
Employment: full-time 0.37 0.48 0 1 416237
Employment: part-time 0.08 0.27 0 1 416237
Employment: self-employed 0.10 0.3 0 1 416237
Employment: other 0.02 0.13 0 1 416237
Retired 0.13 0.34 0 1 416237
At home 0.15 0.35 0 1 416237
Student 0.07 0.26 0 1 416237
Education, lower 0.31 0.46 0 1 323386
Education, middle 0.45 0.5 0 1 323386
Education, upper 0.24 0.43 0 1 323386
Married 0.58 0.49 0 1 422675
As married 0.05 0.23 0 1 422675
Divorced 0.04 0.19 0 1 422675
Separated 0.02 0.13 0 1 422675
Widowed 0.07 0.25 0 1 422675
Single 0.24 0.43 0 1 422675
Number of children 1.89 1.78 0 20 406842
Age 41.42 16.47 13 101 423539
Male 0.48 0.5 0 1 423263
Survey wave 1 0.08 0.27 0 1 428055
Survey wave 2 0.15 0.35 0 1 428055
Survey wave 3 0.17 0.38 0 1 428055
Survey wave 4 0.23 0.42 0 1 428055
Survey wave 5 0.20 0.4 0 1 428055
Survey wave 6 0.17 0.38 0 1 428055
Source: World Values Survey (2014).

92
Data
The source for our micro-level data is the World Values Survey (2014), a compilation of surveys conducted in more than 100 countries, repre-senting about 90 percent of the world popula-tion.23 The WVS provides information on indi-vidual beliefs about politics, the economy, religious, social and ethical topics, personal finances, familial and social relationships, happiness and life satisfaction. Within each country, samples are selected randomly from administrative regional units after stratification by region and degree of urbanization. Six WVS waves are currently available (1981–1984, 1989–1993, 1994–1998, 1999–2004, 2005–2009, 2010–2014) for a total of more than 400,000 individual observations.
Summary statistics for all the variables in the micro-level data set are reported in Table 1. Life satisfaction is measured on a 1–10 scale, based on the question, “All things considered, how satisfied are you with your life as a whole these days?”24 Happiness is a four-item ordinal vari-able, based on the question, “Taking all things together, would you say you are: very happy, quite happy, not very happy, or not at all happy?” Income is measured by self-reported deciles in the national distribution of income, so that income levels are expressed in relative terms and are comparable across countries and indi-viduals. Unemployment is one item from a full set of employment dummies that includes the following categories: employed, unemployed, retired, student, at home, part-time, full-time, and other employment. Educational levels are measured by dummy variables for low education (inadequately completed or completed elementa-ry education, incomplete secondary school); medium education (completed technical/voca-tional secondary school, incomplete or complet-ed university/preparatory secondary school); and high education (some university with or without degree/higher education).
The data source for the country-level data is the World Development Indicators database.25 GDP per capita is measured at constant 2000 US dollars. Government expenditure is general government final consumption expenditure as a percentage of GDP. Health expenditure is total health expenditure as a percentage of GDP. The fertility rate is the average number of children born to a woman during her lifetime. Summary statistics for all the variables used in the mac-ro-level analysis are reported in Table 2.
Table 2. Descriptive statistics, country-wave level
Variable Mean Std. Dev.
Min. Max. N
Log GDP per capita 8.38 1.42 5.25 10.8 270
Unemployment rate 9.34 6.34 0.58 36.4 266
Government spending / GDP
16.66 5.02 4.53 28.72 264
Health expenditure / GDP
6.96 2.36 0.01 17.89 258
Fertility rate 2.21 1.11 1.04 6.71 271
Source: World Development Indicators, World Bank (2014).
Methods
As in Stanca26, we model the well-being (WB) of individual i in country j as being linearly related to parenthood status (CH), economic conditions (ECO), and socio-demographic factors (SD):
(1)
where ij is an individual-specific error term and
j is a country fixed effect that captures the
characteristics of the external context.
Well-being is measured with either life satisfac-tion or happiness. Parenthood is measured with either a dummy variable for having children or a set of dummy variables for individual num-ber-of-children categories (between 0 and 5 or

W O R L D H A P P I N E S S R E P O R T 2 0 1 6 | S P E C I A L R O M E E D I T I O N
93
more), in order to allow for possible non-linear relations. Economic conditions are measured by self-reported household income, converted into the corresponding decile in the national income distribution, and employment status. Socio-de-mographic characteristics include age, gender, marital status, and education level. We control for age by using six 10-year age groups (from 15–24 to 65 and above), to allow for possible non-linear relationships.
The characteristics of the external context are controlled for with a set of country dummy variables (
j). The set of regressors also in-
cludes wave-specific dummy variables to ac-count for heterogeneity across the six WVS survey waves. Equation (1) is estimated by Ordinary Least Squares (OLS) for life satisfac-tion and by ordered probit for happiness, to take into account the ordinal nature of the latter dependent variable. We consider esti-mates obtained for the whole sample with and without controlling for individuals’ socio-demo-graphic characteristics (age, gender, income, employment status, marital status, education). Test statistics are based on standard errors robust to heteroskedasticity.
Regarding identification issues, we consider reverse causality to be unlikely, given that par-enthood decisions were generally made several years before subjective well-being levels were reported. Unobserved heterogeneity is instead more likely to be present, as unobservable individual characteristics may determine both self-reported well-being and decisions about parenthood. In the absence of longitudinal data, or appropriate instrumental variables for parent-hood decisions, the causal interpretation of our estimates must be taken with care.27
We then investigate the relationship between parenthood and subjective well-being for each country in the sample. This allows us to investi-gate across countries the link between aggregate socio-economic conditions and the effect of
parenthood on subjective well-being. We there-fore use the estimated sensitivities of life satis-faction to parenthood as the dependent variable in cross-country regressions, where macroeco-nomic and socio-demographic conditions are used as the main explanatory variables.28 We consider both country-specific estimates for the overall sample and country-wave specific esti-mates, which provide us with an unbalanced panel data set (N=106 countries, T=6 survey waves). This allows us to use a fixed-effect estimator, to take into account potentially unob-served heterogeneity in the estimation of the macro-level specification.
Results
We start by presenting results for the overall sample, pooling all countries in the sample as a benchmark. We also consider estimates obtained for the overall sample, controlling for individual socio-demographic characteristics, thus focusing on sub-samples by age, gender, education, and marital status. We then present country-specific estimates of the effect of parenthood on life satisfaction. Finally, we examine the country-lev-el determinants of the relationship between parenthood and life satisfaction.
Do Children Make Us Happy?
Table 3 presents OLS estimation results for equation (1), using life satisfaction as a depen-dent variable, based on the whole sample. To check the robustness of the results, we consider two specifications: one that does not include individual characteristics (columns 1–2), and a second (columns 3–4) that includes a full set of socio-demographic characteristics, as described above (gender, age, marital status, education level, income decile, employment status). The sample size for estimation in the two cases is about 400,000 and 340,000 observations, respectively. For each of these two specifications,

94
we report estimates obtained by using either a single dummy variable for parenthood (columns 1 and 3) or a set of individual number-of-chil-dren dummy variables (columns 2 and 4). We only report coefficient estimates for parenthood variables, as this is the focus of the analysis.
Table 3. Parenthood and life satisfaction, overall
(1) (2) (3) (4)
Parenthood dummy
-0.62** -0.57**
(0.08) (0.13)
1 child -0.50** -0.71**
(0.11) (0.15)
2 children -0.26** -0.62**
(0.10) (0.15)
3 children -0.53** -0.44**
(0.11) (0.16)
4 children -0.90** -0.18
(0.15) (0.20)
5 children and more
-1.79** -0.28
(0.15) (0.20)
Individual-level controls
No No Yes Yes
R2 0.16 0.16 0.21 0.21
Observations 400894 400894 342732 342732
(Dependent variable: Life satisfaction. OLS estimates, het-eroskedasticity-robust standard errors reported in brackets. * indicates p<0.05, ** indicates p<0.01.)
Consistent with the existing literature, the findings indicate that having children is nega-tively and significantly related to life satisfaction. Controlling only for country and survey wave fixed effects, the estimated parenthood life satisfaction premium is -0.62, statistically significant at the one percent level (column 1). That is, on a scale between 1 and 100, life satis-faction is 0.62 lower for those who have chil-dren than for those who do not. This negative premium is virtually unchanged (-0.57), and remains strongly significant, when controlling for individual socio-demographic characteristics
(column 3). The results are even more clear-cut when we use dummy variables to capture the effects of individual number-of-children catego-ries. When compared with the no-children reference group, the life satisfaction of individu-als with a positive number of children is in all cases (1 child to 5 children or more) negative and strongly significant (column 2). Controlling for individual socio-demographic characteristics (column 4), the size of the effect is inversely related to the number of children. The negative effect is large and significant up to 3 children, whereas it is negative but smaller and not significant above this threshold.
Table 4 reports the same set of results for equa-tion (1) in the overall sample, using happiness as a dependent variable and an ordered probit estimator. The relationship between parenthood and happiness is found to be negative (columns 1 and 3), but the estimated coefficients (log-odds ratios) are not statistically significant. When using dummy variables for individual num-ber-of-children categories, without controlling for individual characteristics (column 2), we find a positive coefficient for the one-child or two-children groups, while the effect is negative and significant for the 4-children and the 5-and-above groups. However, controlling for individu-al characteristics (column 4), happiness is not significantly related to any individual num-ber-of-children category.
Table 4. Parenthood and happiness, overall
(1) (2) (3) (4)
Parenthood dummy
-0.01 -0.00
(0.00) (0.01)
1 child 0.02** -0.01
(0.01) (0.01)
2 children 0.02** -0.00
(0.00) (0.01)
3 children 0.00 0.01
(0.01) (0.01)
4 children -0.06** -0.01

W O R L D H A P P I N E S S R E P O R T 2 0 1 6 | S P E C I A L R O M E E D I T I O N
95
(1) (2) (3) (4)
(0.01) (0.01)
5 children and more
-0.10** 0.01
(0.01) (0.01)
Individual-level controls
No No Yes Yes
Pseudo-R2 0.06 0.06 0.08 0.08
Number of observations
398607 398607 341842 341842
(Dependent variable: happiness. Ordered Probit estimates, heteroskedasticity-robust standard errors reported in brackets. * indicates p<0.05, ** indicates p<0.01.)
Let us turn to the role played by personal charac-teristics such as gender, age, marital status, and education level as moderators of the effects of parenthood on well-being. Figure 1 compares the parenthood life-satisfaction premium by gender. Interestingly, the negative relationship between parenthood and life satisfaction is stronger for females than for males (-0.79 and -0.48, respec-tively), and the difference is strongly statistically significant (p<0.01).
Figure 1. Parenthood and life satisfaction, by gender
Figure 2 compares the life-satisfaction parent-hood premium for different age groups. The results clearly indicate that the effect of having children on life satisfaction is positively related to age. We find a strong and significant negative relationship for younger parents (-2.42 and -1.15, respectively, for the 15–24 and 25–34 age groups), while we find a significant positive relationship (1.59) for parents in the over-65 group. The parenthood coefficient is negative for the 35–44 and 45–54 groups and positive for the 55–64 group, but not statistically significant in any of these cases.
Figure 2. Parenthood and life satisfaction, by age group
Figure 3 compares the life-satisfaction parent-hood premium by marital status. Interestingly, the estimated coefficient for parenthood is positive and significant only for those who have been widowed (1.49). It is negative and signifi-cant for those who are married (-0.4), separated (-2.11) or single (-1.40), while negative but not significant for those living as married (-0.66) or divorced (-0.23).

96
Figure 3. Parenthood and life satisfaction, by marital status
Finally, Figure 4 indicates that our finding of a negative relationship between parenthood and life satisfaction is qualitatively robust when estimating equation (1) separately by survey wave, to account for possible changes over time. The parenthood coefficient is positive (but not significant) only in the first wave (1980); it is negative in each of the other survey waves.
Figure 4. Parenthood and life satisfaction, by survey wave
Overall, these results confirm, and extend to a worldwide sample, the finding that ceteris paribus, life satisfaction is higher on average among those without children. No clear-cut relationship is found between parenthood and
happiness. The negative life-satisfaction premi-um for parenthood in the overall sample is larger for females, and turns positive only for older age groups and for widowers.
Where?
Table 5 reports results for equation (1) by country. The estimated coefficients for the life-satisfaction premium of parenthood range from a minimum of -6.82 to a maximum of 5.12. Out of the 105 countries in the estimation sample, 36 display positive coefficients, which are statistically significant only in 9 cases. The five countries displaying the largest life-satisfaction premia to parenthood are Montenegro (5.12), China (4.85), Kyrgyzstan (4.64), Taiwan (3.70), and Vietnam (3.13). At the other extreme, the five countries displaying the largest negative parenthood premia are Macedonia (-6.82), Tunisia (-4.71), Libya (-3.87), Jordan (-3.71), and Zimbabwe (-3.51).
Table 5. Parenthood and Life Satisfaction, by country
Rank Country Coeff. t-stat
1 Montenegro 5.12 3.48
2 China 4.85 3.95
3 Kyrgyzstan 4.64 3.39
4 Taiwan 3.70 2.46
5 Viet Nam 3.13 2.13
6 Guatemala 2.86 1.63
7 Kazakstan 2.53 1.76
8 Kuwait 2.09 1.20
9 New Zealand 2.03 1.83
10 Morocco 1.92 1.38
11 Saudi Arabia 1.88 1.03
12 Estonia 1.64 1.68
13 Latvia 1.62 1.36
14 Venezuela 1.60 1.12
15 Bangladesh 1.59 1.09
16 Slovenia 1.58 1.30
17 Cyprus 1.52 1.10

W O R L D H A P P I N E S S R E P O R T 2 0 1 6 | S P E C I A L R O M E E D I T I O N
97
Rank Country Coeff. t-stat
18 Portugal 1.45 0.91
19 Singapore 1.41 1.27
20 Belgium 1.28 1.20
21 Sweden 0.98 1.12
22 Hong Kong 0.98 0.70
23 Pakistan 0.96 0.82
24 Russian Fed. 0.82 0.90
25 Ireland 0.76 0.58
26 Hungary 0.71 0.56
27 Indonesia 0.68 0.48
28 El Salvador 0.64 0.37
29 Ukraine 0.51 0.47
30 Australia 0.31 0.35
31 Mali 0.25 0.14
32 Palestine 0.22 0.10
33 Norway 0.17 0.17
34 Netherlands 0.15 0.19
35 Belarus 0.08 0.07
36 Rwanda 0.06 0.05
37 Czech Republic -0.02 -0.01
38 India -0.03 -0.03
39 Serbia -0.05 -0.04
40 Yemen -0.05 -0.03
41 Greece -0.09 -0.05
42 Bulgaria -0.11 -0.08
43 United States -0.17 -0.23
44 Dominican Rep. -0.17 -0.08
45 Denmark -0.18 -0.16
46 Austria -0.22 -0.18
47 Moldova -0.24 -0.19
48 United Kingdom -0.27 -0.31
49 Spain -0.30 -0.34
50 France -0.33 -0.29
51 Colombia -0.36 -0.38
52 Armenia -0.36 -0.25
53 Canada -0.41 -0.48
54 Nigeria -0.42 -0.38
55 Switzerland -0.47 -0.47
56 Algeria -0.48 -0.32
Rank Country Coeff. t-stat
57 Andorra -0.49 -0.39
58 Finland -0.51 -0.54
59 Ecuador -0.63 -0.49
60 Iraq -0.68 -0.58
61 Iran -0.77 -0.67
62 Zambia -0.77 -0.54
63 Azerbaijan -0.93 -0.66
64 Ghana -0.95 -0.77
65 Iceland -0.95 -0.83
66 Uganda -0.96 -0.56
67 Italy -0.96 -0.86
68 South Korea -1.00 -0.72
69 Mexico -1.21 -1.25
70 Argentina -1.21 -1.01
71 Germany -1.22 -1.68
72 Bosnia-Her. -1.29 -1.08
73 Egypt -1.29 -1.17
74 Uzbekistan -1.33 -0.83
75 Thailand -1.37 -0.90
76 Uruguay -1.44 -1.30
77 Croatia -1.44 -0.95
78 Turkey -1.47 -1.43
79 Ethiopia -1.52 -1.16
80 Peru -1.69 -1.46
81 Lebanon -1.73 -1.02
82 Japan -1.83 -1.87
83 Slovakia -1.91 -1.49
84 Puerto Rico -1.94 -1.41
85 Brazil -1.95 -1.65
86 Lithuania -2.00 -1.38
87 Luxembourg -2.04 -1.32
88 Malaysia -2.14 -1.60
89 South Africa -2.14 -2.44
90 Philippines -2.22 -1.57
91 Romania -2.25 -2.23
92 Trinidad-Tobago -2.31 -1.98
93 Malta -2.39 -1.57
94 Georgia -2.42 -1.44
95 Tanzania -2.53 -1.42

98
Rank Country Coeff. t-stat
96 Burkina Faso -2.56 -1.65
97 Chile -2.65 -2.60
98 Albania -2.66 -1.50
99 Poland -2.68 -2.29
100 Qatar -3.07 -1.99
101 Zimbabwe -3.51 -2.53
102 Jordan -3.71 -2.34
103 Libya -3.87 -2.63
104 Tunisia -4.71 -2.55
105 Macedonia -6.82 -4.18
Source: World Values Survey (2014).
The estimated parenthood premia reported in Table 5 are mapped geographically in Figure 5. The spatial representation indicates a clustering of large parenthood premia in Asia (China, Kyrgyzstan and Kazakhstan). Relatively smaller (and negative) parenthood premia are observed in Western Europe, Africa, and Latin America. These clustering patterns, however, turn out not be statistically significant when testing for spatial correlation. We do not find evidence of spatial dependence in the cross-country distribu-tion of the effects of parenthood on well-being, using either a spatial lag or a spatial error model, even after accounting for differences in aggre-gate economic and social conditions.29
Figure 5. Parenthood and life satisfaction, world
Figure 6 takes a closer look at estimated parent-hood premia for European countries. A cluster-ing of positive and large parenthood premia is generally observed in Northern Europe (Estonia 1.64, Latvia 1.62, Sweden 0.98, and Norway 0.17) and former Soviet Union countries (Rus-sian Federation 0.82, Ukraine 0.51, and Belarus 0.08). Negative and relatively large parenthood premia are observed in Poland (-2.68), Albania (-2.66), Romania (-2.25), and Turkey (-1.47).
Figure 6. Parenthood and life satisfaction, Europe
Why?
Table 6 reports results obtained by regressing the country-specific sensitivities of life-satisfac-tion to parenthood, reported in Table 5, on indicators of macroeconomic and social condi-tions. We focus in particular on GDP per capita, unemployment rate, government spending relative to GDP, health expenditure relative to GDP, and fertility rate. We consider three alternative specifications. The first (column 1) takes countries as the unit of analysis, thus focusing on averages for the entire time span. The second and third specifications (columns 2-3) focus instead on country-wave specific observations, thus resulting in an (unbalanced) panel data structure (N=106 countries, T=6 survey waves).

W O R L D H A P P I N E S S R E P O R T 2 0 1 6 | S P E C I A L R O M E E D I T I O N
99
Table 6. Determinants of parenthood life satis-faction premium
(1) Cross-sec-
tion
(2) Panel - OLS
(3) Panel - FE
Log GDP per capita
-1.19* -1.73** -2.65**
(0.56) (0.53) (0.65)
Unemployment rate
-0.16* -0.22* -0.29*
(0.08) (0.09) (0.12)
Government spending / GDP
0.04 0.27 0.48
(0.07) (0.17) (0.39)
Health expenditure / GDP
0.02 0.14 0.70*
(0.14) (0.11) (0.34)
Fertility rate -1.15* -1.96** 0.76
(0.48) (0.44) (0.90)
R2 0.44 0.33 0.23
Number of observations
100 235 235
Dependent variable: sensitivity of life satisfaction to parenthood.
As shown in Table 6, the coefficient for GDP per capita is negative and strongly significant in all three specifications. This indicates that the micro-level relationship between parenthood and life satisfaction is more strongly negative (or less strongly positive) in richer countries. The effect of parenthood on life satisfaction is also negatively related to the unemployment rate. Interestingly, the coefficients for government spending and health expenditure are not statisti-cally significant. The coefficient for the fertility rate is negative and significant in the cross-sec-tional and pooled specifications, but positive and not significant when using a fixed-effect estima-tor (column 3).
Overall, these findings indicate that macroeco-nomic conditions primarily account for the cross-country distribution of the micro-level sensitivity of well-being to parenthood. Having
children is worth less, in terms of subjective well-being, in richer countries and in countries where the unemployment rate is higher.
Concluding Remarks
Despite growing interest in parenthood’s effects on well-being, the existing evidence is not conclusive. Previous studies have found differ-ent effects of parenthood on well-being, depend-ing on the type of data used, the definition and measurement of the key variables, and the methods of investigation. To shed light on these findings, we investigated the relationship be-tween parenthood and well-being based on individual-level worldwide data, with a focus on how the effects of parenthood on subjective well-being vary across countries.
Our findings indicate that the relationship between parenthood and life satisfaction is generally negative throughout the world. The parenthood life-satisfaction gap is stronger for females, and turns positive only for older age groups and for widows and widowers. Within countries, a negative relationship between parenthood and life satisfaction is found in 66 percent of the countries under investigation. Across countries, the negative effect of parent-hood on life satisfaction is significantly stronger in countries with higher GDP per capita or a higher unemployment rate. These findings indicate that, on the one hand, having children is valued less, in terms of life satisfaction, in countries where the opportunity cost of time is higher.30 On the other hand, worse labor market conditions enhance the adverse effects of parent-hood’s financial and time costs.31

100
1. See, e.g., Hansen (2012), Kravdal (2014), Nelson et al. (2014a) for recent comprehensive reviews.
2. Stanca (2012).
3. See Di Tella and MacCulloch (2006), Blanchflower (2008), Dolan et al. (2008) for comprehensive reviews.
4. McLanahan and Adams (1987); Umberson (1989); Umberson and Gove (1989).
5. Clark and Oswald (2002).
6. Nomaguchi and Milkie (2003).
7. Tao (2005).
8. Kohler et al. (2005).
9. Frey and Stutzer (2006).
10. Haller and Hadler (2006).
11. Hansen et al. (2009).
12. Angeles (2010).
13. Aassve et al. (2012).
14. Baetschmann et al. (2012).
15. Stanca (2012).
16. Nelson et al. (2013).
17. Bhargava et al. (2014).
18. See also the counter-argument in Nelson et al. (2014b).
19. Hank and Wagner (2014).
20. Pollmann-Schult (2014).
21. Herbst and Ifcher (2015).
22. Beja (2015).
23. World Values Survey (2014).
24. The original variable on a scale 1 (dissatisfied) to 10 (satisfied) was multiplied by 10 in order to ease interpretation of regression results.
25. World Bank (2014).
26. Stanca (2012).
27. Clark and Oswald (2002).
28. See, e.g., Lewis and Linzer (2005), Hornstein and Greene (2012) for a discussion of regression models in which estimated coefficients are used as dependent variables.
29. See Stanca (2010).
30. See also Stanca (2010).
31. Pollmann-Schult (2014).
W O R L D H A P P I N E S S R E P O R T 2 0 1 6 | S P E C I A L R O M E E D I T I O N
101
References
Aassve, A., Goisis, A., & Sironi, M. (2012). Happiness and childbearing across Europe. Social Indicators Research, 108, pp. 65–86.
Angeles, L. (2010). Children and Life Satisfaction. Journal of Happiness Studies, 11(4), 523–538.
Bhargava, S., Kassam, K. S., & Loewenstein, G. (2014). A reassessment of the defense of parenthood. Psychological Science, 25, pp. 299–302.
Baetschmann, G., Staub, K., & Studer, R. (2012). Does the Stork Deliver Happiness? Parenthood and Life Satisfaction (Working Paper Series No. 94). Zurich, Switzerland: Universi-ty of Zurich, Department of Economics.
Beja, E. (2015). Direct and indirect impacts of parenthood on happiness. International Review of Economics, 62(4), 307–318.
Blanchflower, D. (2008). International evidence on well-being (NBER Working Paper No. 14318)
Clark, A., & Oswald, A. (2002). Well-being in panels (Unpub-lished Manuscript). Department of Economics, University of Warwick.
Di Tella, R., & MacCulloch, R. (2006). Some uses of happi-ness data in economics. Journal of Economic Perspectives, 20, pp. 25–46.
Di Tella, R., MacCulloch, R., & Oswald, A. (2003). The macroeconomics of happiness. Review of Economics and Statistics, 85, pp. 809–827.
Dolan, P., Peasgood, T., & White, M. (2008). Do we really know what makes us happy? A review of the economic literature on the factors associated with subjective well-being. Journal of Economic Psychology, 29, pp. 94–122.
Frey, B., & Stutzer, A. (2006). Does marriage make people happy or do happy people get married? The Journal of Socio-Economics, 35, pp. 326–347.
Haller, M., & Hadler, M. (2006). How social relations and structures can produce happiness and unhappiness: An international comparative analysis. Social Indicators Research, 75, pp. 169–216.
Hank, K., & Wagner, M. (2014). Parenthood, marital status, and well-being in later life: Evidence from share. Social Indicators Research, 114, pp. 639–653.
Hansen, T. (2012). Parenthood and happiness: A review of folk theories versus empirical evidence. Social Indicators Research, 108, pp. 29–64.
Hansen, T., Slagsvold, B., & Moum, T. (2009). Childlessness and psychological well-being in midlife and old age: An examination of parental status effects across a range of outcomes. Social Indicators Research, 94, pp. 343–362.
Herbst, C., & Ifcher, J. (2015). The increasing happiness of US parents. Review of Economics of the Household, pp. 1–23.
Hornstein, A., & Greene, W. 2012. Usage of an estimated coefficient as a dependent variable. Economics Letters, 116(3), 316–318,
Kohler, H., Behrman, J., & Skytthe, A. (2005). Partner + children = happiness? The effects of partnerships and fertility on well-being. Population and Development Review, 31, 407–445.
Kravdal, O. (2014). The estimation of fertility effects on happiness: Even more difficult than usually acknowledged. European Journal of Population, 30(3), 263–290.
Lewis, J., & Linzer, D. (2005). Estimating regression models in which the dependent variable is based on estimates. Political Analysis, 13, pp. 345–364.
McLanahan, S., & Adams, J. (1987). Parenthood and psycho-logical well-being. Annual Review of Sociology, 13, pp. 237–257.
Nelson, S. K., Kushlev, K., English, T., Dunn, E. W., & Lyubomirsky, S. (2013). In defense of parenthood: Children are associated with more joy than misery. Psychological Science, 24, pp. 3–10.
Nelson S. K., Kushlev K., & Lyubomirsky S. (2014a). The pains and pleasures of parenting: When, why, and how is parent-hood associated with more or less well-being? Psychological Bulletin, 140(3), 846–895.
Nelson, S., Kushlev, K., English, T., Dunn, E., & Lyubomirsky, S. (2014b). Parents are slightly happier than nonparents, but causality still cannot be inferred: A reply to Bhargava, Kassam, and Loewenstein (2014). Psychological Science, pp. 303–304
Nomaguchi, K., & Milkie, M. (2003). Costs and rewards of children: The effects of becoming a parent on adults’ lives. Journal of Marriage and Family, 65, pp. 356–374.
Pollmann-Schult, M. (2014). Parenthood and life satisfaction: Why don’t children make people happy? Journal of Marriage and Family, 76(2), 319–336.
Stanca, L. (2010). The geography of economics and happiness: Spatial patterns in the effects of economic conditions on well-being. Social Indicators Research, 99(1), 115–133.
Stanca, L. (2012). Suffer the little children: Measuring the effects of parenthood on well-being worldwide. Journal of Economic Behavior and Organization, 81(3), 742–750.
Tao, H. (2005). The effects of income and children on marital happiness: Evidence from middle- and old-aged couples. Applied Economics Letters, 12, pp. 521–24.

102
Umberson, D. (1989). Parenting and well-being: The impor-tance of context. Journal of Family Issues, 10, pp. 427–439.
Umberson, D., & Gove, W. (1989). Parenthood and psycholog-ical well-being: Theory, measurement, and stage in the family life course. Journal of Family Issues, 10, pp. 440–462.
Van Praag, B., Frijters, P., & Ferrer-i-Carbonell, A. (2003). The anatomy of subjective well-being. Journal of Economic Behavior and Organization, 51, pp. 29–49.
World Bank. (2014). World Development Indicators 2014. ISBN: 0-8213-7386-2
World Values Survey Association. (2014). European and world values surveys six-wave integrated data file. 1981–2014.

W O R L D H A P P I N E S S R E P O R T 2 0 1 6 | S P E C I A L R O M E E D I T I O N
103

104
LUCA CRIVELLI, SARA DELLA BELLA AND MARIO LUCCHINI
Chapter 5
MULTIDIMENSIONAL WELL-BEING IN CONTEMPORARY EUROPE: AN ANALYSIS OF THE USE OF A SELF-ORGANIZING MAP APPLIED TO SHARE DATA.
Luca Crivelli, Department of Business Economics, Health and Social Care (DEASS), University of Applied Sciences and Arts of Southern Switzerland (SUPSI) and Swiss School of Public Health (SSPH+). E-mail: [email protected]
Sara Della Bella, Institute for Public Communication (ICP), Università della Svizzera italiana (Switzerland) and DEASS SUPSI (Switzerland). E-mail: [email protected]
Mario Lucchini, Department of Sociology, University of Milano-Bicocca (Italy) and DEASS SUPSI (Switzerland). E-mail: [email protected]

W O R L D H A P P I N E S S R E P O R T 2 0 1 6 | S P E C I A L R O M E E D I T I O N
105
Introduction
After years during which researchers from different fields were mainly focused on the nega-tive aspects of human psychology (e.g. depres-sion and mental disorders), psychologists and scholars of others social science disciplines (like economics and sociology) have increasingly been looking at ways of measuring happiness and other positive emotions. This trend reflects the importance that modern societies attribute to individuals’ subjective well-being (SWB).1
Today, social scientists widely agree in defining happiness (or subjective well-being, which we consider synonymous) as a broad and multidi-mensional construct. Although happiness has been defined in different ways,2 all definitions identify two basic components to this concept: a hedonic and a eudaimonic one.
These two components are not, of course, completely independent—for instance, subjec-tive evaluations are strongly influenced by emotional experiences—but they need to be distinguished both empirically and conceptual-ly.3 Indeed, these two dimensions are the result of different processes: affective reactions are often responses to immediate situations and tend to be of short duration; life-satisfaction ratings are likely to reflect a long-term perspec-tive.4 Moreover, while a person’s evaluation of her or his life satisfaction tends to reflect con-scious values and goals in life, emotional reac-tions are affected to a greater extent by uncon-scious motives and bodily states.
Following Aristotle, the eudaimonic dimension of happiness is conceptualized as primarily cognitive, and understood to consist of elements such as life satisfaction, meaning and purpose in life, goal attainment, self-determination and personal growth, but also commitment to shared goals and values.5
Carol Ryff, for example, developed a eudaimonic model of psychological well-being (PWB) that includes six fundamental components: self-ac-ceptance, personal growth, purpose in life, environmental mastery, autonomy, and positive relations with others.6 Ryan and Deci7 developed a simplified version of the PWB model which they called self-determination theory (SDT). SDT distinguishes between three psychological needs—autonomy, competence, and related-ness—which, if they remain unmet, will have a detrimental impact on SWB. The PWB approach differs from SDT in that it treats autonomy, competence, and relatedness as indicators of well-being; in STD they are instruments through which to obtain well-being.
As observed by Boniwell,8 the eudaimonic dimension of well-being risks becoming an excessively extended concept into which is dumped everything that does not fit the plea-sure dimension. For example, it has been referred to as “personal expressiveness,”9 and a “flow state” or “optimal experience,” i.e., a state of complete absorption in intrinsically reward-ing activities that challenge our abilities without exceeding them.10
Both positive and negative affects have been identified11 as belonging to the hedonic dimension. Positive affects include joy, contentment, pride, and hope, while negative affects include emotions such as sadness, anger, anxiety, and guilt.
Both types of affects are necessary and fulfill important functions.12 Interestingly, positive and negative affects are not simply antonyms. Although some studies have reported a strong inverse correlation between positive and negative affects, many others have shown that they can, to some extent, be considered inde-pendent constructs13 and related to other variables in different ways, such that they seem to be produced by different processes and biological systems.14

106
The existence of two distinct affect systems (a positive and a negative one) is supported by the evidence that positive emotions tend to co-occur with negative emotions.15
Moreover, several studies have clarified that posi-tive and negative affects reflect the operation of two broad, evolutionarily adaptive motivational systems: a behavioral activation system, which directs organisms towards situations and experi-ences that might yield pleasure, and a behavioral inhibition system that inhibits behavior that might have undesirable consequences.16
Overall, neurophysiologic studies have shown that no single neural system is able to activate both positive and negative affects. Rather, there are complex and emotion-specific neural systems. Indeed, whereas positive affects are systematically associated with the level of resting activity in the left prefrontal area, negative ones are systemati-cally associated with right frontal activation.17
In the “broaden and build” theory developed by Barbara Fredrickson,18 positive emotions are conceptualized not only as enjoyable and ephemeral feelings, as moments in which people are not plagued by negative affects, but also as a means through which to broaden people’s attention and thinking, increase their psychological resilience, and build intellectual and social resources. Positive emotions do not simply operate in the immediate present but also have a long-term impact, enhancing human flourishing and favoring healthy longevity.19
Hence, although positive and negative affects are not completely independent of each other, researchers tend to agree on the usefulness of keeping them separate. As such, happiness can actually be considered to be comprised of three distinct components. Diener and colleagues, for example, have defined subjective well-being as consisting of three interrelated factors: cogni-tion, positive affects, and negative affects.20
Diener and colleagues’ definition has been supported by several empirical studies. Ar-thaud-Day and colleagues,21 for instance, show that the three-factors structure (cognition, positive affects, and negative affects) best fits the data, and that the three elements are discrimi-nately valid.
Studies in the field of depression have docu-mented the existence of two factors underlying the basic emotions: depression, tearfulness, and wishing to die are included in the first, referred to as the “depressed affect factor” while loss of interest, poor concentration, and lack of enjoy-ment are included in the second, the “motiva-tion factor.”22
Despite researchers’ increasing theoretical awareness that multidimensionality is implicit in the concept of SWB, in practice, most existing studies seem to adopt a one-dimensional under-standing of happiness. This can be seen in their use of single-item measures, or of cognitive and affective scales interchangeably, as if they were equivalent proxies for overall SWB.23
Indeed over the past 30 years, researchers have created several scales aimed at capturing the cognitive dimension of happiness, such as the Life-3 Delighted-Terrible Scale,24 the Well-Being Index,25 and the Satisfaction with Life Scale,26 as well as scales designed to measure affect, such as the Affectometer,27 the Affect Balance Scale,28 the Positive and Negative Affect Schedule (PANAS),29 the Scale of Positive and Negative Experience (SPANE),30 the Beck Depression Inventory,31 and the EURO-D scale of depression severity.32
What is astonishing is the lack of measuring tools able to capture the multidimensionality of happiness adequately; indeed, it is a common practice to use individual indicators of SWB or synthetic indicators obtained by subtracting the negative-feelings score from the positive-feel-ings score.33

W O R L D H A P P I N E S S R E P O R T 2 0 1 6 | S P E C I A L R O M E E D I T I O N
107
The aim of this paper is to apply a sophisticated “clustering-and-projection” technique—the Self Organizing Map (SOM)—to a large number of indicators of well-being, to capture the struc-ture of happiness. More specifically, it can help us understand the extent to which different indicators/dimensions of SWB (the eudaimon-ic and hedonic dimensions, cognitive and affective measures, positive and negative affects) are independent rather than totally or partially overlapping.
Although global self-reported measures of happiness possess adequate psychometric properties, good internal consistency, and appro-priate sensitivity to changes in life circumstanc-es,34 in this paper we start from the hypothesis that such measures might not be the best choice when it comes to measuring SBW in its complex-ity because they illegitimately collapse into one dimension different components that only partially overlap. The SOM approach can help us shed light on some ambiguities in the umbrella construct of life satisfaction, and to crystallize the relationship between this concept and other important components of a good life such as positive and negative emotions, health, social relationships, meaning, and social activities.
Method
The aim of this study is to apply an unsuper-vised artificial neural network—the Self Orga-nizing Map (SOM)—to capture and visualize the hidden structure of highly multidimensional data. The SOM is a vector quantization algo-rithm widely used in a variety of domains35 which performs a mapping from a high-dimen-sional input space of data onto a two-dimension-al output space. The latter is a rectangular grid of nodes, each of which is equipped with a weight vector or a model m
i in the data space.
The training algorithm exploits competitive learning such that in the first step each observa-tion or input vector is assigned to its best match-ing unit (BMU), i.e. the unit with the weight
vector mi(t) that matches best with the input vector x(t) in some metric and according to the following equation:
c = argmini {||x(t) – mi(t)||}
Subsequently, in the second step, the weight vectors of the BMU and its closest neighbors in the map are updated such that the modified weight vectors will match better with the input vectors. The equation ruling the updating phase is the following:
mi(t+1) = m
i(t) + k(t)ℎ
ci(t)[x(t) –m
i(t)]
where c is the index of the winner node, k(t) is a monotonically decreasing scalar function of t and ℎ
ci(t) is the neighborhood function, usually
taken to be Gaussian around the BMU, as follows:
ℎci(t) = exp (–
(i – ic)2
22(t) )
where is the width of the neighborhood and ic
is the index of the BMU, the node whose weight vector matches the input vector best. The size of the neighborhood is gradually decreased during the training process until only the weights of the BMU are updated.
Data and Variables
We use data from the fourth wave (2010–11) of the Survey of Health, Aging, and Retirement in Europe (SHARE).36 The conventional approach would be to rank the countries with respect to the average Cantril ladder score using, for in-stance, life satisfaction or quality of life. Using the life-satisfaction indicator reported in SHARE, we obtain the results highlighted in Table 1 and learn that, within the sample of European coun-tries, Denmark, Sweden, and Switzerland had the highest average scores in 2010, whereas Hungary and Estonia had the lowest.

108
Table 1: Ranking of life satisfaction 2010-11 (among people aged 50 or older).
Life Satisfaction
Country mean sd
Denmark 8.621 1.325
Sweden 8.425 1.456
Switzerland 8.402 1.365
Austria 8.304 1.646
Netherlands 8.100 1.036
Germany 7.789 1.723
Belgium 7.780 1.404
Italy 7.680 1.674
Spain 7.633 1.800
Poland 7.453 1.904
Slovenia 7.453 1.750
Czech Republic 7.420 1.929
France 7.315 1.686
Portugal 7.084 2.013
Hungary 6.737 2.147
Estonia 6.736 2.039
The availability in this wave of a wide range of indicators covering different aspects of subjec-tive well-being has made it possible to adopt a truly multidimensional approach. The choice of indicators and dimensions is largely driven by the theories previously reviewed and by the availability of indicators in SHARE. More specifically, we selected 38 items (see Table 2) covering seven different dimensions of well-be-ing, listed below:
1. Positive affects and evaluations: Hope for the future, enjoyment from activity, how often one looks back on one’s life with a sense of happiness, looking forward to each day, feeling that life has meaning and is full of opportunities, feeling full of energy, feeling positive about the future.
2. Negative affects and orientations: Depres-sion, emotional disorders, wishing one were dead, guilt or self-blame, tearfulness,
fear of the worst, fear of dying.
3. Somatic disorders: Trouble sleeping, trembling hands, diminution in appetite, faintness, feeling irritable or nervous.
4. Vitality/apathy/flow state: Interest in things, too little energy to do things/fatigue, difficulty in concentrating on entertainment and on reading.
5. Self-efficacy/pathway thinking/agency thinking: Ability to do the things one wants to do, age prevents one from doing those things, what happens to one is out of one’s control, feeling left out of things, family responsibilities prevent one from doing what one wants to do, shortage of money stops one from doing the things one wants to do.
6. Physical and mental health: Self-assessed health, chronic conditions, impediments to daily activities.
7. Evaluations of life domains: Life in general, satisfaction with the activities engaged in, satisfaction with relationships.
The dimensions of positive and negative affects of somatic disorders and vitality/apathy are more strongly driven by hedonic experience, whereas the indicators included in the dimen-sions of self-efficacy and evaluations of life domains have a stronger eudaimonic orienta-tion, although it is reasonable to think that all indicators show a certain degree of semantic overlap with both forms of SWB.
As our aim is to measure well-being in multidi-mensional terms, we have also included some important indicators of health and social capital that, depending on the theoretical approach adopted, can be considered either, on the one hand, aspects or, on the other, causes or effects of well-being.

W O R L D H A P P I N E S S R E P O R T 2 0 1 6 | S P E C I A L R O M E E D I T I O N
109
Finally, dimensions 1 and 5 express two different forms of optimism. Following Scheier and Carver,37 dimension 1 refers to so-called disposi-tional optimism; that is, the mental disposition based on which the person tends to expect posi-tive outcomes and recognize the available oppor-tunities. Dimension 5 refers to attributional optimism, which implies being self-confident and the creator and protagonist of one’s own destiny.
It is important to underline that the chosen items refer to different time frames: the past, the present and the future. Moreover, whereas some items reflect a relatively short time perspective (last week), others concern much longer time frames (for instance, one’s entire life).
All the items have been rescaled such that they have the same direction and are interpretable as indicators of well-being (in other words, higher values of an indicator entail higher levels of well-being).
Table 2: Descriptive statistics of the SWB indicators taken from SHARE Wave 4 (obs. 51260). (Part 1)
Unpleasant Affects Synthetic label
In the last month, have you been sad or depressed? By sad or depressed, we mean miserable, in low spirits (0 Yes, 1 No)
0,60 0,49 Sadness depress
In the last month, have you felt that you would rather be dead? (0 Any mention of suicidal feelings or wishing to be dead, 1 No such feelings)
0,92 0,26 Suicidal feelings
Do you tend to blame yourself or feel guilty about anything? 0 Mentions guilt or self-blame, 1 No such feelings.
0,77 0,42 Self-blame & guilty
In the last month, have you cried at all? (0 Yes, 1 No) 0,75 0,43 Tearfulness
Has there been a time or times in your life when you suffered from symptoms of depression which lasted at least two weeks? (0 Yes, 1 No)
0,77 0,42 Depression symp.
Has a doctor ever told you that you suffer from other affective or emotional disorders, including anxiety, nervous or psychiatric problems? (0 Yes, 1 No)
0,90 0,30 Emotional disorder
(During the past week) I had fear of the worst happening (1 Most of the time, 2 Some of the time, 3 Hardly ever, 4 Never)
3,41 0,88 Fear of the worst
I had a fear of dying. (1 Most of the time, 2 Some of the time, 3 Hardly ever, 4 Never) 3,74 0,63 Fear of dying
Pleasant affects
What are your hopes for the future? (0 No hopes, 1 Any hopes mentioned) 0,81 0,39 Hope for the future
What have you enjoyed doing recently? (0 Fails to mention any enjoyable activity, 1 Mentions any enjoyment from activity)
0,87 0,34 Enjoyment of activity
How often, on balance, do you look back on your life with a sense of happiness? (1 Never, 2 Rarely, 3 Sometimes, 4 Often)
3,37 0,78 Back happy
How often do you look forward to each day? (1 Never, 2 Rarely, 3 Sometimes, 4 Often) 3,38 0,91 Look forward
How often do you feel that your life has meaning? (1 Never, 2 Rarely, 3 Sometimes, 4 Often)
3,55 0,74 Meaning
How often do you feel full of energy these days? (1 Never, 2 Rarely, 3 Sometimes, 4 Often)
3,15 0,87 Energy
How often do you feel that life is full of opportunities? (1 Never, 2 Rarely, 3 Some-times, 4 Often)
3,09 0,90 Opportunities
How often do you feel that the future looks good for you? (1 Never, 2 Rarely, 3 Sometimes, 4 Often)
3,03 0,93 Future good

110
Somatic disorders
Have you had trouble sleeping recently? (0 Trouble with sleep or recent change in pattern, 1 No trouble sleeping)
0,65 0,48 Trouble sleeping
Have you been irritable recently? (0 Yes, 1 No) 0,70 0,46 Irritability
What has your appetite been like? (0 Diminution in desire for food, 1 No diminution in desire for food)
0,92 0,27 Appetite
I was nervous. (1 Most of the time, 2 Some of the time, 3 Hardly ever, 4 Never) 2,97 0,99 Nervous
I felt my hands trembling. (1 Most of the time, 2 Some of the time, 3 Hardly ever, 4 Never) 3,66 0,75 Hand trembling
I felt faint. (1 Most of the time, 2 Some of the time, 3 Hardly ever, 4 Never) 3,51 0,84 Feeling faint
Vitality/Apathy
In the last month, what has your interest in things been? (0 Less interest than usual mentioned, 1 No mention of loss of interest)
0,92 0,27 Interest in things
In the last month, have you had too little energy to do the things you wanted to do? (0 Yes, 1 No)
0,63 0,48 Little energy/fatigue
Can you concentrate on a television, film or radio programme? (0 Difficulty in concentrating on entertainment, 1 No such difficulty mentioned)
0,88 0,32 Concentrating entert
Can you concentrate on something you read? (0 Difficulty in concentrating on reading, 1 No such difficulty mention)
0,87 0,34 Concentrating read
Physical and mental health
Would you say your health is? (1 Poor, 2 Fair, 3 Good, 4 Very good, 5 Excellent) 2,80 1,07 Self-assessed health
Some people suffer from chronic or long-term health problems (0 Yes, 1 No) 0,48 0,50 Long illness
For the past six months at least, to what extent have you been limited because of a health problem in activities people usually do? (1 Severely limited, 2 Limited but not severely, 3 Not limited)
2,37 0,73 Limitation activity
Self-efficacy
How often do you think your age prevents you from doing the things you would like to do? (1 Often, 2 Sometimes, 3 Rarely, 4 Never)
2,66 1,06 Age prevent
How often do you feel that what happens to you is out of your control? (1 Often, 2 Sometimes, 3 Rarely, 4 Never)
2,90 0,99 Out of control
How often do you feel left out of things? (1 Often, 2 Sometimes, 3 Rarely, 4 Never) 3,15 0,96 Feel left out
How often do you think that you can do the things that you want to do? (1 Never, 2 Rarely, 3 Sometimes, 4 Often)
3,22 0,91 Do things
How often do you think that family responsibilities prevent you from doing what you want to do? (1 Often, 2 Sometimes, 3 Rarely, 4 Never)
3,15 0,97 Fam resp prev
How often do you think that a shortage of money stops you from doing the things you want to do? (1 Often, 2 Sometimes, 3 Rarely, 4 Never)
2,56 1,13 Money stops
Evacuation of life domains
(On a scale from 0 to 10, where 0 means completely dissatisfied and 10 means completely satisfied) how satisfied are you with the activities that you engaged in (or not)? (i.e. Done voluntary work, attended an educational course, gone to a sports, social or other kind of club, taken part in activities of a religious organization, of a political or community-related organization, read books or newspapers, did games such as crossword puzzles or Sudoku, played cards or games such as chess.
7,88 2,00 Sat activities
Overall, how satisfied are you with the relationship that you have with the person we have just talked about? (Scale from 0 to 10, where 0 means completely dissatisfied and 10 means completely satisfied)
8,92 1,27 Networksat
How satisfied are you with your life? (Scale from 0 to 10, where 0 means completely dissatisfied and 10 means completely satisfied)
7,62 1,81 Satisfaction with life
Table 2: Descriptive statistics of the SWB indicators taken from SHARE Wave 4 (obs. 51260). (Part 2)

W O R L D H A P P I N E S S R E P O R T 2 0 1 6 | S P E C I A L R O M E E D I T I O N
111
Results
The analyses were carried out using the SOM Toolbox for Matlab 5.38 A large multidimensional input space has been reduced to a two-dimen-sional grid of 48 (6 x 8) micro-clusters or nodes.
Figure 1: Two-dimensional SOM made of 48 units arranged in a 6 x 8 hexagonal lattice.
To gain insight into the meaning of the map, we visually inspect its component planes, a special kind of graph illustrating the average values taken by a given indicator in each node. Looking at the component planes, we can identify emerg-ing patterns of data distribution and detect the convergent and discriminant validity of the selected indicators.39 More specifically, using scale colors, we may easily identify regions of the map with a minimum level of a given attri-bute because they are depicted in blue, and regions with a maximum level of a given attri-bute because they are depicted in red. The values of the components are de-normalized such that the values shown in the color bar are in the original value range.
At first glance, all indicators present a common pattern distribution with a concentration of red nodes at the bottom of the map; clearly this is the area of pleasant emotions (lack of negative affects and presence of positive affects), great vitality and self-efficacy, good health and a high degree of satisfaction with life, social relation-
ships and the activities engaged in. In contrast, the top of the map is characterized by unpleas-ant emotions, apathy, a low sense of self-deter-mination, poor health, and low satisfaction with life and other circumstances.
Although the deepest differences occur along the vertical axis, the horizontal axis also shows results worthy of interest, as it is along this axis that a clear polarization between the indicators of positive and negative affects is revealed. More specifically, the items reflecting pleasant emo-tions and satisfaction with social relationships and activities contribute to the identification of an area of cumulative well-being located in the bottom-left corner of the map, whereas in the diametrically opposite position, in the up-per-right corner, exists an area of multidimen-sional ill-being (discomfort), where indicators settle upon lower values. Moreover, the items reflecting negative affects, somatic disorders, and apathy tend to define a clear cluster of good mental health in the bottom-right corner and a cluster of mental distress in the upper-left corner, again in a diametrically opposite position.
Finally, the more holistic items or umbrella concepts, like self-assessed health and life satisfaction, reveal a very strong discriminating power only along the vertical axis, since they are not at all able to highlight significant differences along the horizontal axis, which, as previously explained, should capture any existing polariza-tion between pleasant and unpleasant emotions.

112
Figure 2: Component planes for the unpleasant affects items (the variable labels are the same as in Table 1).
Figure 3: Component planes for the pleasant affects items.

W O R L D H A P P I N E S S R E P O R T 2 0 1 6 | S P E C I A L R O M E E D I T I O N
113
Figure 4: Component planes for the somatic disorders items.
Figure 5: Component planes for vitality/apathy items.
Figure 6: Component planes for physical and mental health items.

114
Figure 7: Component planes for the self-efficacy items.
Figure 8: Component planes for evaluation of life domain items.
Subsequently, the 48 nodes of the map have been aggregated into prototypical areas running a hierarchical agglomerative clustering (average linkage method, see Figure 9). Cutting the dendrogram just above the value of 2.6 of the level of similarity yields eight macro-clusters
that are quite internally homogenous and easier to define (see Figure 10). This aggregation strate-gy appears well supported by both theoretical and visual criteria.

W O R L D H A P P I N E S S R E P O R T 2 0 1 6 | S P E C I A L R O M E E D I T I O N
115
Figure 9: Average linkage clustering technique.
To describe the eight macro-clusters, we have calculated the averages and conditional probabil-ities of the indicators within each area, as shown in Table 3. The indicators and macro-clusters have been ordered with respect to the dimen-sions and the topological proximity.
Figure 10: Aggregation of the 48 micro-clusters into eight clusters or prototypical areas.
Analyzing the average scores and the conditional probabilities of the indicators within the mac-ro-cluster, the following is revealed:
i. A4 and A8 form areas of cumulative well-being located in the lower part of the map. In those areas, the highest positive deviations of the indicators from the sample mean are registered;
ii. In contrast, A1 and A5 gather together persons experiencing worse well-being conditions, showing scores that are signifi-cantly below the sample mean;
iii. A2 and A6 represent areas of vulnerability that maintain a certain continuity with the worse areas of the map (A1 and A5); whereas A3 and A7 show a certain similar-ity to the better areas (A4 and A8).
Let us have a detailed look at the meaning of each area.
A 1 incorporates 13 percent of the sample obser-vations and is characterized by the lowest scores on all items reflecting negative emotions (sad-ness/depression, suicidal feelings, self-blame and guilt, tearfulness, symptoms of depression, emotional disorders, fear of the worst happen-ing, fear of dying), somatic disorders (trouble

116
Table 3: Average score (and conditional probabilities) of indicators within each macro-cluster.
Sat activities 6,705 5,61 7,911 7,294 8,365 7,874 8,952 8,41 7,919
Network sat 8,689 8,486 8,848 8,681 8,934 8,862 9,265 9,111 8,918
Satisfaction with life 5,981 5,598 7,394 7,011 8,139 7,686 8,925 8,409 7,654
Observations 6891 7846 8979 10909 3409 4289 4532 4405 51260 (in %) (13%) (15%) (18%) (21%) (7%) (8%) (9%) (9%) 100%
Table 4: Distribution of the different forms of multidimensional well-being in European countries c1 c2 c3 c4 c5 c6 c7 c8 Denmark 5,56 8,85 21 50,12 1,45 2,81 4,5 5,71 Sweden 4,6 13,64 24,19 33,11 3,14 5,11 8,98 7,24 Switzerland 5,03 11,32 23,42 45,26 0,95 2,18 4,11 7,73 Austria 8,77 12,89 15,97 35,79 3,8 4,27 7,06 11,45 Netherlands 5,38 12,29 25,51 38,73 1,37 3,09 5,54 8,08 Germany 10,46 18,86 21,78 23,13 4,63 4,91 8,4 7,83 Belgium 13,76 17,62 19,91 20,99 3,9 8,24 8,28 7,29 Italy 15,06 14,11 12,81 8,01 8,55 13,35 14,52 13,6 Spain 19,82 11,96 12,57 13,28 8,44 8,89 13,76 11,28 Poland 20,55 17,16 16,63 12,07 11,09 9,78 6,59 6,13 Slovenia 9,03 13,32 19,37 20,65 5,49 6,51 9,32 16,3 Czech Republic 17,63 18,05 13,34 10,5 6,37 14,13 11,93 8,04
France 13,15 18,32 23,28 21,04 4,52 5,77 7,3 6,62 Portugal 26,02 13,92 6,51 2,58 14,73 18,66 10,32 7,26 Hungary 21,51 16,24 12,71 10,16 12,6 10,09 9,6 7,09 Estonia 15,84 18,85 15,12 8,95 14,15 11,83 8,93 6,33 Total 13,44 15,31 17,52 21,28 6,65 8,37 8,84 8,59 Table 5: Multinomial logit regression: Estimation results (n. id=47913) c1 c2 c3 c5 c6 c7 c8 Age (centred at 65 years) 0,016*** 0,018** 0,012*** 0,049*** 0,026*** 0,016*** 0,004 (0,00) (0,00) (0,00) (0,00) (0,00) (0,00) (0,00) Age squared (divided by 100)
0,063*** 0,045** 0,024 0,113*** 0,057** 0,062*** 0,058***
(0,02) (0,01) (0,01) (0,02) (0,02) (0,02) (0,02) Female 0,330*** 0,307*** 0,129*** -0,545*** -0,564*** -0,509*** -0,562*** (0,04) (0,04) (0,03) (0,05) (0,05) (0,04) (0,04) Never married (cat.ref.) Married and living together with spouse
-0,356*** -0,185* -0,074 -0,824*** -0,450*** -0,438*** -0,070
(0,09) (0,08) (0,08) (0,10) (0,09) (0,09) (0,09) Living separated from spouse/divorced
0,222* 0,028 0,038 -0,311** -0,187 -0,064 0,018
(0,10) (0,09) (0,09) (0,12) (0,11) (0,10) (0,11) Widowed -0,152 -0,201* -0,143 -0,551*** -0,441*** -0,443*** -0,112 (0,10) (0,09) (0,09) (0,11) (0,11) (0,11) (0,11) Household size 0,107*** 0,102*** 0,074*** 0,124*** 0,119*** 0,101*** 0,018 (0,02) (0,02) (0,02) (0,03) (0,02) (0,02) (0,02) Number of children -0,019 -0,012 0,013 -0,069*** -0,052** -0,057*** -0,068*** (0,01) (0,01) (0,01) (0,02) (0,02) (0,02) (0,02) Years of education -0,113*** -0,044*** -0,019*** -0,133*** -0,083*** -0,046*** -0,026*** (0,00) (0,00) (0,00) (0,01) (0,01) (0,01) (0,00)
Sample CLU8 A1 A5 A2 A6 A3 A7 A4 A8
mean
Unpleasant affects A1 A5 A2 A6 A3 A7 A4 A8
Sadness depress 0,137 0,467 0,332 0,782 0,595 0,902 0,775 0,936 0,604
Suicidal feelings 0,662 0,843 0,938 0,974 0,977 0,987 0,99 0,993 0,929
Self-blame & guilty 0,538 0,817 0,602 0,868 0,716 0,911 0,874 0,956 0,768
Tearfulness 0,393 0,756 0,644 0,914 0,769 0,943 0,817 0,958 0,76
Depression symp. 0,448 0,813 0,649 0,876 0,788 0,902 0,884 0,94 0,779
Emotional disorder 0,631 0,928 0,831 0,962 0,936 0,975 0,974 0,987 0,9
Fear of the worst 2,566 3,13 3,184 3,463 3,532 3,727 3,761 3,842 3,42
Fear of dying 3,189 3,508 3,714 3,712 3,875 3,895 3,946 3,961 3,753
Pleasant affects A1 A5 A2 A6 A3 A7 A4 A8
Hope for the future 0,624 0,331 0,871 0,709 0,93 0,842 0,96 0,808 0,819
Enjoyment of activity 0,766 0,498 0,918 0,858 0,93 0,896 0,939 0,905 0,874
Back happy 2,955 2,552 3,392 2,85 3,692 3,173 3,842 3,504 3,385
Look forward 2,964 2,454 3,45 2,809 3,723 3,219 3,883 3,37 3,396
Meaning 3,023 2,403 3,71 2,985 3,908 3,531 3,959 3,844 3,576
Energy 2,282 1,905 2,988 2,725 3,508 3,203 3,86 3,651 3,17
Opportunities 2,339 1,811 3,039 2,461 3,527 2,864 3,847 3,414 3,108
Future good 2,182 1,726 2,915 2,436 3,474 2,824 3,84 3,43 3,048
Somatic disorders A1 A5 A2 A6 A3 A7 A4 A8
Trouble sleeping 0,27 0,515 0,454 0,781 0,615 0,853 0,833 0,921 0,649
Irritability 0,36 0,693 0,529 0,83 0,663 0,899 0,855 0,938 0,707
Appetite 0,705 0,859 0,905 0,959 0,956 0,972 0,983 0,989 0,921
Nervous 2,012 2,793 2,494 3,147 2,922 3,453 3,458 3,701 2,98
Hand trembling 2,927 3,312 3,608 3,66 3,827 3,887 3,931 3,94 3,673
Feeling faint 2,667 2,983 3,314 3,564 3,678 3,833 3,901 3,916 3,525
Vitality/apathy A1 A5 A2 A6 A3 A7 A4 A8
Interest in things 0,705 0,777 0,937 0,962 0,966 0,975 0,985 0,978 0,925
Little energy/fatigue 0,212 0,352 0,391 0,704 0,656 0,872 0,904 0,928 0,639
Concentrating entert 0,642 0,709 0,879 0,933 0,931 0,957 0,966 0,965 0,887
Concentrating read 0,612 0,649 0,868 0,915 0,923 0,946 0,962 0,961 0,873
Physical and mental health A1 A5 A2 A6 A3 A7 A4 A8
Self-assessed health 1,841 1,751 2,394 2,512 2,883 2,941 3,783 3,35 2,805
Long illness 0,186 0,2 0,296 0,449 0,417 0,596 0,784 0,785 0,48
Limitation activity 1,781 1,732 2,124 2,319 2,41 2,626 2,827 2,827 2,379
Self-efficacy A1 A5 A2 A6 A3 A7 A4 A8
Age prevent 1,885 1,853 2,331 2,323 2,697 2,751 3,389 3,454 2,661
Out of control 2,087 2,243 2,585 2,687 2,955 3,122 3,473 3,694 2,905
Feel left out 2,392 2,511 2,929 2,897 3,27 3,321 3,661 3,797 3,159
Do things 2,697 2,381 3,161 2,802 3,573 3,134 3,863 3,004 3,24
Fam resp prev 2,865 3,334 2,961 3,05 3,06 3,192 3,356 3,526 3,146
Money stops 1,939 2,221 2,291 2,169 2,668 2,406 3,233 2,884 2,556
Evaluation of life domain
CLU8 A1 A5 A2 A6 A3 A7 A4 A8 Sample Mean

W O R L D H A P P I N E S S R E P O R T 2 0 1 6 | S P E C I A L R O M E E D I T I O N
117
sleeping, irritability, reduced appetite, nervous-ness, trembling hands, feeling faint) and apathy (low interest in things, too little energy to do things, difficulty in concentrating on entertain-ment and reading).
The health conditions (self-assessed health, long illness, and limited activity) and the feelings of self-efficacy (age prevents one from doing things, what happens to one is out of one’s control, feeling left out of things, family respon-sibilities prevent one from doing what one wants to do, shortage of money stops one from doing the things one wants to do) are very poor.
The indicators of positive emotions/evaluations (hopes for the future, enjoyable activities, satis-faction with life, looking back on one’s life with a sense of happiness, looking forward to each day, feeling that life has meaning and is full of opportunities, feeling full of energy, feeling that the future looks good) and of satisfaction with some important aspects of life (with the activi-ties engaged in, with relationships) are below the sample mean but higher than in A5.
A5, located in the left-upper part of the map, incorporates 7 percent of observations and is characterized by the lowest scores for both positive emotions (hopes for the future, enjoy-able activities, satisfaction with life, looking back on one’s life with a sense of happiness, looking forward to each day, feeling that life has mean-ing and is full of opportunities, feeling full of energy, feeling that the future looks good) and satisfaction with social relationships and activi-ties in which one is engaged.
Even the indicators of somatic disorders and some items of negative emotions (sadness, suicidal feelings, fear of the worst, fear of dying) show negative deviations from the sample mean, but without reaching the same intensity as in A1.
The scores for health indicators, life satisfaction, apathy/vitality and self-efficacy (with only one
exception: family responsibilities prevent one from doing what one wants to do) are very similar to those of cluster 1.
A4, which incorporates 21 percent of observa-tions, seems specular to A5 and can be defined as the macro-cluster of cumulative well-being. This area is associated with higher values in the indicators of positive emotions and satisfaction with life, activities engaged in and relationships. The better the health condition, the higher the sense of self-efficacy and vitality. Protection from negative emotions and somatic disorders is significant, although without reaching A8 levels.
If A4 seems specular to A5, A8 appears symmet-ric to A1. It incorporates 9 percent of the sample and is characterized by higher values with respect to the lack of negative emotions and somatic disorders.
People belonging to this cluster show a profile similar to that of A4 in health, vitality and self-efficacy. With regard to the positive-emo-tions dimension in only some indicators, howev-er, (happiness with regard to the past, meaning, energy, opportunities and future good), import-ant positive gaps are registered. Satisfaction with life, activities in which one is engaged, and relationships is also high, though without reaching the intensity of A4.
A2 groups 15 percent of the observations, and it expresses a pattern of vulnerability to negative emotions, somatic disorders, bad health and low self-efficacy, but without reaching the gravity of cluster 1. The scores regarding positive emo-tions, apathy/vitality, and satisfaction with activities and relationships roughly follow the sample mean.
A3, which consists of 18 percent of the observa-tions, shows some similarities to area 4, as we can see in it some positive gaps, although of minor intensity, with reference to positive emotions and satisfaction with life, activities
CLU8 A1 A5 A2 A6 A3 A7 A4 A8 Sample Mean

118
engaged in, and social relationships. The items regarding other dimensions roughly follow the average profile.
A6 incorporates 8 percent of observations and, being topologically close to cluster 5, shares some aspects with it, but without equaling their gravity. In more detail, people belonging to this cluster are less likely to express positive emo-tions, and have a low level of self-efficacy and a high level of psychophysical weakness. Their levels of satisfaction regarding life, activities, and relationships are also below the average.
A7, finally, includes 9 percent of observations and presents some similarities to A8. People belonging to this group have an appropriate degree of protection from negative emotions and somatic disorders, and above-average health and vitality. With regard to the other dimensions, particularly relevant gaps are not registered. Satisfaction with life follows the sample mean almost perfectly.
In summary, the multidimensional area of data is representable along two axes. The vertical axis catches the intensity of SWB. While the horizon-tal axis is less relevant, it usefully breaks up the polarization between pleasant and unpleasant emotions. The dendrogram reveals a clear logic behind the node conglomerates on the map. Node aggregations situated along the horizontal axis correspond to low levels of dissimilarity. These aggregations catch the polarization between the lack (or presence) of pleasant emotions and the presence (or lack) of unpleas-ant emotions, whereas we can see only a high level of dissimilarity between aggregations of areas and zones located along the vertical axis. That is also proved by the fact that the main dividing line is between the nodes situated in the upper area (1, 5, 2 and 6) and the lower area (3, 7, 4 and 8).
Although the horizontal axis is certainly less relevant than the vertical one, the results of our map seem to confirm what several authors have hypothesized: that positive and negative emo-tions/orientations cannot be reduced to a single dimension, but are instead polarized within two different factors that are only partially correlat-ed.40 In other words, unpleasant and pleasant emotions represent different and complementa-ry contributions to well-being that enrich the interpretation of forms of unhappiness and ill-being, exclusively based on the presence of depression, anxiety, and unpleasant emotions.41
Another important result is the behavior of some indicators, such as the ability to concen-trate on entertainment and reading, self-as-sessed health, suffering from chronic problems, physical limitation in daily activities, and satis-faction with life. These indicators represent broader constructs that are cognitive rather than emotional and do not seem to be revealed very much, if at all, along the horizontal axis, where-as they are revealed clearly along the vertical axis. It follows that such holistic indicators are not useful for revealing whether ill-being can be attributed to negative emotions or to a lack of positive emotions.
In going beyond the mapping stage, we consider the role of some important observable heteroge-neity factors in relation to cluster membership. First of all, we concentrate on the probability of belonging to each of the eight areas, conditional upon the country of residence (Table 4). It is immediately clear that the strongest form of multidimensional well-being (A4) is found in Denmark (50%), Switzerland (45%), the Nether-lands (39%), Austria (36%), and Sweden (33%), while the probability of belonging to A5 (located in the diametrically opposite position and characterized by a lack of positive emotions) is particularly high in Portugal (15%), Estonia (14%), Hungary (13%), and Poland (11%).

W O R L D H A P P I N E S S R E P O R T 2 0 1 6 | S P E C I A L R O M E E D I T I O N
119
The probability of belonging to A8, which indicates the highest protection from unpleasant affects, is higher in Slovenia (16%), Italy (14%), Spain (11%), and Austria (11%), while severe mental distress, represented by A1, seems quite widespread in Portugal (26%), Hungary (21%), Poland (21%), and Spain (20%).
There is a higher probability for individuals in Italy and Spain to belong to A7, which rep-resents moderate well-being, whereas individu-
als in Germany, Estonia, France, the Czech Republic, and Belgium have a high probability of belonging to A2, which has a less-intense degree of unpleasant emotions than A1.
Finally, A3, which captures a condition of mod-erate multidimensional well-being, is wide-spread in the Netherlands, Sweden, Switzerland, and France; while a moderate lack of positive emotions seems to mark Portugal (18.6%), the Czech Republic (14%), and Italy (13%).
Table 4: Distribution of the different forms of multidimensional well-being in European countries.
c1 c2 c3 c4 c5 c6 c7 c8
Denmark 5,56 8,85 21 50,12 1,45 2,81 4,5 5,71
Sweden 4,6 13,64 24,19 33,11 3,14 5,11 8,98 7,24
Switzerland 5,03 11,32 23,42 45,26 0,95 2,18 4,11 7,73
Austria 8,77 12,89 15,97 35,79 3,8 4,27 7,06 11,45
Netherlands 5,38 12,29 25,51 38,73 1,37 3,09 5,54 8,08
Germany 10,46 18,86 21,78 23,13 4,63 4,91 8,4 7,83
Belgium 13,76 17,62 19,91 20,99 3,9 8,24 8,28 7,29
Italy 15,06 14,11 12,81 8,01 8,55 13,35 14,52 13,6
Spain 19,82 11,96 12,57 13,28 8,44 8,89 13,76 11,28
Poland 20,55 17,16 16,63 12,07 11,09 9,78 6,59 6,13
Slovenia 9,03 13,32 19,37 20,65 5,49 6,51 9,32 16,3
Czech Republic 17,63 18,05 13,34 10,5 6,37 14,13 11,93 8,04
France 13,15 18,32 23,28 21,04 4,52 5,77 7,3 6,62
Portugal 26,02 13,92 6,51 2,58 14,73 18,66 10,32 7,26
Hungary 21,51 16,24 12,71 10,16 12,6 10,09 9,6 7,09
Estonia 15,84 18,85 15,12 8,95 14,15 11,83 8,93 6,33
Total 13,44 15,31 17,52 21,28 6,65 8,37 8,84 8,59
We run a multinomial logit regression model to make clear the importance how the patterns of cumulative SWB are shaped by socio-demo-graphic characteristics (like age, gender, and marital status); traditional forms of social strati-fication (years of education and income quin-tile); health-risk factors (including body mass index, smoking, alcohol consumption, and physical activity); and social-capital indicators (receive help from outside the household and give help to others outside the household).
Since the outcome is a categorical variable, each of the seven macro-clusters is contrasted with area A4 (the biggest and best one in terms of cumulative well-being). Separate intercept and slope parameters are estimated for each con-trast. Since the cumulative well-being state is the reference group in the model, a positive coeffi-cient indicates that a specific heterogeneity factor is positively correlated with the likelihood that one will be in a given macro-cluster j (c1, c2, c3, c5, c6, c7, c8) rather than in area A4 (the

120
reference group). Below, we present the estima-tion results obtained by our model.
**c1
The chances of being in A1 (the macro-cluster of negative emotion/depressive symptoms) rather than in A4 (the macro-cluster of cumulative well-being) are higher for females, for individu-als who are separated or divorced, for individuals living in large families, and for individuals who receive help from outside the household. Logits are also higher for those who smoke and have a low level of physical activity. Being married, having a high level of education, belonging to the higher income quintiles, alcohol consump-tion, and being of normal weight or overweight are factors that significantly reduce the chances of belonging to this area.
**c2
From the second contrast, an outline emerges that is similar to the first one: the factors that increase or decrease the chances of belonging to A2 are about the same as previously observed, although there is a reduction in the strength of the effects related to heterogeneity factors. An important difference is the positive effect linked to giving help to others, which in the previous contrast was of the opposite sign, although it was statistically non-significant.
**c3
The likelihood of belonging to A3, which is spatially adjacent to A4, is higher for females, people living in larger families, individuals who receive help from outside the household and who have given help to others outside the household, obese people (BMI of 30 and above), people who have ever smoked daily and those who have a low level of physical activity. Again, the coefficients associated with years of educa-tion and income quintiles have a negative and statistically significant sign, although of a lower magnitude than in the previous contrast.
**c5
In the contrast between A5 (a lack of positive emotions) and A4, the role of education and income is clear in protecting against this form of multidimensional ill-being: The inverse relation-ship between years of education and income quintile, on the one hand, and ill-being, on the other, is almost linear. Other factors that have a protective effect are being female (unlike in the previous contrasts), being married, separated/divorced or a widow(er), having a greater num-ber of children, giving help to others, being of normal weight or overweight, and alcohol consumption. The factors that have a positive effect are house size, receiving help from out-side the household, smoking, sedentariness, and physical inactivity.
**c6
It is not surprising that the predictive character-istics of belonging to A6 are very similar to those of belonging to A5, given the spatial contiguity between the two macro-clusters. Once again, the inverse relationship between the number of years of education and the income quintile, on the one hand, and the chances of belonging to A6, on the other, is almost linear, although the correlation is lower than in the previous contrast. Also as with A5, being female, being married, separated/divorced or a wid-ow(er), having a greater number of children, giving help to others, and alcohol consumption have negative and statistically significant effects; household size, receiving help from outside the household, smoking at the present time, and physical inactivity have the opposite effect.
**c7
The estimates of the parameters referred to in the contrast between A7 and A4 are modelled once again on what came to light in the two previous comparisons, even if, as we move towards the bottom of the map, the discriminat-ing strength of the factors of heterogeneity decreases: Being female, married or a widow(er),

W O R L D H A P P I N E S S R E P O R T 2 0 1 6 | S P E C I A L R O M E E D I T I O N
121
and having a higher number of children reduce the chances of belonging to A7. Years of educa-tion, income quintile, giving help to others, and alcohol consumption have a negative effect, while smoking at the present time and physical inactivity have a positive one.
**c8
The final contrast concerns A8, which rep-resents a macro-cluster with high protection from unpleasant affects and depressive symp-toms and which is spatially contiguous to the area of reference (A4). Once again, being fe-male, having a greater number of children, having a greater number of years of education, being in a higher income quintile, giving help to others, and alcohol consumption decrease the chances of belonging to A8, while smoking at the present time and physical inactivity have the opposite effect.
Table 5: Multinomial logit regression: Estimation results (n. id=47913). (Part 1)
c1 c2 c3 c5 c6 c7 c8
Age (centred at 65 years) 0,016*** 0,018** 0,012*** 0,049*** 0,026*** 0,016*** 0,004
(0,00) (0,00) (0,00) (0,00) (0,00) (0,00) (0,00)
Age squared (divided by 100) 0,063*** 0,045** 0,024 0,113*** 0,057** 0,062*** 0,058***
(0,02) (0,01) (0,01) (0,02) (0,02) (0,02) (0,02)
Female 0,330*** 0,307*** 0,129*** -0,545*** -0,564*** -0,509*** -0,562***
(0,04) (0,04) (0,03) (0,05) (0,05) (0,04) (0,04)
Never married (cat.ref.)
Married and living together with spouse -0,356*** -0,185* -0,074 -0,824*** -0,450*** -0,438*** -0,070
(0,09) (0,08) (0,08) (0,10) (0,09) (0,09) (0,09)
Living separated from spouse/divorced 0,222* 0,028 0,038 -0,311** -0,187 -0,064 0,018
(0,10) (0,09) (0,09) (0,12) (0,11) (0,10) (0,11)
Widowed -0,152 -0,201* -0,143 -0,551*** -0,441*** -0,443*** -0,112
(0,10) (0,09) (0,09) (0,11) (0,11) (0,11) (0,11)
Household size 0,107*** 0,102*** 0,074*** 0,124*** 0,119*** 0,101*** 0,018
(0,02) (0,02) (0,02) (0,03) (0,02) (0,02) (0,02)
Number of children -0,019 -0,012 0,013 -0,069*** -0,052** -0,057*** -0,068***
(0,01) (0,01) (0,01) (0,02) (0,02) (0,02) (0,02)
Years of education -0,113*** -0,044*** -0,019*** -0,133*** -0,083*** -0,046*** -0,026***
(0,00) (0,00) (0,00) (0,01) (0,01) (0,01) (0,00)
1. Income quintile (cat. ref.)
2. Income quintile -0,217*** -0,057 -0,023 -0,309*** -0,248*** -0,194** -0,115
(0,06) (0,06) (0,06) (0,07) (0,07) (0,07) (0,07)
3. Income quintile -0,431*** -0,193*** -0,146** -0,646*** -0,520*** -0,419*** -0,363***
(0,06) (0,06) (0,06) (0,07) (0,07) (0,07) (0,07)

122
4. Income quintile -0,602*** -0,302*** -0,188*** -0,941*** -0,747*** -0,548*** -0,434***
(0,06) (0,06) (0,06) (0,08) (0,07) (0,07) (0,07)
5. Income quintile -1,043*** -0,631*** -0,315*** -1,338*** -1,158*** -0,849*** -0,574***
(0,07) (0,06) (0,06) (0,09) (0,07) (0,07) (0,07)
Received help from outside the household
1,118*** 0,686*** 0,429*** 0,967*** 0,432*** -0,015 -0,076
(0,05) (0,05) (0,05) (0,06) (0,06) (0,06) (0,07)
Given help to others outside the household
-0,035 0,182*** 0,093** -0,470*** -0,273*** -0,148** -0,290***
(0,04) (0,04) (0,03) (0,06) (0,05) (0,05) (0,05)
1. bmi: below 18.5 -underweight (cat.ref.)
2. bmi 18.5 - 24.9 - normal -0,686*** -0,556*** -0,193 -0,552** -0,141 -0,262 -0,061
(0,16) (0,15) (0,15) (0,20) (0,22) (0,21) (0,21)
3. bmi 25-29.9 -overweight -0,541*** -0,338* -0,007 -0,507* 0,090 -0,055 0,069
(0,16) (0,15) (0,15) (0,20) (0,22) (0,21) (0,21)
4. bmi 30 and above -obese -0,039 0,120 0,313* 0,070 0,356 0,134 0,124
(0,16) (0,15) (0,16) (0,20) (0,22) (0,21) (0,22)
Smoke at the present time 0,444*** 0,160*** 0,006 0,528*** 0,423*** 0,324*** 0,314***
(0,05) (0,05) (0,05) (0,07) (0,06) (0,06) (0,06)
Ever smoked daily 0,189*** 0,188*** 0,125*** 0,216*** -0,031 -0,052 -0,151**
(0,04) (0,04) (0,04) (0,06) (0,05) (0,05) (0,05)
days a week consumed alcohol last 3 months: not at all (cat.ref.)
less than once a month -0,459*** -0,156** -0,104 -0,507*** -0,236** -0,047 -0,126
(0,06) (0,06) (0,06) (0,08) (0,07) (0,07) (0,07)
once or twice a month -0,602*** -0,253*** -0,140** -0,809*** -0,311*** -0,192** -0,338***
(0,06) (0,06) (0,05) (0,09) (0,07) (0,07) (0,07)
once or twice a week -0,842*** -0,353*** -0,190*** -0,915*** -0,452*** -0,284*** -0,412***
(0,06) (0,05) (0,05) (0,08) (0,07) (0,06) (0,06)
three or four days a week -0,687*** -0,325*** -0,086 -0,940*** -0,491*** -0,278** -0,459***
(0,09) (0,07) (0,06) (0,13) (0,09) (0,09) (0,08)
five or six days a week -0,479*** -0,273** -0,054 -0,845*** -0,125 -0,141 -0,494***
(0,12) (0,10) (0,09) (0,18) (0,12) (0,12) (0,12)
almost every day -0,660*** -0,260*** -0,142** -0,673*** -0,438*** -0,217*** -0,375***
(0,06) (0,05) (0,05) (0,07) (0,07) (0,06) (0,06)
1.sport
sports or activities that are vigorous: more than once a week (cat.ref.)
Table 5: Multinomial logit regression: Estimation results (n. id=47913). (Part 2)

W O R L D H A P P I N E S S R E P O R T 2 0 1 6 | S P E C I A L R O M E E D I T I O N
123
once a week 0,502*** 0,244*** 0,214*** 0,398*** 0,451*** 0,302*** 0,222***
(0,06) (0,05) (0,04) (0,09) (0,06) (0,06) (0,06)
one to three times a month 0,840*** 0,551*** 0,389*** 0,921*** 0,694*** 0,623*** 0,462***
(0,07) (0,06) (0,06) (0,10) (0,07) (0,07) (0,07)
hardly ever, or never 1,490*** 0,784*** 0,427*** 1,719*** 0,909*** 0,615*** 0,304***
(0,05) (0,04) (0,04) (0,06) (0,05) (0,05) (0,05)
_cons 1,033 -0,018 -0,700 1,093 -0,052 1,191 2,665***
(0,73) (0,68) (0,65) (0,96) (0,85) (0,81) (0,79)
Robust standard errors in parentheses; significance levels: ***p≤0.001, **p≤0.01, *p≤0.05 Estimates include (but don’t show) country dummies %Final quantization error: 5.057 %Final topographic error: 0.025
]According to the estimates of the parameters reported in Table 5, membership in these areas is deeply influenced by some important hetero-geneity factors whose effect maintains the same sign in correspondence of the different con-trasts, whereas the intensity follows a pattern of topological distance of the macro-cluster. More concretely, areas A1 and A5, which are further from the reference category (A4), show stronger effects (or discriminatory power) in relation to the number of years of education and income in respect to closer areas.
Finally, in all the contrasts, we observe a curvi-linear relationship with age, with a positive instantaneous rate of change and a positive curvature. A positive coefficient for age and a positive coefficient for age squared cause the curve to increase at a increasing rate.
In conclusion, it is worth highlighting applying standard regression models to observational data precludes attributing a causal relationship to the parameters of evaluation. The analysis here is an associative rather than a causal one, and it would be highly naïve to make causal conclusions from data and identification strategies that are weak because they do not consider the problem of reverse causality, or check for unobserved individual heterogeneity (which is generally
greater than the differences between groups). In short, we cannot confirm whether people who do physical exercise, are married, do not smoke, are more educated, and belong to a higher income quintile are happier and healthier because they have intentionally chosen a certain lifestyle or whether, because they are happier and healthier, they benefit from a competitive advantage in terms of education and income, and have had more opportunities to choose a healthy lifestyle.
Conclusion
This paper proposes the application of an inno-vative technique of clustering and projection—the Self-Organizing Map—to identify multidi-mensional patterns of subjective well-being in contemporary Europe, and to overcome the limitations inherent in standard approaches based on a single measure of life satisfaction, or on synthetic indices that are unable to capture these multidimensional patterns. Starting from a rich set of hedonic and eudaimonic indicators from the fourth wave (2010–11) of SHARE, which refer to positive and negative affects, somatic disorders, vitality/apathy, self-efficacy, physical and mental health, and an evaluation of some important life domains, the study has extrapolated a topological map.
Table 5: Multinomial logit regression: Estimation results (n. id=47913). (Part 3)
124
This map is composed of 48 micro-clusters that are subsequently grouped into eight prototypical macro-cluster or areas, each of which describes a specific profile. By and large, areas located on the upper part of the map indicate a greater degree of depression and psychophysical ill-be-ing, while areas on the bottom identify a greater degree of SWB, characterized by pleasant emo-tions, self-determination, good health, and a high degree of satisfaction with life and life circumstances. More precisely, the analysis carried out here indicates that one in three Europeans enjoys a state of multidimensional well-being (areas A4 and A8), one in five has unpleasant or a lack of pleasant emotions (A1 and A5), one in five is in a condition of psycho-logical fragility (A2 and A6), and the remaining 27 percent are in a state of moderate well-being (A4 and A7).
Although the vertical axis shows a discriminant power that is higher than the horizontal one, the latter is quite useful in enabling us to capture a certain degree of bipolarity between the pres-ence of unpleasant emotions and the lack of pleasant emotions. More specifically, in the upper right area of the map we can find individ-uals who have no hopes for the future, have not enjoyed any activity recently, rarely look back on life with a sense of happiness, rarely think they can do the things they want to do, rarely look forward to each day, rarely feel that their life has meaning, rarely feel full of energy, rarely feel that life is full of opportunities, rarely feel that their future is bright, and are relatively dissatis-fied with their free-time activities and their personal relationships. The area at the top left of the map indicates individuals who are more likely to have been sad or depressed within the last month, wish they were dead, blame them-selves, have trouble sleeping, have less interest in things than usual, feel irritable, lack appetite, feel fatigue, have cried in the last month, have suffered from depression or other affective disorders, fear the worst most of the time, are nervous most of the time, have trembling hands,
are afraid of dying, feel faint, often think that family responsibilities prevent them from doing what they want to do, and believe that a shortage of money keeps them from doing the things they want to do.
As affirmed by some authors, it seems that the cause for such a polarization can be attributed to different neurobiological systems.42 Some indica-tors that represent holistic ideas of a cognitive or emotional nature, such as life satisfaction and self-assessed health, show a low degree of polar-ization on the map, which means that it is not possible to determine whether the type of detect-ed ill-being (or well-being) is caused by the lack (or presence) of positive emotions or by the presence (or lack) of negative emotions.43 In conclusion, in going beyond the mapping stage, we have discovered important variations in the distribution of the different forms of multidi-mensional well-being, in relation to some im-portant observed heterogeneity factors.
In general, married individuals who maintain a healthy lifestyle; are well educated and wealthy; and reside in Denmark, Switzerland, the Nether-lands, Austria, or Sweden are more likely to belong to the macro-cluster of highest well-be-ing. Separated/divorced individuals with a low level of education and a low income who are exposed to health risks and reside in Portugal, Estonia, Hungary, or Poland have a high proba-bility of belonging to the clusters of psychophys-ical discomfort and lack of positive emotions.

W O R L D H A P P I N E S S R E P O R T 2 0 1 6 | S P E C I A L R O M E E D I T I O N
125
1. Arthaud-Day, Rode, Mooney, and Near (2005); Diener, Suh, Lucas, and Smith (1999).
2. Diener et al. (1999); Diener et al. (2003); Seligman and Csikszentmihalyi (2000;) Seligman (2002); Waterman (1993); Ryan and Deci (2001).
3. Seligman et al. (2005).
4. Pavot and Diener (1993).
5. Ryff (1989); Seligman et al. (2005); Massimini and Delle Fave (2000); Steger et al. (2006); Waterman et al. (2010).
6. Ryff e Keyes (1995); Ryff and Singer (1998); Ryff, Singer and Love (2004).
7. Ryan and Deci (2000).
8. Boniwell (2012).
9. Waterman (1993).
10. Csikszentmihalyi (1992).
11. Diener et al. (1985); Diener (2000); Pavot and Diener (2008); Fredrickson (2001).
12. Nesse (2005).
13. Arthaud-Day et al. (2005); Bradburn and Caplovitz (1965); Bradburn (1969); Watson et al. (1988).
14. Diener et al. (1999).
15. Diener et al. (1999).
16. cf. Watson et al. (1999).
17. Bruder et al. 1(997); Davidson (1992); Tomarken and Keener (1998).
18. Barbara Fredrickson (2001, 2009).
19. Fredrickson (2009, p. 234).
20. Diener et al. (1999).
21. Arthaud-Day et al., (2005).
22. Prince et al. (1999).
23. Lyubomirsky and Lepper (1999); Arthaud-Day et al. (2005).
24. Andrews and Withey (1976).
25. Campbell et al. 1976).
26. Diener et al. (1985).
27. Kammann and Flett (1983).
28. Bradburn (1969).
29. Watson et al. (1988).
30. Diener et al. (2010).
31. Beck et al. (1961).
32. Prince et al. (1999).
33. cf. Diener et al. (2010).
34. cf. Diener et al. (1999).
35. Kohonen (1982).
36. The target population for the baseline samples consists of all persons born in 1960 or earlier having their regular residence in the respective country, together with their current partners/spouses, independent of age (Börsch-Supan, 2013).
37. Scheier and Carver (1985).
38. Vesanto et al. (2000).
39. Kohonen (2001).
40. Diener et al. (1999); Watson et al. (1999).
41. Pavot and Diener (1993); Arthaud-Day et al. (2005); Prince et al. (1999).
42. Diener et al. (1999).
43. Diener and Emmons (1984); Veenhoven (1984).
126
References
Andrews, F. M., & Withey, S. B. (1976). Social Indicators of well-being: Americans’perceptions of life quality. New York: Plenum.
Arthaud-Day, M. L., Rode, J. C., Mooney, C.H., & Near, J. P. (2005). The subjective well-being construct: a test of its convergent, discriminant, and factorial validity. Social Indicators Research, 74, pp. 445–476.
Beck, A.T., Ward, C. H., Mendelson, M., Mock, J., & Erbaugh, J. (1961). An inventory for measuring depression. Archives of General Psychiatry 4, pp. 561–571.
Boniwell, I. (2012). Positive psychology in a nutshell. The science of happiness. Maidenhead: Open University Press.
Börsch-Supan, A. (2013). Survey of health, ageing and retirement in europe wave 4 (release version 1.1.1.). DOI: 10.6103/SHARE.w4.111
Bradburn, N. M. (1969). The structure of psychological well-be-ing. Chicago, IL: Aldine Publishing Company.
Bradburn, N. M., & Caplovitz, D. (1965). Reports on happiness. Chicago, IL: Aldine Publishing Company.
Bruder, G.E., Fong, R., Tenke, C.E., Leite, P., Towey, J.P., & Stewart, J.E. (1997). Regional brain asymmetries in major depression with or without an anxiety disorder: A quantitative electroencephalographic study. Biological Psychiatry, 41, pp. 939–948.
Csikszentmihalyi, M. (1992). Flow. The psychology of happiness. London: Rider.
Davidson, R. J. (1992). Emotion and affective style: Hemi-spheric substrates. Psychological Science, 3, pp. 39–43.
Diener, E. (2000). Subjective well-being: The science of happiness, and a proposal for a national index. American Psychologist, 55, pp. 34–43.
Diener, E., & Emmons, R.A. (1984). The independence of positive and negative affect. Journal of Personality and Social Psychology, 47, 1105–1117.
Diener, E., Emmons, R. A., Larsen, R. J., & Griffin, S. (1985). The satisfaction with life scale. Journal of Personality Assess-ment, 49, 71–75.
Diener, E., Suh, E. M., Lucas, R. E., & Smith, H. L. (1999). Subjective well-being: Three decades of progress. Psychological Bulletin, 125, pp. 276–302.
Diener E., Oishi, S., & Lucas, R.E. (2003). Personality, culture and subjective well-being: Emotional and cognitive evalua-tions of life. Annual Review of Psychology, 59, pp. 229–259.
Diener, E., Ng, W., Harter, J. & Arora, R. (2010). Wealth and happiness across the world: Material prosperity predicts life evaluation, whereas psychosocial prosperity predicts positive feeling. Journal of Personality and Social Psychology, 99, pp. 52–61.
Diener, E., Wirtz, D., Tov, W., Kim-Prieto, C., Choi, D. W., Oishi, S., & Biswas-Diener, R. (2010).
New well-being measures: Short scales to assess flourishing and positive and negative feelings. Social Indicators Research, 97(2), 143–156.
Fredrickson, B.L. (2001). The role of positive emotions in positive psychology: The broaden-and-build theory of positive emotion. American Psychologist, 56, pp. 218–226.
Fredrickson, B.L. (2009). Positivity. Crown Publishers.
Kammann, N.R., & Flett, R. (1983). Affectometer 2: A scale to measure current level of general happiness. Australian Journal of Psychology, 35(2), 259–265.
Kohonen, T. (1982). Self-organized formation of topologically correct feature maps. Biological Cybernetics, 43, pp. 59–69.
Kohonen, T. (2001). Self-Organizing Maps. Berlin: Springer.
Lyubomirsky, S., & Lepper, H. (1999). A measure of subjective happiness: Preliminary reliability and construct validation. Social Indicators Research, 46, pp. 137–155.
Massimini, F., & Delle Fave, A. (2000). Individual develop-ment in a bio-cultural perspective. American Psychologist, 55, pp. 24–33.
Nesse, R. M. (2005). Natural selection and the regulation of defenses: A signal detection analysis of the smoke detector principle. Evolution and Human Behavior, 26, pp. 88–105.
Pavot, W., & Diener, E. (1993). Review of the satisfaction with life scale. Psychological Assessment, 5, pp. 164–172.
Pavot, W., & Diener, E. (2008). The satisfaction with life scale and the emerging construct of life satisfaction. The Journal of Positive Psychology, 3, pp. 137–152.
Prince, M.J., Reischies, F., Beekman, A.T.F (1999): Develop-ment of the EURO-D scale – a European Union initiative to compare symptoms of depression in 14 European centres. British Journal of Psychiatry, 174, pp. 330–38.
Ryan, R.M., & Deci, E.L. (2000). Self-determination theory and the facilitation of intrinsic motivation, social develop-ment, and well-being. American Psychologist, 55, pp. 68–78.
Ryan, R.M., & Deci, E.L. (2001). On happiness and human potentials: A review of research on hedonic and eudaimonic well-being. In Fiske, S. (Ed). Annual review of psychology (Vol. 52, pp. 141–166). Palo Alto, CA: Annual Reviews Inc.

W O R L D H A P P I N E S S R E P O R T 2 0 1 6 | S P E C I A L R O M E E D I T I O N
127
Ryff, C.D. (1989). Happiness is everything, or is it? Explora-tions on the meaning of psychological well-being. Journal of Personality and Social Psychology, 57, pp. 1069–1081.
Ryff, C., & Keyes, C. (1995). The structure of psychological well-being revisited. Journal of Personality and Social Psychology, 69, pp. 719–727.
Ryff, C. D., & Singer, B. H. (1998). The contours of positive human health. Psychological Inquiry, 9, pp. 1–28.
Ryff, C. D., Singer, B. H., & Love, G. D. (2004). Positive health: Connecting well-being with biology. Philosophical Transactions of the Royal Society of London B, 359, pp. 1383–1394.
Scheier, M. F. & Carver, C. S. (1985). Optimism, coping, and health: assessment and implications of generalized outcome expectancies. Health Psychology, 4, pp. 219–247.
Seligman, M.E.P., & Csikszentmihalyi, M. (2000). Positive psychology: An introduction. American Psychologist, 55(1), 5–14.
Seligman, M.E.P. (2002). Authentic happiness: Using the new positive psychology to realize your potential for lasting fulfillment). New York: Free Press.
Seligman, M.E.P., Steen, T.A., Park, N. & Peterson, C. (2005). Positive psychology progress: empirical validation of interven-tions. American Psychologist, 60, pp. 410–421.
Steger, M. F., Frazier, P., Oishi, S., & Kaler, M. (2006). The meaning in life questionnaire: Assessing the presence of and search for meaning in life. Journal of Counseling Psychology, 53, pp. 80–93.
Tomarken, A. J., & Keener, A. D. (1998). Frontal brain asymmetry and depression: A self–regulatory perspective. Cognition and Emotion, 12, pp. 387–420.
Veenhoven, R. (1984) Databook of Happiness. Dordrecht: Reidel Publishing Company.
Vesanto, J., Himberg, J., Alhoniemi, E., & Parhankangas, J.(2000). SOM toolbox for Matlab 5, Technical Report A57. Finland: Helsinki University of Technology.
Waterman, A.S. (1993). Two conceptions of happiness: Contrasts of personal expressiveness (eudaimonia) and hedonic enjoyment. Journal of Personality and Social Psychology, 64(4), 678–691.
Waterman, A.S., Schwartz, S.J., Zamboanga, B.L., Ravert, R.D., Williams, M.K., Agocha, M.B., & Donnellan, V.B. (2010). The questionnaire for eudaimonic well-being: Psychometric properties, demographic comparisons, and evidence of validity. The Journal of Positive Psychology, 5(1), 41–61.
Watson, D., Clark, L. A., & Tellegen, A. (1988). Development and validation of brief measures of positive and negative affect: The PANAS Scales, Journal of Personality and Social Psychology, 54(6), 1063–1070.
Watson, D., Wiese, D., Vaidya, J., & Tellegen, A. (1999). The two general activation systems of affect: Structural findings, evolutionary considerations, and psychobiological evidence. Journal of Personality and Social Psychology, 76, 820–838.

Edited by Jeffrey Sachs, Leonardo Becchetti, Anthony Annett
This publication may be reproduced using the following reference:Sachs, J., Becchetti, L., & Annett, A. (2016). World Happiness Report 2016, Special Rome Edition (Vol. II). New York: Sustainable Development Solutions Network.
World Happiness Report management by Sharon Paculor and Anthony Annett, copy edit by Jill Hamburg Coplan, Aditi Shah and Saloni Jain, design by John Stislow and Stephanie Stislow, cover design by Sunghee Kim.
Full text and supporting documentation can be downloaded from the website:http://worldhappiness.report/ #happiness2016
ISBN 978-0-9968513-4-3 Volume II
SDSN
The Sustainable Development Solutions Network (SDSN) engages scientists, engineers, business and civil society leaders, and development practitioners for evidence based problem solving. It promotes solutions initiatives that demonstrate the potential of technical and business innovation to support sustainable development (www.unsdsn.org).
Sustainable Development Solutions Network314 Low Library 535 W 116th StreetNew York, NY 10027USA


WORLD HAPPINESS REPORT 2016 | VOLUME IISpecial Rome Edition