Embed Size (px)
Citation preview

Alex Gyani, Roz Shafran, Richard Layard and David Clark Enhancing recovery rates in IAPT services: lessons from analysis of the year one data Report Original citation: Gyani, Alex and Shafran, Roz and Layard, Richard and Clark, David (2011) Enhancing recovery rates in IAPT services: lessons from analysis of the year one data. Improving Access to Psychological Therapies, London, UK. This version available at: http://eprints.lse.ac.uk/47486/ Originally available from [name of research center – make hyperlink to webpage] Available in LSE Research Online: November 2012 © 2011 IAPT LSE has developed LSE Research Online so that users may access research output of the School. Copyright © and Moral Rights for the papers on this site are retained by the individual authors and/or other copyright owners. Users may download and/or print one copy of any article(s) in LSE Research Online to facilitate their private study or for non-commercial research. You may not engage in further distribution of the material or use it for any profit-making activities or any commercial gain. You may freely distribute the URL (http://eprints.lse.ac.uk) of the LSE Research Online website.

P a g e | 0
Restricted
Enhancing Recovery Rates in IAPT Services: Lessons from analysis of the Year One data.
Alex Gyani1, Roz Shafran1, Richard Layard2 & David M Clark3 1University of Reading, 2London School of Economics, 3Kings College London

P a g e | 1
Contents
1. Background and Summary of Findings ............................................................................................................... 4
Background ............................................................................................................................................................... 4
Summary of Findings ................................................................................................................................................. 5
Understanding variability in performance ............................................................................................................ 5
Understanding stepped care................................................................................................................................. 6
Understanding the impact of ‘trade-offs’ ............................................................................................................. 6
Understanding self-referral .................................................................................................................................. 6
Investigating the importance of NICE compliance in high intensity treatment .................................................... 7
Investigating the importance of NICE compliance in low intensity treatment ..................................................... 7
Severity and treatment received .......................................................................................................................... 8
Mix of experienced staff and trainees .................................................................................................................. 8
Identifying factors associated with a lack of diagnosis ......................................................................................... 8
Reliable deterioration and reliable improvement ................................................................................................ 9
Conclusions .............................................................................................................................................................. 10
2. Introduction ..................................................................................................................................................... 11
Understanding How Site and Patient Variance Affects Patient Outcome ............................................................... 12
Factors investigated ............................................................................................................................................ 14
Factors not investigated ..................................................................................................................................... 15
What does drop out mean? ................................................................................................................................ 15
Site Variation ........................................................................................................................................................... 16
Limitation of site level variables ......................................................................................................................... 20
Selecting the banding cut off .............................................................................................................................. 21
What is ‘other treatment’? ................................................................................................................................. 22
Problems with session data ................................................................................................................................ 22
Patient Level Variables ............................................................................................................................................ 24
What impact does severity have on the treatment type and number of sessions a patient receives? ............. 24
Diagnosis ............................................................................................................................................................. 27
Summary ................................................................................................................................................................. 30
3. Which Factors Predict Recovery? ..................................................................................................................... 31
How was the Model Created? ................................................................................................................................. 33
Regression Model Summary .................................................................................................................................... 33
How much variance was explained? ................................................................................................................... 33
Model description ............................................................................................................................................... 34
Site Level Correlations ............................................................................................................................................. 35
Correlations associated with recovery ................................................................................................................ 35
Associations with the number of sessions .......................................................................................................... 37
Associations with self-referral and step-up rates ............................................................................................... 38
Type of treatment received ................................................................................................................................ 38
The Influence of Patients’ Initial Scores on the Amount of Clinical Improvement ................................................... 39

P a g e | 2
Hypothetical Recovery Rates if Patients Who Have Not Recovered at Low Intensity are Stepped Up .................... 42
Investigating Self-referral ........................................................................................................................................ 43
Initial Severity ..................................................................................................................................................... 43
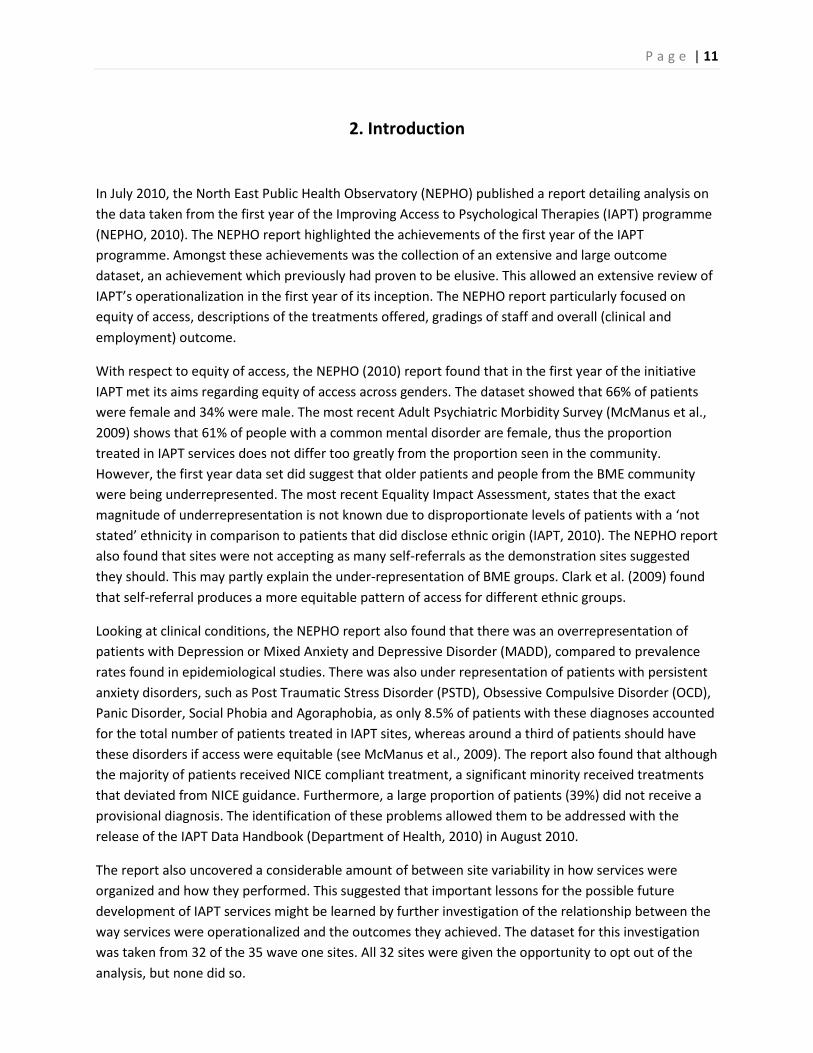
The effect on recovery ........................................................................................................................................ 44
The effect on treatment received ....................................................................................................................... 44
Psychotropic Medication ......................................................................................................................................... 46
Understanding Agenda for Change Bandings ......................................................................................................... 47
Summary ................................................................................................................................................................. 50
4. Investigating the Importance of Providing NICE Compliant High Intensity Treatment ...................................... 52
Counselling and CBT ............................................................................................................................................ 53
Comparing Recovery Rates ...................................................................................................................................... 54
Possible Confounds in the Comparison between CBT and counselling. ................................................................... 55
Summary ................................................................................................................................................................. 58
5. Investigating the Importance of Providing NICE Compliant Low Intensity Treatment ...................................... 59
Investigating Recovery Rates .................................................................................................................................. 60
Testing Initial Scores ................................................................................................................................................ 61
Step Up Rates Following Guided and Pure Self-Help. .............................................................................................. 61
Summary ................................................................................................................................................................. 62
6. Investigating the Factors Associated with a Lack of Diagnosis .......................................................................... 63
The Effect of Demography ....................................................................................................................................... 64
The Effect of Initial Severity ..................................................................................................................................... 65
The Effect of Treatment and Therapists .................................................................................................................. 66
The Effect of Referral Source ................................................................................................................................... 69
Summary ................................................................................................................................................................. 70
7. Reliable Deterioration and Improvement ........................................................................................................ 71
Reliable Deterioration across the Whole Population .............................................................................................. 71
Reliable Deterioration within Diagnoses ................................................................................................................. 71
Depression .......................................................................................................................................................... 71
Generalised Anxiety Disorder ............................................................................................................................. 72
Site Variation in the Proportion of Patients showing Reliable Deterioration .......................................................... 72
Reliable Improvement ............................................................................................................................................. 73
Summary ................................................................................................................................................................. 75
8. References ....................................................................................................................................................... 76

P a g e | 3
9. Annex: Investigating Whether the Results from the Regression Model Generalise to a Sample Which Includes
Patients Without an ICD-10 Code ......................................................................................................................... 78
How much variance was explained? ................................................................................................................... 78
Model description ............................................................................................................................................... 78
Site Level Correlations in Secondary Model Cohort ................................................................................................. 80
Associated with recovery .................................................................................................................................... 80
The number of sessions given to patients .......................................................................................................... 81
Self-referral and step-up rates ............................................................................................................................ 81
Summary ................................................................................................................................................................. 82

P a g e | 4
1. Background and Summary of Findings
Background
The Improving Access to Psychological Therapies (IAPT) initiative was designed to address the need for a
much larger psychological therapies service aimed at providing treatment for patients suffering from
depression and anxiety disorders (Layard, 2006). Pilot work was undertaken in Newham and Doncaster
(see Clark, Layard, Smithies, Richards, Suckling & Wright, 2009) and the national implementation plan
was published in early 2008 (Department of Health, 2008). Roll-out to at least 20 sites in 2008/9 was
agreed in the first year, with full roll-out to follow in the subsequent years. This aim was surpassed as 35
sites were launched in the first year of IAPT. The monitoring and evaluation of the programme was
considered an integral part of IAPT. The programme stipulated a minimum dataset, which recorded the
care provided to each service user and his or her clinical progress. The collection of such an extensive
and large outcome dataset was an achievement previously found to be elusive (National Institute for
Mental Health, 2008). The stipulation of a minimum dataset for a programme as large as IAPT facilitated
an investigation into the performance of the programme.
In July 2010, the North East Public Health Observatory published a report detailing an initial analysis of
data taken from the first year of the IAPT programme (NEPHO, 2010). The report particularly focused on
equity of access, descriptions of the treatments offered, gradings of staff and overall outcome. With
respect to equity of access, the NEPHO (2010) report found that in the first year of the initiative, IAPT
met its aims regarding equity of access across genders. The dataset showed that 66% of patients were
female and 34% were male. The most recent Adult Psychiatric Morbidity Survey (McManus, Meltzer,
Brugha, Bebbington & Jenkins, 2009) shows that 61% of people with a common mental disorder are
female, thus the proportion treated in IAPT services does not differ too greatly from the proportion seen
in the community. However, the first year data set did suggest that older patients and people from the
BME (Black and minority ethnic) community were being underrepresented. The most recent Equality
Impact Assessment states that the exact magnitude of underrepresentation is not known due to
disproportionate levels of patients with a ‘not stated’ ethnicity in comparison to patients that did
disclose ethnic origin (IAPT, 2010). The NEPHO report also found that sites were not accepting as many
self-referrals as the demonstration sites suggested they should. This may partly explain the under-
representation of BME groups. Clark et al. (2009) found that self-referral produces a more equitable
pattern of access for different ethnic groups.
Looking at clinical conditions, the NEPHO report found that there was an overrepresentation of patients
with Depression or Mixed Anxiety and Depressive Disorder (MADD), compared to prevalence rates
found in epidemiological studies. There was also under representation of patients with persistent
anxiety disorders, such as Post Traumatic Stress Disorder (PTSD), Obsessive Compulsive Disorder (OCD),
Panic Disorder, Social Phobia and Agoraphobia, as only 8.5% of patients had these diagnoses out of the
total number of patients treated in IAPT sites, whereas around a third of patients should have these
disorders if access was equitable (see McManus et al., 2009). The report also found that the majority of
patients received NICE compliant treatment; however, a significant minority did not receive the NICE

P a g e | 5
recommended treatment for their disorder. Furthermore, a large proportion of patients (39%) did not
receive a provisional diagnosis. The identification of these problems led to them being addressed with
the release of the IAPT Data Handbook (Department of Health, 2010) in August 2010.
Turning to clinical outcomes, the NEPHO (2010) report found that the overall recovery rate in the
services was 42% for patients who received at least some treatment (defined as having at least 2
sessions on the assumption that the first session was always assessment). However, there was
considerable between site variability in recovery rates.
This report seeks to follow up the NEPHO (2010) report, particularly by trying to identify factors that
might explain the variability in outcome. If such factors can be identified, services may wish to take
them into account when considering how to further improve the quality of their work.
Summary of Findings
The dataset was taken from 32 of the wave one sites. This dataset does not contain anything by which
individual service users can be identified, such as names, NHS numbers or addresses. Sites were given
the opportunity to opt out of the analysis, but none choose to do so. In order for patients to be included
in the analyses they had to have concluded their treatment in IAPT sites, have received treatment, have
been cases at the start of treatment, have had enough sessions at sites for two sets of PHQ-9 and GAD-7
scores to be recorded and if patients were listed as having been unsuitable for treatment or as having
declined treatment they were required to have been listed as having received at least two sessions of
treatment. To be considered cases at the start of treatment patients were required to score above 9 on
the PHQ-9 and/or above 7 on the GAD-7 at assessment.
Understanding variability in performance
Logistic multiple regression techniques were used to investigate the variability in performance and how
the variability between sites and patients affected patients’ recovery, other things being equal. The
Movement to Recovery (MTR1) index used in the NEPHO report (NEPHO, 2010) was used in the analyses
presented in this report. This required that patients finished treatment with both PHQ-9 and GAD-7
scores below the clinical threshold for them to be considered as having recovered.
Overall, year one sites showed good levels of data completeness on the PHQ-9 and GAD-7. Of the
patients who had finished their involvement with the services and showed evidence of having attended
at least two sessions (including assessment), 91.4% had pre-treatment and end of treatment/last
available session scores.
Patients’ initial scores were found to be important factors in predicting patients’ likelihood of recovery.
The logistic regression model showed that the higher patients’ initial PHQ-9 and GAD-7 scores were, the
less likely they were to recover. However, this does not mean that more severe patients did not show as
much improvement as patients with lower scores. This is because severe patients would have to show
greater change on these measures to reach the threshold for recovery. Indeed, analysis of pre-

P a g e | 6
treatment to post-treatment change showed that patients whose initial scores were in the severe range
showed greater improvement on both the PHQ-9 and GAD-7 than patients with initial scores in the mild
or moderate range.
The higher the proportion of patients stepped up at a site, the more likely it was that patients treated at
the site recovered. The average number of treatment sessions recorded by a site was found to be an
important predictor of recovery. Sites with a higher average number of sessions had higher recovery
rates. (However, this finding has to be treated with caution as missing data means that session numbers
are likely to have been underestimated and the degree of underestimation may vary from site to site).
Patients were no more or less likely to recover if they were taking psychotropic medication at the start
of their treatment. Overall fewer patients were taking psychotropic medication after treatment at IAPT
sites than at the start of treatment. The likelihood of patients’ recovery was greater if they were treated
at a site where a substantial number of sessions were undertaken by therapists banded at Agenda for
Change (AfC) band 7 or above, compared to other sites where these workers accounted for fewer
sessions. This finding may suggest that sites require a mixture of experience within their workforce to
achieve optimal results.
Understanding stepped care
Sites that stepped up a greater number of patients were more likely to have higher recovery rates. If
patients still met caseness at the end of low intensity treatment, they were more likely to recover if they
were stepped up to receive high intensity treatment than if they were not stepped up. By stepping more
patients up who meet caseness after low intensity treatment recovery rates can be increased. If all
patients who completed low intensity treatment but were still cases were stepped up, it is estimated
that the overall recovery rate could have increased from the observed value of 42% to between 48% and
54%. The discrepancy between the two estimates is due to the fact that some patients did not recover
as they dropped out of the treatment, and thus it was not possible to step up all patients who did not
recover after low intensity treatment. It is likely that the actual recovery rate, if all patients who did not
recover were stepped up, is somewhere between these two figures.
Understanding the impact of ‘trade-offs’
The analysis has shown that the more patients a site treated, the more likely patients at that site were
to recover. The number of sessions offered to patients was not correlated with the number of patients
treated at a site. Sites at which a higher proportion of patients received low intensity interventions saw
a greater number of patients overall. This finding confirms one of the conclusions of the evaluations of
the Newham and Doncaster demonstration sites that making good use of low intensity work is a key
factor in ensuring that a service is able to see a substantial number of people.
Understanding self-referral
Self-referred patients did not differ from GP referred patients in terms of the severity of their depression
(assessed by PHQ-9) and anxiety (assessed by GAD-7) scores at pre-treatment. However, they did score
higher than GP referrals on the Work and Social Adjustment Scale (WSAS) indicating that they had
greater perceived functional impairment. Compared to GP referrals, self-referred patients were more
likely to receive low intensity treatment initially. The two groups did not differ in recovery rates (PHQ-9

P a g e | 7
and GAD-7) but self-referred patients had a greater reduction in WSAS scores. Finally, self-referred
patients who recovered had significantly fewer sessions than GP referred patients who recovered. This
may be because the self-referral patients have considered whether they wish to have psychological
therapy in more detail before they engage with the service and hence may have had a “head start”.
Investigating the importance of NICE compliance in high intensity treatment
While most patients received NICE recommended treatments, a significant number of patients with
certain conditions did not. This facilitated a natural experiment in which it was possible to assess
whether deviation from NICE guidelines was associated with reduced recovery rates. When considering
high intensity treatments, NICE recommends both CBT and counselling for mild to moderate depression
but only recommends CBT for any of the anxiety disorders. An analysis of the recovery rates amongst
patients who had both a pre and post treatment measures on the PHQ-9 and GAD-7 was broadly in line
with NICE recommendations. In depression, there was no difference in recovery rates between CBT and
counselling. However in generalised anxiety disorder (GAD) and Mixed Anxiety and Depressive Disorder
(MADD) patients who received CBT were more likely to recover than those who received counselling.
Investigating the importance of NICE compliance in low intensity treatment
The majority of patients who received low intensity treatment received NICE-approved interventions,
such as guided self-help, psychoeducation groups, computerised CBT and structured exercise. However,
a substantial number of patients received pure self-help, which has a less clear role in NICE guidance.
The original (NICE 2004a) and the updated (2009) depression guidelines support the use of guided self-
help and do not recommend pure self-help. By contrast, the original panic disorder and generalised
anxiety disorder guideline (2004b) failed to distinguish between guided and pure self-help and the
revised guideline (2010) specifically recommends pure self-help as well as guided self-help.
The year one dataset provides a natural experiment for comparing the outcomes associated with guided
self-help and pure self-help within particular diagnoses. No significant differences were found between
the initial PHQ-9 and GAD-7 scores of patients who received guided and pure self-help across diagnoses.
An investigation into the recovery rates amongst patients who had two sets of PHQ-9 and GAD-7 scores
found that amongst patients who were diagnosed with a depressive episode, those who received guided
self-help were more likely to recover than those who received pure self-help. No differences were found
amongst patients with GAD. However, if one includes patients who did not return to allow collection of
a second set of PHQ-9 and GAD-7 and assumes they showed no change, pure self-help was associated
with a significantly lower recovery rate than guided self-help. This result is due to the fact that a
significant number of people who were given self-help materials failed to attend any further sessions.
The patients’ reasons for not returning to services are not known, nor is it known whether their
condition had actually improved, deteriorated or stayed the same.
Overall, the findings for the contrast between guided self-help and pure self-help are broadly in line with
NICE guidance. Guided self-help was clearly advantageous in depression. The contrasting pattern of
results in GAD depending on whether patients did or not return to provide a post-treatment score
means that the relative status of guided self-help and pure self-help is unclear. We would recommend
that any IAPT service that is considering using pure self-help in GAD should give patients a follow-up

P a g e | 8
appointment when they provide self-help materials. In this way, they can check whether the materials
were helpful and move patients on to other interventions in the service if they were not.
Severity and treatment received
The chronicity of the patients’ illnesses was not included in the database, thus only the effect of the
severity of patients’ illnesses on the treatment received and their treatment outcome was investigated.
The patients’ initial scores on the PHQ-9 and GAD-7 were important predictors of their recovery. The
higher patients’ scores on the PHQ-9 and the GAD-7, the less likely they were to recover. Severity was
associated with the number of sessions a patient received and the number of sessions received by the
patient had a positive effect on patients’ treatment outcomes. This analysis was conducted using the
patients’ initial scores on the PHQ-9 and GAD-7 as covariates. It was also found that patients who were
less severe tended to receive low intensity treatment and those who had higher scores were more likely
to have high intensity therapy or were stepped up. Patients who started treatment with higher scores
on the PHQ-9 and GAD-7 had more sessions than patients with lower scores at assessment.
Mix of experienced staff and trainees
Sites that had a higher proportion of clinical staff graded at Agenda for Change (AfC) band 7 or above
had higher recovery rates. This finding is NOT thought to reflect the relative merits of low intensity and
high intensity interventions as the overall recovery rates associated with the two types of intervention
were similar. Instead the finding may partly reflect variations in the high intensity treatments offered by
therapists at different grades, but seems more likely to reflect the fact that some year one IAPT services
had very few already trained staff who delivered therapy (as opposed to supervision) in the service or
provided the trainees with the opportunity to learn from observation while sitting in on their sessions.
To rectify the latter problem, guidance requiring all services to have at least one full-time equivalent
trained CBT therapist for every two trainees in the service was issued at the start of year two.
Identifying factors associated with a lack of diagnosis
A large proportion of patients (39%) were not assigned an ICD-10 code. As NICE guidelines are diagnosis
specific, this could have implications for the treatment patients receive and service evaluation. The IAPT
data handbook (IAPT National Programme Team, 2010) released in August 2010 aims to help services
achieve higher completeness rates for provisional diagnosis by explaining their importance and
providing a series of screening questions that can be used by IAPT workers. However, the IAPT year one
dataset gives an excellent opportunity to investigate factors associated with obtaining, or not obtaining,
an ICD-10 code. It was found that therapist characteristics had an effect on whether patients received an
ICD-10 code. In particular, the AfC banding of the therapists was found to have an effect on whether
patients received ICD-10 codes. The higher therapists were banded, the less likely it was that their
patients would receive an ICD-10 code. Additionally, amongst high intensity patients, those who
received interpersonal therapy and couples therapy were less likely to receive an ICD-10 code. This is
concerning as interpersonal therapy and couples therapy are only recommended by NICE for patients
with depression (NICE, 2009).
Patients who did not have an ICD-10 code received fewer sessions. Younger patients were less likely to
receive an ICD-10 code. No effect of ethnicity was found. Patients who received CBT were more likely to

P a g e | 9
receive an ICD-10 code than those who received counselling. Self-referred patients were no more likely
to lack an ICD-10 code than patients referred from other sources. Patients not assigned an ICD-10 code
were not significantly different from patients assigned an ICD-10 code in terms of their initial PHQ and
GAD scores. However, patients with an ICD-10 code were likely to have higher WSAS scores.
Reliable deterioration and reliable improvement
Most of the analysis in the report focussed on patients’ recovery. However, patients may also become
worse while undergoing treatment. It is important to establish the percentage of patients who show an
increase in anxiety and/or depression that is greater than the measurement error of the scales. This can
be done using the Reliable Change Index (RCI) (Jacobson & Truax, 1991). The proportion of patients that
showed reliable deterioration in the first year of IAPT was 6.6% of patients treated. As the dataset did
not contain information from patients in a control group, the proportion of patients showing reliable
deterioration cannot be compared to that found in other services or among patients who have not
received any treatment. However, it seems likely that the rate would be substantially higher in a no
treatment group.
The RCI was also used to calculate the percentage of patients that reliably improved during their
treatment. Amongst patients with a depression diagnosis, 55.7% showed reliable improvement.
Amongst patients diagnosed with GAD, 65.9% showed reliable improvement. For the whole sample
(irrespective of diagnosis), 63.8% of patients showed reliable improvement. Thus, the majority of
patients treated at IAPT sites in the first year showed a reliable reduction in their symptomatology.

P a g e | 10
Conclusions
The North East Public Health Observatory report mainly focused on equality of access and overall
outcome in the year one IAPT services. Although the overall recovery rates achieved by the year one
services approached the national target of 50% of those people who were considered suitable and
received treatment, considerable between site variability was observed. The further analyses reported
here aimed to identify factors associated with this variability.
Broadly speaking, the findings confirm the validity of the IAPT service model outlined in the IAPT
Commissioning Toolkit (2008) and elsewhere. In particular, low intensity and high intensity therapy are
both crucial components of the model with services achieving best outcomes if they operated a
functional stepped care system in which patients, on average, are given a reasonable number of
sessions of therapy at either level and are consistently stepped up from low intensity to high intensity if
they fail to recover with the former. As expected the probability of receiving high intensity therapy
increased with symptom severity. At both therapy levels, delivering interventions that are
recommended by NICE was associated with enhanced outcomes. The IAPT model requires services to
have a core cohort of more experienced staff, as well as trainees. The finding that outcomes were better
in services with a larger proportion of staff at AfC band 7 and above probably reflects this.
A novel aspect of the analysis was calculation of reliable deterioration rates. The rate of reliable
deterioration was low (6.6% of the whole sample) and probably substantially less than one would expect
in an untreated sample. However, as with all measures, there was between site variability and it would
seem wise to include calculation of reliable deterioration rates in routine audits of IAPT services.
NICE guidance is diagnosis based. Determination of the extent to which patients received NICE
recommended treatments was hampered by the fact that over a third of the patients in the services had
not received an ICD-10 provisional diagnosis. Looking to the future, it is essential that services obtain
provisional diagnoses for all patients. The recently issued IAPT Data Handbook (Department of Health,
2011) contains a simple framework to aid the identification of provisional diagnoses, as well as
recommendations for the use of anxiety disorder specific measures in order to provide a sensitive,
disorder appropriate index of recovery.
P a g e | 11
2. Introduction
In July 2010, the North East Public Health Observatory (NEPHO) published a report detailing analysis on
the data taken from the first year of the Improving Access to Psychological Therapies (IAPT) programme
(NEPHO, 2010). The NEPHO report highlighted the achievements of the first year of the IAPT
programme. Amongst these achievements was the collection of an extensive and large outcome
dataset, an achievement which previously had proven to be elusive. This allowed an extensive review of
IAPT’s operationalization in the first year of its inception. The NEPHO report particularly focused on
equity of access, descriptions of the treatments offered, gradings of staff and overall (clinical and
employment) outcome.
With respect to equity of access, the NEPHO (2010) report found that in the first year of the initiative
IAPT met its aims regarding equity of access across genders. The dataset showed that 66% of patients
were female and 34% were male. The most recent Adult Psychiatric Morbidity Survey (McManus et al.,
2009) shows that 61% of people with a common mental disorder are female, thus the proportion
treated in IAPT services does not differ too greatly from the proportion seen in the community.
However, the first year data set did suggest that older patients and people from the BME community
were being underrepresented. The most recent Equality Impact Assessment, states that the exact
magnitude of underrepresentation is not known due to disproportionate levels of patients with a ‘not
stated’ ethnicity in comparison to patients that did disclose ethnic origin (IAPT, 2010). The NEPHO report
also found that sites were not accepting as many self-referrals as the demonstration sites suggested
they should. This may partly explain the under-representation of BME groups. Clark et al. (2009) found
that self-referral produces a more equitable pattern of access for different ethnic groups.
Looking at clinical conditions, the NEPHO report also found that there was an overrepresentation of
patients with Depression or Mixed Anxiety and Depressive Disorder (MADD), compared to prevalence
rates found in epidemiological studies. There was also under representation of patients with persistent
anxiety disorders, such as Post Traumatic Stress Disorder (PSTD), Obsessive Compulsive Disorder (OCD),
Panic Disorder, Social Phobia and Agoraphobia, as only 8.5% of patients with these diagnoses accounted
for the total number of patients treated in IAPT sites, whereas around a third of patients should have
these disorders if access were equitable (see McManus et al., 2009). The report also found that although
the majority of patients received NICE compliant treatment, a significant minority received treatments
that deviated from NICE guidance. Furthermore, a large proportion of patients (39%) did not receive a
provisional diagnosis. The identification of these problems allowed them to be addressed with the
release of the IAPT Data Handbook (Department of Health, 2010) in August 2010.
The report also uncovered a considerable amount of between site variability in how services were
organized and how they performed. This suggested that important lessons for the possible future
development of IAPT services might be learned by further investigation of the relationship between the
way services were operationalized and the outcomes they achieved. The dataset for this investigation
was taken from 32 of the 35 wave one sites. All 32 sites were given the opportunity to opt out of the
analysis, but none did so.

P a g e | 12
Understanding How Site and Patient Variance Affects Patient Outcome
This section seeks to understand the variance in the operationalization of the first year of IAPT. Variation
occurred both between patients and the sites at which they were treated. In order to identify the factors
that predict patient recovery, a logistic regression model was created. This model investigated both site
level variation and patient level variation to understand the factors which increased or decreased the
likelihood of patients’ recovery. The results from these analyses will be discussed in the next section. In
this section the extent of the variance will be discussed.
Population used in analyses
To be included in the investigation into site variation patients were required to have an assessment,
some treatment and have been a case at assessment. To be considered cases at the start of treatment
patients were required to score above 9 on the PHQ-9 or above 7 on the GAD-7 at assessment. They
were also required to have an end of treatment marker, which indicated that patients had terminated
their treatment at the service and were no longer in the system. Figure 2.1 shows the inclusion criteria
used in these investigations.
For the samples used in the analyses in this report the present, data completeness rates on the PHQ-9
and GAD-7 were good. Among the patients whose involvement with the service had finished, who were
cases at pre-treatment and there was evidence that they had attended at least two sessions (including
assessment) pre-treatment and end of treatment or last available session PHQ-9/GAD-7 scores were
available on 91.4% (20,009 of 21,882) of individuals.

P a g e | 13
Figure 2.1. Flowchart showing population used
137,285 Referred to IAPT Services
57,974 patients did not have assessment
79,310 Had an assessment
37,586 patients listed as still being in the system or did
not have treatment end marker
41,724 Listed as no longer in IAPT services
1,905 patients listed as not having received treatment
39,819 Listed as receiving some treatment
7,437 patients were not a case at assessment
32,382 Were cases at assessment
10,500 patients had no evidence of having more than one contact with an IAPT site. Many were probably signposted elsewhere.
21,882 Had evidence of having more than one contact
with an IAPT service
1,873 patients did not have two complete sets of outcome data for the PHQ-9 and GAD-7
20,009 Had two complete sets of outcome data for the
PHQ-9 and GAD-7
614 patients were listed as unsuitable or declined and had no more than 2 sessions
1
19,395 Cohort Used in Analyses
1 The NEPHO report included patients who were coded as “unsuitable” or “declined” treatment in the calculation of recovery rates. We took the view that if patients had been coded as being ‘unsuitable’ or as having ‘declined treatment’ after one session with the service there was no good evidence that they had received treatment and they therefore should be excluded in this analysis. On the other hand, patients who had two or more sessions recorded could have been coded as unsuitable because they didn’t seem to be responding to the treatment they were given. It could be argued that a conservative analysis of treatment response should include these people so the analyses undertaken did not include patients who received less than 2 sessions and were listed as being unsuitable or having declined treatment.

P a g e | 14
Patients were also required to have had more than one session at an IAPT site. However, there was
some difficulty in determining whether or not patients had had more than one session, due to problems
regarding the recording of session data. A large number of patients were recorded as having fewer than
two sessions, but still had two different sets of PHQ-9 and GAD-7 scores. This would not be possible if
the variable detailing the number of sessions is accurate. It seems likely that the database
underestimates the number of treatment sessions that patients received in the services. The reasons for
this will be discussed later. Having two sets of PHQ-9 and GAD-7 scores was used as the inclusion criteria
in order to avoid excluding patients who may have been falsely labelled as having fewer than two
sessions. Unless otherwise stated, the patients described in Figure 2.1 were the population used in the
analyses.
Factors investigated
This initial analysis investigated how patients’ likelihood of recovery was affected by the characteristics
of the site at which they were treated, the characteristics of their individual treatment and the
characteristics of their illness that affect patient outcomes in general. The factors below were included
in a multivariate logistic regression model to determine whether they play an important role in patient
outcome.
Patient level factors
Initial PHQ-9 scores
Initial GAD-7 scores
Common Primary Diagnoses †2
Whether or not patients were self-referred
Whether the patient received the low intensity therapy †
Whether the patient received the high intensity therapy †
Whether the patient received both low and high intensity therapy †
Whether the patient received any ‘other treatment’ †
Site level factors
Site Banding Distribution
Site Self-Referral
The median number of low intensity sessions given by the site
The median number of high intensity sessions given by the site
The median number of other intensity sessions given by the site
The median number of treatment sessions given to stepped up patients by the site
The number of patients treated per day at the site
Proportion of patients who received low intensity treatment who also received high intensity treatment (Step Up Rate)
2 Variables marked ‘†’ are categorical and can only take a small number of values. In all cases apart from the common primary
diagnoses variables, these categorical variables are dichotomous. The common primary diagnoses variable represents 9 separate dummy variables.

P a g e | 15
Factors not investigated
The type of therapy (i.e., CBT, counselling & interpersonal therapy) was omitted from the analysis, as it
introduces a large confound since they are not indicated for all diagnoses. If the type of therapy was
included in the analysis, variables that code all combinations of low intensity therapies would also need
to be included. However, not all combinations of low intensity therapies were received by the required
number of patients to constitute a valid sample size for the analysis. This would complicate the analysis,
making it difficult to draw concrete conclusions from the data and also weaken any conclusions that
could be drawn from the results of the analysis. Other site variables were not included in the analysis as
they were not present in the database. These included the availability of telephone work, the type of
triage system, and the staff training profile.
What does drop out mean?
The percentage of patients listed as ‘dropping out of treatment’ in a site was not included in the
analysis. As there was no nationally agreed definition of what dropping out of treatment meant, it is not
a useful definition to include in the analysis, nor was it valid to exclude patients from the analyses on the
basis that they had been labelled as having dropped out. There may also have been confusion over
when the label ‘drop out’ or ‘declined treatment’ was appropriate for patients who declined further
treatment after having several sessions. Patients who were listed as having dropped out were likely to
receive fewer sessions at IAPT sites than patients who were not listed as having dropped out [Mann-
Whitney U=23690000, p<.001, r=.211]. Furthermore, patients who dropped out were also more likely to
have higher PHQ-9 [Mann-Whitney U=29670000, p<.001, r=.078] and GAD-7 [Mann-Whitney
U=30170000, p<.001, r=.067] scores at initial assessment.
On average, patients treated at sites where a greater proportion were listed as having dropped out did
not receive any more or fewer sessions than patients treated at other sites, as sites listed as having high
dropout rates did not give fewer sessions to patients (r=.281, p=.147).

P a g e | 16
Site Variation
The NEPHO report indicated that there was great variation in recovery rates across sites. The median
value was 42% but recovery rates at specific sites ranged from 27% to 58%. There was also great
variation in how the site treated their patients. This included the median number of sessions offered to
patients treated at the site, the number of self-referrals the site accepted and the proportion of patients
who were stepped up at a site. There was also great variation in the relative proportions of Agenda for
Change band therapists at each site and the number of patients seen at a site per day3. Figures 2.2 to 2.7
show the variation in these characteristics across sites.
Figure 2.2. Recovery Rates across sites (median = 42%)
3 In order to investigate how large a site was, an index was created to show how many patients were treated at the site.
However, as not all sites started operating at the same time, the length of time a site was operating for needed to be controlled for. Thus, the index used in this report is the number of patients seen at a site, divided by the number of days the site had been operating. This index does not represent the average number of patients who received a clinical session each working day.
0% 10% 20% 30% 40% 50% 60% 70%
3
5
7
9
11
13
15
17
19
21
23
25
27
29
31
36
Recovery Rate
Site
ID

P a g e | 17
Figure 2.3. The median number of sessions4
4 The median number of sessions given to low intensity patients, across all sites = 4. The median number of sessions given to
high intensity patients across all sites = 5, and median number of sessions given to stepped up patients across all sites = 6.
0 2 4 6 8 10 12
3
4
5
6
7
8
9
10
11
12
13
14
15
16
17
19
20
21
22
23
24
25
26
27
31
33
36
Median Number of Sessions
Site
ID
Patients were Stepped Up Patients Received High Intensity Treatment
Patients Received Low Intensity Treatment Only

P a g e | 18
Figure 2.4. The variation in banding distribution across sites5
5 Median proportion of treatment sessions undertaken by therapists banded at AfC band 6 or above = 51.5% and median
proportion of treatment sessions undertaken by therapists banded at AfC band 7 or above =9.6%
0% 10% 20% 30% 40% 50% 60% 70% 80% 90% 100%
3
4
5
6
7
8
9
10
11
12
13
14
15
16
17
18
19
20
21
22
23
24
25
26
27
30
31
33
36
Site
ID
AfC1 AfC2 AfC3 AfC4 AfC5 AfC6 AfC7 AfC8a AfC8b AfC8c AfC8d Banding of Therapists Unknown

P a g e | 19
Figure 2.5. The percentage of self-referrals accepted at sites (7.3% of all referrals)6.
Figure 2.6. Step up rates across sites (median = 28%)
6 This graph depicts an outlier site, which was not included in the logistic regression analysis, as too few patients were treated
at the site to allow for its inclusion in any analyses in which sites were compared.
0% 10% 20% 30% 40% 50% 60% 70% 80% 90% 100%
3
5
7
9
11
13
15
17
19
21
23
25
27
29
31
36
Percentage of Self Referrals
Site
ID
0% 10% 20% 30% 40% 50% 60% 70% 80% 90%
3
5
7
9
11
13
15
17
19
21
23
25
27
30
33
Step Up Rate
Site
ID

P a g e | 20
Figure 2.7. The number of patients treated at the sites (total number of patients who had finished their treatment at a site divided by the number of days that the site had been operating: median = 1.6)
Limitation of site level variables
It is important to note that the site variables were derived from patient level variables. This method has
an advantage as it creates a composite picture of the site over the course of a year. However, it is also a
disadvantage as the analyses treat operationally dynamic variables as static across the period of a year.
Sites may have changed their policies over the course of the year. However, the site level variables used
in these analyses represent an ‘average’ of these sites’ operations. Whether or not these composite
averages reflected the true nature of the site at a given time is subject to some debate. For example, if a
site tended to give a large number of sessions to patients at the start of the year and then altered its
policy and gave patients fewer sessions at the end of the year, the value used in the regression would
show that the site gave an average number of sessions somewhere in between the average number of
sessions it gave during the two six month periods.
However, this criticism is not enough to negate the value of these analyses. If a site altered the way it
operated during the first year of IAPT, then it is not an unreasonable assumption that the sites’ recovery
rates were simultaneously affected. Thus, it was still possible to investigate the factors that influenced
recovery and the analyses conducted in this report still offer valuable information regarding the factors
that may influence patients’ recovery in the future. A longitudinal data collection from sites over the
course of the year would remedy this problem. Furthermore by having site level variables reported the
sites at certain time points, the effects of site variability could be ascertained with less error.
0 0.5 1 1.5 2 2.5 3 3.5 4 4.5 5
3
5
7
9
11
13
15
17
19
21
23
25
27
29
31
36
Number of Patients Treated at Site
Site
ID

P a g e | 21
Selecting the banding cut off
Figure 2.4 shows that there was great variability in the terms of banding of therapists at sites. These
proportions were computed by calculating the total number of sessions received by patients, and what
proportion of these sessions was undertaken by therapists banded at certain AfC grades. The dataset did
not show how many therapists of a certain AfC band were at a site.
Some sites had a larger proportion of sessions undertaken by therapists banded at the higher end of the
Agenda for Change (AfC) scale, whereas other sites had over half of sessions being undertaken by
therapists banded at AfC band 4 or below. The effect, if any, of therapist banding on patient recovery
can be investigated using the logistic regression model. The simplest comparison that can be undertaken
is to compare the recovery rates of sites with a larger proportion of highly banded therapists to sites
with a smaller proportion of these therapists. In order to do this, some preliminary analysis is required
to determine the most appropriate cutting point. We calculated the relationship between the overall
recovery rates for sites and the proportion of therapy sessions that were delivered by therapists at AfC
band X and above, where X ranged from 5 to 8a. The strongest relationship was observed when X was 7,
(r=.441, p=.017) so this was chosen as the AfC cutting point for the logistic regression analysis.

P a g e | 22
What is ‘other treatment’?
The database included variables that define the patients’ therapy as ‘other treatment’. Overall 692, of
the 19,395 patients shown in the Figure 2.1 were listed as having received ‘other treatment’. Whether
this label reflected a heterogeneous collection of treatments or a single type of treatment is not known
and cannot be assumed. By cross tabulating the treatment markers, the nature of ‘other treatment’ was
investigated. This method showed that this treatment was not defined as any high intensity treatment,
low intensity treatment, CBT, counselling, couples therapy or interpersonal therapy. Nor was it marked
as pure self-help, guided self-help, behavioural activation, structured exercise or psycho-educational
group therapy. Very little can be found which details what ‘other treatment’ was rather than what it was
not, thus a variable showing whether or not patients received it was entered into the regression. This
variable shall be referred to in inverted commas in this report to avoid confusion. The proportion of
patients in the regression listed as having received ‘other treatment’ was 2.6%.
Problems with session data
The Year One dataset does not include a simple measure of all clinical contacts. Instead, the number of
treatment sessions that a patient received has to be inferred from counts of various recorded activities,
and, as a consequence, will be underestimated if clinicians fail to record the activities on every occasion
that they occurred. The NEPHO (2010) report considered three possible ways of calculating the number
of treatment sessions and decided that a count based on the recorded purpose of a session where the
purpose included treatment (assessment, treatment, review, follow-up and reasonable combinations of
these) was the least problematic. We have followed this practice. However, it is important to note that
the NEPHO (2010) report made it clear that there is a great deal of missing data on this variable and the
amount of data that is missing varies considerably from site to site. This means that the absolute values
for the median number of treatment sessions that a site provided are almost certain to be
underestimates. The variability in missing data rates also raises the possibility that the degree of
underestimation may vary between sites.
An association was found between the information systems used at sites and the number of sessions
patients treated at those sites were reported to have received [X²(5) =563.44, p<.001]. This can be seen
in Table 2.1. One software package, PC-MIS, would only log a record of a patient receiving a therapy
session if the complete dataset was entered. If incomplete data was logged, patients’ records would
indicate that they have not had a session of therapy. A problem was also found in the local information
systems, one of which did not log any session data, resulting in the median number of sessions for this
information system being zero. This site was excluded from these analyses. These two examples
illustrate some of the problems found in the database, and that some caveats need to be considered
before drawing conclusions from the results of this analysis.

P a g e | 23
Table 2.1. The number of sessions received by patients by the information system used at a site
Information System
Median Number of Sessions
Mean Number of Sessions
Standard Deviation
No of patients treated at services using system
PC-MIS 4 4.81 3.443 14132
IAPTUS 5 5.53 3.781 2692
SystemOne 4 5.08 4.361 306
Cornet 6 7.17 4.516 98
Manual 3 3.90 3.449 2032
Local PAS 0 4.82 4.55 135
It is important to note that the median number of sessions is likely to be an underestimate, since it is
likely that not all sessions were logged. If sessions were not logged in the dataset, the median number of
sessions will be lowered. Unfortunately, it is not possible to gauge the extent of this underestimation.
Despite these problems, the dataset shows that in some sites half the stepped up patients received 9 or
more sessions.

P a g e | 24
Patient Level Variables
In order to understand how to improve the treatment received by patients, it is necessary to understand
whether the choice of treatment patients received was influenced by their severity at assessment.
Severity in the analysis has been defined as the magnitude of a patient’s score at assessment on the
PHQ-9 and the GAD-7.
What impact does severity have on the treatment type and number of sessions a patient receives?
The NEPHO report (NEPHO, 2010) highlighted that patients’ GAD-7 scores deviated greatly from a
symmetric distribution. This is evident in Figure 2.8. The distribution of patients’ PHQ-9 scores, which
can be seen in Figure 2.9, did not deviate as greatly from a symmetric distribution, although the
distribution did show clipping at the maximum and minimum ends of the scale. Whilst continuous,
normally distributed variables should not have minima and maxima, or be limited to integers, the
variables can be assumed to be continuous. Thus, parametric tests which rely on normality cannot be
used and Mann-Whitney U tests or Kruskal-Wallis tests have to be used instead. These have been
undertaken to investigate the association between initial scores on the PHQ-9 and GAD-7 and the
treatment the patients received and the number of sessions they received. These tested the differences
in initial scores between groups defined by the number of treatment sessions they received and the
treatment types they received. The treatment types included in the analysis are: high intensity therapy
only, low intensity therapy only and both low intensity and high intensity treatment. These were chosen
as the other therapy groups had much smaller sample sizes.
Figure 2.8. Histogram showing patients’ initial GAD-7 scores
0
200
400
600
800
1000
1200
1400
1600
0 1 2 3 4 5 6 7 8 9 10 11 12 13 14 15 16 17 18 19 20 21
Fre
qu
en
cy

P a g e | 25
Figure 2.9. Histogram showing patients’ initial PHQ-9 scores
The effect of PHQ-9 scores
A Kruskal-Wallis test shows that the severity of pre-treatment PHQ-9 scores has an effect on the
treatment type patients received [X²(2) =87.97, p<.001], and on the number of sessions the patient
received [X²(8) =50.61, p=.001]. Figure 2.10 shows the effect of patients’ initial scores on the type of
treatment they received and Figure 2.11 shows the effects of effect of patients’ initial scores on the
number of sessions they received.
Figure 2.10. The association between treatment type and the initial PHQ-9 scores, with standard error as
error bars
0
200
400
600
800
1000
1200
1400
0 1 2 3 4 5 6 7 8 9 10 11 12 13 14 15 16 17 18 19 20 21 22 23 24 25 26 27
Fre
qu
en
cy
14.0
14.5
15.0
15.5
16.0
16.5
17.0
Low Intensity High Intensity Stepped Up Patient
Me
an In
itia
l PH
Q-9
Sco
re

P a g e | 26
Figure 2.11. The effect of the initial PHQ-9 scores on the number of sessions the patients received, with
standard error as error bars
The effect of GAD-7 scores
A Kruskal-Wallis test shows that the severity of pre-treatment GAD-7 scores had an effect on the type of
treatment received [X²(2) =65.75, p<.001], and on the number of sessions the patient received [X²(8)
=22.69, p=.004]. These effects can be seen clearly in Figures 2.12 and 2.13, respectively.
Figure 2.12. The effect of the initial GAD-7 scores on the treatment type, with standard error as error
bars
14.0
14.5
15.0
15.5
16.0
16.5
17.0
2-4 Sessions 5-7 Sessions 8-10 Sessions 11+ Sessions
Me
an In
itia
l PH
Q-9
Sco
re
13.0
13.2
13.4
13.6
13.8
14.0
14.2
14.4
14.6
14.8
15.0
Low Intensity High Intensity Stepped Up Patient
Me
an In
itia
l GA
D-7
Sco
re

P a g e | 27
Figure 2.13. The effect of the initial GAD-7 scores on the number of sessions the patients received, with
standard error as error bars
Diagnosis
The NEPHO report (NEPHO, 2010) highlighted that a large number of patients did not receive an ICD-10
code. The factors associated with a lack of diagnosis are explored in Section 6. The report also showed
that patients’ likelihood of recovery differs depending on their diagnosis. This can be seen in Table 2.2,
which shows the observed recovery rates by diagnosis.
Table 2.2. Recovery Rates by Diagnosis
Diagnosis Recovery Rate
Depressive Episode 40.4% MADD 38.9% GAD 51.9% Recurrent Depression 35.5% All Phobias 48.6% OCD 43.0% PTSD 45.2% Family Loss 39.0% Other 41.0%
The diagnoses shown in Table 2.2 were not the only disorders treated at IAPT services in the first year.
Other diagnoses included: mental and behavioural problems due to alcohol, bipolar disorder,
somatoform disorder, eating disorders and other disorders that were not coded in the dataset. No
statistical analysis was undertaken using patients diagnosed with these disorders as too few patients
treated at IAPT sites were diagnosed with these disorders. Any analysis undertaken using such small
samples would not be reliable and any conclusions based on such analyses would not be credible.
13.0
13.2
13.4
13.6
13.8
14.0
14.2
14.4
14.6
14.8
15.0
2-4 Sessions 5-7 Sessions 8-10 Sessions 11+ Sessions
Me
an In
itia
l GA
D-7

P a g e | 28
There is a growing recognition (see the recently issued IAPT Data Handbook) that a combination of the
PHQ-9 and the GAD-7 is not always the best index of recovery. In particular, for specific anxiety
disorders such as PTSD, Social Phobia and OCD measures that specifically focus on the core
symptomatology, such the IES (Horowitz, Wilner & Alvarez, 1979), SPIN (Connor et al., 2000) and OCI
(Foa, Kozak, Salkovskis, Coles & Amir, 1998) respectively, are more appropriate than the GAD-7.
However, these measures were not included in the year one data download.
Initial Scores by Diagnosis
Patients’ initial scores also varied significantly by diagnosis. This was the case for both the PHQ-9 [X²(8)
=810.98, p<.001] and the GAD-7 [X²(8) =114.33, p<.001]. This could have an effect on recovery. Figures
2.14 and 2.15 show how patients’ PHQ-9 and GAD-7 scores varied by diagnosis.
Figure 2.14. Patients’ initial PHQ-9 scores, based on diagnosis codes with standard error of the mean in
error bars
2
4
6
8
10
12
14
16
18
20
DepressiveEpisode
MADD GAD RecurrentDepression
All Phobias OCD PTSD Family Loss Other
Me
an In
itia
l PH
Q-9
sco
res

P a g e | 29
Figure 2.15. Patients’ initial GAD-7 scores, based on diagnosis codes with standard error in error bars
Misdiagnosis
There was evidence that some patients were misdiagnosed. This is best exemplified by considering
patients diagnosed with Mixed Anxiety and Depressive Disorder (MADD). A large number of patients
received a diagnosis of MADD. ICD-10 states that this diagnosis should NOT be given to anyone who
meets diagnostic criteria for depression or for any of the anxiety disorders. Instead the diagnosis should
be reserved for individuals who report significant but sub-syndromal symptoms of anxiety and
depression. However, inspection of Figures 2.14 and 2.15 reveals that patients with MADD had PHQ-9
scores as high as those diagnosed with a depressive episode and GAD-7 scores as high as those with a
diagnosis of depression and GAD. This suggests that in a substantial number of instances the diagnosis
of MADD was probably given because patients met diagnostic criteria for depression and an anxiety
disorder, not because they failed to meet criteria for either.
2
4
6
8
10
12
14
16
18
DepressiveEpisode
MADD GAD RecurrentDepression
All Phobias OCD PTSD Family Loss Other
Me
an In
itia
l GA
D-7
sco
res

P a g e | 30
Summary
This section has discussed the variance seen in the first year IAPT dataset. The variance was seen both
across patients and across sites. Site factors shown to vary were: the median number of sessions given
to patients by sites, the banding of therapists at a site, the number of patients stepped up at a site, the
number of self referrals a site accepted and the number of patients treated at a site. Patient factors
shown to vary were: initial scores on the PHQ-9 and GAD-7, diagnosis, whether patients were assigned a
diagnosis and the type of treatment they received.
The analysis of the patient level variables found that patients treated in the first year of IAPT received
treatment which was associated with their initial severity. Patients whose PHQ-9 and GAD-7 scores
indicated that they were more severe were more likely to receive high intensity treatment and receive
more sessions of treatment than patients who started treatment with lower scores on these measures.
Multiple issues were also uncovered when the site and patient level variables were investigated. Site
variables in general have to be derived entirely from patient level variables over the course of the year.
They therefore represent a composite impression of a site across the whole year. Since it is possible that
sites changed the way they operated during this year, the composite variables used in these anlayses
may not represent a site’s operation at a certain point in time. However, this criticism is not enough to
negate the value of these analyses. If a site alters the way in which it operates one would also expect
this to have an effect on the likelihood of patients’ recovery at the site, which would be reflected in the
composite recovery variable. The analyses conducted in this report offer valuable information regarding
the factors which influence patients’ recovery in the future.
The lack of data regarding sessions was another problem uncovered in this investigation. It is important
to note that the data regarding the number of sessions a patient received is likely to be an
underestimate. Thus, when choosing the sample to be used in the logistic regression, patients needed to
show that they had attended an IAPT service twice by having more than one session logged, or having
two sets of PHQ-9 or GAD-7 scores. Furthermore, the dataset showed that many patients were not
receiving ICD-10 diagnoses and that some patients were being misdiagnosed. The IAPT data handbook
(IAPT National Programmme Team, 2010) was published to redress these issues.
The main aim of this report is to understand how both patient and site factors can influence the
likelihood of patients’ recovery. Logistic regression analyses were used to understand which of these
factors predict patient recovery. The results from these analsyes are presented in the next section.

P a g e | 31
3. Which Factors Predict Recovery?
The previous section detailed the variance found in the first year of IAPT, both in terms of the patients in
services and how sites chose to treat them. This section seeks to identify which factors were important
in predicting recovery. Logistic regression techniques allow these factors to be considered at the same
time, rather than simply investigating each factor individually so a more complex model could be built.
The MTR1 recovery index used and described in the NEPHO report was also used in the analyses
presented in this report. This requires patients to score below 10 on the PHQ-9 and below 8 on the GAD-
7 at the end of treatment for patients to be considered as having recovered. This was chosen as this
recovery index only used validated measures, the PHQ-9 and the GAD-7, as opposed to the other
recovery index described in the NEPHO report (MTR2), which also required patients to be below
threshold on the three phobia measures included in the minimum dataset. The NEPHO report identified
that the phobia measures were not adequately selective when patients’ scores were compared against
patients’ diagnoses, which could affect the validity of the MTR2 recovery index. Furthermore, a number
of patients did not have enough phobia scores to compute the MTR2 recovery index so the sample size
of any analyses using the MTR2 recovery index would be smaller than those conducted using the MTR1
recovery index7.
Each model required patients to have sufficient data to be included in the model. Patients were required
to have an assessment. To be considered cases at the start of treatment patients were required to score
above 9 on the PHQ-9 or above 7 on the GAD-7 at assessment. They were also required to have an end
of treatment marker and to have been treated at a site that had sufficient site characteristic data to be
included in the analyses. The requirement for site data was due to the fact that some sites did not code
particular variables so it was not possible to assess and code some important aspects of their operation.
Patients were also required to have had more than one session (including assessment) at an IAPT site.
This is because a) it was thought unlikely that patients who had only one session would have received a
significant amount of treatment as the first session was almost always devoted to assessment and b)
separate pre and post-treatment PHQ-9 and GAD-7 scores could not be collected if there was only one
session. However, there was some difficulty in determining whether or not patients had more than one
session due to problems regarding the recording of session data.
A number of patients were recorded as having fewer than two sessions, but still had two different sets
of PHQ-9 and GAD-7 scores. This would not be possible if the variable detailing the number of sessions is
accurate. It is possible that the variable detailing the number of sessions may be an underestimate, as
therapists failed to log each meeting they had with a patient. This may be due to the aforementioned
problems with data entry systems, or due to the fact that clinicians did not log the number of sessions
correctly. Unfortunately, it was not possible to gauge the exact magnitude of this underestimate. In
order to avoid excluding patients who may had have more than one session, but were falsely labelled as
having fewer than 2 sessions, whether patients had two sets of PHQ-9 and GAD-7 scores was used as
inclusion criteria rather than the number of sessions patients received. Figure 3.1 details who was
included in the model. This flowchart does not differ greatly from Figure 2.1, apart from the added
requirement that patients have all the sufficient site level information to be included.
7 Analyses were conducted using the MTR2 recovery index, and very similar results were found, however, the models computed
did not explain as much variance and did not fit the data as well.

P a g e | 32
Figure 3.1. Flow chart detailing the sample sizes used in the model
137,285 Referred to IAPT Services
57,974 patients did not have assessment
79,310 Had an assessment
37,586 patients listed as still being in the system or did not have treatment end marker
41,724 Listed as no longer in IAPT services
1,905 patients listed as not having received treatment
39,819 Listed as receiving some treatment
7,437 patients were not a case at assessment
32,382 Were cases at assessment
1,166 patients did not have sufficient site data
31,216 Had sufficient site data to be included in the analysis
10,236 patients had no evidence of having more than one contact with an IAPT site
20,980 Had evidence of contacting an IAPT site least twice
1,850 patients did not have two sets of PHQ-9 and GAD-7 scores
19,130 Had two complete sets of outcome data for the PHQ-9 and GAD-7
587 patients were listed as unsuitable or declined and had no more than 2 sessions
18,543 If listed as being unsuitable or having declined treatment had 2 or
more sessions of treatment8
7,142 patients did not have an ICD-10 code
11,535 Cohort for the Regression Model
8 We held the view that if a patient had been coded as being ‘unsuitable’ or having ‘declined’ treatment after one session with
the service there was no good evidence that they had received treatment and therefore should be excluded in this analysis. On the other hand patients who had two or more sessions recorded could have been coded as unsuitable because they didn’t seem to be responding to the treatment they were given. It could be argued that a conservative analysis of treatment response should include these people, thus the analyses undertaken did not include patients who received less than 2 sessions and were listed as being unsuitable or having declined treatment.

P a g e | 33
Since 39.2% of patients did not have an ICD-10 code, the requirement for patients to have been assigned
a diagnosis limited the size of the sample. However, it was also felt that coding patients’ diagnoses
would create a stronger model, as patients’ diagnoses would explain some variance. This was supported
by the sensitivity analyses shown in the annex of this report. The model used a sample of patients who
were assigned an ICD-10 code. A second model was created which did not require that patients that
patients had an ICD-10 code. The findings from this second model were very similar to those shown
below and are included in the annex.
How was the Model Created?
A backwards-stepwise method was used as there were no particular hypotheses (Menard, 1995). The
likelihood ratio statistic was used in decisions involved in the stepwise removal of variables. A very
liberal criterion for selection was used (α=.2). This decision was influenced by the work of Mickey and
Greenland (1989) who found that by using a more conservative criterion for selection in regression
analyses such as α=.05, type II errors become probable. The selection process was subtractive as it was
less likely to be affected by suppressor effects where one predictor seems to have no effect if others are
kept constant (Field, 2009). Hosmer and Lemeshow’s test (Hosmer & Lemeshow, 1989) was used to
assess the goodness of fit of the models.
Regression Model Summary
For patients to have been included in the regression model they were required to have had an
assessment and have been a case at assessment. They were required have an end of treatment marker,
indicating that they were no longer in the system, have two sets of PHQ-9 and GAD-7 scores, have
sufficient site data to be included in the analysis and have an ICD-10 code. The sample size in this
regression was 11,535. The recovery rate amongst this sample was 42.4%. The model was shown to fit
the data well, as Hosmer & Lemeshow’s test was non-significant [X²(8) =8.57, p=.380].
How much variance was explained?
Nagelkerke’s R² showed that the model explained 17.6% of the variance and the model differed
significantly from a model which only included the constant [X²(16) =1622.13, p<.001]. The model
successfully identified 77.6% of patients who did not recover and 52.5% of those who did. Overall, the
model correctly identified 67.0 % of patients’ outcomes. The variables shown to have an effect on
patient recovery are shown below, in Table 3.1.

P a g e | 34
Table 3.1: Summary of regression model
B S.E. Wald Sig. Exp(B) 95% C.I.for EXP(B)
Variable Lower Upper
Proportion of Patients Stepped Up at a Site .928 .124 56.145 .000 2.529 1.984 3.224
Median Number of Sessions at a Site Received By Patients who Received Low Intensity Treatment
.168 .029 34.680 .000 1.183 1.119 1.252
Median Number of Sessions at a Site Received By Stepped Up Patients
.049 .017 8.615 .003 1.050 1.016 1.085
Median Number of Sessions at a Site Received By Patients who Received ‘other treatment’
.028 .019 2.058 .151 1.028 .990 1.068
Proportion of Therapist Sessions Undertaken by Therapists Banded at AfC band 7 or above
.765 .198 14.876 .000 2.149 1.457 3.169
Number of Patients Treated at a Site .139 .024 33.751 .000 1.149 1.096 1.204
Initial PHQ-9 Score -.091 .004 421.583 .000 .913 .906 .921
Initial GAD-7 Score -.073 .005 195.473 .000 .929 .920 .939
Patient was Stepped Up .380 .123 9.611 .002 1.463 1.150 1.860
Patient Received High Intensity Treatment .473 .122 15.096 .000 1.604 1.264 2.037
Patient Received Low Intensity Treatment .350 .119 8.624 .003 1.419 1.123 1.791
Depressive Episode Diagnosis .211 .069 9.314 .002 1.234 1.078 1.413
MADD Diagnosis .176 .069 6.552 .010 1.193 1.042 1.365
GAD Diagnosis .401 .075 28.607 .000 1.493 1.289 1.729
Phobia Diagnosis .204 .111 3.404 .065 1.227 .987 1.525
PTSD Diagnosis .420 .161 6.812 .009 1.522 1.110 2.087
Constant -.117 .200 .346 .556 .889
Model description
This model shows that patients’ initial PHQ-9 and GAD-7 scores had a significant effect on recovery. The
higher patients’ initial scores were, the less likely they were to recover. However, it is important to note
that this does not equate to the amount of change patients showed on these measures. In fact, patients
with higher scores on the PHQ-9 and GAD-7 tended to show greater change on these measures but their
change was not sufficient to place their post treatment scores below the clinical threshold. This will be
discussed later in greater detail. Diagnosis was also found to have been an important factor in patients’
likelihood of recovery, with patients diagnosed with a depressive episode, MADD, GAD, or PTSD having a
greater likelihood for recovery than if they were diagnosed with another disorder.
Banding was found to be an important factor; the greater the proportion of therapist sessions received
at the site undertaken by therapists banded at AfC band 7 or above, the more likely it was that patients
at these sites would recover in comparison to patients treated at sites where a smaller proportion of
sessions were undertaken by such workers. The number of patients treated at a site was found to be an
important predicting factor in patients’ recovery. The greater the number of patients treated at the site,
the more likely it was that patients treated at the site would recover.
For low intensity treatment, the higher the average dose (median number of sessions) that a site gave,
the more likely it was that patients treated at that site would recover. The greater the median number
of sessions that patients who were stepped up at a site received, the more likely it was that patients at
the site would recover.

P a g e | 35
If patients received low intensity, high intensity treatment or were stepped up, they were more likely to
recover than if they did not. This indicates that if patients received ‘other treatment’ they were less
likely to recover. The recovery rate for patients who received low intensity only, high intensity only or
low and high treatment was 42.7%, compared to 30.6% for patients who received ‘other treatment’.
In order to understand the effect of the variables in greater detail, each variable that was significant in
the model is investigated in greater detail below. The site level correlations are discussed in the next
section, followed by the influence of patient level statistics. As already been shown, the treatment that
patients’ received is linked to their initial scores and patients who were diagnosed with GAD had higher
recovery rates than patients who received any other ICD-10 code[X²(1) =108.28, p<.001, Φ=.096].
Site Level Correlations
The model above considered all the factors predicting recovery at the same time. This allowed the
model to remove any variables which were found to mask the effects of other variables. This allows us
to consider the site level variables alongside patient level variables, such as the treatment received by
patients, their diagnosis, and their initial PHQ-9 and GAD-7 scores. However, it can also be useful to
investigate the site characteristics individually at a site level which can help us interpret the results from
a patient level analysis.
Correlations associated with recovery
The median number of sessions offered by a site was significantly, positively correlated with recovery
rates (r=.534, p=.007). The correlation between the median number of sessions offered and site
recovery rates can be seen in Figure 3.2. The median number of sessions offered to patients who were
stepped up was also positively correlated with recovery rates (r=.452, p=.027), this can be seen in Figure
3.3.

P a g e | 36
Figure 3.2. The median number of sessions given at a site and the site recovery rates
Figure 3.3. Correlation between the median number of sessions given to stepped up patients at a site
and the site recovery rates
0%
10%
20%
30%
40%
50%
60%
70%
0 1 2 3 4 5 6 7 8
Site
Re
cove
ry R
ate
s
Median Number of Sessions
0%
10%
20%
30%
40%
50%
60%
70%
0 2 4 6 8 10 12
Site
Re
cove
ry R
ate
s
Median Number of Sessions Given to Stepped Up Patients

P a g e | 37
The proportion of therapy sessions undertaken by therapists banded at AfC band 7 or above was found
to have had a positive effect on recovery rates (r=.521, p=.009). The correlation between the proportion
of sessions undertaken by therapists banded at AfC band 7 or above and the recovery rates can be seen
in Figure 3.4.
Figure 3.4. The correlation between the proportion of therapist sessions undertaken by therapists
banded at AfC band 7 or above and recovery rates
Associations with the number of sessions
The recorded median number of sessions given to patients by a site was found to have been an
important factor in recovery, shown in both the site level correlations and the logistic regression model.
Patients who received low intensity treatment tended to receive fewer sessions than patients who
received high intensity treatment [Mann-Whitney U = 5785514.5, p<.001, r=.194] or stepped up patients
[Mann-Whitney U = 6699421.5, p<.001, r=.113]. It is important to note that the median number of
sessions is likely to be an underestimate, since it is likely that not all sessions were logged. If sessions
were not logged in the dataset, the median number of sessions in the dataset will lower than the actual
number of sessions received by patients in wave one IAPT sites. Unfortunately, it is not possible to
gauge the exact magnitude of this underestimate. There were also the aforementioned complications
with the data input systems, which would lower the number of median sessions shown in the data.
Despite these problems, the dataset shows that in some sites half the stepped up patients received 9 or
more sessions.
0%
10%
20%
30%
40%
50%
60%
70%
0% 10% 20% 30% 40% 50% 60% 70% 80% 90%
Site
Re
cove
ry R
ate
s
Proportion of Therapist Sessions Undertaken by Therapists Banded at AfC band 7 or above

P a g e | 38
The number of sessions given to all patients on average was positively correlated with the median
number of sessions given to patients who received high intensity treatment (r=.754, p<.001), low
intensity patients (r=.741, p<.001) and stepped up patients (r=.597, p=.002). This was not true amongst
patients who received ‘other treatment’ (r=.360, p=.084). Sites which gave a greater number of sessions
of ‘other treatment’ also tended to give more sessions of high intensity treatment (r=.511, p=.011) and
more sessions to stepped up patients (r=.539, p=.007).
The number of sessions given to all patients on average was also positively correlated with the
proportion of therapist sessions at a site banded at AfC band 7 or above (r=.727, p<.001). The median
number of sessions given to patients at a site was also significantly negatively correlated with the
number of patients assessed at a site (r=-.471, p=.020), but not the number treated at a site (r=-.239,
p=.260).
Associations with self-referral and step-up rates
The greater the proportion of patients at a site that were self-referred, the greater proportion of
patients at that site who received low intensity treatment (r=.467, p=.021). Sites which assessed a
greater number of patients tended to step up a greater number of patients (r=.530, p=.008). Sites which
stepped up more patients gave a smaller proportion of patients at the site high intensity treatment
without them previously having any low intensity treatment (r=-.436, p=.033) or low intensity treatment
on its own (r=-.484, p=.017).
Type of treatment received
At sites where a greater number of patients received low intensity treatment, patients who received
high intensity treatment were given a greater number of sessions on average (r=.568, p=.004). At sites
where a greater proportion of patients received ‘other treatment’ more sessions were given to stepped
up patients (r=.421, p=.041). At sites where a greater proportion of patients received high intensity
treatment, fewer patients overall were treated (r=-.445, p=.029). Sites at which a greater number of
patients were assessed, fewer patients received low intensity treatment (r=-.498, p=.013).

P a g e | 39
The Influence of Patients’ Initial Scores on the Amount of Clinical Improvement
It was found that patients with higher PHQ-9 and GAD-7 scores at the start of treatment were less likely
to recover. However, this does not mean that patients with higher initial PHQ-9 and GAD-7 scores
showed less improvement. The regression model was used to investigate the probability of patients’
recovering. This is not the same as investigating the amount of change patients showed on the PHQ-9
and GAD-7. For severe patients to recover they were required to show a greater amount of change on
the symptom measures to reach threshold for recovery. Whether patients’ initial severity on the PHQ-9
and GAD-7 was associated with the magnitude of change they showed on these measures can be
investigated using Kruskal-Wallis tests. These compare the change in scores on these measures that
patients defined as severe, moderate or mild at the start of their treatment showed across the whole of
their treatment at an IAPT service.
A Kruskal-Wallis test comparing the change shown on the PHQ-9 by patients who were classed as
moderate, moderately severe and severe on the basis of their initial PHQ-9 scores was undertaken.
Patients’ were categorised on the basis the severity groups suggested by Kroenke, Spitzer & Williams
(2001) in the original validation study of the PHQ-9 (moderate= 10-14, moderately severe = 15-19 and
severe = 20-27). This showed that patients’ initial score on the PHQ-9 was positively associated with the
amount of change they showed on the measure [X²(2) =457.64, p<.001].
The mean change for patients initially classed as moderate on the PHQ-9 was 4.47 (SD=5.35) in
comparison to 6.39 (SD=6.47) for patients classed as moderately severe and 7.99 (SD=7.63) for patients
classed as severe. Patients’ mean change on the PHQ-9, based on their severity can be seen in Figure
3.5, below.

P a g e | 40
Figure 3.5. Mean pre and post treatment scores on the PHQ-9, by patients’ severity, in relation to the
clinical cut off shown in black
A second Kruskal-Wallis test was undertaken to compare the change shown on the GAD-7 by patients
classed as mild, moderate, and severe on the basis of their initial GAD-7 scores. Patients were
categorised into the severity groups suggested by Spitzer, Kroenke, Williams and Lowe (2006) in the
original validation study of the GAD-7 (mild= 5-9, moderately severe = 10-14 and severe = 15-21). This
showed that patients’ initial scores had an effect on the amount of change they showed on the GAD-7
[X²(2) = 1244.01, p<.001]. The mean change on the GAD-7 for patients initially classed as mild on the
measure was 2.16 (SD=4.32) in comparison to 4.44 (SD=5.15) for patients classed as moderate and 6.77
(SD=6.27) for patients classed as severe. Figure 3.6 shows patients’ change in symptomatology on the
GAD-7, in relation to the clinical threshold.
5
10
15
20
25
Pre Treatment Post Treatment
PH
Q-9
Sco
re
Moderate Moderately Severe Severe

P a g e | 41
Figure 3.6. Mean pre and post treatment scores on the GAD-7 by patients’ severity, in relation to the
clinical cut off in black
2
4
6
8
10
12
14
16
18
20
Pre Treatment Post Treatment
GA
D-7
Sco
re
Mild Moderate Severe

P a g e | 42
Hypothetical Recovery Rates if Patients Who Have Not Recovered at Low Intensity are
Stepped Up
The recovery rate of all patients who received an end of treatment marker, had two sets of PHQ-9 and
GAD-7 scores, received treatment and were cases at the start of treatment was 42.9%. Each of the
different possible intensities of treatment (low intensity, low and high intensity, high intensity only) was
associated with a similar average recovery rate (low intensity 42.8% of 8,166, low & high intensity 43.8%
of 4,570, high intensity only 42.5% of 5,625). In line with NICE guidance, there were significant
differences in the pattern of disorders and initial symptom severity between patients who received low
and high intensity treatment. For this reason, it would be wrong to draw any conclusions about the
relative efficacy of these interventions from the recovery rate data. However, the good overall outcome
for both low and high intensity therapy supports the notion that each has a valuable role to play in the
provision of an IAPT service.
The previous analyses have shown that stepping up more patients at a site will increase patients’
likelihood of recovery. There were 4,673 patients who did not meet recovery criteria at the end of low
intensity treatment but were not stepped up. It is possible that these patients could have potentially
recovered, if they had been stepped up to high intensity treatment. An estimate for this can be
calculated. If the number of non-responders to low intensity treatment is multiplied by the observed
recovery rates of stepped up patients then the number of patients who would have potentially
recovered can be calculated. This calculation suggests that 2,047 additional patients would have
recovered. If one adds these patients who could have potentially recovered had they been stepped up
to the number of patients who did recover hypothetical recovery rates can be estimated. The new
estimated hypothetical recovery rate would be 54.1%.
However, it is possible that some patients did not recover as they dropped out of the treatment. In such
cases it would not be possible to step their treatment up to high intensity treatment. Consequently,
patients’ reasons for ending treatment need to be considered. Table 3.2 shows the reasons why patients
ended treatment. The table shows that recovered and non-recovered patients differed in their reasons
for ending treatment. A Χ² test shows that there was a significant difference in reasons for ending
treatment between recovered patients and patients who did not recover [Χ² (5) =2342.77, p<.001,
Φ=.356].
Table 3.2. The differences in reasons for ending treatment among recovered patients and patients who
did not recover
Reason for ending treatment Recovered Did Not Recover
Completed 77.5% 41.6%
Deceased 0.0% 0.1%
Declined 1.7% 4.0%
Dropped Out 14.0% 36.6%
Not Suitable 1.6% 11.1%
Unknown Label 5.1% 6.6%
TOTAL 100% 100%

P a g e | 43
One important difference was that a larger number of recovered patients completed treatment in
comparison to patients who did not recover. If only patients who completed treatment could be
stepped up into high intensity treatment, then a more conservative estimate must be made. If the
number of patients who completed treatment but did not recover (2,069) is multiplied by the observed
recovery rate of patients who recovered after being stepped up, then 918 more patients would
hypothetically recover. This gives an estimated recovery rate of 47.9%.
It is possible that some patients may not have dropped out if they had been given high intensity therapy,
thus these estimates are conservative. This consideration, as well as the aforementioned considerations
regarding the ambiguity of what ‘dropping out of treatment’ means, as discussed on page 15, needs to
be considered when assessing the plausibility of these two recovery estimates. It is most likely that the
true recovery rates if all patients who did not respond to low intensity treatment were stepped up may
lie somewhere between the two estimates given here (47.9% and 54.1 %).
Investigating Self-referral
In order to widen access, IAPT sites were allowed to accept self-referrals- a break from usual NHS
tradition. Self-referral was used extensively in Newham, one of the two demonstration sites. The
evaluation of the demonstration sites (Clark et al., 2009) found patients who were self-referred did not
differ from GP referrals in terms of their initial PHQ-9 and GAD-7 scores. However, self-referral enabled
the service to provide fairer access to people from the BME community and to patients with some
conditions (social anxiety disorder and PTSD) that tend to be under-represented in GP referrals. The self-
referral rate in the Newham demonstration site was 21%. The average self-referral rate in the year one
sites was much lower. Overall, 7.3% of patients were self-referred, 85.8% were referred by GPs and 6.9%
were referred to IAPT sites from other sources, including Accident and Emergency rooms, voluntary
sector organisations and other clinical specialists. However, there was great variation in the amount of
self-referrals sites accepted, which was shown in Figure 2.5. The model presented at the beginning of
this section investigated whether or not the number of self-referred patients at a site predicted patient
recovery. In line with the findings from the Newham demonstration site (Clark et al., 2009), this was not
found to be the case. Self-referred patients were as likely to recover as patients who were referred from
all other sources (typically GPs). However, it is important to understand whether there were any
differences between patients who were self-referred and patients who were referred from other
sources.
Initial Severity
Mann-Whitney U tests investigating patients’ initial scores show there was no difference in the initial
PHQ-9 [Mann-Whitney U=12440000, p=.285, r=.007] and GAD-7 scores [Mann-Whitney U=12280000,
p=.064, r=.013] of patients who were self-referred and patients referred from other sources, this can be
seen in Figure 3.7.
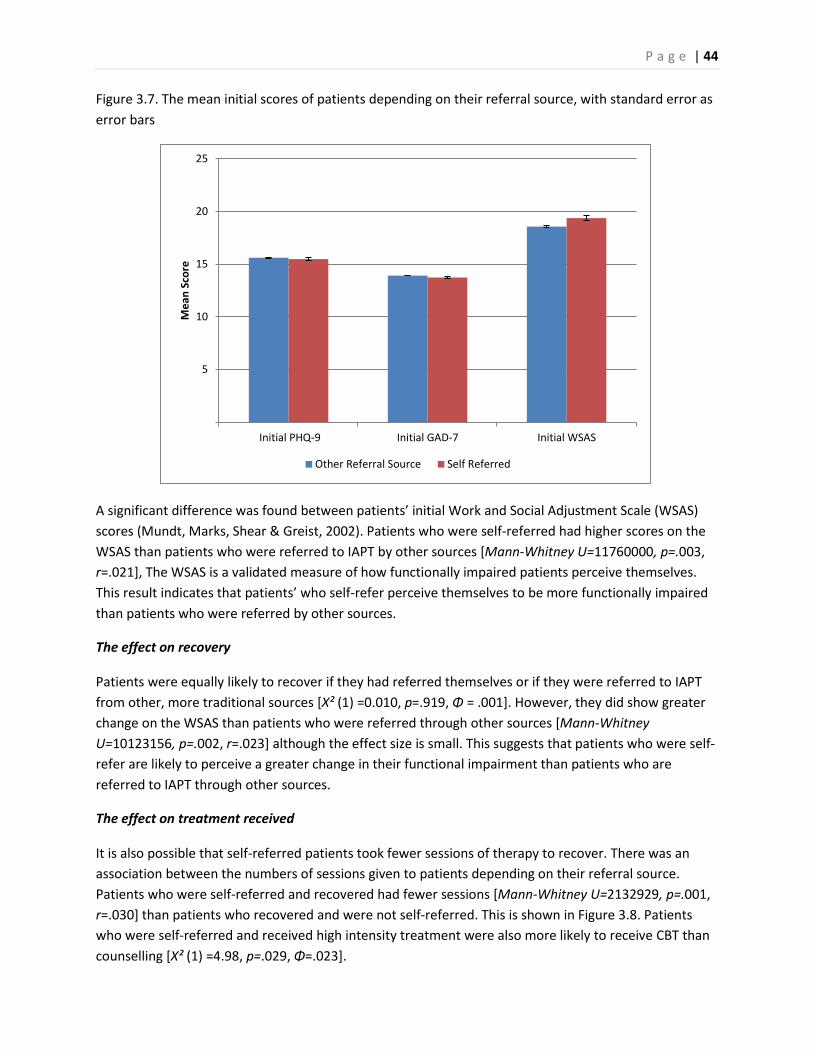
P a g e | 44
Figure 3.7. The mean initial scores of patients depending on their referral source, with standard error as
error bars
A significant difference was found between patients’ initial Work and Social Adjustment Scale (WSAS)
scores (Mundt, Marks, Shear & Greist, 2002). Patients who were self-referred had higher scores on the
WSAS than patients who were referred to IAPT by other sources [Mann-Whitney U=11760000, p=.003,
r=.021], The WSAS is a validated measure of how functionally impaired patients perceive themselves.
This result indicates that patients’ who self-refer perceive themselves to be more functionally impaired
than patients who were referred by other sources.
The effect on recovery
Patients were equally likely to recover if they had referred themselves or if they were referred to IAPT
from other, more traditional sources [Χ² (1) =0.010, p=.919, Φ = .001]. However, they did show greater
change on the WSAS than patients who were referred through other sources [Mann-Whitney
U=10123156, p=.002, r=.023] although the effect size is small. This suggests that patients who were self-
refer are likely to perceive a greater change in their functional impairment than patients who are
referred to IAPT through other sources.
The effect on treatment received
It is also possible that self-referred patients took fewer sessions of therapy to recover. There was an
association between the numbers of sessions given to patients depending on their referral source.
Patients who were self-referred and recovered had fewer sessions [Mann-Whitney U=2132929, p=.001,
r=.030] than patients who recovered and were not self-referred. This is shown in Figure 3.8. Patients
who were self-referred and received high intensity treatment were also more likely to receive CBT than
counselling [Χ² (1) =4.98, p=.029, Φ=.023].
5
10
15
20
25
Initial PHQ-9 Initial GAD-7 Initial WSAS
Me
an S
core
Other Referral Source Self Referred

P a g e | 45
Figure 3.8. The number of therapist sessions by patients’ referral source
There was a significant association between patients’ referral source and whether they received high
intensity treatment, low intensity treatment, or whether they were stepped up [Χ² (4) =180.46, p<.001,
Φ=.100]. Self-referred patients were more likely to receive low intensity treatment than high intensity
treatment or to have been stepped up. This is shown in Figure 3.9. This result may explain why patients
who were self-referred and recovered were more likely to recover in fewer sessions. When one simply
investigates the patients who received low intensity treatment, patients who were self-referred were
not more likely to recover in fewer sessions [Mann-Whitney U=478097.5, p=.069, r=.027]. However,
amongst patients receiving high intensity treatment, self-referred patients were likely to recover in
fewer sessions [Mann-Whitney U=87669.5, p=.009, r=.054] than patients who had the same treatment
and were referred to IAPT from other sources.
Figure 3.9. Treatment types received by self-referred patients
0%
10%
20%
30%
40%
50%
60%
70%
2-4 Sessions 5-7 Sessions 8-10 Sessions 11+ SessionsPe
rce
nta
ge o
f p
atie
nts
th
at r
eco
vere
d w
ith
in
refe
rral
gro
up
Other referral Source Self Referred
0%
10%
20%
30%
40%
50%
60%
70%
Low Intensity Only High Intensity Only Both Low and High Intensity
Pro
po
rtio
n o
f P
atie
nts
Wit
hin
Re
ferr
al
Gro
up
Other Referral Source Self Referred
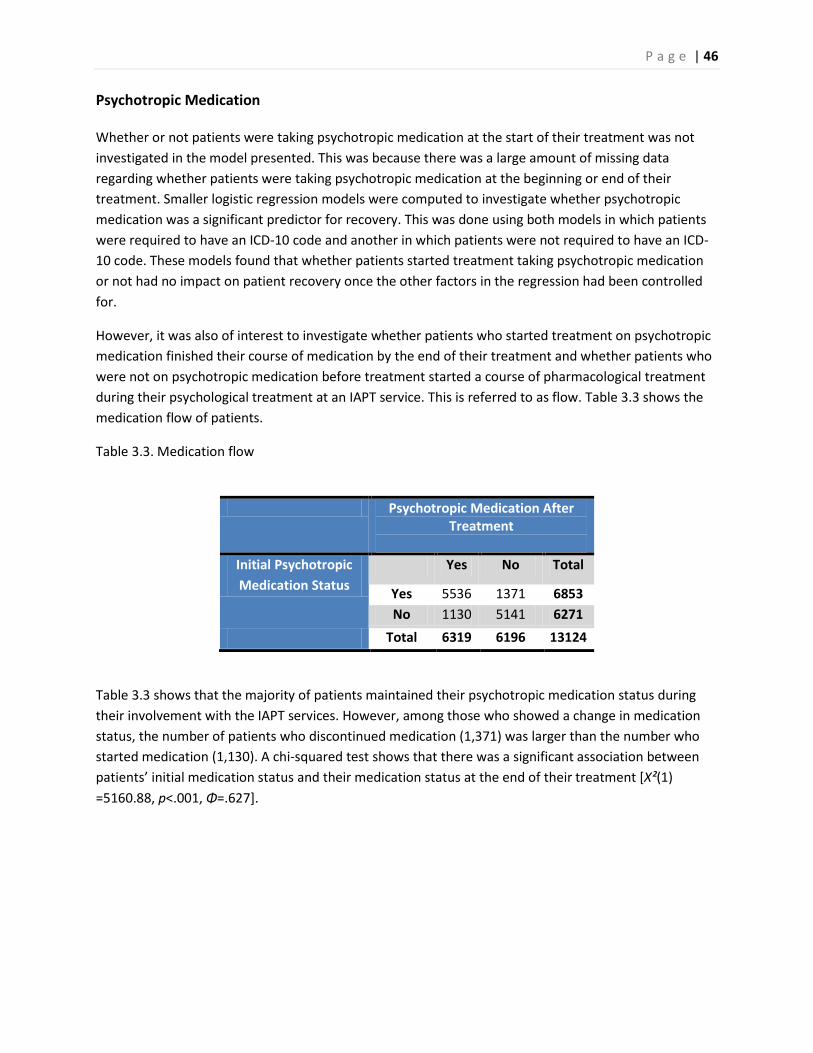
P a g e | 46
Psychotropic Medication
Whether or not patients were taking psychotropic medication at the start of their treatment was not
investigated in the model presented. This was because there was a large amount of missing data
regarding whether patients were taking psychotropic medication at the beginning or end of their
treatment. Smaller logistic regression models were computed to investigate whether psychotropic
medication was a significant predictor for recovery. This was done using both models in which patients
were required to have an ICD-10 code and another in which patients were not required to have an ICD-
10 code. These models found that whether patients started treatment taking psychotropic medication
or not had no impact on patient recovery once the other factors in the regression had been controlled
for.
However, it was also of interest to investigate whether patients who started treatment on psychotropic
medication finished their course of medication by the end of their treatment and whether patients who
were not on psychotropic medication before treatment started a course of pharmacological treatment
during their psychological treatment at an IAPT service. This is referred to as flow. Table 3.3 shows the
medication flow of patients.
Table 3.3. Medication flow
Psychotropic Medication After Treatment
Initial Psychotropic
Medication Status
Yes No Total
Yes 5536 1371 6853
No 1130 5141 6271
Total 6319 6196 13124
Table 3.3 shows that the majority of patients maintained their psychotropic medication status during
their involvement with the IAPT services. However, among those who showed a change in medication
status, the number of patients who discontinued medication (1,371) was larger than the number who
started medication (1,130). A chi-squared test shows that there was a significant association between
patients’ initial medication status and their medication status at the end of their treatment [X²(1)
=5160.88, p<.001, Φ=.627].

P a g e | 47
Understanding Agenda for Change Bandings
The Agenda for Change (AfC) banding of therapists was found to be a significant site factor in the
regression model. In particular, sites that had a larger proportion of their therapy sessions delivered by
therapists at AfC 7 or above had higher overall recovery rates. The banding of therapists is a variable
that can be easily misinterpreted, thus further investigation is required to understand what this result
means. The dataset did not include information about whether the therapists were trainees or qualified
therapists. Furthermore, the dataset did not list the banding of the individual therapists at a site. The
dataset only detailed the type of treatment received by individual patients. This was used to create site
variables, which showed what proportion of patients received certain treatments within the site. The
dataset detailed the number of sessions patients received by the banding of the therapist delivering the
session. As patients could see multiple therapists during treatment, it is possible that patients saw
therapists who were also banded differently.
There was a strong association between the type of treatment received and the banding of the
therapists who delivered the treatment. This can be seen in Figure 3.10. However, Figure 3.10 also
shows that some patients who received low intensity treatment had the majority of their treatment
delivered by highly banded therapists and some high intensity treatments were delivered by therapists
at AfC band 5 or below. It therefore cannot be assumed that patients received a certain type of
treatment purely by the banding of the therapist delivering the treatment.
Figure 3.10. The treatment received by patients, by the banding of the therapists who delivered the
majority of their treatment
0%
10%
20%
30%
40%
50%
60%
Low Intensity Only High Intensity Only Both Low and High Intensity
Pro
po
rtio
n o
f p
atie
nts
in t
reat
me
nt
gro
up
AfC Band 4 or below AfC Band 5 Only AfC Band 6 Only AfC Band 7 or above

P a g e | 48
There were also differences in the banding of therapists delivering different types of high intensity
therapy. Figure 3.11 shows that amongst patients receiving high intensity treatment, those receiving
counselling were more likely to have the majority of their treatment delivered by therapists banded at
AfC band 5 or below [X²(1)=695.10, p<.001, Φ=.357], than those who received CBT. Also, patients who
received CBT were more likely to receive treatment from therapists banded at AfC band 7 than those
who received counselling [X²(1) =273.82, p<.001, Φ=.175]. As we will see in Section 4, the recovery rates
associated with counselling were significantly lower than the recovery rates associated with CBT for two
of the disorders (GAD and MADD) for which a significant amount of counselling was provided. It is
therefore possible that part of the effect of AfC bandings on recovery is explained by differences in the
high intensity therapy provided. However, counselling was most often provided for patients with
depression where it was associated with similar recovery rates to CBT. Given this point, it seems that we
need to look elsewhere to fully understand the relationship between AfC banding and overall recovery
rates for a site. A plausible explanation might lie in the proportion of clinical staff in services who were
already fully trained in CBT when the service started.
We know that some year one IAPT services had very few already trained staff who delivered therapy (as
opposed to supervision) in the service or provided the trainees with the opportunity to learn from
observation while sitting in on their sessions. These services would have lower percentages of staff at
AfC7 or above and it seems plausible that they would have lower recovery rates as almost all therapy
would have been delivered by trainees. Guidance requiring all services to have at least one full-time
equivalent trained CBT therapist for every two trainees in the service was issued at the start of year two
and has generally been followed in Wave Two services. If the effect of the proportion of sessions
undertaken by therapists banded at AfC band 7 and above was really a reflection of some services
having very few experienced clinicians treating patients, we would expect it to disappear or be severely
attenuated in any future audit of IAPT services.
Figure 3.11. The treatment received by patients who received high intensity treatment, by the banding
of the therapists who delivered the majority of their treatment
0%
10%
20%
30%
40%
50%
60%
CBT Counselling Other High IntensityTreatment
Pro
po
rtio
n o
f p
atie
nts
in t
reat
me
nt
gro
up
AfC Band 4 or Below AfC Band 5 AfC Band 6 AfC Band 7 or Above

P a g e | 49
The banding of therapists delivering types of low intensity treatment also differed but this effect was
not as great as it is amongst high intensity treatments. This is shown in Figure 3.12. The type of low
intensity therapy received by patients was associated with whether or not patients were treated by a
therapist banded at AfC band 6 or above [X²(5) =179.57, p<.001, Φ=.176] or AfC band 4 or below [X²(5)
=119.84, p<.001, Φ=.184].
Figure 3.12. The treatment types received amongst patients who received low intensity treatment by
the banding of the therapists who delivered the majority of their treatment
0%
10%
20%
30%
40%
50%
60%
Guided SelfHelp
Pure Self Help PsychologicalEducation
ComputerisedCBT
BehaviouralActivation
StructuredExercise
Pro
po
rtio
n o
f p
atie
nts
in t
reat
me
nt
gro
up
AfC Band 4 or Below AfC Band 5 AfC Band 6 AfC Band7 or Above

P a g e | 50
Summary
This section has investigated the factors associated with recovery across all diagnoses. A multivariate
logistic regression model was created to investigate factors associated with the patient treated and the
site at which they were treated. Patients were required to have an end of treatment marker, have
relevant site data, have been cases at the start of treatment, have an ICD-10 code and have attended an
IAPT site often enough to have two sets of PHQ-9 and GAD-7 scores. Furthermore, if patients were listed
as having been unsuitable for treatment or having declined treatment they were excluded from the
analysis, unless there was sufficient evidence to suggest that they had at least 2 sessions of treatment.
This was done as it was felt that some patients may have been listed as being unsuitable or as having
declined treatment on a post hoc basis as they did not respond to treatment and should still be included
in the analysis. However, it was also important to ensure that patients who did legitimately decline
treatment or were unsuitable for treatment were not included in the analysis. The sample size for the
model was 11,535. This model investigated the factors that would affect the likelihood of patients’
recovery. For patients to be defined as having recovered they were required to finish treatment with
scores below 10 on the PHQ-9 and below 8 on the GAD-7.
Patients’ initial scores were found to be important factors in predicting patients’ likelihood of recovery.
The logistic regression model showed that the higher patients’ initial PHQ-9 and GAD-7 scores were, the
less likely they were to recover. However, this does not mean that more severe patients did not show as
much improvement as patients with lower scores. A non-parametric analysis of variance showed that
patients with scores in the severe range on the PHQ-9 and GAD-7 at assessment were likely to show
greater change on these measures than patients with mild or moderate scores. However, since those
patients who had greater initial scores on these measures had to show a greater reduction in
symptomatology to reach the threshold for recovery, the mean reduction in symptomatology of patients
defined as moderately severe or severe was not enough to fall below the clinical threshold.
Diagnosis was also found to have been an important factor in patients’ likelihood of recovery, with
patients diagnosed with a depressive episode, MADD, GAD, or PTSD having a greater likelihood for
recovery than if they were diagnosed with another disorder. This model required that patients had been
assigned an ICD-10 code. A second model was also created, which did not require that patients had been
assigned an ICD-10 code. This was undertaken to investigate whether the findings from this model could
be generalised to a larger sample in which patients were not required to have a diagnosis, which was
shown to be the case. A description of this model can be found in the annex.
The number of sessions a site gave patients on average was found to an important predictor of patient
recovery. The greater the number of sessions a site gave patients on average, the more likely it was that
patients would recover. This was true amongst patients who received low and high intensity treatment,
and even patients who received ‘other treatment’. The analysis has also shown that the more patients a
site treated, the more likely patients at the site were to recover.
The likelihood of patients recovering was greater if they were treated at a site at which a higher
proportion of sessions were undertaken by therapists banded at AfC band 7 or above, in comparison to
sites where these workers undertook a smaller proportion of sessions. This finding is NOT thought to
reflect the relative merits of low intensity and high intensity interventions as the overall recovery rates

P a g e | 51
associated with the two types of intervention were similar. Instead the finding may partly reflect
variations in the high intensity treatments offered by therapists at different grades, but seems more
likely to reflect the fact that some year one IAPT services had very few already trained staff who
delivered therapy (as opposed to supervision) in the service or provided the trainees with the
opportunity to learn from observation while sitting in on their sessions. To rectify the latter problem,
guidance requiring all services to have at least one full-time equivalent trained CBT therapist for every
two trainees in the service was issued at the start of year two.
Patients were no more likely, or less likely to recover if they received psychotropic medication when
they started treatment. Sites that stepped up a greater proportion of patients were more likely to have
higher recovery rates. More patients were likely to recover at a site if a greater number of patients were
stepped up from low intensity to high intensity treatment at that site. However, the fact that some
patients could not be stepped up because they dropped out of treatment also needs to be considered.
By stepping more patients up recovery rates can be increased. The average recovery rate across all sites
was 42%. Estimates of recovery rates that might have been achieved if more people who failed to
recover at low intensity were stepped up to high intensity ranged from 48% to 54%. The discrepancy
between the two estimates is due to the fact that some patients did not recover as they dropped out of
the treatment, and thus it is not possible to step up all patients who did not recover after low intensity
treatment.
Self-referred patients were more likely to receive low intensity treatment than high intensity treatment.
Self-referred patients’ PHQ-9 and GAD-7 scores were not significantly different from patients who were
referred from other sources. However they did have significantly higher WSAS scores, indicating that
they had greater perceived functional impairment. Whilst self-referred patients were no more likely to
recover than patients referred from other sources, they did also show greater change on the WSAS,
suggesting that they may have shown greater reduction in perceived functional impairment. Patients
who were self-referred were also more likely to require fewer sessions to recover than patients from
other referral sources.

P a g e | 52
4. Investigating the Importance of Providing NICE Compliant High Intensity
Treatment
IAPT services are expected to offer high intensity treatments in line with the NICE guidance. For
depression, NICE (2004a, 2009) recommends CBT for all severities of depression but also recommends
interpersonal therapy (IPT), counselling, couples therapy, and brief dynamic therapy, with the
recommendations ranging somewhat depending on the severity of the condition. In contrast to
depression, the guidelines that have so far been published for anxiety disorders only recommend CBT.
At the moment these guidelines cover panic disorder and generalised anxiety disorder (NICE 2004b,
2011), obsessive-compulsive disorder (NICE, 2005a) and posttraumatic stress disorders (NICE, 2005b).
NICE have not issued guidance for Mixed Anxiety and Depressive Disorder (MADD). However, as
discussed in Section 2, the data suggest that many patients diagnosed with MADD in year one may have
been inappropriately diagnosed and should have been diagnosed with co-morbid depression and an
anxiety disorder instead. If this is the case, current NICE guidelines would suggest CBT would be
indicated.
The NEPHO report (2010) showed that most patients received NICE approved treatments. In particular,
CBT and counselling were both commonly provided for patients with depression, whereas patients with
specific anxiety disorders such as panic disorder, phobias, OCD and PTSD were mainly offered CBT.
However, in two disorders (GAD and MADD) where counselling is not specifically recommended a
substantial number of patients received the treatment. This deviation from NICE provides a natural
experiment to examine whether outcomes in the IAPT services were enhanced if NICE guidance is
followed. In particular, is it the case that in depression recovery rates were comparable for CBT and
counselling, whereas in GAD and MADD higher recovery rates were associated with CBT?
Table 4.1. Number of patients receiving which type of treatment by diagnosis
CBT Counselling CBT and Counselling Low Intensity
Depressive Episode 935 679 211 1531
MADD 1005 704 231 1582
GAD 679 302 107 1119
Recurrent Depression 394 97 46 346
OCD 199 5 12 37
PTSD 142 24 8 30
Agoraphobia 140 7 3 73
Social Phobia 112 9 5 57
Family Loss 17 87 11 25
Specific Phobia 79 5 3 37

P a g e | 53
Figure 4.1. The proportion of treatments received by patients by diagnosis
Counselling and CBT
Figure 4.1 and Table 4.1 show the percentages and numbers of people who received different types of
treatment in the IAPT services, broken down by diagnosis. A number of patients were labelled as having
received both counselling and CBT. There could be two possible explanations for this coding. First,
patients may have received a course of one of the treatments, failed to respond sufficiently and then
moved on to a course of the other treatment. Second, the patient may have had only one therapist who
was trained in just one of the modalities but coded some of their work (accurately or inaccurately) as
falling within the other modality. There was some evidence that this might have happened as some
patients were listed as having received both types of treatment but had only one session of therapy.
There was also no evidence that when two therapies were listed the patient had seen two therapists.
Given these points, it was felt that it would be best to exclude these patients from any comparisons
between CBT and counselling.
0%
10%
20%
30%
40%
50%
60%
70%
80%
90%
DepressiveEpisode
MADD GAD RecurrentDepression
All Phobias OCD PTSD Family Loss Other
Pro
po
rtio
n o
f tr
eat
me
nts
re
ceiv
ed
by
pat
ien
ts
CBT Counselling CBT and Counselling Low intensity only
P a g e | 54
Comparing Recovery Rates
Figure 4.2 shows the recovery rates of patients who received CBT or counselling for depression, GAD or
MADD and provided both PHQ-9 and GAD-7 scores at pre-treatment and termination.
Figure 4.2. Recovery rates across diagnoses by treatment received
Amongst patients who received high intensity treatment and were diagnosed with depressive episode,
recovery rates did NOT differ between CBT and counselling [X2(1) =0.010, p=.921, Φ=.002]. The same
was true for patients diagnosed with recurrent depression [X2(1) =0.249, p=.643, Φ=.023]. However, CBT
was associated with a significantly higher recovery rate than counselling in both GAD [X2(1) =19.34,
p<.001, Φ=.140] and MADD [X2(1) =4.28, p=.038, Φ=.050].
0%
10%
20%
30%
40%
50%
60%
Depressive Episode MADD GAD Recurrent Depression
Re
cove
ry R
ate
s
CBT Counselling Low intensity only

P a g e | 55
Possible Confounds in the Comparison between CBT and counselling.
In order to understand the differences in recovery rates, it is important to look for confounds. One such
confound could be patients’ initial scores. In general, patients with higher pre-treatment PHQ-9 and
GAD-7 scores were less likely to reach recovery criteria by the end of treatment. Thus, if there were any
differences in patients’ initial PHQ-9 and GAD-7 scores depending on whether they received counselling
or CBT this may explain some of the differences in recovery rates discussed above. Figure 4.3 and Figure
4.4 show patients’ mean initial scores on the PHQ-9 and GAD-7. The group used to calculate these
numbers consisted of patients in the database that were diagnosed with a depressive episode, MADD,
generalised anxiety disorder (GAD) or recurrent depression, had received either CBT or counselling,
were cases at the start of treatment, had two sets of scores on the PHQ-9 and GAD-7 and if they were
listed as unsuitable or declined treatment, had more than one session of treatment.
Figure 4.3. Patients’ mean initial scores on the PHQ-9, with standard error as error bars
.
2
4
6
8
10
12
14
16
18
20
Depressive Episode MADD GAD Recurrent Depression
Me
an In
itia
l PH
Q-9
sco
res
CBT Counselling

P a g e | 56
Figure 4.4. Patients’ mean initial scores on the GAD-7, with standard error as error bars
Mann-Whitney U tests show that amongst patients diagnosed with a depressive episode there was a
significant difference between the initial scores of patients who received CBT and counselling. Patients
who received CBT had higher PHQ-9 scores [Mann- Whitney U=294000.5, p=.011, r=.063] but no
significant difference was found between their GAD-7 scores and those of patients who received
counselling [Mann- Whitney U=316123, p=.887, r=.004]. Amongst patients diagnosed with MADD the
treatment they received was associated with their initial scores. Patients who received CBT had higher
GAD-7 scores [Mann- Whitney U=321027.5, p=.001, r=.080] but no difference was found between their
PHQ-9 scores and the scores of patients who received counselling [Mann-Whitney U= 352297, p=.884,
r=.004]. Amongst patients diagnosed with GAD, there was a significant association between patients’
initial scores and the treatment they received. Patients who received CBT had lower initial PHQ-9 scores
[Mann- Whitney U=85090.5, p<.001, r=.136] but there was no difference amongst patients’ initial GAD-7
scores [Mann- Whitney U=99958.5, p=.529, r=.020]. No difference was found for patients with recurrent
depression on either their PHQ-9 scores [Mann-Whitney U=18970.5, p=.912, r=.005] or their GAD-7
scores [Mann- Whitney U=16814, p=.066, r=.083]. The effect sizes of these differences were all small.
Patients’ initial scores were not the only possible confounds. Section 2 showed that stepping patients up
from low intensity to high intensity treatments can have a beneficial effect. Thus it is important to
consider whether patients having previously received low intensity treatments might affect recovery
rates. Of all the patients that were stepped up, significantly more received counselling than CBT [X²(1)
=18.73, p<.001, Φ=.045]. Amongst patients who received CBT, 42.6% were stepped up, whilst 47.3% of
patients who were stepped up received counselling.
2
4
6
8
10
12
14
16
Depressive Episode MADD GAD Recurrent Depression
Me
an In
itia
l GA
D-7
Sco
res
CBT Counselling

P a g e | 57
To examine the possible effects on recovery of the observed differences between CBT and counselling in
initial scores and step-up history, separate hierarchical logistic regressions were computed for patients
diagnosed with depressive episode, recurrent depression, GAD or MADD. In each analysis, initial PHQ-9
scores, initial GAD-7 scores and history of step-up (yes/no) were entered in the first step, followed by
the contrast between CBT and counselling. In this way it was possible to determine whether there were
any differences in the recovery rates associated with CBT and counselling once variability in initial scores
and step-up rates had been taken into account. The results of the logistic regression were identical to
those of the initial analysis of recovery rates. In particular, the contrast between CBT and counselling did
not predict additional variance in recovery rates in depressive disorder or recurrent depression but did
predict additional variance over and above initial scores and step-up rates in GAD and MADD.

P a g e | 58
Summary
This section has investigated the recovery rates associated with CBT and counselling amongst patients
treated in the first year wave one IAPT sites, who were diagnosed with depression, GAD and MADD.
These disorders were chosen as a sufficiently large number of patients with these disorders were
treated in IAPT sites and a sufficiently large number received CBT or counselling.
Patients diagnosed with GAD or MADD were more likely to recover if they had received CBT than if they
had received counselling. These findings are in line with NICE recommendations of CBT for the
treatment of anxiety disorders. The lack of difference between the recovery rates of patients who
received CBT and counselling for depression is also in line with the NICE guidelines for mild to moderate
depression. Taken together these results suggest that IAPT services are likely to show reduced outcomes
if they deviate from NICE guidelines for high intensity treatment, at least with respect to the contrast
between CBT and counselling.
It is important to understand that the differences and similarities between CBT and counselling observed
in the year one data do not constitute tests of treatment efficacy per se. There are numerous possible
confounds in naturalistic comparisons of this sort. Two possible confounds were identified (initial scores
and step-up history) and were shown not to influence the results. However, with naturalistic
comparisons there is always the possibility that there may be other, unmeasured / unknown confounds
that could have influenced the results. The only way to rule this out would be to conduct a randomised
controlled trial.

P a g e | 59
5. Investigating the Importance of Providing NICE Compliant Low Intensity
Treatment
The NEPHO (2010) report found that the majority of low intensity interventions offered in year one IAPT
services were treatments recommended by NICE such as: guided self-help, psychoeducation groups,
computerised CBT and structured exercise. However, one of the most common interventions (pure self-
help) has a less clear role in NICE Guidance. The original (NICE 2004a) and the updated (2009)
depression guidelines support the use of guided self-help and do not recommend pure self-help. By
contrast, the original panic disorder and generalised anxiety disorder (GAD) guideline (2004b) failed to
distinguish between guided and pure self-help and the revised guideline (2011) specifically recommends
pure self-help as well as guided self-help.
Figure 5.1 shows numbers of people with a diagnosis of depressive episode, recurrent depression, GAD
and MADD who received guided self-help or pure self-help. Sufficient people received each intervention
for us to be able to examine whether the recovery rates for people with depression were higher with
guided self-help than pure self-help (as expected from NICE guidelines) and also to examine whether the
recovery rates for the two interventions differed in patients diagnosed with GAD or MADD.
Figure 5.1. Number of patients receiving self-help by diagnosis
0
50
100
150
200
250
300
350
400
450
Depressive Episode MADD GAD Recurrent Depression
Nu
mb
er
of
Pat
ien
ts R
ece
vin
g Se
lf-H
elp
Guided Self Help Pure Self Help

P a g e | 60
Investigating Recovery Rates
Figure 5.2 shows the recovery rates by the type of self-help they received by diagnoses. Chi squared
tests show that there was a significant difference between the recovery rates of patients who received
guided and pure self-help amongst patients diagnosed with a depressive episode, with patients who
received guided self-help being more likely to recover [X²(1)=6.17, p=.013, Φ=.101]. No significant
differences were found amongst patients with MADD, [X²(1) =0.156, p=.693, Φ=.016], GAD [X²(1)
=0.546, p=.460, Φ=.036] or recurrent depression [X²(1) =0.029, p=.866, Φ=.015].
Figure 5.2. Recovery rates by type of self-help and diagnosis
The above analysis was restricted to patients who provided pre and post-treatment PHQ-9 and GAD-7
scores. Inspection of the data file revealed that a significant number of patients (n=1,596) who were
listed as having received either guided or pure self-help had only one set of PHQ-9 and GAD-7 scores.
This suggests that they only had one session of treatment. As these patients did not have a second
score, it is not possible to know with certainty how they progressed. Patients who received pure self-
help were significantly less likely to have two sets of PHQ-9 and GAD-7 scores than patients who
received guided self-help [X²(1) =1024.40, p<.001, Φ=.393], indicating that they were less likely to have
more than one session at an IAPT site. The reasons for patients not returning to services for a second
treatment session are unclear and it is difficult to gauge how or whether patients who did not return
benefited from treatment.
However, it seems important to determine what impact such individuals might have had on the
comparisons between pure and guided self-help. To do this, we made the conservative assumption that
the scores for such individuals remained constant (last observation carried forward). The recovery rates
for guided and pure self-help using this assumption can be seen in Figure 5.3, below. The difference in
recovery rates for patients with a depressive episode remained significant [X²(1) =51.24, p<.001, Φ
=.203]. In addition guided self-help was associated with a significantly higher recovery rate than pure-
0%
10%
20%
30%
40%
50%
60%
70%
DepressiveEpisode
MADD GAD RecurrentDepression
Re
cove
ry R
ate
Guided Self Help Pure Self Help

P a g e | 61
self in MADD [X²(1) =27.10, p<.001, Φ=.153], GAD[X²(1) =19.45, p<.001, Φ=.170] and recurrent
depression [X²(1) =10.54, p=.001, Φ=.199].
Figure 5.3. Recovery rates using a sample in which patients who did not have two scores on the PHQ-9 and GAD-7 had their initial scores carriers forward
Testing Initial Scores
Before interpreting the recovery rate results we need to determine whether patients’ initial symptom
scores might have partly determined the observed similarities and differences in recovery rates. Two
sets of analyses suggested this was not the case. First, initial PHQ-9 and GAD-7 scores were compared
between individuals who received guided self-help and pure self-help. There were no significant
differences. Second, hierarchical logistic regressions were computed in which initial PHQ-9 and GAD-7
scores were entered first, followed by the treatment contrast (guided versus pure self-help). The results
of the hierarchical logistic regressions were identical to the chi-squared comparisons reported above. It
therefore appears that the superiority of guided self-help over pure self-help in patients with depressive
episode is a genuine effect that cannot be attributed to differences in initial symptom scores. The same
applies to the lack of a difference in patients with GAD or MADD who provided pre and post treatment
scores and the emergence of a significant difference in a larger sample that also included patients who
failed to provide a post-treatment score.
Step Up Rates Following Guided and Pure Self-Help.
Another possible index of the relative impact of guided and pure self-help is the extent to which patients
needed to be stepped up to high intensity therapy after each intervention. Of all the patients that were
stepped up, significantly more patients had received pure self-help than guided self-help [X²(1) =466.09,
p<.001, Φ=.287]. The proportion of patients who were stepped up after receiving pure self-help was
25.7%, compared to 54.5% of patients who received pure self-help.
0%
5%
10%
15%
20%
25%
30%
35%
40%
45%
50%
DepressiveEpisode
MADD GAD RecurrentDepression
Re
cove
ry R
ate
Guided Self Help Pure Self Help

P a g e | 62
Summary
Whilst the majority of patients received NICE-approved low intensity treatments, a number of patients
received pure self-help, which was not recommended by NICE for the treatment of depression and has a
changing role in the original (NICE 2004b) and revised (NICE 2010) guidelines. This dataset provides a
natural experiment, comparing the effectiveness of pure self-help and guided self-help within these
diagnoses.
No significant differences were found between the initial PHQ-9 and GAD-7 scores of patients who
received guided and pure self-help across diagnoses. An investigation into the recovery rates amongst
patients who had two sets of PHQ-9 and GAD-7 scores found that amongst patients who were
diagnosed with a depressive episode, those who received guided self-help were more likely to recover
than those who received pure self-help. This is in line with NICE guidance for depression and suggests
that reduced outcomes are achieved when services deviate from that guidance.
In contrast to the findings in patients diagnosed with a depressive episode, guided self-help and pure
self-help were associated with similar recovery rates in GAD, MADD and recurrent depression. However,
if one assumes that patients who did not return to allow a second set of PHQ-9 and GAD-7 to be taken
showed no change, then patients who received pure self-help were less likely to recover than those who
received guided self-help for GAD or MADD. It is likely that this result was due to a large number of
patients not attending any further treatment sessions after being given self-help materials. To get round
this problem, it is recommended that if an IAPT service uses pure self-help it should provide patients
with a formal follow-up session so progress can be assessed and further treatment planned if necessary.
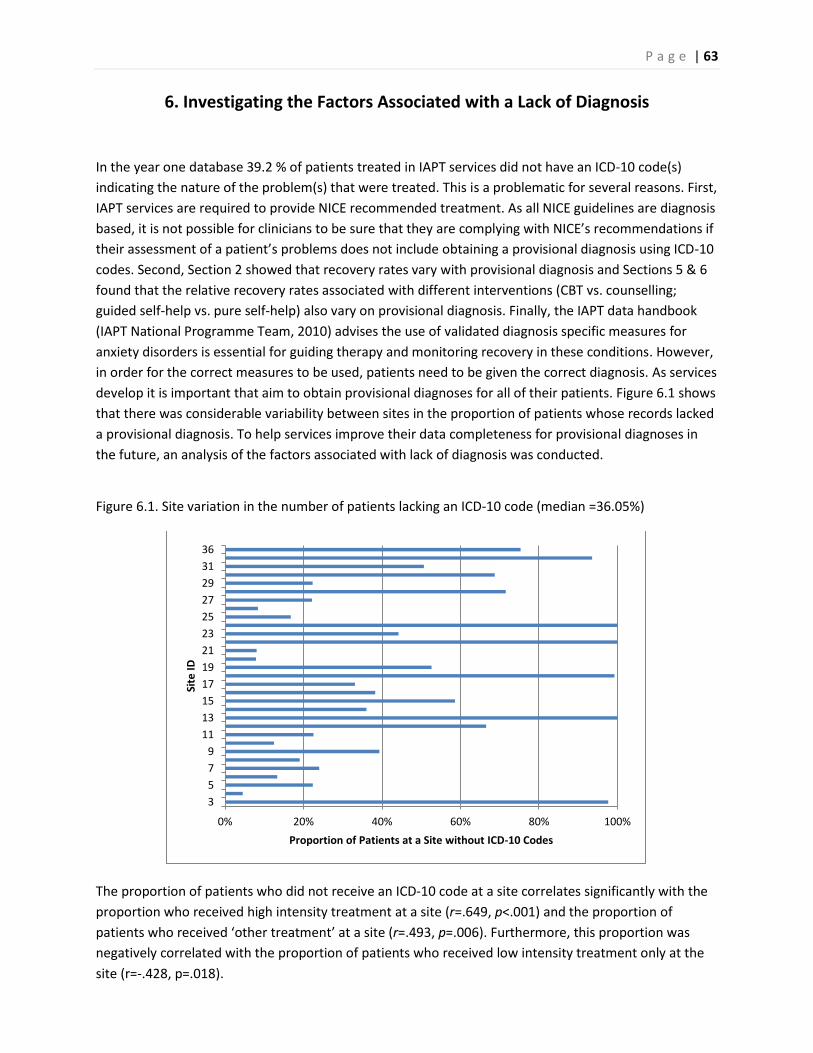
P a g e | 63
6. Investigating the Factors Associated with a Lack of Diagnosis
In the year one database 39.2 % of patients treated in IAPT services did not have an ICD-10 code(s)
indicating the nature of the problem(s) that were treated. This is a problematic for several reasons. First,
IAPT services are required to provide NICE recommended treatment. As all NICE guidelines are diagnosis
based, it is not possible for clinicians to be sure that they are complying with NICE’s recommendations if
their assessment of a patient’s problems does not include obtaining a provisional diagnosis using ICD-10
codes. Second, Section 2 showed that recovery rates vary with provisional diagnosis and Sections 5 & 6
found that the relative recovery rates associated with different interventions (CBT vs. counselling;
guided self-help vs. pure self-help) also vary on provisional diagnosis. Finally, the IAPT data handbook
(IAPT National Programme Team, 2010) advises the use of validated diagnosis specific measures for
anxiety disorders is essential for guiding therapy and monitoring recovery in these conditions. However,
in order for the correct measures to be used, patients need to be given the correct diagnosis. As services
develop it is important that aim to obtain provisional diagnoses for all of their patients. Figure 6.1 shows
that there was considerable variability between sites in the proportion of patients whose records lacked
a provisional diagnosis. To help services improve their data completeness for provisional diagnoses in
the future, an analysis of the factors associated with lack of diagnosis was conducted.
Figure 6.1. Site variation in the number of patients lacking an ICD-10 code (median =36.05%)
The proportion of patients who did not receive an ICD-10 code at a site correlates significantly with the
proportion who received high intensity treatment at a site (r=.649, p<.001) and the proportion of
patients who received ‘other treatment’ at a site (r=.493, p=.006). Furthermore, this proportion was
negatively correlated with the proportion of patients who received low intensity treatment only at the
site (r=-.428, p=.018).
0% 20% 40% 60% 80% 100%
3
5
7
9
11
13
15
17
19
21
23
25
27
29
31
36
Proportion of Patients at a Site without ICD-10 Codes
Site
ID

P a g e | 64
The Effect of Demography
There was no association between patients’ ethnicity and whether or not they were allocated an ICD-10
code [X²(5) =10.84, p=.055, Φ=.028]. Figure 6.2 shows the proportion of patients allocated an ICD-10
code and their ethnicity.
Figure 6.2. The percentage of patients without an ICD-10 code by their ethnicity
Patients’ ages had an effect on whether they were given an ICD-10 code. Younger patients were
significantly less likely to receive an ICD-10 code [t (11867.94) =2.24, p=.025, Cohen’s d=.036]. This can
be seen in Figure 6.3.
Figure 6.3. The percentage of patients without an ICD-10 code by their age
0%
5%
10%
15%
20%
25%
30%
35%
White British MinorityWhite
Mixed Race Asian Black Other
Pro
po
rtio
n W
ith
ou
t IC
D-1
0 C
od
es
0%
10%
20%
30%
40%
50%
60%
Under 18 18 to 34 35 to 64 65 Plus
Pro
po
rtio
n W
ith
ou
t IC
D-1
0 C
od
es

P a g e | 65
The Effect of Initial Severity
There were no significant differences between the initial PHQ-9 [Mann-Whitney U=44160000, p=.081,
r=.013] and GAD-7 scores [Mann-Whitney U=44650000 p=.638, r=.003] of patients who had received an
ICD-10 code and those that did not. However, a difference was found between the two groups’ WSAS
scores [Mann-Whitney U=41420000, p<.001, r=.033]. As can be seen in Figure 6.4 patients without a
diagnosis had lower disability scores.
Figure 6.4. Change in PHQ-9 and GAD-7 scores by whether patients received an ICD-10 code
2
4
6
8
10
12
14
16
18
20
PHQ-9 GAD-7 WSAS
Me
an In
itia
l Sco
re
With ICD-10 Code Without ICD-10 Code

P a g e | 66
The Effect of Treatment and Therapists
Patients who received the majority of their treatment sessions from therapists banded at AfC band 6 or
above were less likely to receive an ICD-10 code than those who received the majority of their
treatment sessions from therapists banded at AfC band 5 or below [Χ²(1)=82.24, p<.001, Φ=.076]. This
relationship remained true for patients who received the majority of their treatment sessions from
therapists banded at AfC band 7 or above versus therapists banded at AfC 6 or below [Χ²(1)=29.25,
p<.001, Φ=.039].
Amongst patients who received high intensity treatment, there was a significant association between
the patients who received CBT or counselling and whether or not they received an ICD-10 code [Χ² (1)
=36.52, p<.001, Φ=.063]. Patients who received CBT were more likely have a recorded diagnosis than
patients who received counselling. IPT and couples’ therapists were the least likely high intensity
therapists to give a diagnosis although very few patients received these treatments in the first year of
IAPT. This can be seen in Figure 6.6 and Table 6.1, below. Amongst patients receiving low intensity
treatment, those who received guided self-help were the least likely to receive a diagnosis.

P a g e | 67
Figure 6.6. The percentage of patients without an ICD-10 code by treatment received
Table 6.1. The number and percentage of patients without an ICD-10 code by treatments received
Computerised CBT
Pure Self-Help
Guided Self-Help
Behavioural Activation
Structured exercise
Psycho-educational group
CBT Interpersonal therapy
Counselling Couples Therapy
Percentage of patients with no ICD-10 code 25% 24% 43% 31% 25% 31% 35% 55% 40% 50%
Total Count 1066 5574 6963 2133 959 2371 6824 150 4304 62
0%
10%
20%
30%
40%
50%
60%
Computerised CBT Pure Self Help Guided Self Help BehaviouralActivation
Structuredexercise Psychoeducational
group
CBT Interpersonaltherapy
Counselling Couples Therapy
Pe
rce
nta
ge o
f p
atie
nts
wih
tou
t an
ICD
-10
co
de

Whether or not patients had been stepped up was also found to have an effect, as patients who had been
stepped up were more likely to receive an ICD-10 code [Χ² (1) =281.93, p<.001, Φ=.121]. Furthermore,
patients who only received high intensity treatment were less likely to receive an ICD-10 code than patients
who received only low intensity treatment [Χ² (1) =23.09, p<.001, Φ=.041]. This can be seen in Figure 6.7.
Figure 6.7. The percentage of patients without an ICD-10 code by the treatment type they received
The number of sessions patients received was also found to be associated with whether or not patients
received an ICD-10 code or not. Patients who did not receive an ICD-10 had fewer sessions [Mann- Whitney
U=42150000, p<.001, r=.051] although the size of this effect was small.
0%
5%
10%
15%
20%
25%
30%
35%
40%
45%
50%
Low Intensity High Intensity Both Low and HighIntensity
Pe
rce
nta
ge o
f p
atie
nts
wit
ho
ut
an IC
D-1
0
cod
e
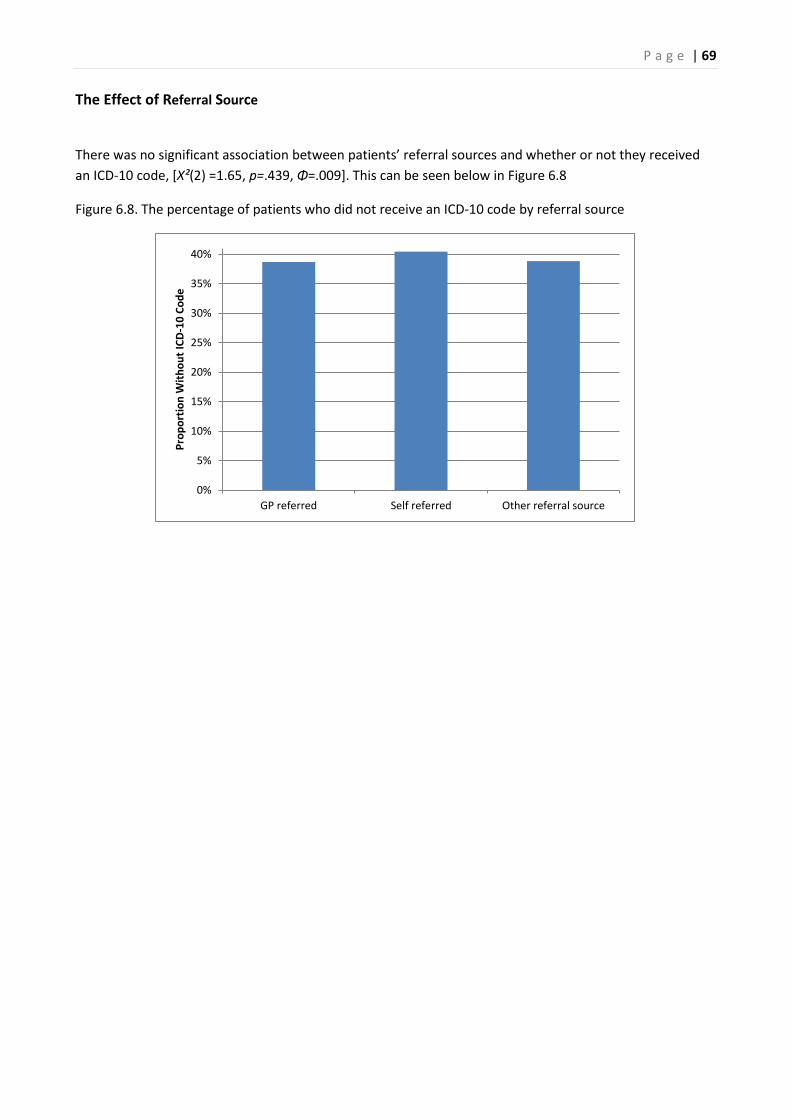
P a g e | 69
The Effect of Referral Source
There was no significant association between patients’ referral sources and whether or not they received
an ICD-10 code, [X²(2) =1.65, p=.439, Φ=.009]. This can be seen below in Figure 6.8
Figure 6.8. The percentage of patients who did not receive an ICD-10 code by referral source
0%
5%
10%
15%
20%
25%
30%
35%
40%
GP referred Self referred Other referral source
Pro
po
rtio
n W
ith
ou
t IC
D-1
0 C
od
e

P a g e | 70
Summary
This section sought to investigate the factors associated with patients who did not receive an ICD-10 code.
A large proportion of patients (39.2%) were not assigned an ICD-10 code. The IAPT year one dataset gives
an excellent opportunity to investigate whether certain therapists were less likely to give their patients an
ICD-10 code. It was found that the type of treatment patients received (high, low or stepped up) had an
effect on whether patients received an ICD-10 code. The banding of the therapists was also found to be
associated with whether or not patients received ICD-10 codes. The higher therapists were banded, the less
likely their patients were to receive an ICD-10 code. Amongst high intensity patients, those who received
interpersonal therapy and couples therapy were less likely to receive an ICD-10 code. This is concerning as
interpersonal therapy and couples therapy are only recommended by NICE for patients with depression
(NICE, 2009).
Patients who did not have an ICD-10 code were also likely to receive fewer sessions. Younger patients were
less likely to receive an ICD-10 code. This means that we can be less confident that younger people received
NICE approved treatment. No effect of ethnicity was found on the likelihood of receiving an ICD-10 code.
However, patients who received CBT were more likely to receive an ICD-10 code than those who received
counselling. Self-referred patients were as likely to lack an ICD-10 code as patients referred from other
sources. Patients not assigned an ICD-10 code did not score significantly differently from patients assigned
an ICD-10 code on the PHQ-9 and the GAD-7 at assessment. However, patients with an ICD-10 code were
likely to have significantly higher initial WSAS scores. These factors were not considered in a model which
considers all things equal in the same manner that the investigation into recovery did. When attempts
were made to create such models, the models created did not fit the data well.

P a g e | 71
7. Reliable Deterioration and Improvement
Much of the analysis described in this report has focused on recovery rates. However, it was also important
to investigate whether patients’ conditions had deteriorated whilst in treatment. Jacobson and Truax’s
(1991) Reliable Change Index (RCI) is an appropriate way of assessing deterioration as it allows one to
determine whether an increase in symptom scores from pre to post-treatment exceeds the measurement
error of the relevant scale, and hence can be considered statistically reliable. The measure of reliability
used was to calculate RCIs for both the PHQ-9 and the GAD-7, was Cronbach’s α as reported in the original
validation studies for the PHQ-9 (Kroenke, Spitzer & Williams, 2001) and the GAD-7 (Spitzer, Kroenke,
Williams & Lowe, 2006).
Reliable Deterioration across the Whole Population
The RCI for the PHQ-9 was 5.20. As changes in scores for individual patients must take integer values, this
means that a patient must have shown a pre-treatment to post-treatment change of at least 6 points for
the change to be considered reliable. Using 6 as the threshold for a reliable change, 3.2% of patients
showed reliable deterioration on the PHQ-9 (n=622). The index for reliable change on the GAD-7 was found
to be 3.53, indicating that a patient would need to show a change of at least 4 points for the change to be
considered reliable. Using 4 as the threshold for reliable change, 5.3% showed reliable deterioration on the
GAD-7 (n=1,036). This dataset did not include a control group, so it is not possible to compare the number
of patients who showed reliable deterioration in year one IAPT services to patients in a wait list control
group. Nonetheless, the number of patients who did show reliable deterioration was very low.
Reliable Deterioration within Diagnoses
The analysis presented above was undertaken on the whole sample. However, this sample consisted of
patients treated for a variety of disorders. The PHQ-9 and GAD-7 are used as general measures of
depressive and anxious symptomatology in the IAPT minimum dataset, but they are also validated
measures of the severity of specific disorders (depression and GAD respectively). It was therefore decided
to calculate reliable deterioration rates for these disorders specifically using the relevant measure.
Depression
Using α=0.05 as the criterion for reliable change, it was found that patients would have to show a change of
4.71 on the PHQ-9 to have shown reliable change. This figure is smaller than the figure calculated
previously. This is because the previous analysis was undertaken on the whole population of patients
regardless of their diagnoses or lack thereof. This means the sample was less homogeneous than a sample
of patients with depression and there was less variance between PHQ-9 scores reducing the index for
reliable change. As the PHQ-9 only uses integers, this is rounded up to 5. Patients were considered to have
shown reliable deterioration if they showed a change in 6 points or more on the PHQ-9. Amongst patients
with ICD-10 diagnoses of depression (e.g. depressive episode or recurrent depression), 4.9% showed
reliable deterioration (n=216). Of these 216 patients, 52 were diagnosed with recurrent depression which
constitutes 5.6% of all patients diagnosed with recurrent depression and 164 were diagnosed with a
depressive episode which constitutes 4.7% of all patients diagnosed with a depressive episode.

P a g e | 72
Generalised Anxiety Disorder
The index of reliable change on the GAD-7 was calculated as being a change of 3.28. This means an increase
of 4 or more points would be considered reliable deterioration. Amongst patients with an ICD-10 diagnosis
of GAD, 3.3% showed reliable deterioration (n=75).
Site Variation in the Proportion of Patients showing Reliable Deterioration
This report has shown that there was large amount of variation between sites in their recovery rates. One
would expect that this would also mean that there was a variation in the number of patients who show
reliable deterioration in sites. This is shown in Figure 7.1 and Figure 7.2. The proportion of patients at a site
that showed reliable deterioration on the PHQ-9 was positively correlated to the proportion of patients
that show reliable deterioration on the GAD-7 at a site (r=.544, p=.002). The proportion of patients at sites
that showed reliable deterioration on the PHQ-9 was not correlated with sites’ recovery rates (r=-.203,
p=.272) nor was the proportion of patients at site that show reliable deterioration on the GAD-7
significantly correlated with site recovery rates (r=-.285, p=.121).
Figure 7.1. Proportion of patients showing reliable deterioration on PHQ-9
0% 1% 2% 3% 4% 5% 6% 7%
3
5
7
9
11
13
15
17
19
21
23
25
27
29
31
36
Proportion of Patients who Showed Reliable Deterioration on the PHQ-9
Site
ID

P a g e | 73
Figure 7.2. Proportion of patients showing reliable deterioration on GAD-7
Reliable Improvement
The Reliable Change Index (RCI) allows the assessment of whether or not patients showed reliable
deterioration; however, the RCI also allows us to assess whether or not patients have shown reliable
improvement. If patients showed a reduction of symptoms to the magnitude of the increase of symptoms
shown by patients who reliably deteriorated, then these patients can be said to have reliably improved.
This means that if patients with depression showed a reduction of 6 or more on the PHQ-9 they can be said
to have shown reliable change, of which 55.7% did (n=2,479). If patients diagnosed with GAD showed
reliable improvement, then they would have had to show a change of 4 on the GAD-7, of which 65.9% did
(n=1,519).
0% 1% 2% 3% 4% 5% 6% 7% 8% 9% 10%
3
4
5
6
7
8
9
10
11
12
13
14
15
16
17
18
19
20
21
22
23
24
25
26
27
28
29
30
31
33
36
Proportion of Patients who Showed Reliable Deterioration on the GAD-7
Site
iD

P a g e | 74
Across the whole sample, patients had to show a reduction of 6 or more on the PHQ-9 to be considered to
have shown reliable improvement. The proportion of patients who showed reliable improvement on the
PHQ-9 was 47.3% (n=9,183). For any patient to have shown reliable improvement on the GAD-7 they had to
have shown a 4 point or more reduction in their symptoms. The proportion of patients who showed
reliable improvement on the GAD-7 was 56.5% (n=10,960).
Combining PHQ and GAD scores when calculating reliable deterioration and reliable improvement.
The preceding analyses of reliable deterioration and reliable improvement have used single measures (PHQ
or GAD). While this seems reasonable for analyses of patients with the relevant disorders (depression and
GAD respectively), one might argue that a combined index which assessed whether patients showed: 1)
reliable deterioration on either or both measures and 2) reliable improvement on either or both measures
might be more informative for the sample as a whole. This is partly because some patients will show very
low or very high initial scores on one measure and, as a consequence, there isn’t enough room on the scale
for them to show reliable improvement or deterioration, respectively. For this calculation, someone is
considered to have shown reliable deterioration if their PHQ-9 or GAD-7 score reliably increases and the
score for the other scale either does the same or does not reliably change. Similarly, someone is considered
to have shown reliable improvement if their PHQ-9 or GAD-7 score reliably decreases and the score for the
other scale either does the same or does not reliably change. Table 7.1 shows the proportions of patients
who showed reliable change on the PHQ-9 and/or the GAD-7. Using these definitions, 6.6% (n= 1,289) of all
treated patients showed reliable deterioration and 63.8% (n = 12,361) showed reliable improvement.
Table 7.1. The proportion of the population who showed reliable deterioration, no reliable change or
reliable improvement on the PHQ-9 and/or the GAD-7
Reliable Change Measured on GAD-7
Reliable Deterioration
No Reliable Change
Reliable Improvement
Reliable Change
Measured on PHQ-9
Reliable Deterioration
1.2% (n=241) 1.7% (n=337) 0.2% (n=44)
No Reliable Change
3.7% (n=711) 29.0% (n=5,617) 16.8% (n=3,262)
Reliable Improvement
0.4% (n=84) 7.5%(n=1,445) 39.5% (n=7,654)

P a g e | 75
Summary
The analysis in this section has shown that fewer than 4.9% of patients treated in year one IAPT sites, and
for whom reliable deterioration could be reliably measured using a diagnostic specific measure, showed
reliable deterioration. When the whole patient population was assessed, 6.6% of patients showed reliable
deterioration on the PHQ-9 and/or the GAD-7. It is not possible to investigate whether patients would have
shown more or less reliable deterioration if they had received no treatment or if they had been treated in
another service, as data from a control group was not included in the dataset. However, the observed rates
were very low and it seems likely that natural variation within an untreated population would result in a
larger proportion of people showing reliable deterioration. There was some site variation in the number of
patients showing reliable deterioration. The proportion of patients showing reliable deterioration at a site
on the PHQ-9 or GAD-7 was not found to be correlated with the sites’ recovery rates.
The reliable change index was also used to compute whether or not patients had shown reliable
improvement during their treatment. Amongst patients with an ICD-10 depression diagnosis, 55.7%
showed reliable improvement and 65.9% of patients diagnosed with GAD showed reliable improvement.
When the whole sample was assessed, 63.8% showed reliable improvement. Thus, the majority of patients
treated at IAPT sites in the first year showed a reliable reduction in their symptomatology.

P a g e | 76
8. References
Clark, D. M., Layard, R., Smithies, R., Richards, D. A., Suckling, R., & Wright, B. (2009). Improving access to psychological therapy: Initial evaluation of two UK demonstration sites. Behaviour research and therapy, 47(11), 910-920. Cohen, J. (1992). A power primer. Psychological Bulletin, 112, 155-159.
Connor, K.M., Davidson, J.R.T, Churchill, L.E., Sherwood, A., Weisler, R.H. & Foa, E.D. (2000) Psychometric
Properties of the Social Phobia Inventory (SPIN) The British Journal of Psychiatry 176, 376-386
Conover, W.J. & Iman, R.L., (1982) Analysis of covariance using the rank transformation. Biometrics 2(38), 715–724. Department of Health (2008) IAPT Implementation Plan: National Guidelines for Regional Delivery, Department of Health, Editor.
Field, A. P. Discovering Statistics Using SPSS (3rd Ed). London: Sage, 2009.
Foa, E. B., Kozak, M. J., Salkovskis, P.M., Coles, M.E. & Amir, N. (1998) Psychological Assessment 10(3), 209-
214.
Horowitz, M., Wilner, N. & Alvarez, W. (1979) Impact of Event Scale: a measure of subjective stress
Psychosomatic Medicine, 41(3), 209-218.
Hosmer, D.W., & Lemeshow, S. (1989) Applied Logistic Regression. New York, NY .John Wiley & Sons. Improving Access to Psychological Therapies (IAPT) (2010) Being Fair. Including All. Equality Impact Assessment, Guidance for Commissioners, Department of Health, Editor. IAPT National Programme Team (2011) The IAPT Data Handbook 2. Department of Health, Editor. Jacobson, N. S. & Truax, P. (1991) Clinical significance: A statistical approach to defining meaningful change in psychotherapy research Journal of Consulting and Clinical Psychology, 59,12-19. Kroenke, K., Spitzer, R.L., & Williams, J.B. (2001) The PHQ-9: validity of a brief depression severity measure. Journal of General Internal Medication, 16(9), 606–613. Layard, R., Bell, S., Clark, D. M., Knapp, M., Meacher, M., Priebe, S., Turnberg, L., Thornicroft, G., & Wright, B. (2006). The depression report: A new deal for depression and anxiety disorders. Centre for Economic Performance Report, LSE. McManus, S., Meltzer, H., Brugha, T., Bebbington, P, and Jenkins, R. (2007). Adult Psychiatric Morbidity in England 2007: Results of a Household Survey. The Health and Social Care Information Centre, UK
Menard, S. (1995) Applied Logistic Regression Analysis. Quantitative Applications in the Social Sciences, No. 106. London. Sage.
Mickey, R. M., & Greenland, S. (1989). The impact of confounder selection criteria on effect estimation. American journal of epidemiology, 130(5), 1066.

P a g e | 77
Mundt, J. C., Marks, I. M., Shear, M. K., & Greist, J.M. (2002) The Work and Social Adjustment Scale: a simple measure of impairment in functioning. British Journal of Psychiatry, 180, 461 -464.
National Institute for Health and Clinical Excellence (2004a) Depression: Management of depression in primary and secondary care CG23, London, National Institute for Health and Clinical Excellence.
National Institute for Health and Clinical Excellence (2004b) Anxiety: management of anxiety (panic disorder, with or without agoraphobia, and generalised anxiety disorder) in adults in primary, secondary and community care, CG22, London, National Institute for Health and Clinical Excellence.
National Institute for Health and Clinical Excellence (2005a) Obsessive-compulsive disorder: core interventions in the treatment of obsessive-compulsive disorder and body dysmorphic disorder CG31, London, National Institute for Health and Clinical Excellence. National Institute for Health and Clinical Excellence (2005b), The management of PTSD in adults and children in primary and secondary care, CG26, London, National Institute for Health and Clinical Excellence
National Institute for Health and Clinical Excellence (2007) Anxiety: management of anxiety (panic disorder, with or without agoraphobia, and generalised anxiety disorder) in adults in primary, secondary and community care.CG22, London, National Institute for Clinical Excellence.
National Institute for Health and Clinical Excellence (2009) Depression: the treatment and management of depression in adults (update) CG90, London, National Institute for Clinical Excellence.
National Institute for Health and Clinical Excellence (2011) Anxiety: management of anxiety (panic disorder, with or without agoraphobia, and generalised anxiety disorder) in adults Management in primary, secondary and community care.CG113, London, National Institute for Clinical Excellence.
National Institute for Mental Health in England, (2008) Mental Health Outcomes Compendium, Department of Health.
North East Public Health Observatory (2010) Improving Access to Psychological Therapies: A review of the progress made by the sites in the first roll-out year Stockton on Tees.
Spitzer R.L., Kroenke K., Williams J.B.W., & Löwe B. (2006) A brief measure for assessing generalized anxiety disorder: the GAD-7. Archive Internal Medicine 166:1092-1097.

P a g e | 78
9. Annex: Investigating Whether the Results from the Regression Model Generalise
to a Sample Which Includes Patients Without an ICD-10 Code
Section 3 described a multivariate logistic regression model created to investigate the patient and site
variables associated with recovery, other things held constant. This model required that all patients had an
ICD-10 code. However, 39.2% of patients treated within the first year of IAPT were not given a diagnosis. It
is important to investigate whether the findings from this sample also generalise to patients who were not
assigned a diagnosis. Thus, a second model was created to investigate whether or not this is the case. This
model used the same inclusion criteria as the previous model, with the exception that patients were not
required to have an ICD-10 code. Of the patients included in the model, 37.8%9 did not have an ICD-10
code. The sample size for this analysis was 18,543 (see Figure 3.1).
In order for patients to have been included in the sample for these analyses, they were required to have an
assessment and to have been a case at assessment. Furthermore, patients were required to have had an
end of treatment marker, demonstrate that they had attended an IAPT site at least twice by having two
sets of scores on the PHQ-9 and the GAD-7, and have had sufficient site data to be included in the analysis.
The recovery rate for this sample was 42.3%.
How much variance was explained?
The Hosmer & Lemeshow test shows that this model had a good fit on the data [X²(8) =4.81, p=.778].
However, it explained slightly less variance than the model included in Section 3. Nagelkerke’s R² showed
that the model explained 17.1% of the variance and the model differed significantly from a model which
only included the constant [X²(20) =2530.73, p<.001]. The model successfully identified 51.8% of patients
who recovered and 77.4% of those who did not. Overall, the model correctly identified 66.5 % of patients’
outcomes.
Model description
The variables shown to have had an effect on recovery are shown below in Table 9.1. This model also found
that patients’ initial PHQ-9 and GAD-7 scores had a significant effect on recovery. The higher patients’ initial
scores were, the less likely they were to recover. However, as we have seen in Section 3 this does NOT
mean that patients with higher initial scores showed less improvement. In fact the opposite was the case;
patients who started treatment with higher scores on the PHQ-9 were more likely to show greater change
on the PHQ-9 [X²(2) =438.92, p<.001] and patients who started treatment with higher scores on the GAD-7
were more likely to show greater change on the GAD-7[X²(2) =1204.24, p<.001]. Patients who were classed
as being ‘severe’ on the PHQ-9 at assessment showed a mean reduction of 7.95 (SD=7.62), in comparison to
patients classed as ‘moderately severe’ (mean= 6.39, SD =6.45) or ‘moderate’ (mean=4.44, SD =5.33).
Patients who were classed as being ‘severe’ on the GAD-7 at assessment showed a mean reduction of 6.74
on the GAD-7 (SD=6.26), in comparison to patients classed as ‘moderate’ (mean= 4.40, SD =5.13) or ‘mild’
(mean=2.13, SD =4.32). The median number of sessions received by patients who had low intensity
treatment only, high intensity treatment only or were stepped up at a site was found to be positively
related to site recovery rates. The same was true for patients who received ‘other treatment’.
9 This figure differs from 39.2% as sites which did not have complete site data were less likely to assign diagnoses; to be included in
this regression patients had to have been treated at sites that had sufficient site data, as per the first model.

P a g e | 79
Table 9.1. Summary of Secondary Model
Variable B S.E. Wald Sig. Exp(B) 95% C.I.for EXP(B)
Lower Upper
Proportion of Patients Self Referred at a Site -.386 .251 2.356 .125 .680 .415 1.113
Proportion of Patients Stepped Up at a Site .911 .147 38.675 .000 2.487 1.866 3.315
Median Number of Sessions Received By Patients who Received Low Intensity Treatment
.146 .020 52.078 .000 1.157 1.112 1.203
Median Number of Sessions Received By Patients who Received High Intensity Treatment
-.028 .021 1.710 .191 .973 .933 1.014
Median Number of Sessions Received By Stepped Up Patients .081 .015 27.931 .000 1.085 1.052 1.118
Median Number of Sessions Received By Patients who Received ‘other treatment’
.101 .024 18.398 .000 1.106 1.056 1.159
Proportion of Therapist Sessions Undertaken by Therapists Banded at AfC band 7 or above
.624 .223 7.844 .005 1.866 1.206 2.887
Initial PHQ-9 Score -.092 .003 724.059 .000 .912 .906 .918
Initial GAD-7 Score -.067 .004 264.532 .000 .935 .928 .943
Lack Of Diagnosis .172 .066 6.700 .010 1.187 1.043 1.352
Patient was Stepped Up .350 .182 3.689 .055 1.419 .993 2.029
Patient Received High Intensity Treatment .411 .182 5.110 .024 1.508 1.056 2.155
Patients Received ‘Other treatment’ -.276 .202 1.869 .172 .758 .510 1.127
Patient Received Low Intensity Treatment .303 .181 2.805 .094 1.355 .950 1.932
Depressive Episode Diagnosis .217 .069 9.940 .002 1.243 1.086 1.422
MADD Diagnosis .183 .069 7.121 .008 1.201 1.050 1.374
GAD Diagnosis .411 .074 30.518 .000 1.508 1.304 1.745
Phobia Diagnosis .215 .111 3.782 .052 1.240 .998 1.540
PTSD Diagnosis .437 .161 7.379 .007 1.548 1.129 2.121
Other Diagnosis .103 .054 3.626 .057 1.108 .997 1.232
Constant .068 .225 .091 .763 1.070
Patients’ diagnoses were found to be important. Patients diagnosed with MADD, depressive episode, GAD,
or PTSD had better recovery rates than those with another diagnosis. Interestingly, patients who were not
assigned a diagnosis did not show reduced recovery rates. Table 9.2 shows patients’ recovery rates by
diagnosis. This shows that patients without an ICD-10 code had higher recovery rates than patients
diagnosed with depression, MADD and family loss, but lower recovery rates than patients diagnosed with
phobias, GAD and PTSD. It is important to note that the recovery rates shown below do not consider other
things equal, whereas the logistic regression takes other factors, such as initial PHQ-9 and GAD-7 scores
into account when investigating likelihood of recovery.
Table 9.2. Recovery Rates by Diagnosis
Diagnosis Recovery Rate
Depressive Episode 40.3% MADD 39.2% GAD 52.2% Recurrent Depression 35.4% Phobia Diagnosis 48.1% OCD 42.7% PTSD 45.2% Family Loss 39.3% Other Diagnosis 41.0% No ICD-10 Code 43.3%

P a g e | 80
The model shows that that the greater the proportion of therapist sessions that were undertaken by
therapists banded at AfC 7 or above, the more likely it was that patients would recover. Furthermore, the
greater the number of patients treated at the site, the more likely it was that patients treated at the site
would recover. If patients received ‘other treatment’ they were less likely to recover than if they received
high or low intensity treatment, but not significantly in this model. However, when a chi squared test was
used to investigate whether there was a difference in recovery rates, without considering other factors,
there was a significant difference between the recovery rates of patients who received other treatment
and those that did not [X²(1) =62.27, p<.001, Φ=.058]. In this sample, the recovery rate was 42.7% for
patients who received low intensity treatment, 42.5% for patients who received high intensity treatment,
43.9% for patients who were stepped up and 27.4% for patients who received ‘other treatment’.
The results from this model are very similar to those of the model included in Section 3. However, it
included a greater number of factors than the other model and thus offers a less parsimonious explanation
of the variance found in year one IAPT sites. The variables that were included in this model, but not the
previous one, were not very strong predictors of recovery but were included in the model to help it fit the
data. The model also explained slightly less variance than the previous model. This is presumably because
some of this variance would be explained by patient diagnoses, had these been assigned to everyone.
However, the variables which are shared between the two models have similar effects on patients’
likelihood of recovery and can be said to be consistent predictors of recovery. Whilst the model presented
in Section 3 is a better model, this model indicates that the results from the first model can be generalised
to a population in which not all patients receive an ICD-10 code.
Site Level Correlations in Secondary Model Cohort
The logistic regression model considered all the factors predicting recovery at the same time. This allowed
the model to remove any variables which were found to mask the effects of other variables. This allows us
to consider the site level variables alongside patient level variables, such as the treatment received by
patients, their diagnosis, and their initial PHQ-9 and GAD-7 scores. However, it can also be useful to
investigate the site characteristics individually at a site level, which can help us interpret the results from a
patient level analysis. However, as there were only 27 sites included in these analyses, due to the lack of
site level information at some sites, the correlational analyses only had enough power to find large effects
(Cohen, 1992).
Associated with recovery
The median number of sessions given by a site was positively correlated with site recovery rates (r=.599,
p<.001). This can be seen in Figure 9.1. The median number of sessions given to patients who were stepped
up was also positively correlated with site recovery rates (r=.505, p=.007) and the median number of
sessions given to patients who received low intensity treatment (r=.434, p=.024). The proportion of
sessions undertaken by therapists banded at AfC band 7 or above was also positively correlated with site
recovery rates (r=.398, p=.040).

P a g e | 81
Figure 9.1. Recovery rates by the median number of sessions given to patients at a site
The number of sessions given to patients
The average number of sessions given to all patients at sites was positively correlated with the number of
sessions given to patients who received high intensity treatment (r=.707, p<.001), low intensity treatment
(r=.849, p<.001) and both high and low treatment (r=.662, p=.002). This was not true amongst patients who
received ‘other treatment’ (r=.183, p=.361). The median number of sessions given to all patients at a site
was positively correlated with the proportion undertaken by therapists banded at AfC band 7 or above
(r=.522, p=.005). The proportion of sessions undertaken by therapists banded at AfC band 7 or above was
also positively correlated with the median number of sessions given to high intensity (r=.626, p<.001). The
median number of sessions given to patients at a site was also significantly negatively correlated with the
number of patients assessed at a site (r=-.453, p=.018), but not the number treated at a site (r=-.304,
p=.123). Sites at which a greater number of patients received low intensity treatment tended to give a
greater number of sessions of high intensity treatment to patients (r=.439, p=.022) and tended to give
fewer patients ‘other treatment’ (r=-.393, p=.043). Also, sites at which a greater proportion of patients
received ‘other treatment’ gave more sessions to stepped up patients (r=.414, p=.032).
Self-referral and step-up rates
The proportion of self-referred patients at a site was positively correlated with the proportion of patients at
a site who only received low intensity treatment (r=.394, p=.042) and negatively with the proportion of
patients who only received high intensity treatment (r=-.568, p=.002). Sites which stepped up a greater
number of patients from low intensity to high intensity tended to give fewer sessions of high intensity
treatment (r=-.432, p=.024). Sites which stepped up a greater number of patients also tended to assess a
greater number of patients (r=.512, p=.008) and gave a smaller proportion of patients solely low intensity
treatment (r=-.500, p=.008).
0%
10%
20%
30%
40%
50%
60%
70%
0 1 2 3 4 5 6 7 8
Site
Re
cove
ry R
ate
s
Median Number of Sessions Overall

P a g e | 82
Summary
The logistic regression model in Section 3 did not include patients who were not assigned an ICD-10 code.
This produced a strong model which found various factors that had an effect on patients’ likelihood of
recovery. However, the requirement for all patients to have an ICD-10 code reduced the sample size of the
analyses. The aim of the analyses presented in this annex was to find out whether the factors found to be
predictors of patients’ recovery were consistent when a more inclusive sample of patients was used. These
sensitivity analyses found that the factors that predict recovery were the same when a larger sample was
used, which included patients who were not assigned an ICD-10 code.


![Untitled-15 [ftp.columbia.edu]ftp.columbia.edu/itc/barnard/arthist/wolff/pdfs/week6_duncan...John Layard, Stone Men of Malekula, Yao (London, 1942), 652. Layard drew from his own field](https://img.dokumen.tips/doc/110x75/5b1e05907f8b9ab85b8b46c4/untitled-15-ftp-ftp-layard-stone-men-of-malekula-yao-london-1942-652.jpg)


![Richard Layard, La Felicidad[1]](https://img.dokumen.tips/doc/110x75/5571fb4e4979599169948255/richard-layard-la-felicidad1.jpg)


