Embed Size (px)
Citation preview
The NPD Group, Inc. | Proprietary and ConfidentialThe NPD Group, Inc. | Proprietary and Confidential
Copyright 2014. The NPD Group, Inc. All Rights Reserved. This presentation is Proprietary and Confidential and may not be disclosed in any manner, in whole or in part, to any third party without the express written consent of NPD.
Copyright 2014. The NPD Group, Inc. All Rights Reserved. This presentation is Proprietary and Confidential and may not be disclosed in any manner, in whole or in part, to any third party without the express written consent of NPD.
State of the Plate:
Fruit & Vegetable Consumption Trends
March 2015
The NPD Group, Inc. | Proprietary and ConfidentialThe NPD Group, Inc. | Proprietary and Confidential
Trends in Fruits & Vegetables
Consumption
2
The NPD Group, Inc. | Proprietary and ConfidentialThe NPD Group, Inc. | Proprietary and Confidential
Is Fruit & Vegetable Consumption Growing?
3
The NPD Group, Inc. | Proprietary and ConfidentialThe NPD Group, Inc. | Proprietary and ConfidentialThe NPD Group, Inc. | Proprietary and ConfidentialThe NPD Group, Inc. | Proprietary and Confidential
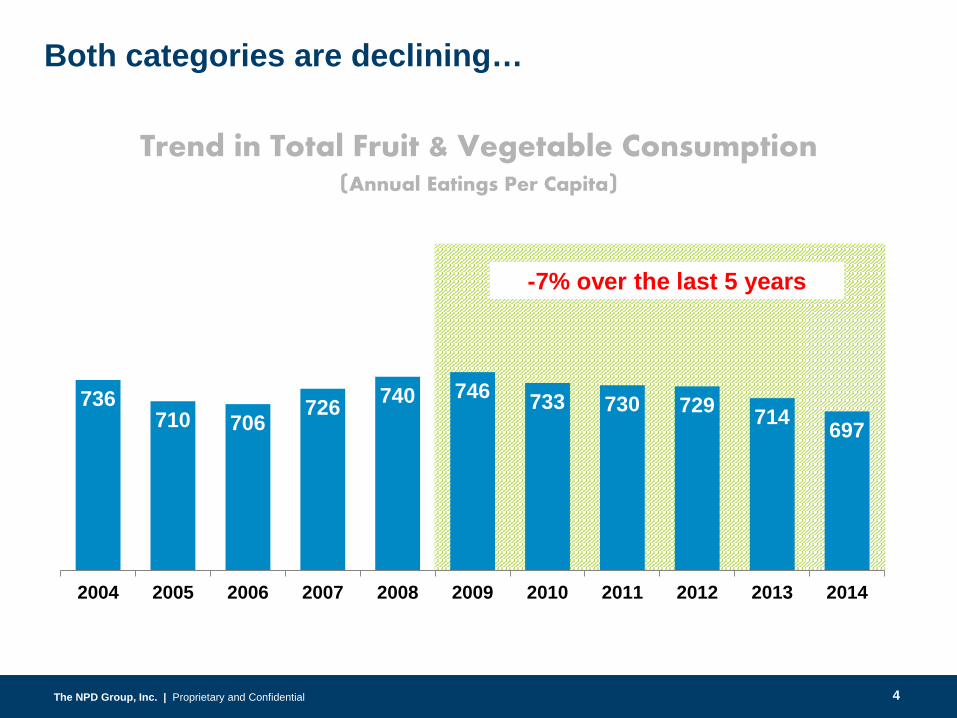
736710 706
726 740 746 733 730 729 714 697
2004 2005 2006 2007 2008 2009 2010 2011 2012 2013 2014
Trend in Total Fruit & Vegetable Consumption(Annual Eatings Per Capita)
-7% over the last 5 years
Both categories are declining…
4
The NPD Group, Inc. | Proprietary and ConfidentialThe NPD Group, Inc. | Proprietary and ConfidentialThe NPD Group, Inc. | Proprietary and ConfidentialThe NPD Group, Inc. | Proprietary and Confidential
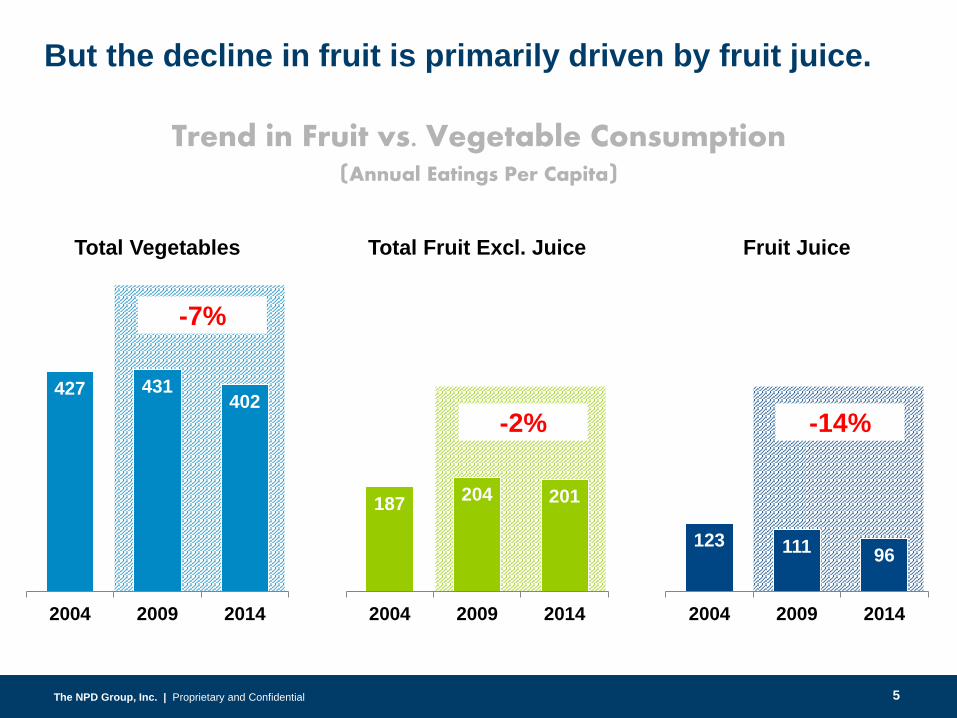
427 431402
2004 2009 2014
Total Vegetables
187 204 201
2004 2009 2014
Total Fruit Excl. Juice
123 111 96
2004 2009 2014
Fruit Juice
But the decline in fruit is primarily driven by fruit juice.
-2% -14%
-7%
Trend in Fruit vs. Vegetable Consumption(Annual Eatings Per Capita)
5
The NPD Group, Inc. | Proprietary and ConfidentialThe NPD Group, Inc. | Proprietary and ConfidentialThe NPD Group, Inc. | Proprietary and ConfidentialThe NPD Group, Inc. | Proprietary and Confidential
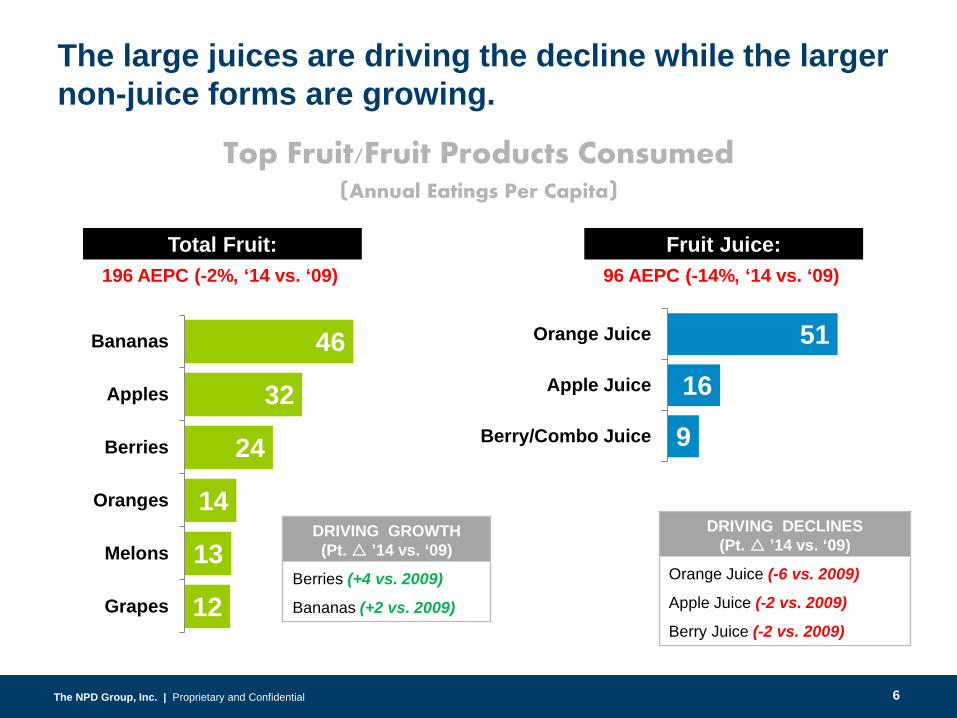
9
16
51
Berry/Combo Juice
Apple Juice
Orange Juice
Fruit Juice:
12
13
14
24
32
46
Grapes
Melons
Oranges
Berries
Apples
Bananas
Total Fruit:
Top Fruit/Fruit Products Consumed(Annual Eatings Per Capita)
The large juices are driving the decline while the larger non-juice forms are growing.
DRIVING GROWTH (Pt. ’14 vs. ‘09)
Berries (+4 vs. 2009)
Bananas (+2 vs. 2009)
DRIVING DECLINES (Pt. ’14 vs. ‘09)
Orange Juice (-6 vs. 2009)
Apple Juice (-2 vs. 2009)
Berry Juice (-2 vs. 2009)
96 AEPC (-14%, ‘14 vs. ‘09) 196 AEPC (-2%, ‘14 vs. ‘09)
6
The NPD Group, Inc. | Proprietary and ConfidentialThe NPD Group, Inc. | Proprietary and ConfidentialThe NPD Group, Inc. | Proprietary and ConfidentialThe NPD Group, Inc. | Proprietary and Confidential
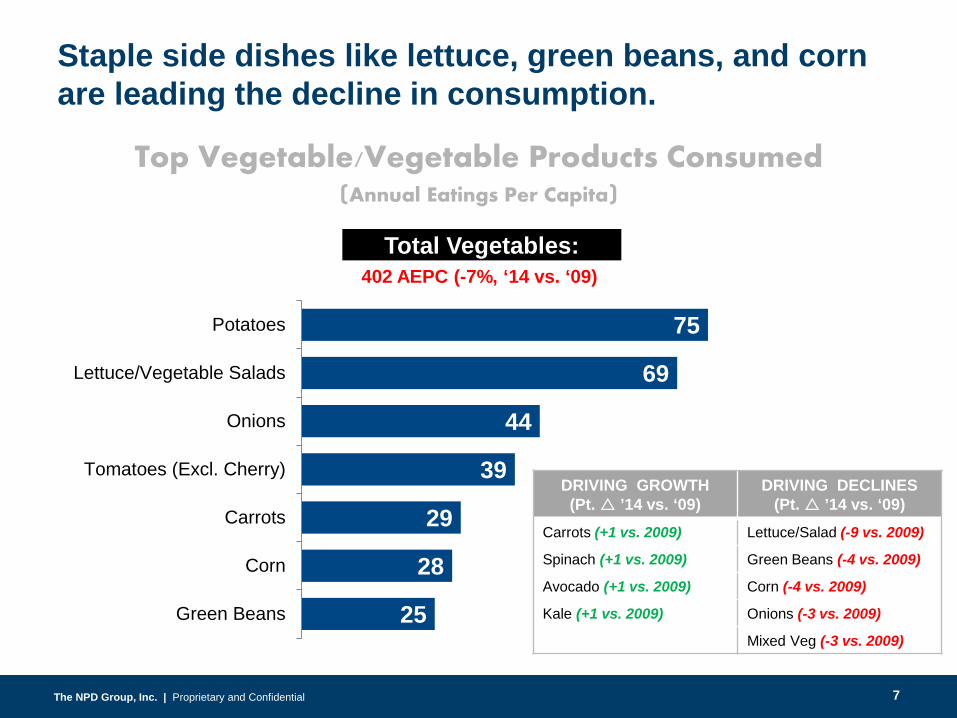
Staple side dishes like lettuce, green beans, and corn are leading the decline in consumption.
25
28
29
39
44
69
75
Green Beans
Corn
Carrots
Tomatoes (Excl. Cherry)
Onions
Lettuce/Vegetable Salads
Potatoes
Top Vegetable/Vegetable Products Consumed(Annual Eatings Per Capita)
DRIVING GROWTH (Pt. ’14 vs. ‘09)
DRIVING DECLINES (Pt. ’14 vs. ‘09)
Carrots (+1 vs. 2009) Lettuce/Salad (-9 vs. 2009)
Spinach (+1 vs. 2009) Green Beans (-4 vs. 2009)
Avocado (+1 vs. 2009) Corn (-4 vs. 2009)
Kale (+1 vs. 2009) Onions (-3 vs. 2009)
Mixed Veg (-3 vs. 2009)
Total Vegetables:402 AEPC (-7%, ‘14 vs. ‘09)
7
The NPD Group, Inc. | Proprietary and ConfidentialThe NPD Group, Inc. | Proprietary and Confidential
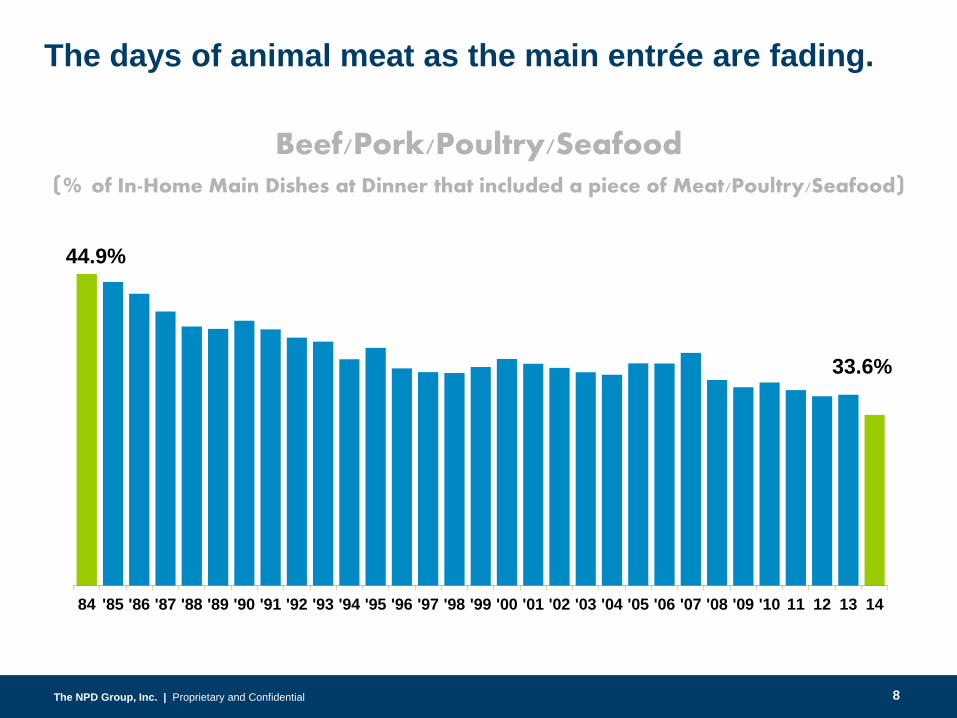
44.9%
33.6%
84 '85 '86 '87 '88 '89 '90 '91 '92 '93 '94 '95 '96 '97 '98 '99 '00 '01 '02 '03 '04 '05 '06 '07 '08 '09 '10 11 12 13 14
Beef/Pork/Poultry/Seafood(% of In-Home Main Dishes at Dinner that included a piece of Meat/Poultry/Seafood)
The days of animal meat as the main entrée are fading.
8
The NPD Group, Inc. | Proprietary and ConfidentialThe NPD Group, Inc. | Proprietary and ConfidentialThe NPD Group, Inc. | Proprietary and ConfidentialThe NPD Group, Inc. | Proprietary and Confidential
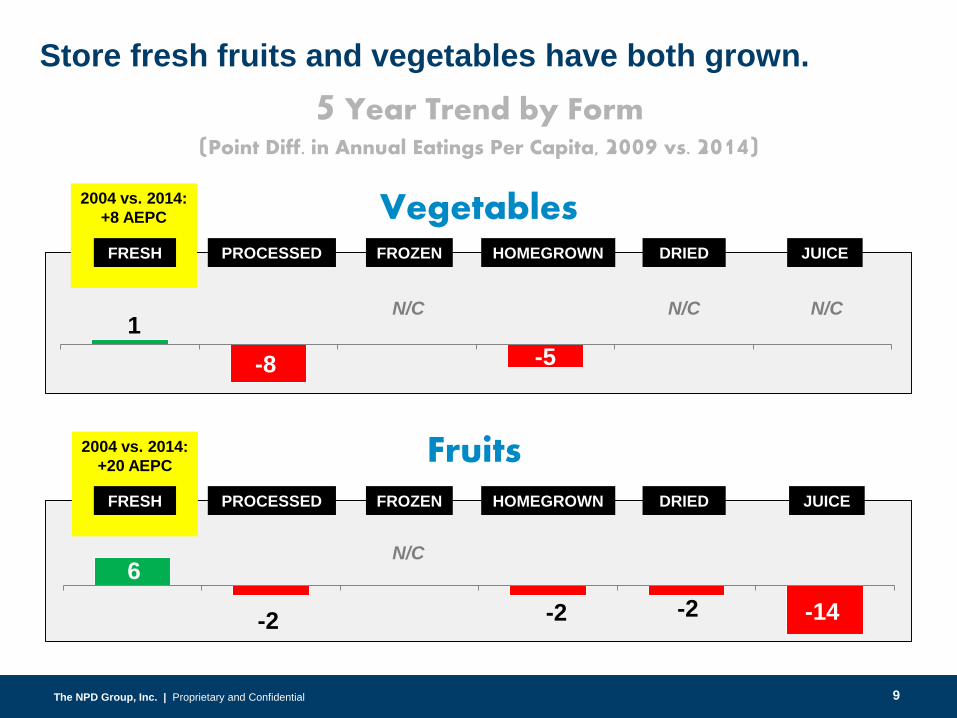
1-8 -5
2004 vs. 2014: +20 AEPC
2004 vs. 2014: +8 AEPC Vegetables
Fruits
FRESH PROCESSED FROZEN HOMEGROWN DRIED
5 Year Trend by Form(Point Diff. in Annual Eatings Per Capita, 2009 vs. 2014)
Store fresh fruits and vegetables have both grown.
JUICE
6
-2 -2 -2 -14
N/C N/C N/C
N/C
PROCESSED FROZEN HOMEGROWN DRIED JUICEFRESH
9
The NPD Group, Inc. | Proprietary and ConfidentialThe NPD Group, Inc. | Proprietary and ConfidentialThe NPD Group, Inc. | Proprietary and ConfidentialThe NPD Group, Inc. | Proprietary and Confidential
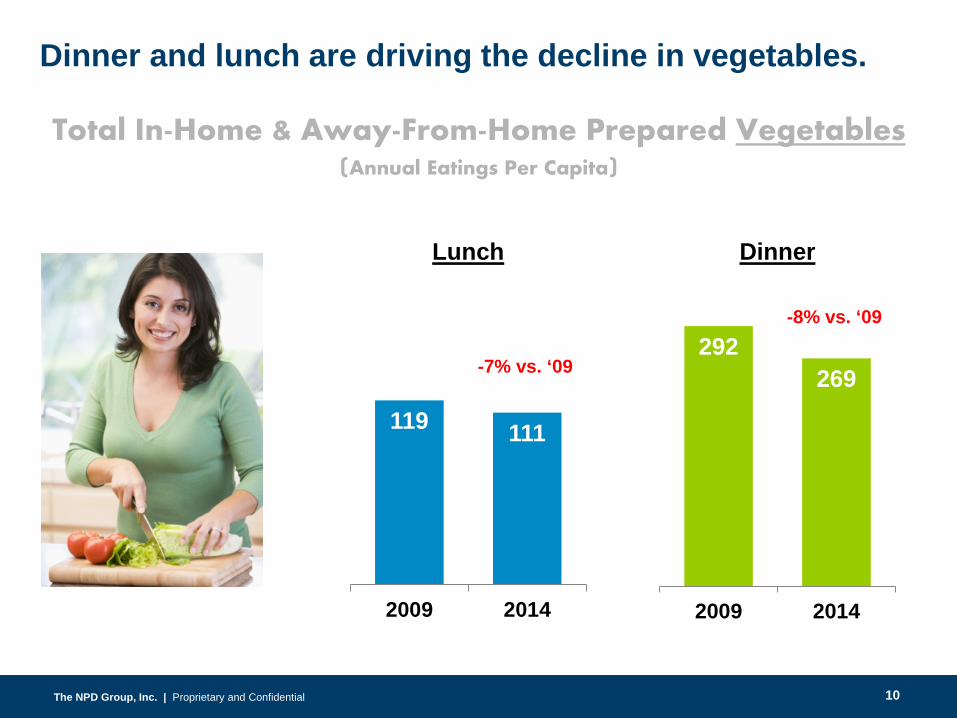
119 111
2009 2014
Lunch
Total In-Home & Away-From-Home Prepared Vegetables(Annual Eatings Per Capita)
292269
2009 2014
Dinner
-8% vs. ‘09
-7% vs. ‘09
Dinner and lunch are driving the decline in vegetables.
10
The NPD Group, Inc. | Proprietary and ConfidentialThe NPD Group, Inc. | Proprietary and ConfidentialThe NPD Group, Inc. | Proprietary and ConfidentialThe NPD Group, Inc. | Proprietary and Confidential
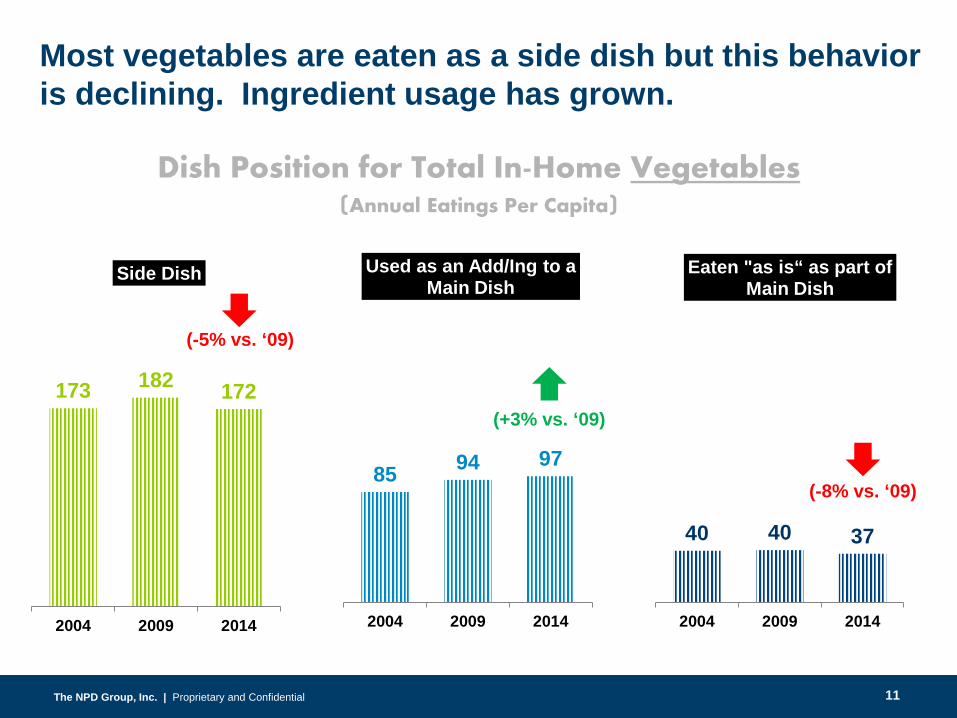
Dish Position for Total In-Home Vegetables(Annual Eatings Per Capita)
173 182 172
2004 2009 2014
Side Dish
(-5% vs. ‘09)
85 94 97
2004 2009 2014
Used as an Add/Ing to a Main Dish
40 40 37
2004 2009 2014
Eaten "as is“ as part of Main Dish
(+3% vs. ‘09)
(-8% vs. ‘09)
Most vegetables are eaten as a side dish but this behavior is declining. Ingredient usage has grown.
11
The NPD Group, Inc. | Proprietary and ConfidentialThe NPD Group, Inc. | Proprietary and Confidential
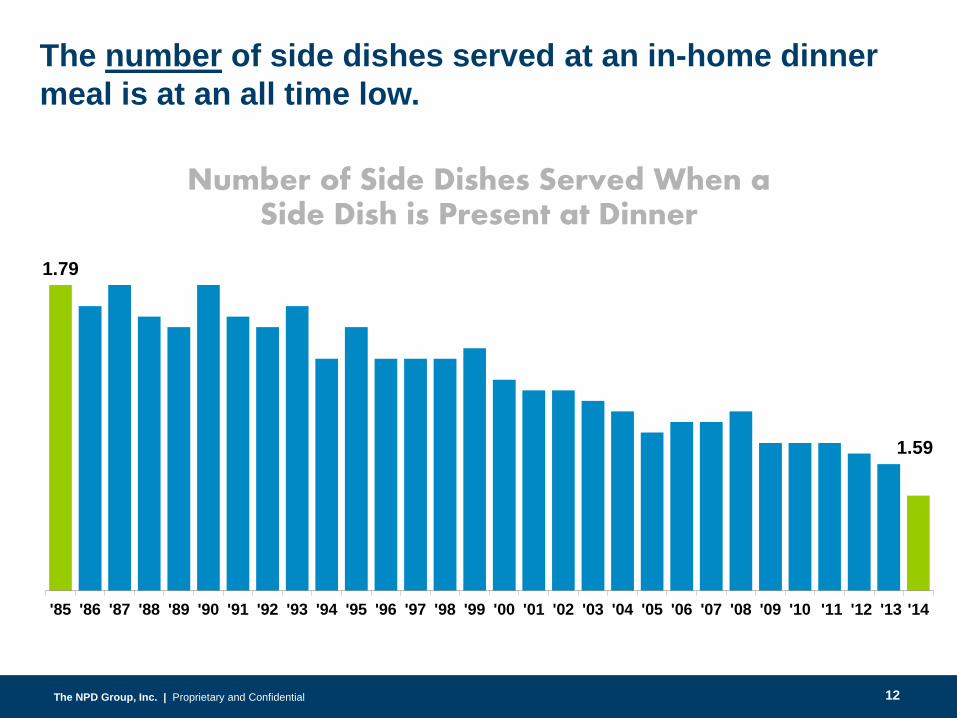
1.79
1.59
'85 '86 '87 '88 '89 '90 '91 '92 '93 '94 '95 '96 '97 '98 '99 '00 '01 '02 '03 '04 '05 '06 '07 '08 '09 '10 '11 '12 '13 '14
Number of Side Dishes Served When a Side Dish is Present at Dinner
The number of side dishes served at an in-home dinner meal is at an all time low.
12
The NPD Group, Inc. | Proprietary and ConfidentialThe NPD Group, Inc. | Proprietary and ConfidentialThe NPD Group, Inc. | Proprietary and ConfidentialThe NPD Group, Inc. | Proprietary and Confidential
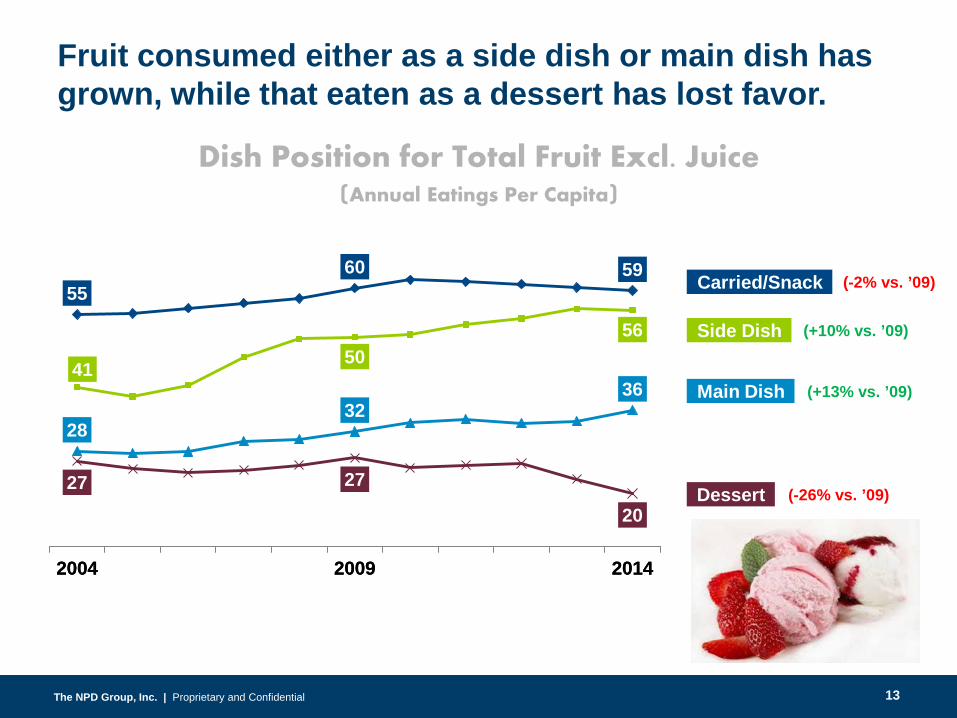
5560 59
27 27
20
2004 2009 2014
(-2% vs. ’09)Carried/Snack
(-26% vs. ’09)Dessert
Fruit consumed either as a side dish or main dish has grown, while that eaten as a dessert has lost favor.
41 5056
2832
36
2004 2009 2014
(+10% vs. ’09)Side Dish
(+13% vs. ’09)Main Dish
Dish Position for Total Fruit Excl. Juice(Annual Eatings Per Capita)
13
The NPD Group, Inc. | Proprietary and ConfidentialThe NPD Group, Inc. | Proprietary and ConfidentialThe NPD Group, Inc. | Proprietary and ConfidentialThe NPD Group, Inc. | Proprietary and Confidential
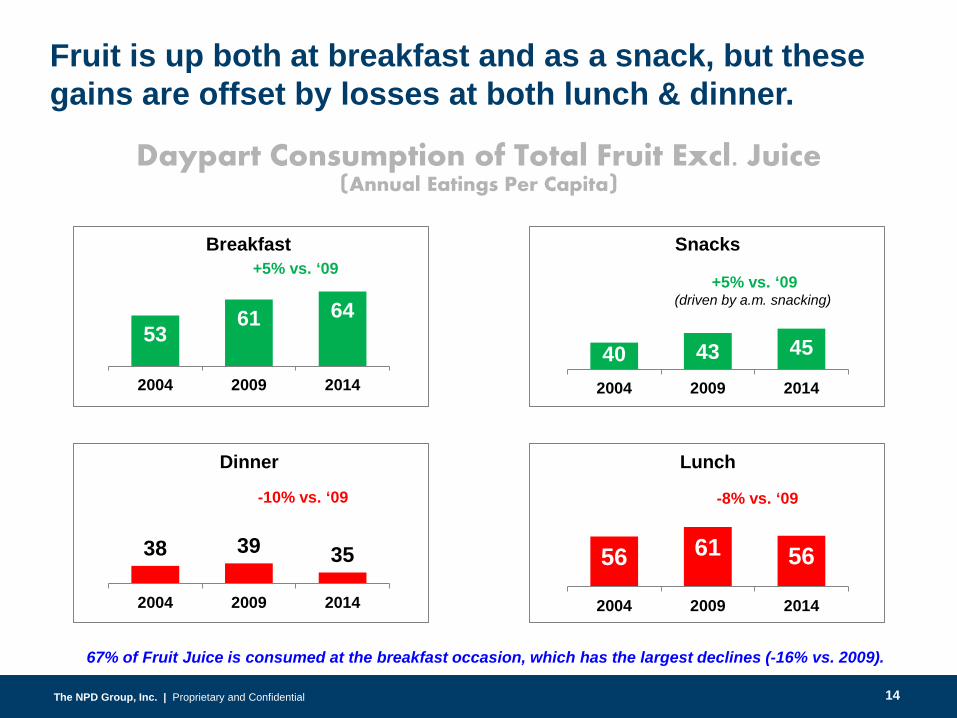
67% of Fruit Juice is consumed at the breakfast occasion, which has the largest declines (-16% vs. 2009).
Daypart Consumption of Total Fruit Excl. Juice (Annual Eatings Per Capita)
Fruit is up both at breakfast and as a snack, but these gains are offset by losses at both lunch & dinner.
-8% vs. ‘09-10% vs. ‘09
56 61 56
2004 2009 2014
Lunch
38 39 35
2004 2009 2014
Dinner
+5% vs. ‘09
5361 64
2004 2009 2014
Breakfast
+5% vs. ‘09(driven by a.m. snacking)
40 43 45
2004 2009 2014
Snacks
14
The NPD Group, Inc. | Proprietary and ConfidentialThe NPD Group, Inc. | Proprietary and ConfidentialThe NPD Group, Inc. | Proprietary and ConfidentialThe NPD Group, Inc. | Proprietary and Confidential
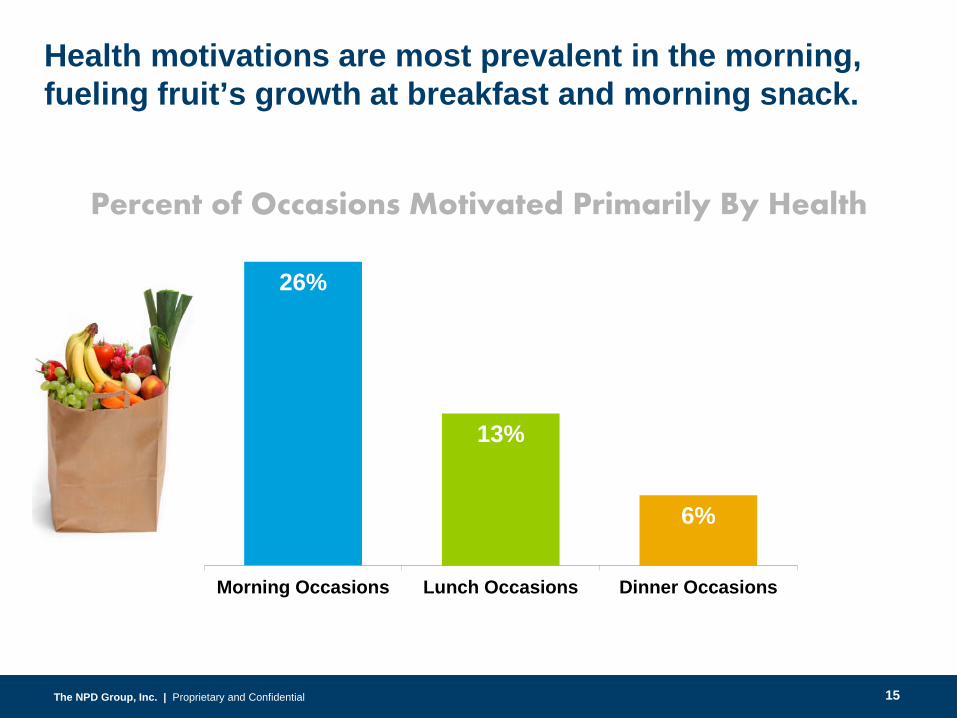
26%
13%
6%
Morning Occasions Lunch Occasions Dinner Occasions
Percent of Occasions Motivated Primarily By Health
Health motivations are most prevalent in the morning, fueling fruit’s growth at breakfast and morning snack.
15
The NPD Group, Inc. | Proprietary and ConfidentialThe NPD Group, Inc. | Proprietary and Confidential
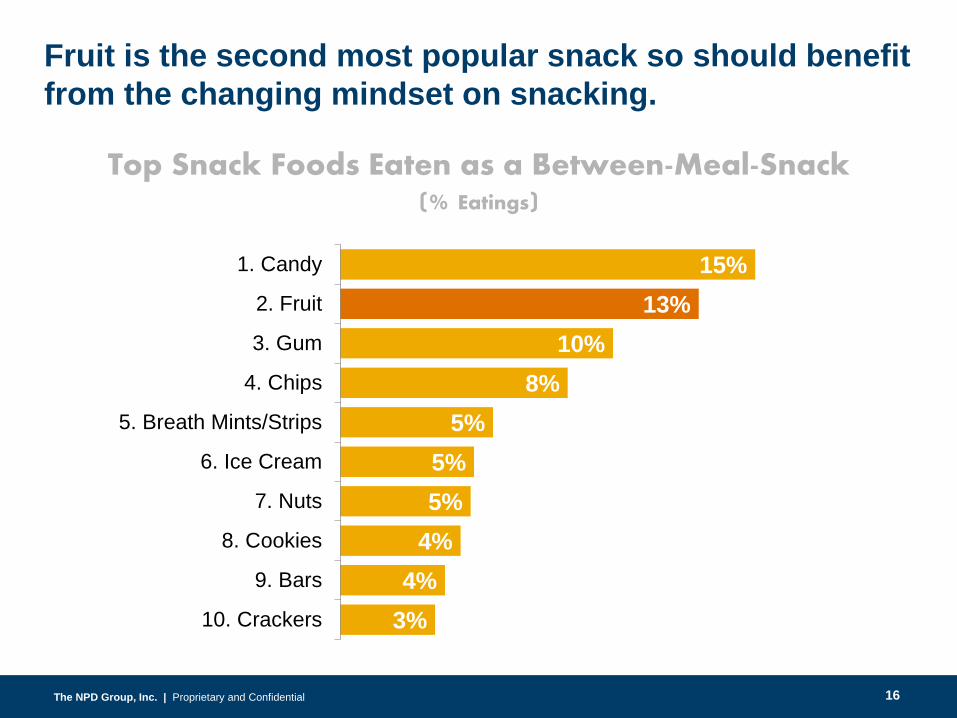
15%13%
10%8%
5%5%5%
4%4%
3%
1. Candy
2. Fruit
3. Gum
4. Chips
5. Breath Mints/Strips
6. Ice Cream
7. Nuts
8. Cookies
9. Bars
10. Crackers
Top Snack Foods Eaten as a Between-Meal-Snack(% Eatings)
Fruit is the second most popular snack so should benefit from the changing mindset on snacking.
16
The NPD Group, Inc. | Proprietary and ConfidentialThe NPD Group, Inc. | Proprietary and Confidential
250
270
290
310
330
350
370
390
410
430
'06 '07 '08 '09 '10 '11 '12 '13
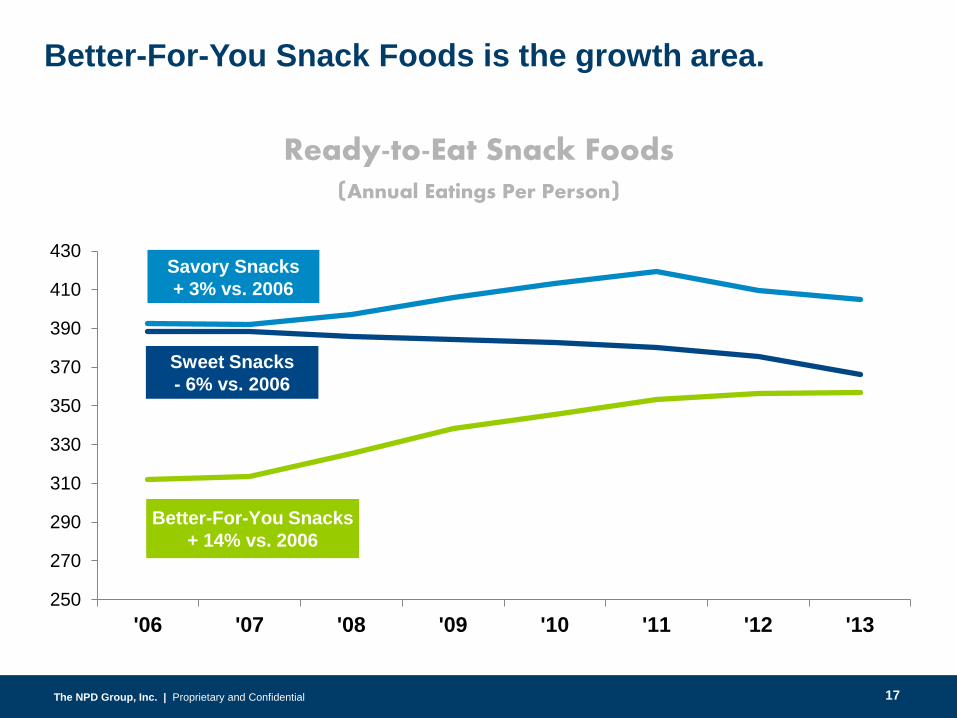
Better-For-You Snacks+ 14% vs. 2006
Sweet Snacks- 6% vs. 2006
Savory Snacks+ 3% vs. 2006
Better-For-You Snack Foods is the growth area.
Ready-to-Eat Snack Foods(Annual Eatings Per Person)
17
The NPD Group, Inc. | Proprietary and ConfidentialThe NPD Group, Inc. | Proprietary and ConfidentialThe NPD Group, Inc. | Proprietary and ConfidentialThe NPD Group, Inc. | Proprietary and Confidential
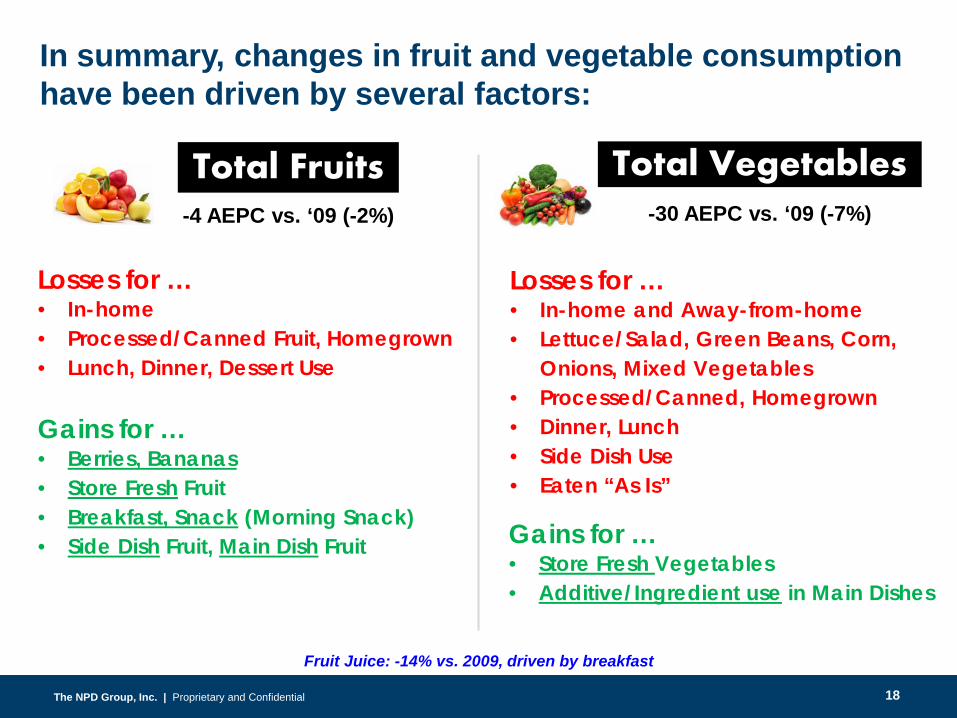
In summary, changes in fruit and vegetable consumption have been driven by several factors:
Losses for …• In-home • Processed/Canned Fruit, Homegrown• Lunch, Dinner, Dessert Use
Fruit Juice: -14% vs. 2009, driven by breakfast
-30 AEPC vs. ‘09 (-7%)-4 AEPC vs. ‘09 (-2%)
Losses for …• In-home and Away-from-home• Lettuce/Salad, Green Beans, Corn,
Onions, Mixed Vegetables• Processed/Canned, Homegrown• Dinner, Lunch• Side Dish Use• Eaten “As Is”
Total Fruits Total Vegetables
Gains for …• Berries, Bananas• Store Fresh Fruit• Breakfast, Snack (Morning Snack)• Side Dish Fruit, Main Dish Fruit Gains for …
• Store Fresh Vegetables• Additive/Ingredient use in Main Dishes
18

The NPD Group, Inc. | Proprietary and ConfidentialThe NPD Group, Inc. | Proprietary and Confidential
ConsumerDemographics
19
The NPD Group, Inc. | Proprietary and ConfidentialThe NPD Group, Inc. | Proprietary and ConfidentialThe NPD Group, Inc. | Proprietary and ConfidentialThe NPD Group, Inc. | Proprietary and Confidential
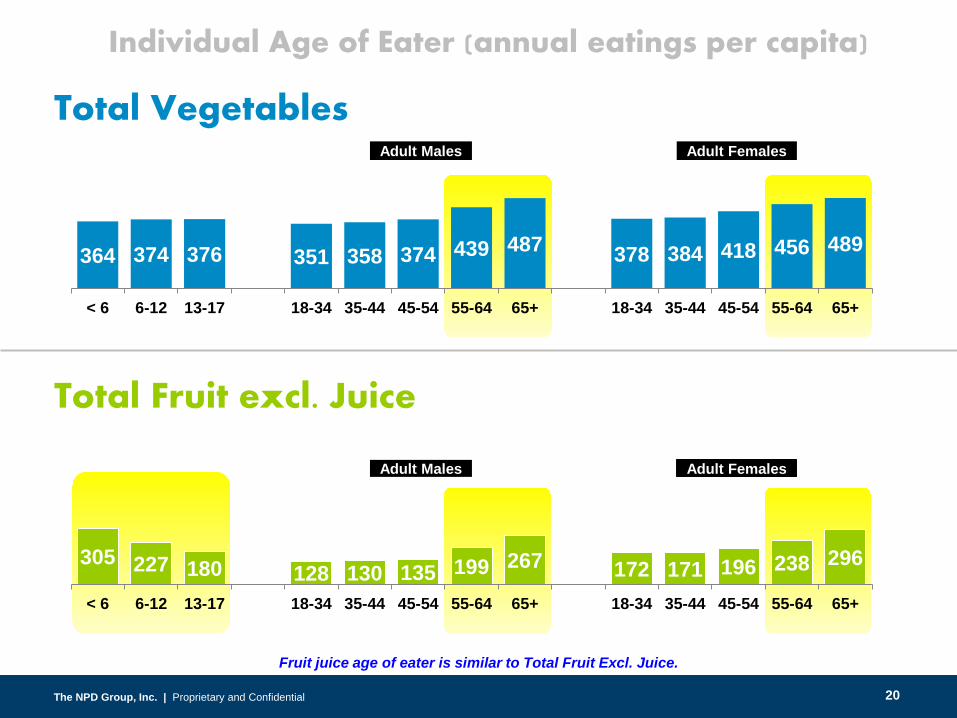
364 374 376 351 358 374 439 487 378 384 418 456 489
< 6 6-12 13-17 18-34 35-44 45-54 55-64 65+ 18-34 35-44 45-54 55-64 65+
Total Fruit excl. Juice
Total Vegetables
305 227 180 128 130 135 199 267 172 171 196 238 296
< 6 6-12 13-17 18-34 35-44 45-54 55-64 65+ 18-34 35-44 45-54 55-64 65+
Adult Males Adult Females
Adult Males Adult Females
Individual Age of Eater (annual eatings per capita)
Fruit juice age of eater is similar to Total Fruit Excl. Juice.
20
The NPD Group, Inc. | Proprietary and ConfidentialThe NPD Group, Inc. | Proprietary and ConfidentialThe NPD Group, Inc. | Proprietary and ConfidentialThe NPD Group, Inc. | Proprietary and Confidential
-80 -60 -40 -20 0
Females 65+
Females 55-64
Females 45-54
Females 35-44
Females 18-34
Males 65+
Males 55-64
Males 45-54
Males 35-44
Males 18-34
13-17
6-12
<6
Total Vegetables
-75 -50 -25 0 25 50
Females 65+
Females 55-64
Females 45-54
Females 35-44
Females 18-34
Males 65+
Males 55-64
Males 45-54
Males 35-44
Males 18-34
13-17
6-12
<6
Fruit Excl. Juice
-50 -25 0
Females 65+
Females 55-64
Females 45-54
Females 35-44
Females 18-34
Males 65+
Males 55-64
Males 45-54
Males 35-44
Males 18-34
13-17
6-12
<6
Fruit Juice
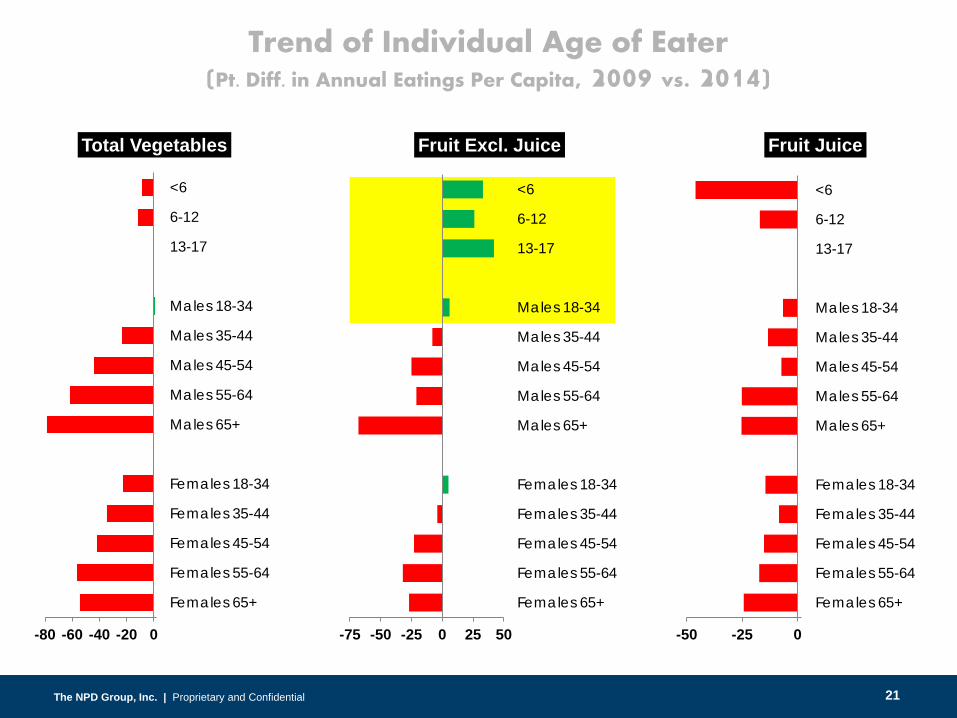
Trend of Individual Age of Eater(Pt. Diff. in Annual Eatings Per Capita, 2009 vs. 2014)
21
The NPD Group, Inc. | Proprietary and ConfidentialThe NPD Group, Inc. | Proprietary and ConfidentialThe NPD Group, Inc. | Proprietary and ConfidentialThe NPD Group, Inc. | Proprietary and Confidential
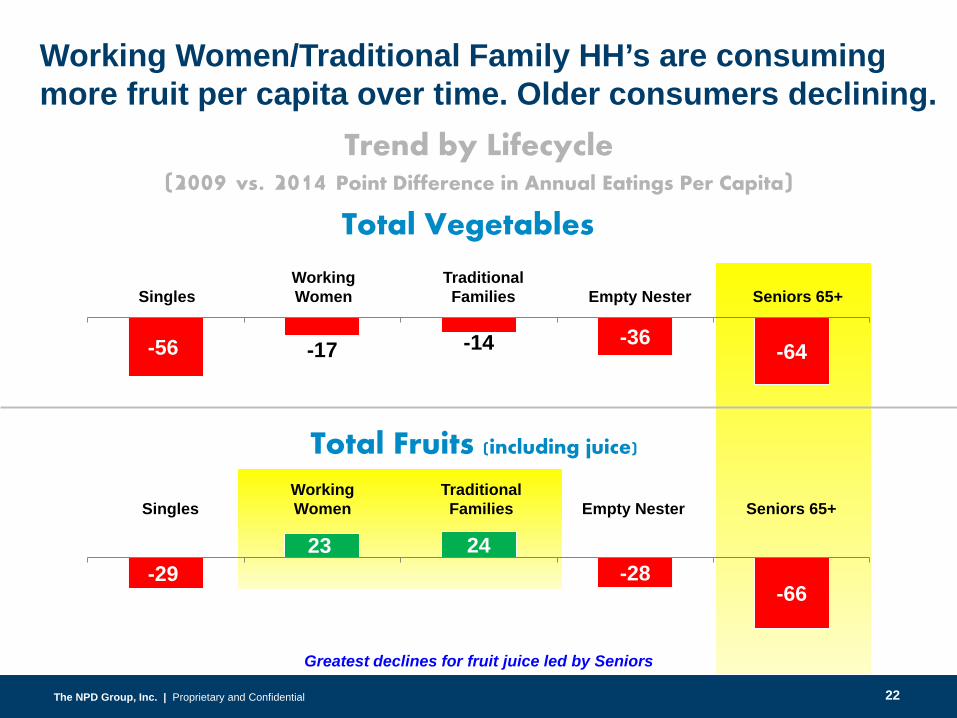
Total Fruits (including juice)
-56 -17 -14 -36 -64
SinglesWorking Women
Traditional Families Empty Nester Seniors 65+
Total Vegetables
SinglesWorking Women
Traditional Families Empty Nester Seniors 65+
-2923 24
-28-66
Trend by Lifecycle(2009 vs. 2014 Point Difference in Annual Eatings Per Capita)
Working Women/Traditional Family HH’s are consuming more fruit per capita over time. Older consumers declining.
Greatest declines for fruit juice led by Seniors
22
The NPD Group, Inc. | Proprietary and ConfidentialThe NPD Group, Inc. | Proprietary and ConfidentialThe NPD Group, Inc. | Proprietary and ConfidentialThe NPD Group, Inc. | Proprietary and Confidential
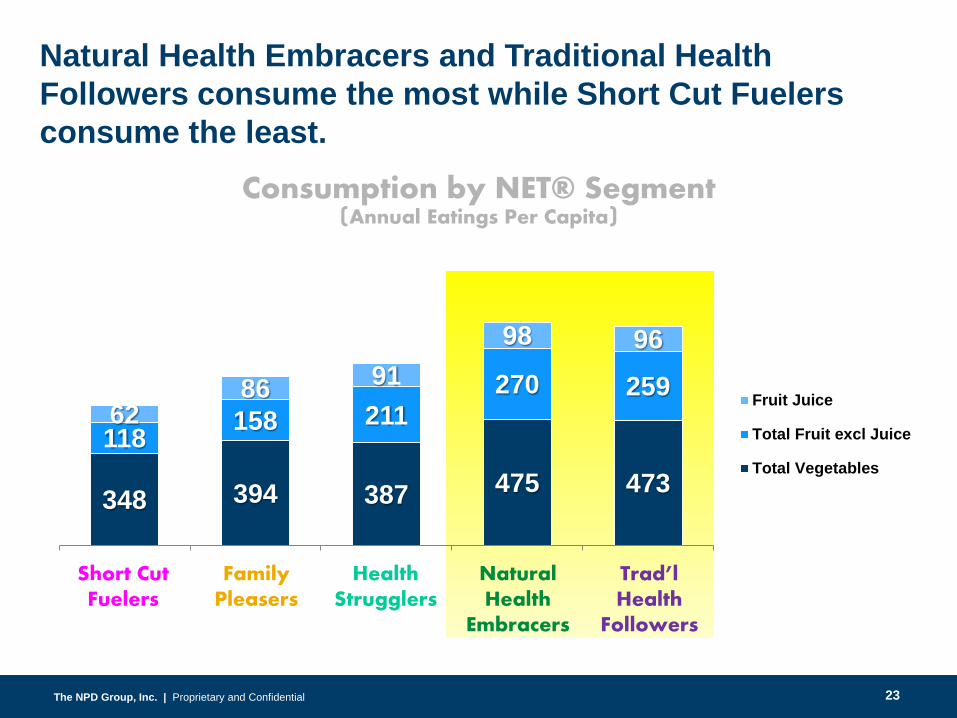
348 394 387 475 473118 158 211
270 25962
86 9198 96
Fruit Juice
Total Fruit excl Juice
Total Vegetables
Consumption by NET® Segment(Annual Eatings Per Capita)
Natural Health Embracers and Traditional Health Followers consume the most while Short Cut Fuelers consume the least.
Health Strugglers
Natural Health
Embracers
Trad’l Health
Followers
Family Pleasers
Short Cut Fuelers
23
The NPD Group, Inc. | Proprietary and ConfidentialThe NPD Group, Inc. | Proprietary and ConfidentialThe NPD Group, Inc. | Proprietary and ConfidentialThe NPD Group, Inc. | Proprietary and Confidential
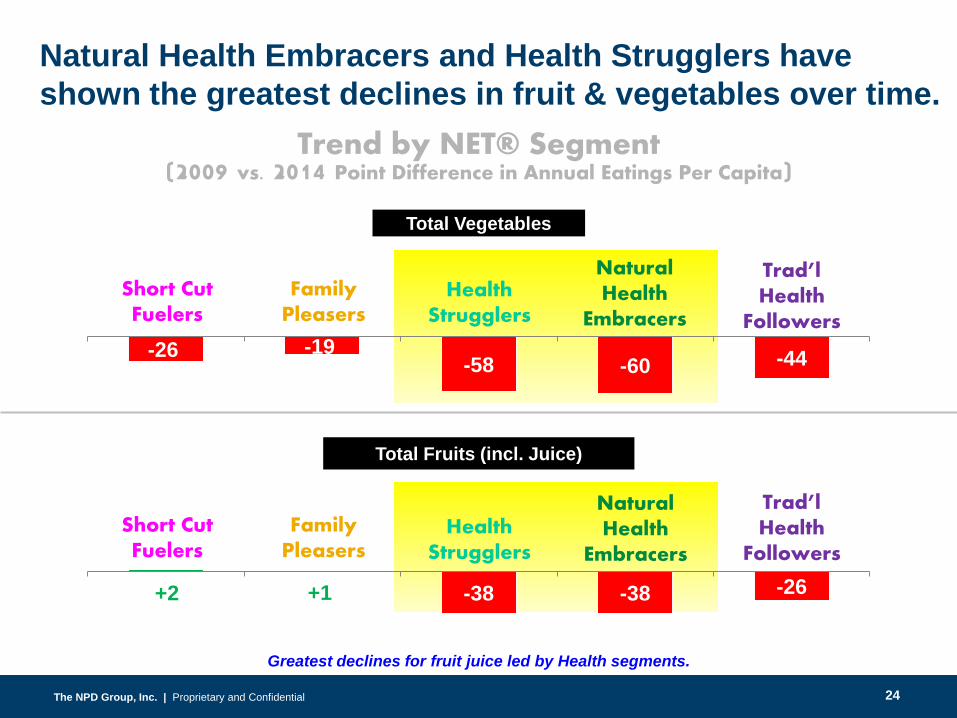
-26 -19-58 -60 -44
Total Vegetables
2 1 -38 -38 -26
Trend by NET® Segment(2009 vs. 2014 Point Difference in Annual Eatings Per Capita)
Natural Health Embracers and Health Strugglers have shown the greatest declines in fruit & vegetables over time.
Greatest declines for fruit juice led by Health segments.
Health Strugglers
Natural Health
Embracers
Trad’l Health
Followers
Family Pleasers
Short Cut Fuelers
Total Fruits (incl. Juice)
Health Strugglers
Natural Health
Embracers
Trad’l Health
FollowersFamily
PleasersShort Cut Fuelers
+2 +1
24

The NPD Group, Inc. | Proprietary and ConfidentialThe NPD Group, Inc. | Proprietary and Confidential
The Future of Fruits & Vegetables
25
The NPD Group, Inc. | Proprietary and ConfidentialThe NPD Group, Inc. | Proprietary and Confidential
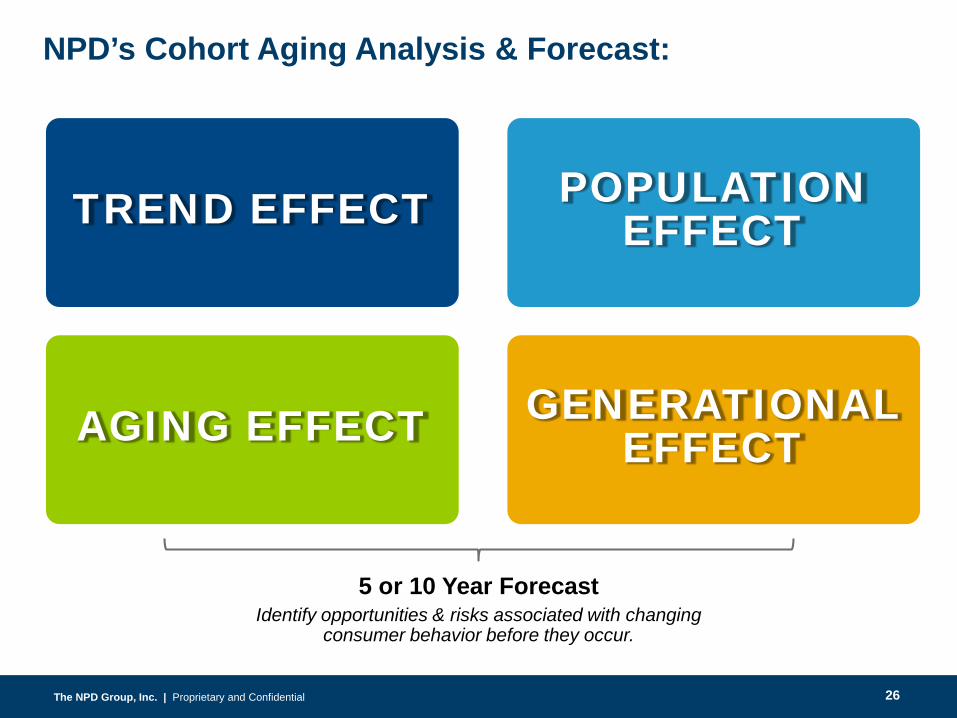
TREND EFFECT
NPD’s Cohort Aging Analysis & Forecast:
POPULATION EFFECT
AGING EFFECT GENERATIONAL EFFECT
5 or 10 Year ForecastIdentify opportunities & risks associated with changing
consumer behavior before they occur.
26
The NPD Group, Inc. | Proprietary and ConfidentialThe NPD Group, Inc. | Proprietary and Confidential
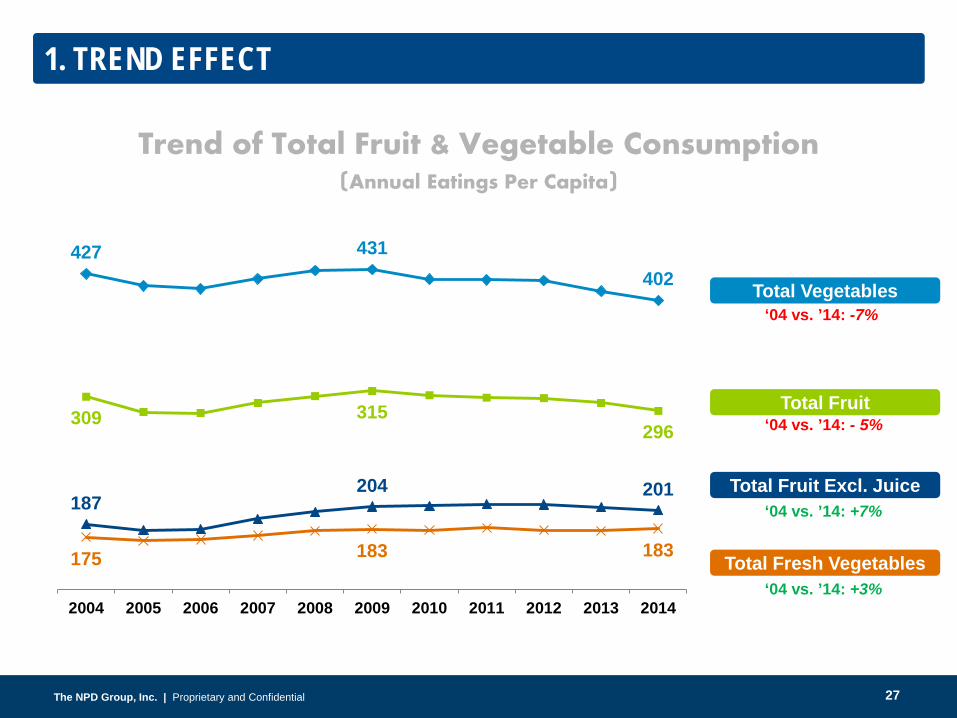
1. TREND EFFECT
427 431402
309 315296
187204 201
175 183 183
2004 2005 2006 2007 2008 2009 2010 2011 2012 2013 2014
Trend of Total Fruit & Vegetable Consumption(Annual Eatings Per Capita)
‘04 vs. ’14: -7%
‘04 vs. ’14: - 5%
‘04 vs. ’14: +7%
‘04 vs. ’14: +3%
Total Vegetables
Total Fruit
Total Fruit Excl. Juice
Total Fresh Vegetables
27
The NPD Group, Inc. | Proprietary and ConfidentialThe NPD Group, Inc. | Proprietary and Confidential
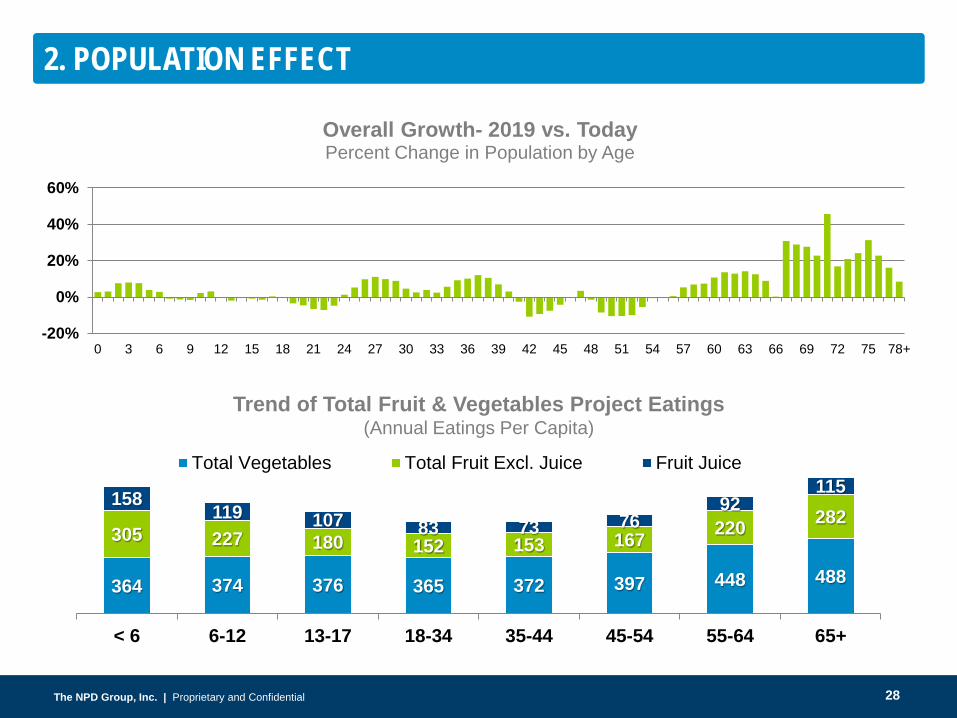
2. POPULATION EFFECT
364 374 376 365 372 397 448 488
305 227 180 152 153 167 220 282158 119 107 83 73 76
92115
< 6 6-12 13-17 18-34 35-44 45-54 55-64 65+
Total Vegetables Total Fruit Excl. Juice Fruit Juice
-20%
0%
20%
40%
60%
0 3 6 9 12 15 18 21 24 27 30 33 36 39 42 45 48 51 54 57 60 63 66 69 72 75 78+
Overall Growth- 2019 vs. TodayPercent Change in Population by Age
Trend of Total Fruit & Vegetables Project Eatings(Annual Eatings Per Capita)
28
The NPD Group, Inc. | Proprietary and ConfidentialThe NPD Group, Inc. | Proprietary and Confidential
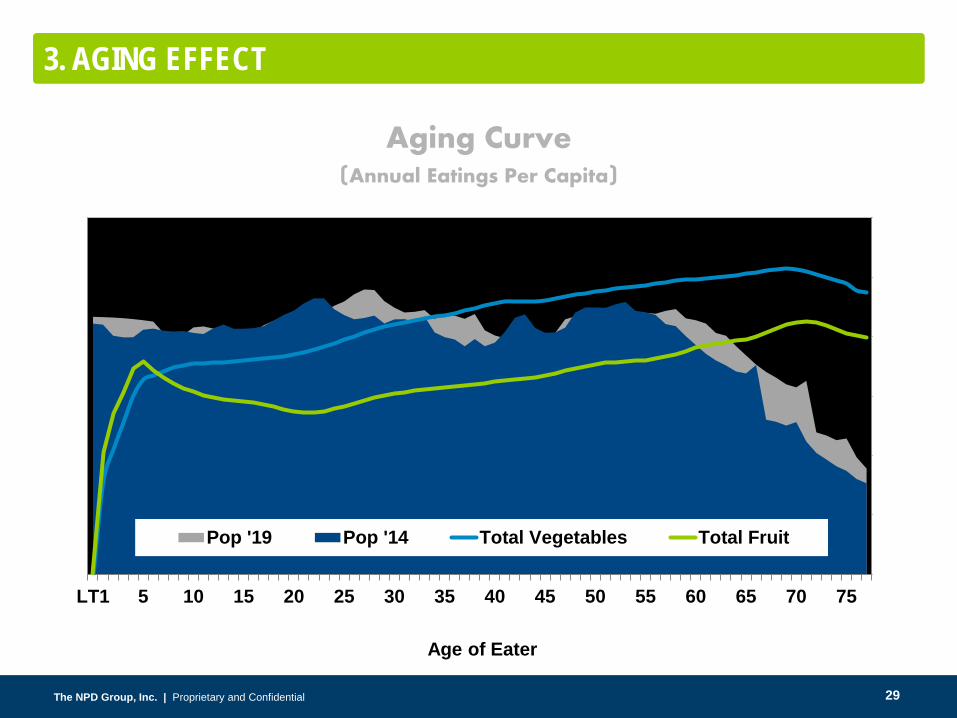
3. AGING EFFECT
Aging Curve(Annual Eatings Per Capita)
0.00
100.00
200.00
300.00
400.00
500.00
600.00
700.00
LT1 5 10 15 20 25 30 35 40 45 50 55 60 65 70 75 -
1,000,000
2,000,000
3,000,000
4,000,000
5,000,000
6,000,000
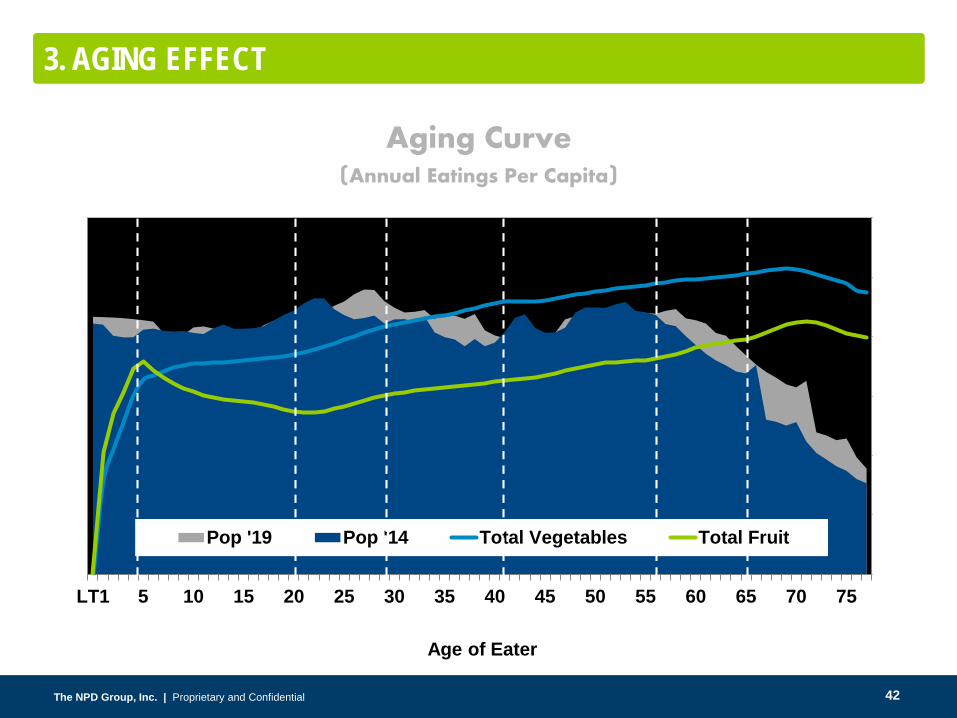
Age of Eater
Pop '19 Pop '14 Total Vegetables Total Fruit
29

The NPD Group, Inc. | Proprietary and ConfidentialThe NPD Group, Inc. | Proprietary and Confidential
0-9 10-19 20-29 30-39 40-49 50-59 60-69 70+
Total Fruits(AEPC Indexed to Total)
2004 2014
102 111 83 100 73 76 77 84 82 81 107 95 140 124 190 149
0-9 10-19 20-29 30-39 40-49 50-59 60-69 70+
Total Vegetables(AEPC Indexed to Total
2004 2014
67 75 88 95 84 92 92 97 104 98 117 108 138 122 147 124
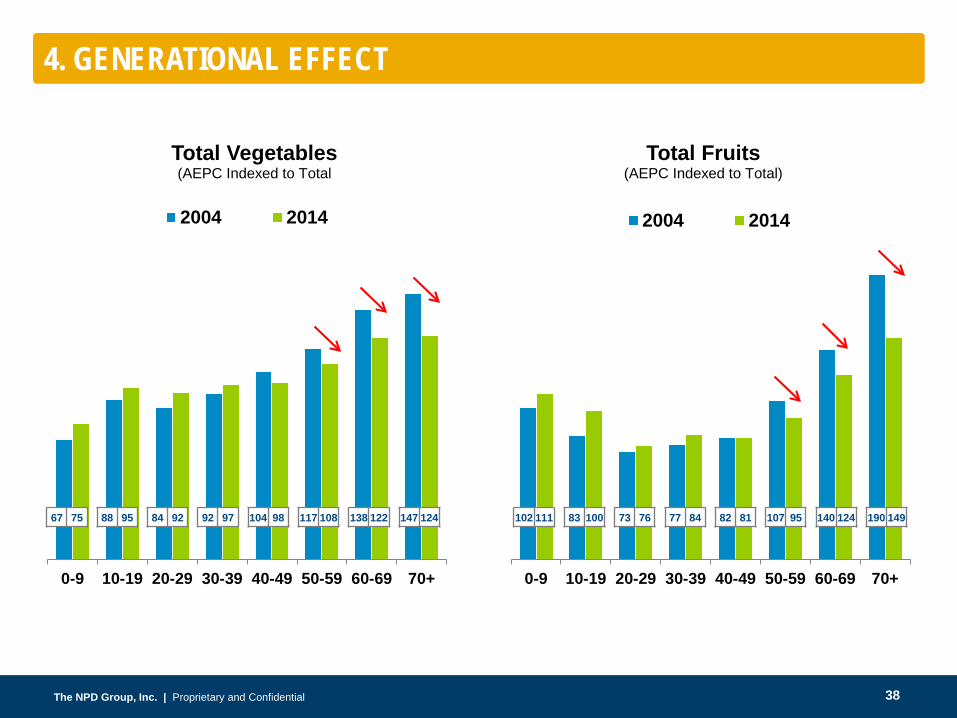
4. GENERATIONAL EFFECT
30
The NPD Group, Inc. | Proprietary and ConfidentialThe NPD Group, Inc. | Proprietary and Confidential
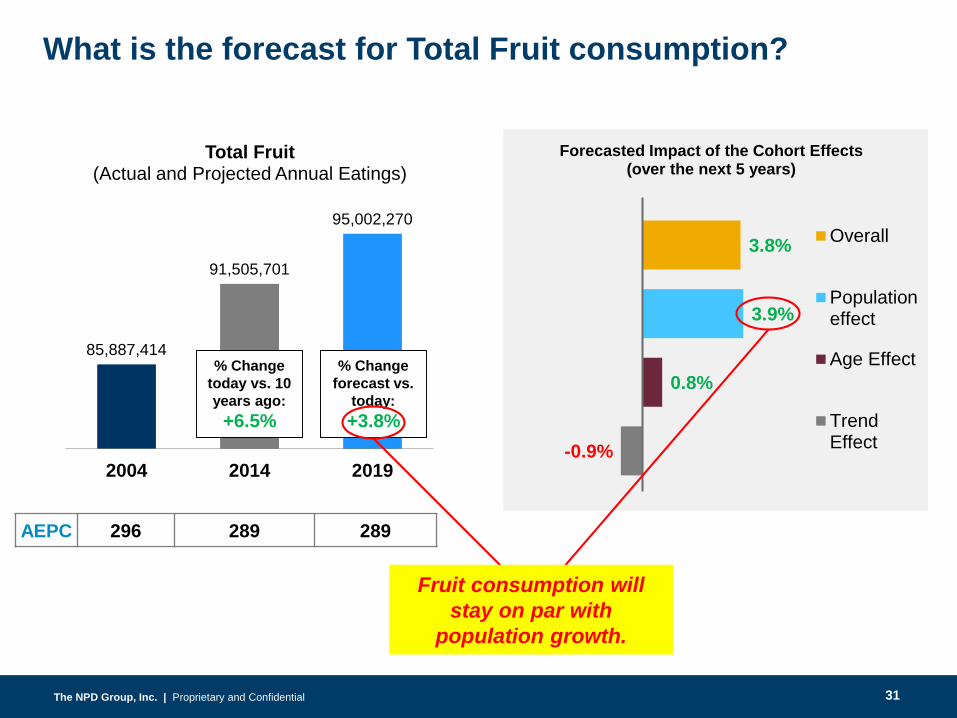
3.8%
3.9%
0.8%
-0.9%
Forecasted Impact of the Cohort Effects (over the next 5 years)
Overall
Populationeffect
Age Effect
TrendEffect
What is the forecast for Total Fruit consumption?
AEPC 296 289 289
85,887,414
91,505,701
95,002,270
2004 2014 2019
Total Fruit(Actual and Projected Annual Eatings)
% Change today vs. 10 years ago: +6.5%
% Change forecast vs.
today:+3.8%
Fruit consumption will stay on par with
population growth.
31
The NPD Group, Inc. | Proprietary and ConfidentialThe NPD Group, Inc. | Proprietary and Confidential
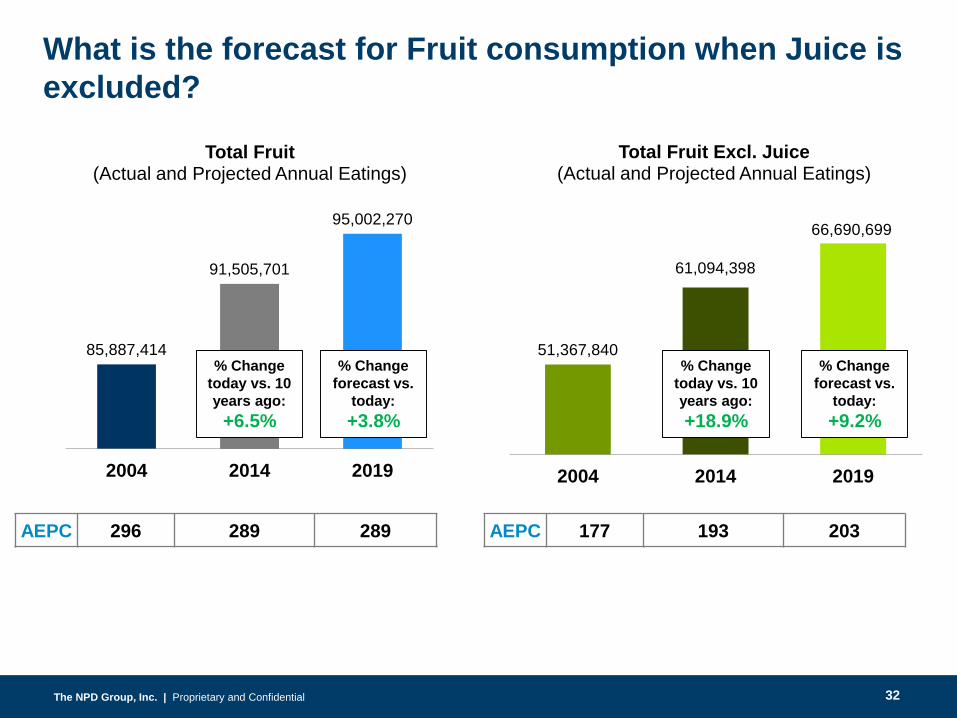
85,887,414
91,505,701
95,002,270
2004 2014 2019
Total Fruit(Actual and Projected Annual Eatings)
AEPC 296 289 289
% Change today vs. 10 years ago: +6.5%
% Change forecast vs.
today:+3.8%
What is the forecast for Fruit consumption when Juice is excluded?
51,367,840
61,094,398
66,690,699
2004 2014 2019
Total Fruit Excl. Juice(Actual and Projected Annual Eatings)
% Change today vs. 10 years ago: +18.9%
% Change forecast vs.
today:+9.2%
AEPC 177 193 203
32
The NPD Group, Inc. | Proprietary and ConfidentialThe NPD Group, Inc. | Proprietary and Confidential
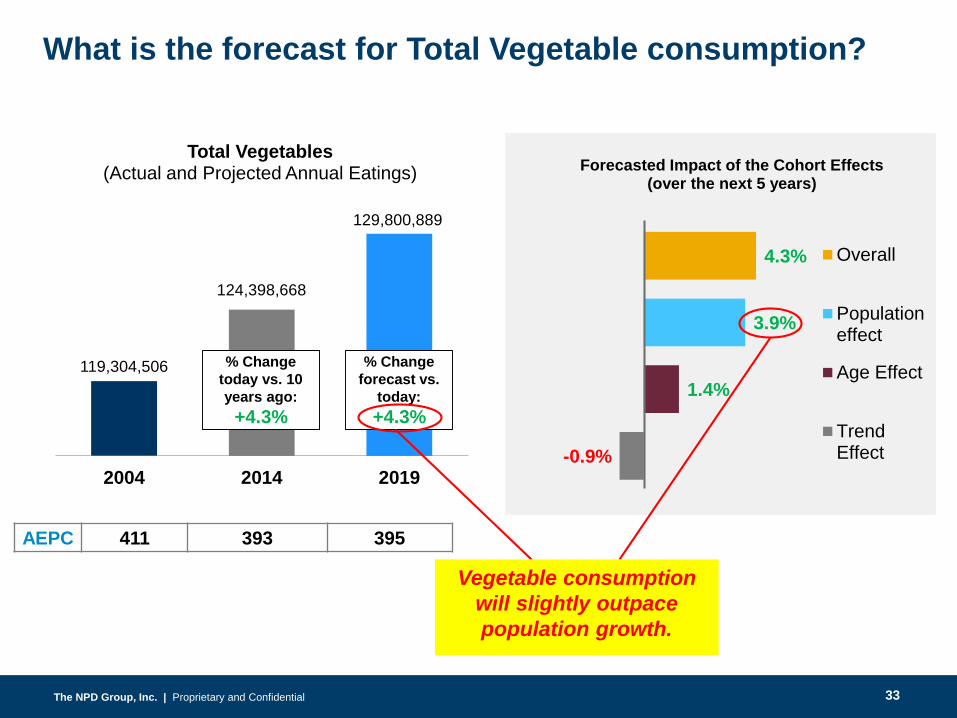
4.3%
3.9%
1.4%
-0.9%
Forecasted Impact of the Cohort Effects (over the next 5 years)
Overall
Populationeffect
Age Effect
TrendEffect
What is the forecast for Total Vegetable consumption?
AEPC 411 393 395
119,304,506
124,398,668
129,800,889
2004 2014 2019
Total Vegetables(Actual and Projected Annual Eatings)
% Change today vs. 10 years ago: +4.3%
% Change forecast vs.
today:+4.3%
Vegetable consumption will slightly outpace population growth.
33
The NPD Group, Inc. | Proprietary and ConfidentialThe NPD Group, Inc. | Proprietary and Confidential
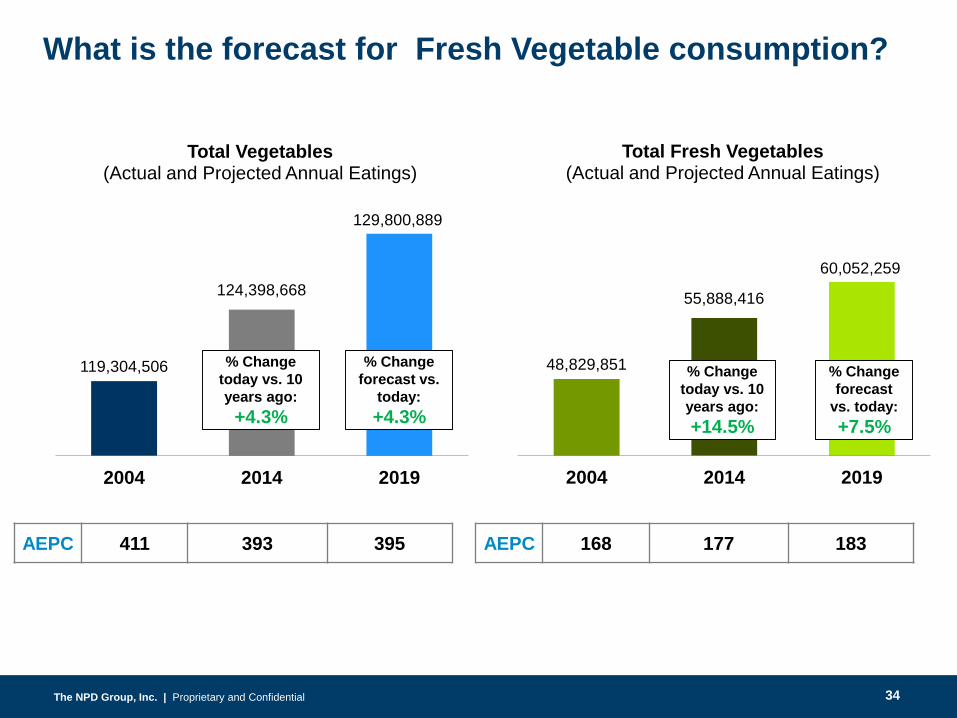
AEPC 411 393 395
119,304,506
124,398,668
129,800,889
2004 2014 2019
Total Vegetables(Actual and Projected Annual Eatings)
% Change today vs. 10 years ago: +4.3%
% Change forecast vs.
today:+4.3%
What is the forecast for Fresh Vegetable consumption?
48,829,851
55,888,416
60,052,259
2004 2014 2019
Total Fresh Vegetables(Actual and Projected Annual Eatings)
% Change today vs. 10 years ago: +14.5%
% Change forecast
vs. today:+7.5%
AEPC 168 177 183
34

The NPD Group, Inc. | Proprietary and ConfidentialThe NPD Group, Inc. | Proprietary and Confidential
What to Focus on Next
35
The NPD Group, Inc. | Proprietary and ConfidentialThe NPD Group, Inc. | Proprietary and Confidential
What to focus on next:
1. Reposition Fruits & Vegetables
2. Extend Partnerships
3. Remember Pricing Strengths
4. Advance Away-From-Home Opportunities
36
The NPD Group, Inc. | Proprietary and ConfidentialThe NPD Group, Inc. | Proprietary and ConfidentialThe NPD Group, Inc. | Proprietary and ConfidentialThe NPD Group, Inc. | Proprietary and Confidential
Reposition Fruits and Vegetables
Your core essence regarding health
has lost meaning in the world of health.
1.
37
The NPD Group, Inc. | Proprietary and ConfidentialThe NPD Group, Inc. | Proprietary and Confidential
0-9 10-19 20-29 30-39 40-49 50-59 60-69 70+
Total Fruits(AEPC Indexed to Total)
2004 2014
102 111 83 100 73 76 77 84 82 81 107 95 140 124 190 149
0-9 10-19 20-29 30-39 40-49 50-59 60-69 70+
Total Vegetables(AEPC Indexed to Total
2004 2014
67 75 88 95 84 92 92 97 104 98 117 108 138 122 147 124
4. GENERATIONAL EFFECT
38
The NPD Group, Inc. | Proprietary and ConfidentialThe NPD Group, Inc. | Proprietary and ConfidentialThe NPD Group, Inc. | Proprietary and ConfidentialThe NPD Group, Inc. | Proprietary and Confidential
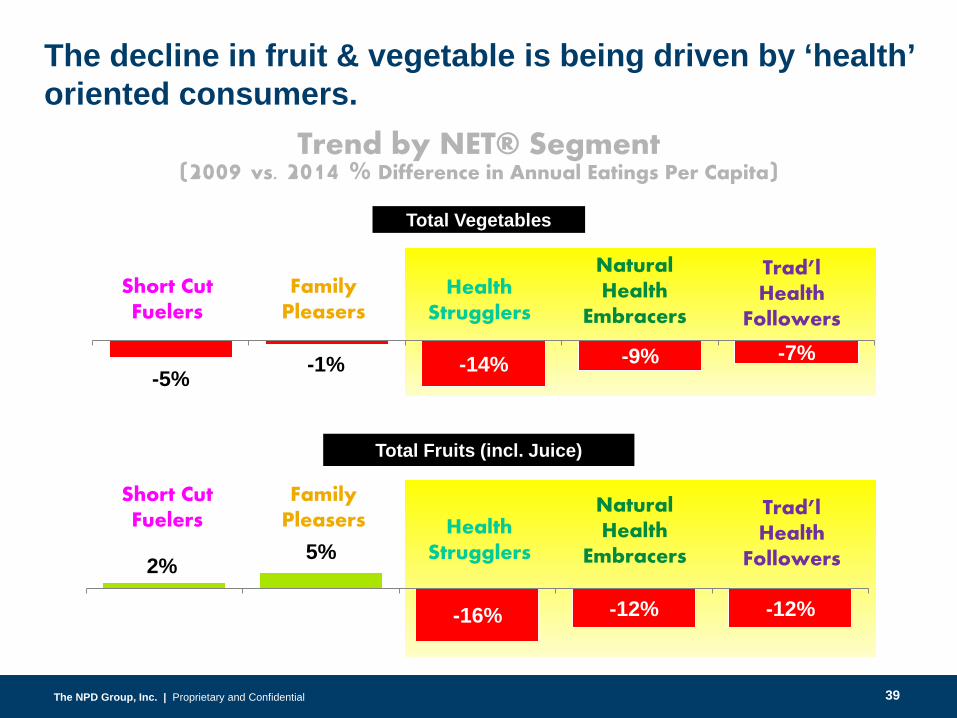
The decline in fruit & vegetable is being driven by ‘health’ oriented consumers.
2% 5%
-16% -12% -12%
-5% -1% -14% -9% -7%
Trend by NET® Segment(2009 vs. 2014 % Difference in Annual Eatings Per Capita)
Health Strugglers
Natural Health
Embracers
Trad’l Health
Followers
Family Pleasers
Short Cut Fuelers
Health Strugglers
Natural Health
Embracers
Trad’l Health
Followers
Family Pleasers
Short Cut Fuelers
Total Vegetables
Total Fruits (incl. Juice)
39
The NPD Group, Inc. | Proprietary and ConfidentialThe NPD Group, Inc. | Proprietary and ConfidentialThe NPD Group, Inc. | Proprietary and ConfidentialThe NPD Group, Inc. | Proprietary and Confidential
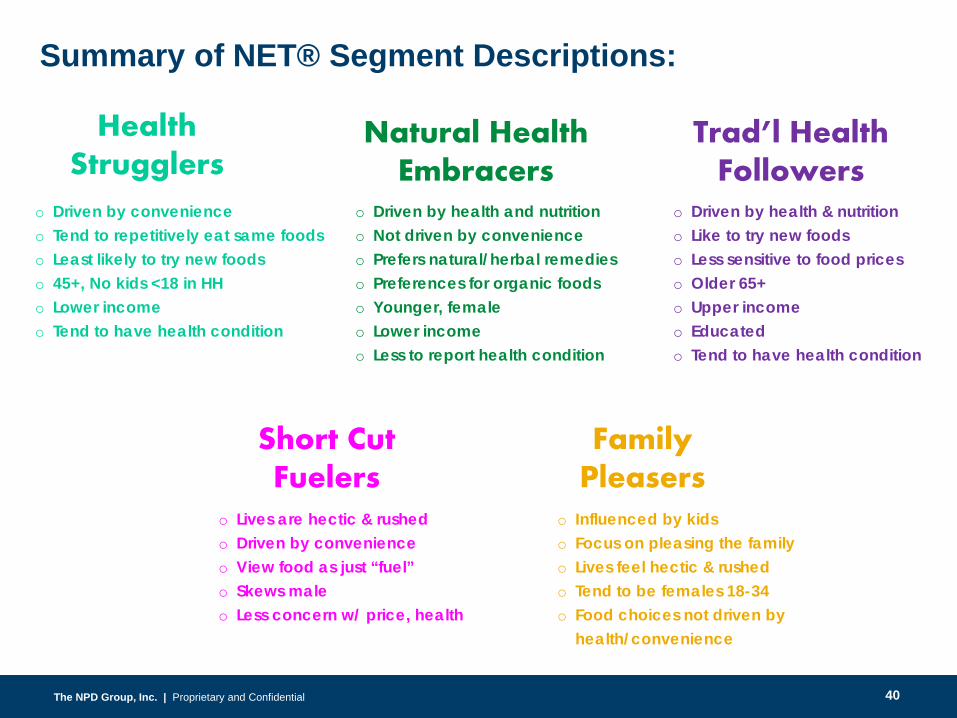
Summary of NET® Segment Descriptions:
o Driven by convenienceo Tend to repetitively eat same foodso Least likely to try new foodso 45+, No kids <18 in HHo Lower incomeo Tend to have health condition
Health Strugglers
o Driven by health and nutritiono Not driven by convenienceo Prefers natural/herbal remedieso Preferences for organic foodso Younger, femaleo Lower incomeo Less to report health condition
Natural Health Embracers
o Driven by health & nutritiono Like to try new foodso Less sensitive to food priceso Older 65+o Upper incomeo Educated o Tend to have health condition
Trad’l Health Followers
Short Cut Fuelers
o Lives are hectic & rushedo Driven by convenienceo View food as just “fuel”o Skews maleo Less concern w/ price, health
Family Pleasers
o Influenced by kidso Focus on pleasing the familyo Lives feel hectic & rushedo Tend to be females 18-34o Food choices not driven by
health/convenience
40
The NPD Group, Inc. | Proprietary and ConfidentialThe NPD Group, Inc. | Proprietary and ConfidentialThe NPD Group, Inc. | Proprietary and ConfidentialThe NPD Group, Inc. | Proprietary and Confidential
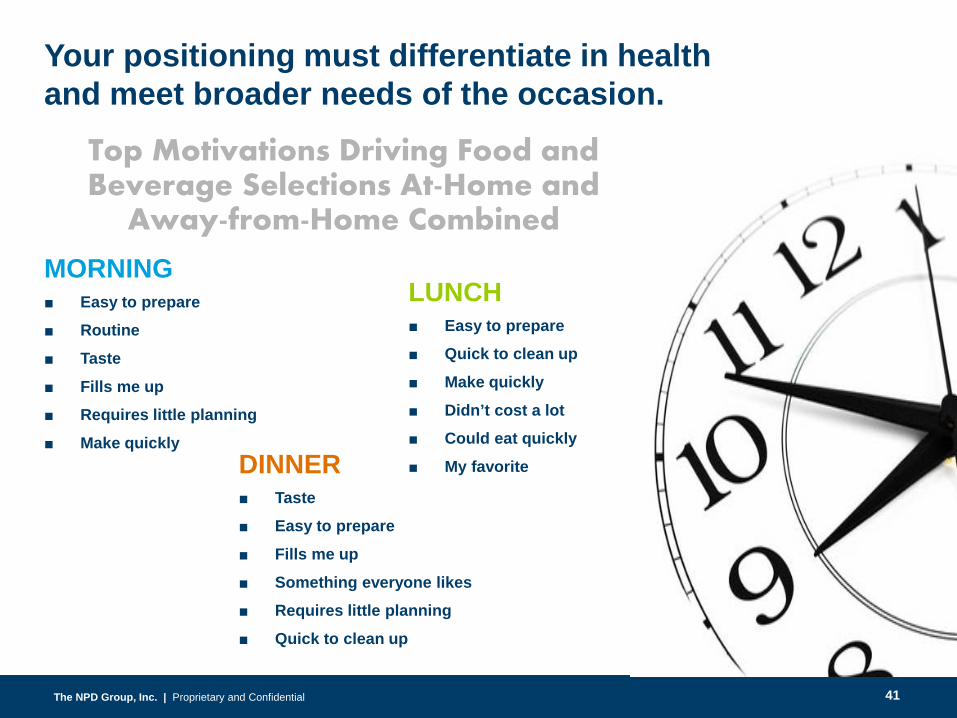
LUNCH■ Easy to prepare ■ Quick to clean up■ Make quickly■ Didn’t cost a lot■ Could eat quickly■ My favoriteDINNER
■ Taste■ Easy to prepare■ Fills me up■ Something everyone likes■ Requires little planning■ Quick to clean up
MORNING■ Easy to prepare■ Routine■ Taste■ Fills me up■ Requires little planning■ Make quickly
Top Motivations Driving Food and Beverage Selections At-Home and
Away-from-Home Combined
Your positioning must differentiate in health and meet broader needs of the occasion.
41
The NPD Group, Inc. | Proprietary and ConfidentialThe NPD Group, Inc. | Proprietary and Confidential
3. AGING EFFECT
Aging Curve(Annual Eatings Per Capita)
0.00
100.00
200.00
300.00
400.00
500.00
600.00
700.00
LT1 5 10 15 20 25 30 35 40 45 50 55 60 65 70 75 -
1,000,000
2,000,000
3,000,000
4,000,000
5,000,000
6,000,000
Age of Eater
Pop '19 Pop '14 Total Vegetables Total Fruit
42

The NPD Group, Inc. | Proprietary and ConfidentialThe NPD Group, Inc. | Proprietary and Confidential
DRIVER BARRIERTRUTH
I wish…I hate...
The NPD Group, Inc. | Proprietary and ConfidentialThe NPD Group, Inc. | Proprietary and ConfidentialThe NPD Group, Inc. | Proprietary and ConfidentialThe NPD Group, Inc. | Proprietary and Confidential
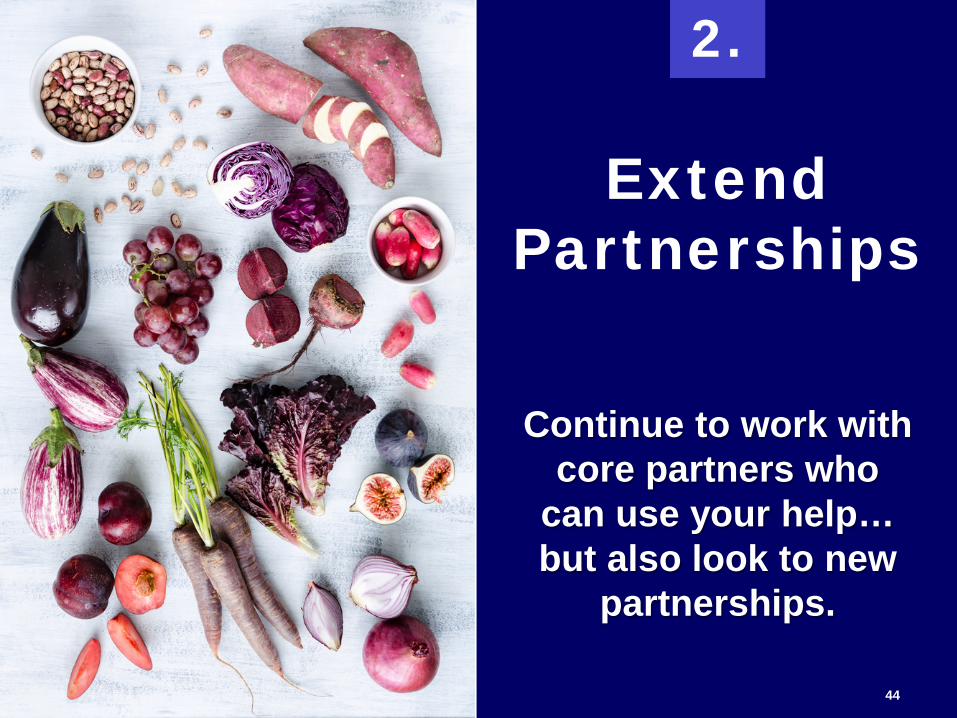
Extend Partnerships
Continue to work with core partners who
can use your help… but also look to new
partnerships.
2.
44
The NPD Group, Inc. | Proprietary and ConfidentialThe NPD Group, Inc. | Proprietary and ConfidentialThe NPD Group, Inc. | Proprietary and ConfidentialThe NPD Group, Inc. | Proprietary and Confidential
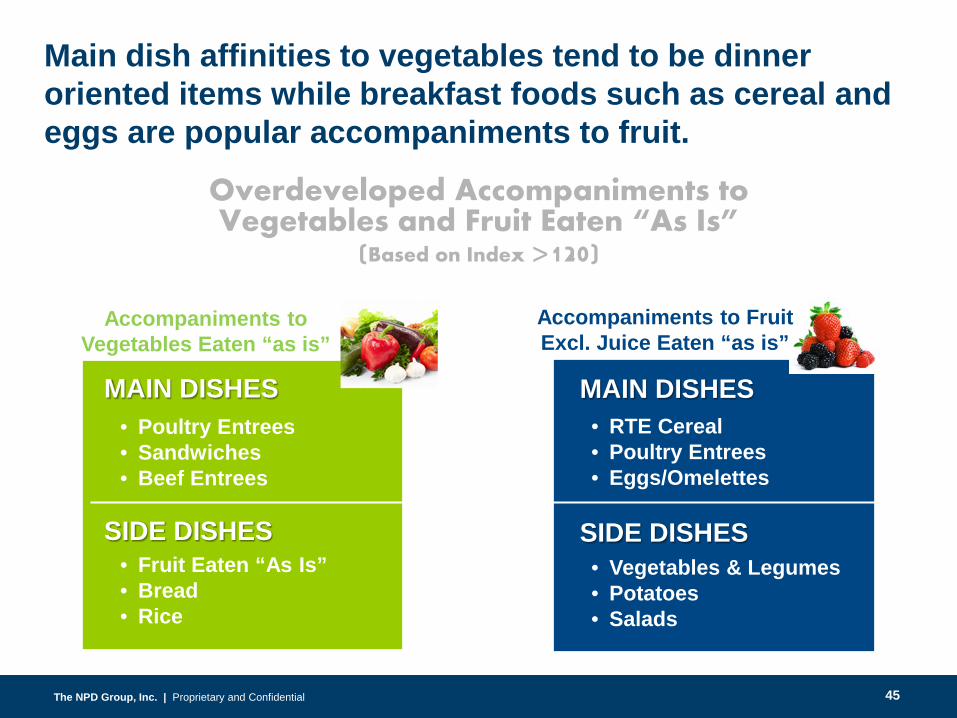
• Poultry Entrees• Sandwiches• Beef Entrees
• Fruit Eaten “As Is”• Bread• Rice
• RTE Cereal• Poultry Entrees• Eggs/Omelettes
• Vegetables & Legumes• Potatoes• Salads
MAIN DISHES
SIDE DISHES
MAIN DISHES
SIDE DISHES
Accompaniments to Vegetables Eaten “as is”
Accompaniments to Fruit Excl. Juice Eaten “as is”
Overdeveloped Accompaniments to Vegetables and Fruit Eaten “As Is”
(Based on Index >120)
Main dish affinities to vegetables tend to be dinner oriented items while breakfast foods such as cereal and eggs are popular accompaniments to fruit.
45
The NPD Group, Inc. | Proprietary and ConfidentialThe NPD Group, Inc. | Proprietary and ConfidentialThe NPD Group, Inc. | Proprietary and ConfidentialThe NPD Group, Inc. | Proprietary and Confidential
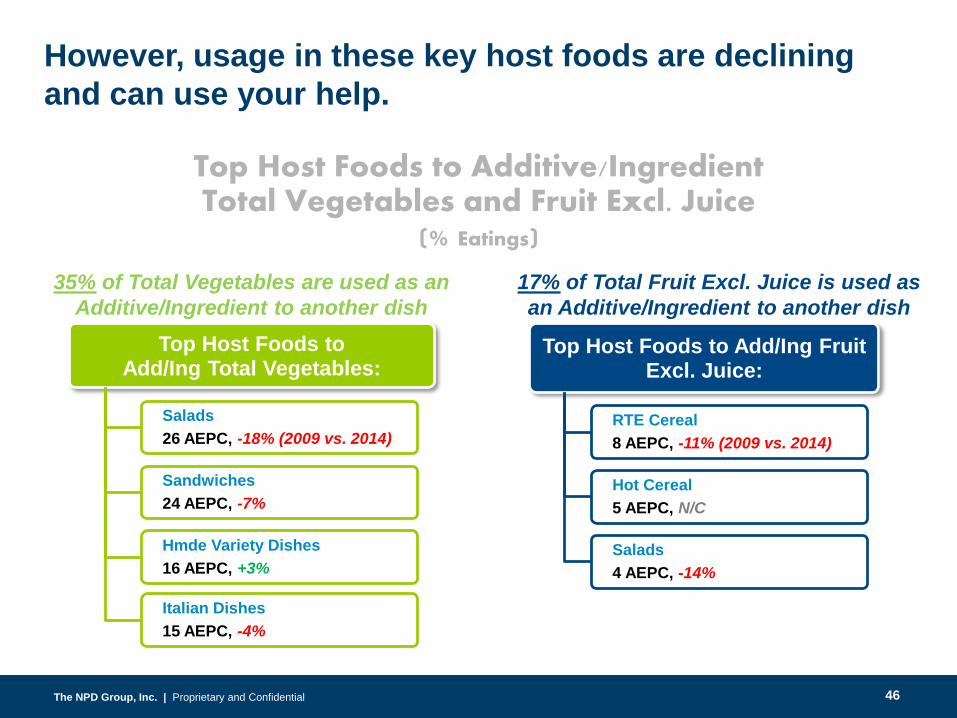
Top Host Foods to Add/Ing Total Vegetables:
Salads26 AEPC, -18% (2009 vs. 2014)
Sandwiches24 AEPC, -7%
Hmde Variety Dishes16 AEPC, +3%
Italian Dishes15 AEPC, -4%
Top Host Foods to Add/Ing Fruit Excl. Juice:
RTE Cereal8 AEPC, -11% (2009 vs. 2014)
Hot Cereal5 AEPC, N/C
Salads4 AEPC, -14%
Top Host Foods to Additive/Ingredient Total Vegetables and Fruit Excl. Juice
(% Eatings)35% of Total Vegetables are used as an
Additive/Ingredient to another dish17% of Total Fruit Excl. Juice is used as an Additive/Ingredient to another dish
However, usage in these key host foods are declining and can use your help.
46
The NPD Group, Inc. | Proprietary and ConfidentialThe NPD Group, Inc. | Proprietary and Confidential
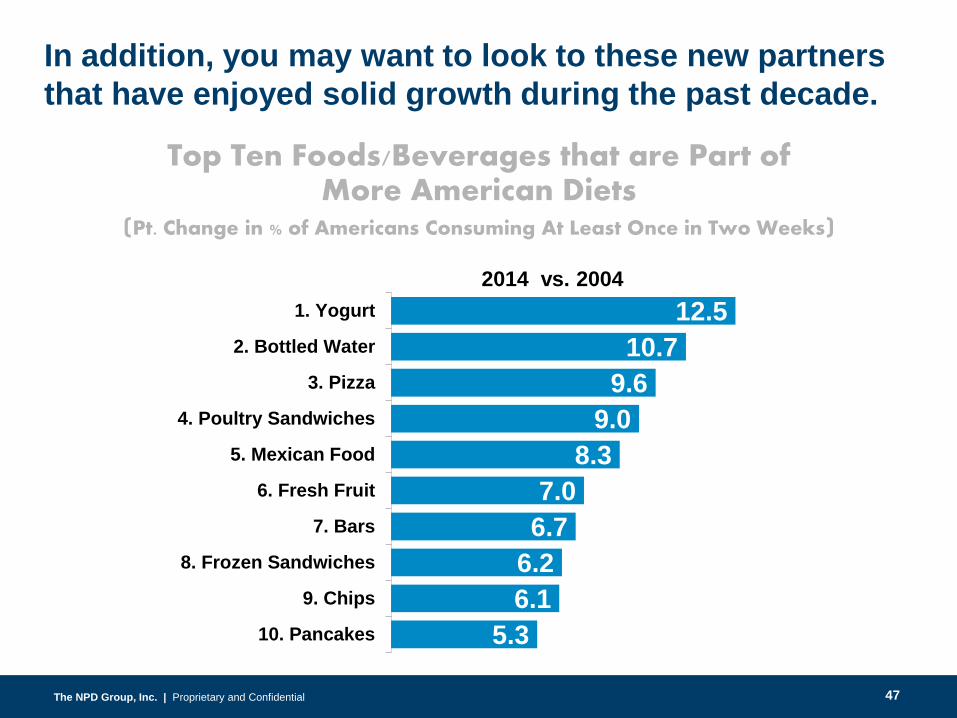
12.510.7
9.69.0
8.37.0
6.76.26.1
5.3
1. Yogurt
2. Bottled Water
3. Pizza
4. Poultry Sandwiches
5. Mexican Food
6. Fresh Fruit
7. Bars
8. Frozen Sandwiches
9. Chips
10. Pancakes
Top Ten Foods/Beverages that are Part ofMore American Diets
(Pt. Change in % of Americans Consuming At Least Once in Two Weeks)
And while our diet changes slowly, there are shifts happening.In addition, you may want to look to these new partners that have enjoyed solid growth during the past decade.
2014 vs. 2004
47
The NPD Group, Inc. | Proprietary and ConfidentialThe NPD Group, Inc. | Proprietary and ConfidentialThe NPD Group, Inc. | Proprietary and ConfidentialThe NPD Group, Inc. | Proprietary and Confidential
Remember Your Pricing Strengths
Think broader about your pricing
decisions.
3.
48
The NPD Group, Inc. | Proprietary and ConfidentialThe NPD Group, Inc. | Proprietary and ConfidentialThe NPD Group, Inc. | Proprietary and ConfidentialThe NPD Group, Inc. | Proprietary and Confidential
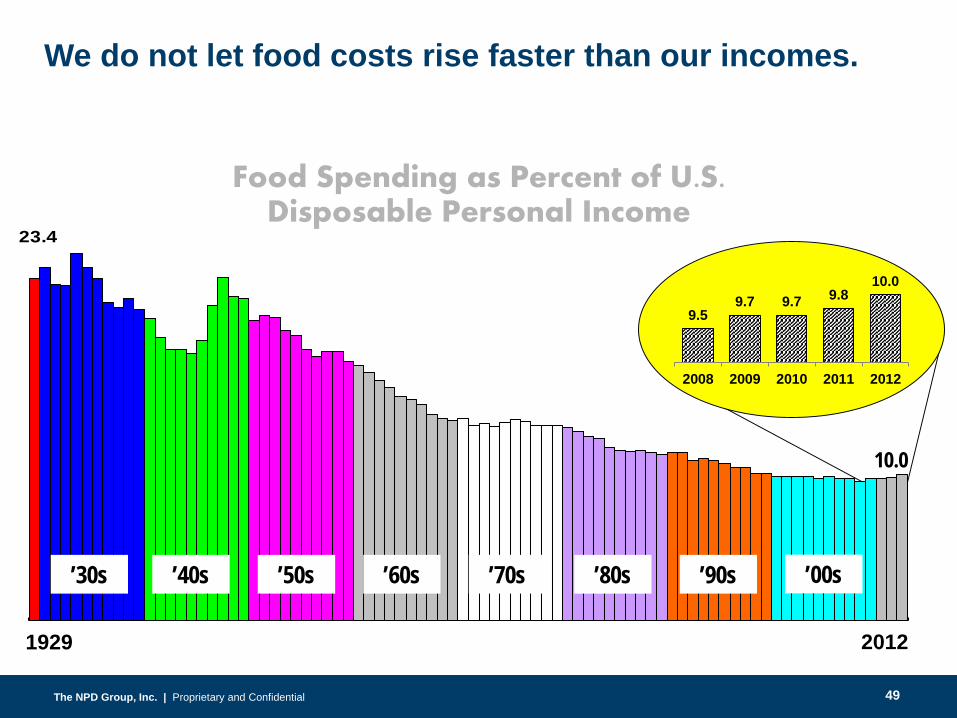
23.4
’30s ’40s ’50s ’60s ’70s ’80s ’90s
1929 2012
Food Spending as Percent of U.S. Disposable Personal Income
’00s
10.0
We do not let food costs rise faster than our incomes.
9.59.7 9.7 9.8
10.0
2008 2009 2010 2011 2012
49
The NPD Group, Inc. | Proprietary and ConfidentialThe NPD Group, Inc. | Proprietary and ConfidentialThe NPD Group, Inc. | Proprietary and ConfidentialThe NPD Group, Inc. | Proprietary and Confidential
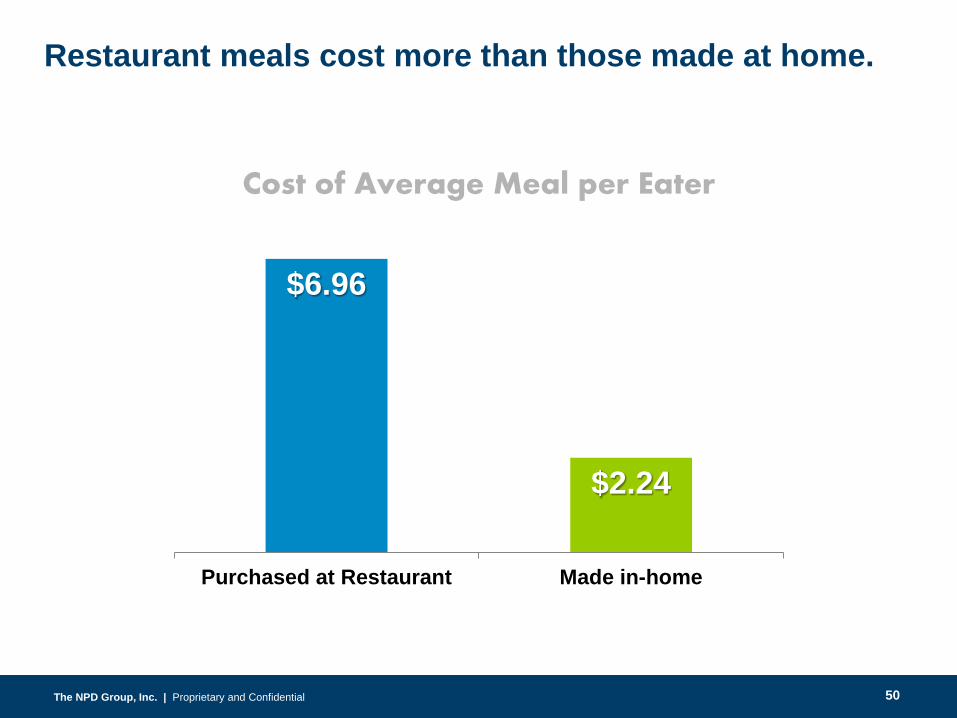
Cost of Average Meal per Eater
Restaurant meals cost more than those made at home.
$6.96
$2.24
Purchased at Restaurant Made in-home
50
The NPD Group, Inc. | Proprietary and ConfidentialThe NPD Group, Inc. | Proprietary and ConfidentialThe NPD Group, Inc. | Proprietary and ConfidentialThe NPD Group, Inc. | Proprietary and Confidential
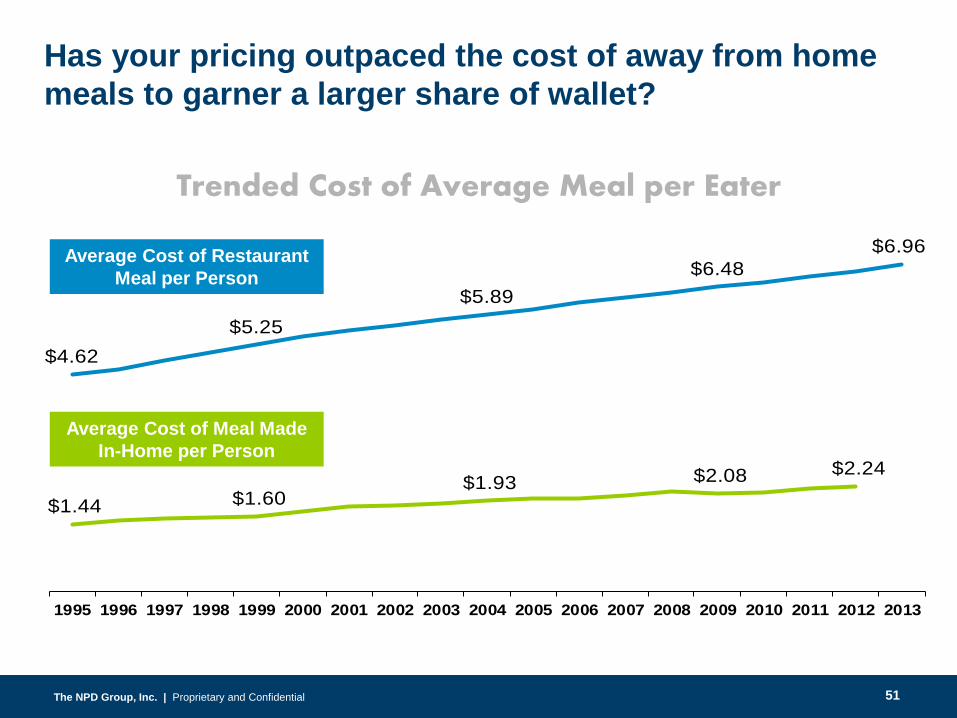
$4.62$5.25
$5.89$6.48
$6.96
$1.44 $1.60 $1.93 $2.08 $2.24
1995 1996 1997 1998 1999 2000 2001 2002 2003 2004 2005 2006 2007 2008 2009 2010 2011 2012 2013
Average Cost of Restaurant Meal per Person
Average Cost of Meal Made In-Home per Person
Trended Cost of Average Meal per Eater
Has your pricing outpaced the cost of away from home meals to garner a larger share of wallet?
51
The NPD Group, Inc. | Proprietary and ConfidentialThe NPD Group, Inc. | Proprietary and ConfidentialThe NPD Group, Inc. | Proprietary and ConfidentialThe NPD Group, Inc. | Proprietary and Confidential
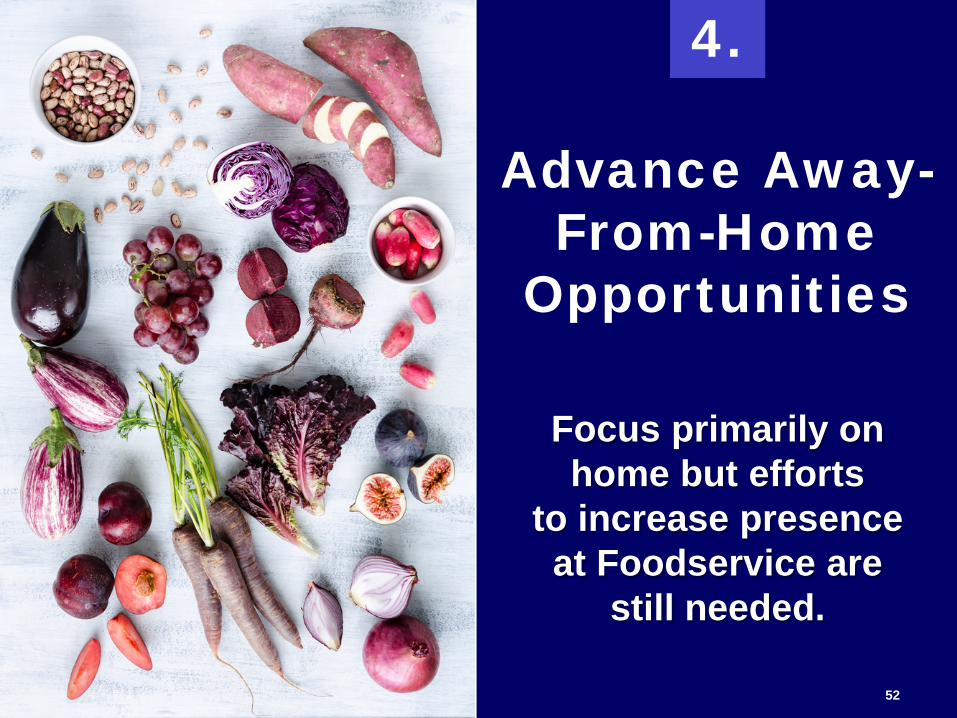
Advance Away-From-Home
Opportunities
Focus primarily on home but efforts
to increase presence at Foodservice are
still needed.
4.
52
The NPD Group, Inc. | Proprietary and ConfidentialThe NPD Group, Inc. | Proprietary and ConfidentialThe NPD Group, Inc. | Proprietary and ConfidentialThe NPD Group, Inc. | Proprietary and Confidential
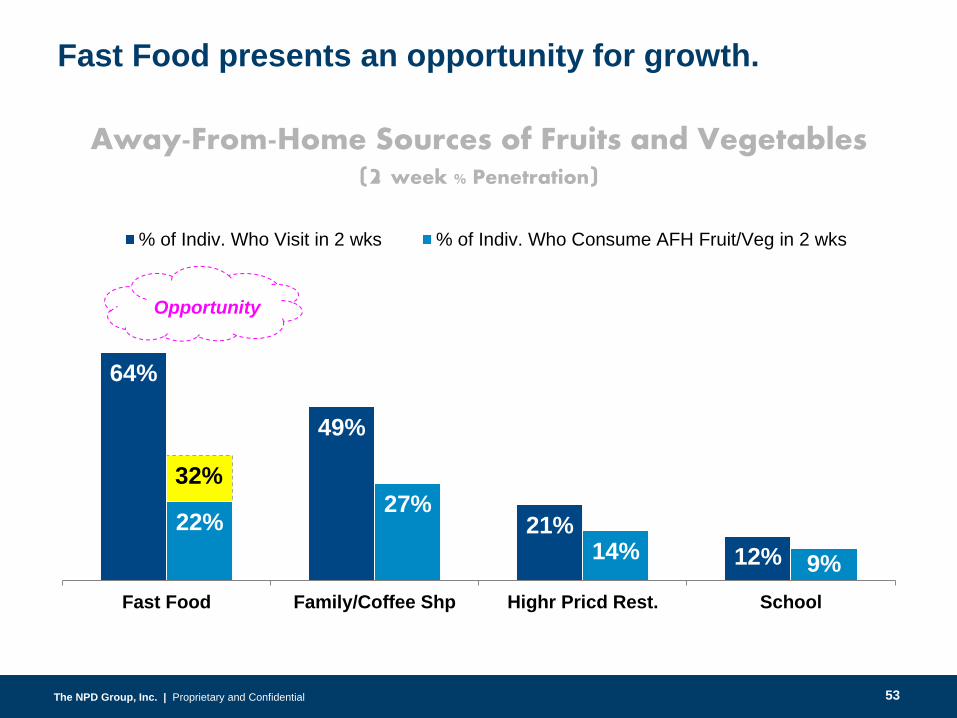
32%
64%
49%
21%12%
22%27%
14% 9%Fast Food Family/Coffee Shp Highr Pricd Rest. School
% of Indiv. Who Visit in 2 wks % of Indiv. Who Consume AFH Fruit/Veg in 2 wks
Away-From-Home Sources of Fruits and Vegetables(2 week % Penetration)
Fast Food presents an opportunity for growth.
Opportunity
53
The NPD Group, Inc. | Proprietary and ConfidentialThe NPD Group, Inc. | Proprietary and Confidential
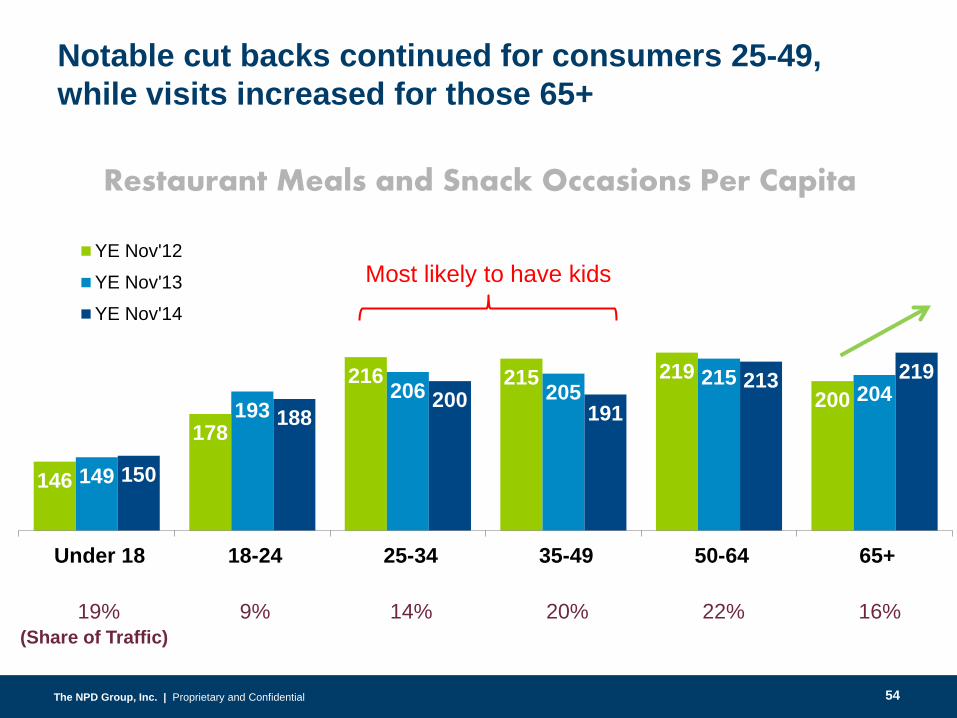
(Share of Traffic)19% 9% 14% 20% 22% 16%
Most likely to have kids
Notable cut backs continued for consumers 25-49, while visits increased for those 65+
146
178
216 215 219200
149
193206 205 215
204
150
188200 191
213 219
Under 18 18-24 25-34 35-49 50-64 65+
YE Nov'12YE Nov'13YE Nov'14
Restaurant Meals and Snack Occasions Per Capita
54
The NPD Group, Inc. | Proprietary and ConfidentialThe NPD Group, Inc. | Proprietary and Confidential
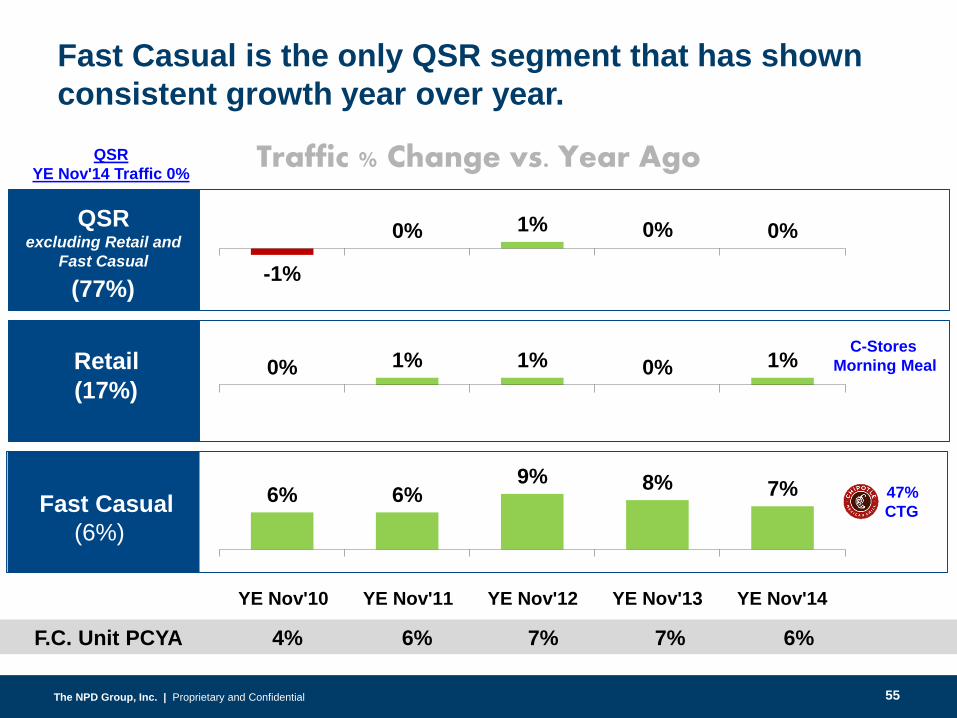
6% 6%9% 8% 7%
QSRYE Nov'14 Traffic 0%
YE Nov'10 YE Nov'11 YE Nov'12 YE Nov'13 YE Nov'14
0% 1% 1% 0% 1%
-1%
0% 1% 0% 0%
F.C. Unit PCYA 4% 6% 7% 7% 6%
Fast Casual is the only QSR segment that has shown consistent growth year over year.
QSR excluding Retail and
Fast Casual
(77%)
Retail(17%)
C-StoresMorning Meal
Fast Casual(6%)
47%CTG
Traffic % Change vs. Year Ago
55
The NPD Group, Inc. | Proprietary and ConfidentialThe NPD Group, Inc. | Proprietary and Confidential
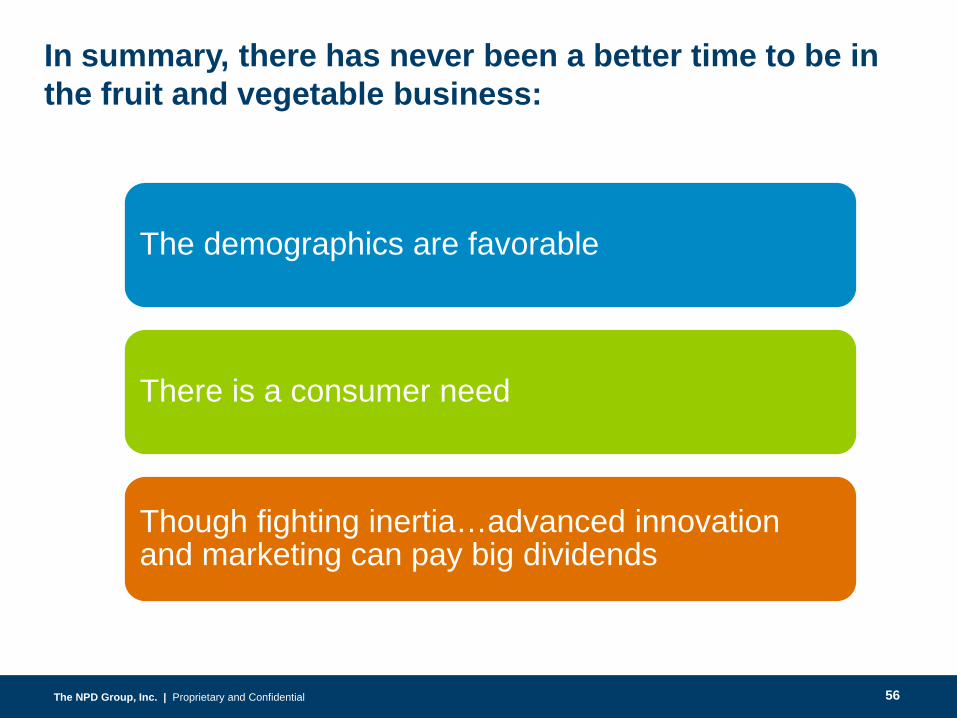
In summary, there has never been a better time to be in the fruit and vegetable business:
The demographics are favorable
There is a consumer need
Though fighting inertia…advanced innovation and marketing can pay big dividends
56

The NPD Group, Inc. | Proprietary and ConfidentialThe NPD Group, Inc. | Proprietary and Confidential
Sometimes it’s hard to see!