Embed Size (px)
Citation preview

This presentation was held during the 5th GIB Summit, May 27-28 2015.
The presentation and more information on the
Global Infrastructure Basel Foundation are
available on www.gib-foundation.org
The next GIB Summit will take place in Basel, May 24-25, 2016.
The information and views set out in this presenation are those of the author(s) and do not necessarily reflect the opinion of the Global Infrastructure Basel Foundation. Neither the Global Infrastructure Basel Foundation nor any person acting on its behalf may be held responsible for the use of the information contained therein.

2
Global Infrastructure Basel 2015 Summit
City-led financing of climate infrastructure: Lessons from
Bus Rapid Transit projects
Robert Kehew

Outline
1. Introduction – Why spend time on this topic at GIB Summit – feasibility of Bus Rapid Transit
2. Experiences & lessons 3. Cities Climate Finance Leadership
Alliance
3

1. Introduction – Why spend time on this topic?
Session Guidance “…How to make sure that… sustainable urban infrastructure projects… that address climate change mitigation are investable and bankable becomes critical.”
4

1. Introduction – Why spend time on this topic?
Reason 1 – Bus Rapid Transit (BRT) – urban transport solution spreading globally ü Reduces GHG emissions from sector ü ‘Co-benefits’ – reduced travel time, reduced congestion, improved air quality, health… ü May be more cost effective than metro ü Focus of x projects at Summit
5
Lagos – BRT- resulted in est. 13 % reductions in GHG emissions from transport

1. Introduction – Why spend time on this topic?
Reason 2 – Projections of revenues from pay-for-use transport facilities may be wildly inaccurate (even in OECD countries)
Reason 3 – Securitized revenues (from tolls, bus fares) may underpin credits (project finance)
6
Projection: traffic + 22 % in 7 years Actual: traffic – 11 % in 8 years Result: concession company filed bankruptcy
Indiana Toll Road (US)

1. Introduction – Why spend time on this topic?
Not an isolated phenomenon. Poor projections increasingly are the subject of lawsuits – particularly as investors try to structure deals so as to offload risk on public sector!
7

1. Introduction – Why spend time on this topic?
Issue: If accuracy of ridership projections (built upon current conditions) is an issue in cities in developed countries…
What about para-transit? Little data on… ü Routes ü Where people board & alight ü Frequency ü # passengers…
8
“Matatu operators & owners… are Nairobi’s invisible public transit planners”.

2. Experience & lessons
Project: Sustainable Urban Transport Solutions for East African Cities Nairobi (Kenya) Addis Ababa (Ethiopia) Kampala (Uganda)
BRT Support to Cairo & Giza
9

2. Experience & lessons
Nairobi – Project took form of support to World Bank funded National Urban Transport Improvement Project 1 of 3 Goals: Promote private sector participation in operation, financing & management of systems
§ 2012 – GOK (with World Bank) invited UN-Habitat/ ITDP to advise on BRT planning under existing A104 road expansion project
§ 2013 – WB advised GOK: carry out detailed Service Plan before beginning detailed design
§ 2014 – Bus Rapid Transit Service Plan
10

2. Experience & lessons
11
BRT Service Plan process
Surveys
Scenario modeling
Decisions on network design & operation (‘Service plan’)

2. Experience & lessons – Surveys
• Innovative effort by Columbia U., MIT, U of Nairobi • Kampala – still does not have such a map
12
‘Digital matatu’ Nairobi
2014

2. Experience & lessons – Surveys
• But… Nairobi ‘Digital Matatu’ only 1st step
Therefore… 5 different types
of surveys, using modified techniques
ü Map informal routes ü Boarding & alighting
surveys (48 routes) ü Stop transfer ü Speed & delay…
13

2. Experience & lessons – Modelling
Models yield estimates of BRT ridership under various scenarios
Different scenarios for… Infrastructure
14
CBD loop
Cabanas
Cabanas
James Gichuru Rd.
James Gichuru Rd.
Original infrastructure design
Alternative w/ CBD loop

2. Experience & lessons – Modelling
Include CBD loop? ‘Modeling of the BRT corridor showed that, if BRT infrastructure is not built through the CBD, many people would be forced to walk 0.7 to 1.0 kilometers to get to the BRT. Yet in general, people are willing to walk only 0.5 kilometers at most.’
15

2. Experience & lessons – Modelling
… and different scenarios for service
Original service scenario: Trunk only BRT
ü 1st generation BRT ü Mimicked rail service ü Services operated only on trunk infrastructure ü But… may require huge transfer facilities where 2 BRT services connect ü May discourage ridership
16
Jakarta – Transfer station between 2 BRT trunk lines

2. Experience & lessons – Modelling
Alternative service scenario: Direct services
ü Before entering BRT infrastructure, services operate in mixed traffic on local streets
ü For many riders, eliminates need for transfer
ü May reduce travel times, size of transfer stations
ü Requires buses that can interface w/ BRT station, also provide traditional curb entrance
17
Guangzhou – 1st BRT system with fully direct services model

2. Experience & lessons – Modelling
Different combos of infrastructure & service scenarios yield…
very different projections of BRT ridership
2015 – Detailed design still under discussion
18
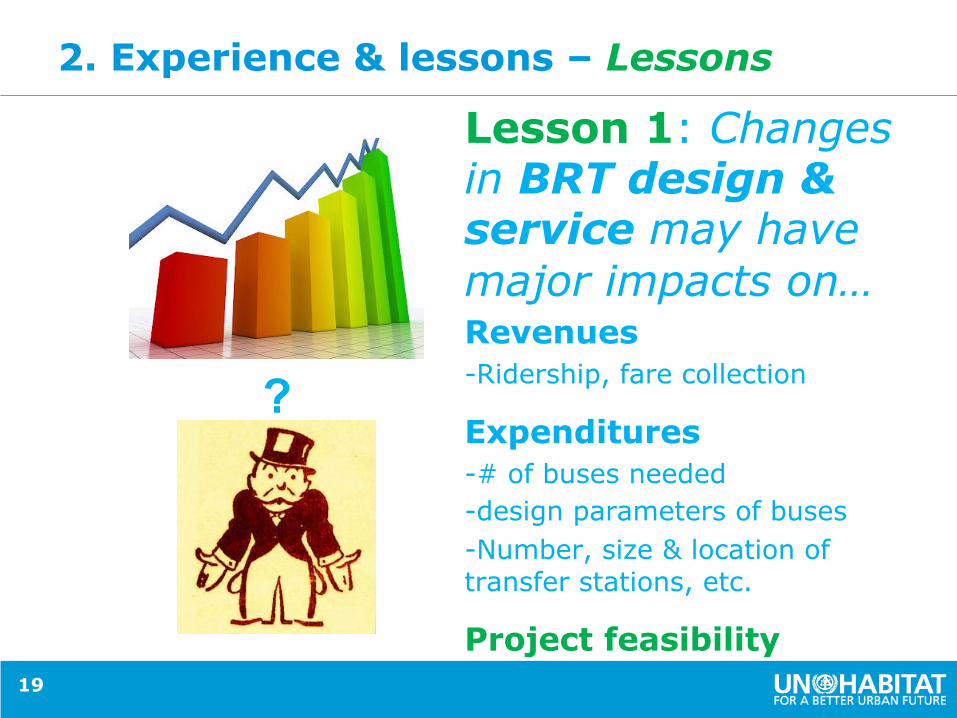
2. Experience & lessons – Lessons
Lesson 1: Changes in BRT design & service may have major impacts on… Revenues - Ridership, fare collection
Expenditures - # of buses needed - design parameters of buses - Number, size & location of transfer stations, etc.
Project feasibility 19
?

2. Experience & lessons – Lessons
Lesson 2: Prepare a quality Service Plan, based on micro survey data, with projections of ridership under different scenarios.
ü Don’t rely on ‘macro’ data on population & employment, assumptions re trip-making ü For para-transit, use mod-ified survey techniques 20

2. Experience & lessons – Lessons
.
Lesson 3: Prepare Service Plan early in process, so can inform decision-making ü Prefeasibility stage – Consider full range of solutions ü Feasibility stage – Develop Service Plan prior to final decisions regarding infrastructure & service 21

2. Experience & lessons – Lessons
Financing Plan
Financial model
BRT Design
Service Plan
- Surveys - Scenario modeling
22
Lesson 4: When considering BRT financing, look into Service Plan
“Well designed & structured BRT projects are in everyone’s best interest”.

3. Cities Climate Finance Leadership Alliance
“The Alliance will mobilize institutional investors & the private sector to channel resources & efforts towards low-carbon, climate-resilient infrastructure” - Dr. Joan Clos, UN-Habitat Executive Director
23

3. Cities Climate Finance Leadership Alliance
Mission: q Catalyze/accelerate
additional capital flows to cities
q Maximize investment in low-carbon & climate-resilient infrastructure
q Close the investment gap in urban areas
24

Acknowledgements
25
Urban Basis Services Branch

27
‘Because this model is based on actual existing transport data collected in the field, it is more reliable than a model that looks only at population and employment and makes broad assumptions about trip-making’