Embed Size (px)
Citation preview
© 2012 Ipsos. All rights reserved. Contains Ipsos' Confidential and Proprietary information and may not be disclosed or reproduced without the prior written consent of Ipsos.
SPEC Barometer Prepared by: Ipsos
Press Release
Release date: 22nd April 2015

2
Methodology

Methodology
3
Dates of polling 28th March - 7th April 2015
Sample Size 1,964
Sampling methodology Random, Multi-stage stratified using PPS
(proportionate to population size)
Universe
Data collection
methodology
Sampling error
Face-to-Face interviews at the household level
Poll funding Ipsos Limited
Kenyan adults, aged 18+ living in Urban
and Rural areas
+/-2.2% with a 95% confidence level
(Note: Higher error-margins for sub-samples)

Sample Structure Statistics
4
Region
Sample Frame statistics
(April 2015)
*Weighted data
% Population Census as at 2009
Adults (18 years +) %
Central 257 13 2,548,038 13
Coast 173 9 1,711,549 9
Eastern 293 15 2,907,293 15
Nairobi 206 10 2,042,770 10
North Eastern 94* 5 929,158 5
Nyanza 257 13 2,547,980 13
Rift Valley 484 25 4,795,482 25
Western 200 10 1,980,090 10
TOTAL 1,964 100 19,462,360 100
Quality Control Measures
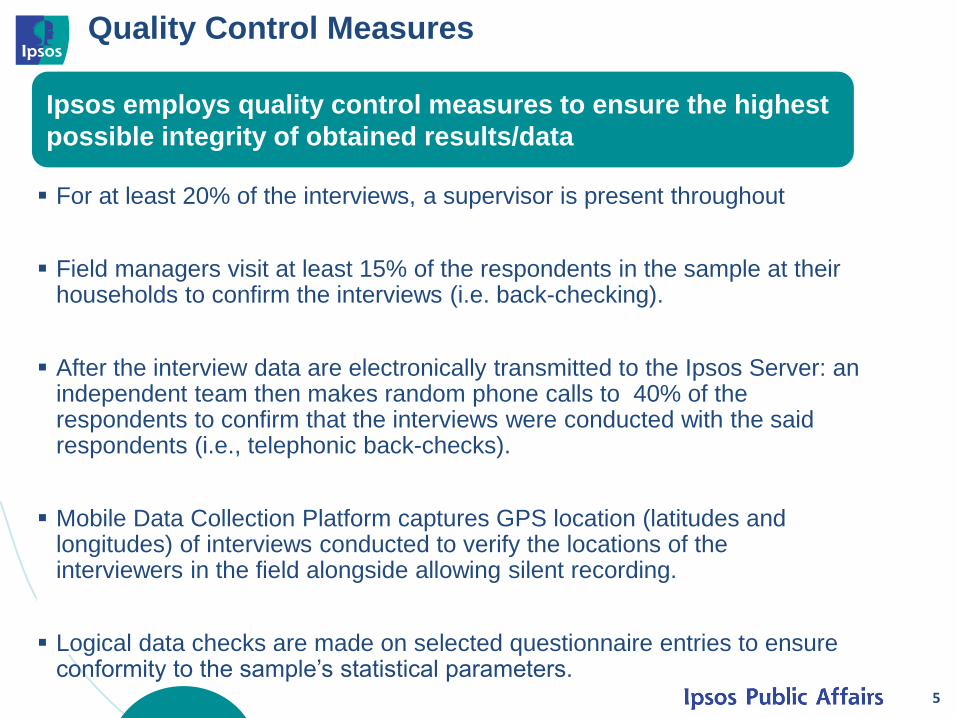
For at least 20% of the interviews, a supervisor is present throughout
Field managers visit at least 15% of the respondents in the sample at their households to confirm the interviews (i.e. back-checking).
After the interview data are electronically transmitted to the Ipsos Server: an independent team then makes random phone calls to 40% of the respondents to confirm that the interviews were conducted with the said respondents (i.e., telephonic back-checks).
Mobile Data Collection Platform captures GPS location (latitudes and longitudes) of interviews conducted to verify the locations of the interviewers in the field alongside allowing silent recording.
Logical data checks are made on selected questionnaire entries to ensure conformity to the sample’s statistical parameters.
5
Ipsos employs quality control measures to ensure the highest
possible integrity of obtained results/data
6
Respondents’
Demographic Profile

28%
2%
30%
8%
11%
9%
10%
1%
1%
9%
22%
28%
23%
4%
4%
2%
5%
1%
2%
Catholic
Catholic Charismatic
Mainstream Protestant (ACK,…
SDA
Evangelical
Other Christian
Muslim
Refused To Answer/None
No religion
Public Sector wages/salary
Private sector wages /salary
Gains from self employment/…
Agriculture (own/household farm)
Livestock
Given money by others
Pension from previous employment
Other
Don’t Know
Refused To Answer
Demographic Profile
10%
9%
13%
25%
5%
15%
13%
10%
51%
49%
28%
29%
18%
25%
37%
63%
100%
Nairobi
Coast
Nyanza
Rift Valley
North Eastern
Eastern
Central
Western
Female
Male
18 - 24
25 - 34
35 - 44
45+
Urban
Rural
Kenyans
7
Region
Gender
Age
Setting
Religion
Nationality
Source of Household Income
Base: All Respondents (n=1,964)
Demographic Profile
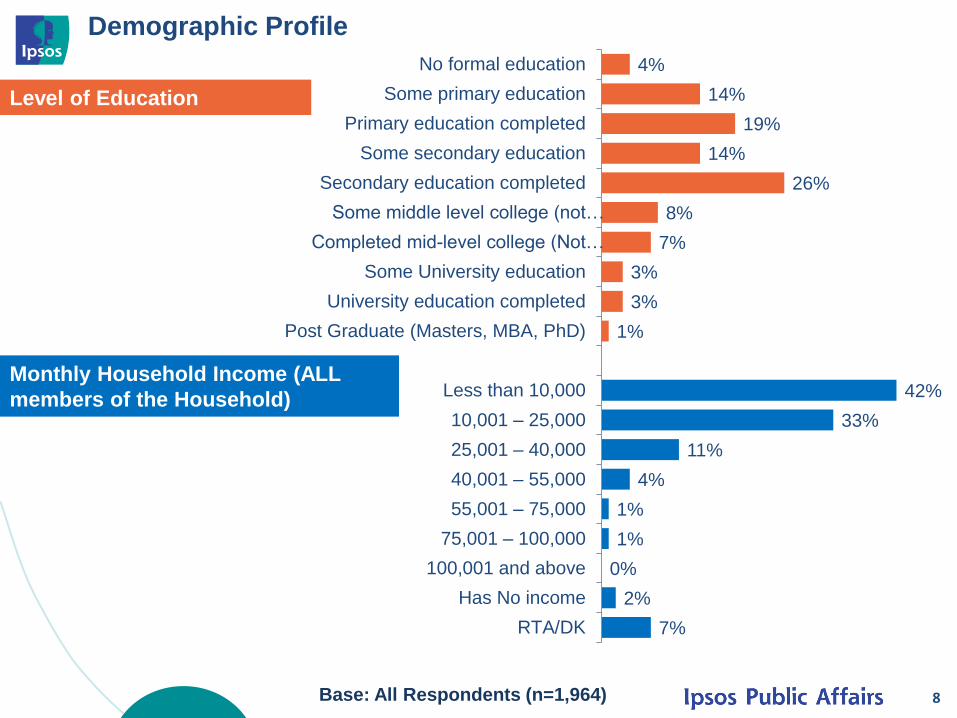
4%
14%
19%
14%
26%
8%
7%
3%
3%
1%
42%
33%
11%
4%
1%
1%
0%
2%
7%
No formal education
Some primary education
Primary education completed
Some secondary education
Secondary education completed
Some middle level college (not…
Completed mid-level college (Not…
Some University education
University education completed
Post Graduate (Masters, MBA, PhD)
Less than 10,000
10,001 – 25,000
25,001 – 40,000
40,001 – 55,000
55,001 – 75,000
75,001 – 100,000
100,001 and above
Has No income
RTA/DK
8
Level of Education
Monthly Household Income (ALL
members of the Household)
Base: All Respondents (n=1,964)
Demographic Profile
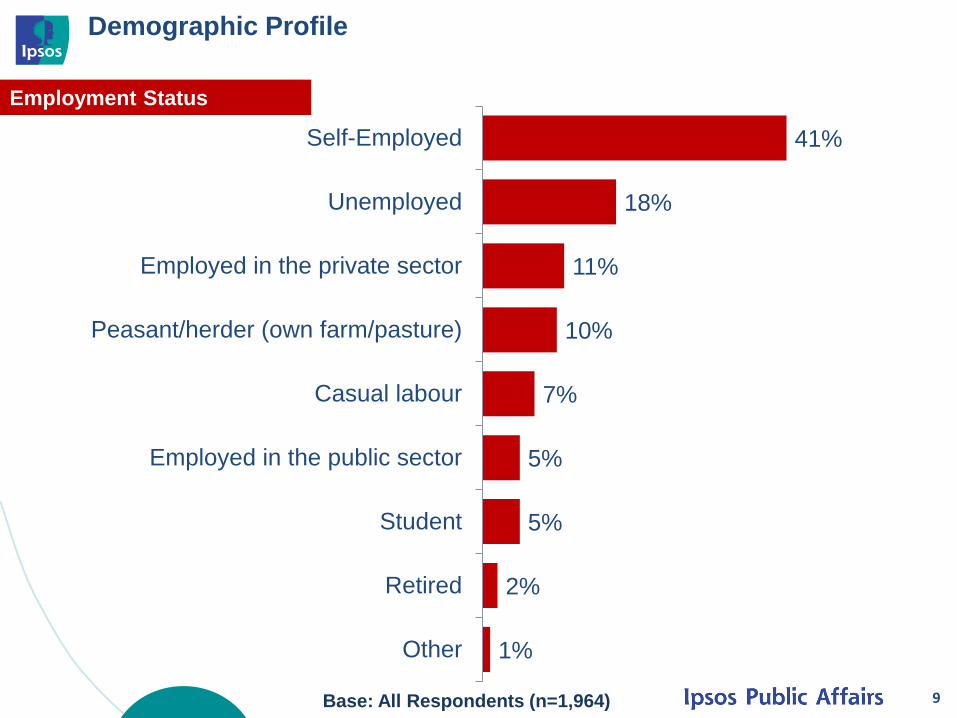
41%
18%
11%
10%
7%
5%
5%
2%
1%
Self-Employed
Unemployed
Employed in the private sector
Peasant/herder (own farm/pasture)
Casual labour
Employed in the public sector
Student
Retired
Other
9
Employment Status
Base: All Respondents (n=1,964)

10
Constituency Development Fund
(CDF)

Awareness of Any CDF Project in the Locality (Single Response): (By Total, Setting)
11
40%
9% 8%
7%
1% 1%
4%
30% 29%
13%
6% 8%
1%
6%
37%
46%
7%
10%
7%
1% 3%
25%
0%
10%
20%
30%
40%
50%
Total (n=1,964) Urban (n=729) Rural (n=1,235)

“Do you think CDF is still needed to promote development at the local level?” (By Total, Supporters of the Main Political Parties/ Coalitions)
12
85%
10%
5%
87%
8% 5%
86%
10%
4%
0%
20%
40%
60%
80%
100%
YES NO Not Sure
Total (n=1,954) CORD Supporters (n=623) Jubilee Supporters (n=867)

“Do you think CDF is still needed to promote development at the local level?” (By Total, Supporters of the Main Political Parties/ Coalitions)
13
93%
87%
5% 9%
2% 4%
0%
20%
40%
60%
80%
100%
CDF has been "a complete success" (n=700) CDF has been "only a partial success/failure"(n=634)
YES NO Not Sure

Preferred Oversight Responsibility for CDF (of Those 85% Who Want It To Continue At All) (By Total, Supporters of Main Political Parties/Coalitions)
14
38% 41%
18%
2%
39%
46%
14%
1%
40% 38%
20%
1% 0%
20%
40%
60%
80%
100%
MPs/Parliament County Governments Central Government Not Sure
Total (n=1,678) CORD Supporters (n=541) Jubilee Supporters (n=748)

15
Public Participation

“Are you satisfied with the opportunities made available to the public for public participation by the..?” (By Total)
16
42% 44% 45%
41%
9% 11%
4% 4%
0%
20%
40%
60%
80%
100%
Central government County government
Satisfied Not satisfied Not sure Not interested in participating

17
Support for Devolution

“Altogether, do you support devolution , that is, having county governments in Kenya?” (By Total and Supporters of the Main Political Parties/Coalitions)
18
78% 77% 80%
21% 23% 18%
2% 1% 1%
Total (n=1,964) Jubilee Supporters (n=867) CORD Supporters (n=623)
YES NO RTA

“Altogether, do you support devolution i.e. having county governments in Kenya?” – Trend Analysis
19
69%
78%
28%
21%
3% 2%
September 2014 (n=2,021) April 2015 (n=1,964)
YES NO RTA

“How much confidence you have in each of the following, a lot of confidence, some confidence, only a little confidence, or no confidence at all in …? (By Total)
20% 22% 21%
19%
38%
44%
37%
34%
18% 19% 21% 21% 22%
14%
20%
25%
2% 1% 1% 1% 0%
10%
20%
30%
40%
50%
Your County AssemblyRepresentative (MCA)
County Governments Governors Senators
A lot of confidence Some confidence Only a little confidence
No confidence at all Don't Know
20 Base: All Respondents (n=1,964)

21
Desired Changes in the Constitution

“What changes would you like to see in the current Constitution, if any?” (Multiple Response) (By Total)
13%
11%
9%
9%
9%
5%
3%
1%
1%
1%
10%
20%
25%
0% 10% 20% 30% 40% 50%
A reduction in the number of elected officials
Limits on salaries and benefits for senior governmentofficials/more powers to the SRC
Replacement of IEBC
Less power for the governors/counties
Health services to remain a central government responsibility
More power for the governors/counties
A move away from pure presidential system to parliamentarysystem
Increase presidential powers
Strengthen chapter 6 on integrity of leaders
Bill of rights
Invalid answers (not relevant to the Constitution)
None
Not sure
22 Base: All Respondents (n=1,964)

For further information contact:
Dr Tom Wolf
Research Analyst
Victor Rateng
Project Manager - Opinion Polls
Website: www.ipsos.co.ke
Follow us on twitter: @IpsosKe
23