Visual Psychophysics and Physiological Optics
Visual Consequences of Molecular Changes in theGuanylate Cyclase-Activating Protein
Andrew Stockman,1 G. Bruce Henning,1 Anthony T. Moore,1,2 Andrew R. Webster,1,2
Michel Michaelides,1,2 and Caterina Ripamonti1
1UCL Institute of Ophthalmology, University College London, London, United Kingdom2Moorfields Eye Hospital, London, United Kingdom
Correspondence: Andrew Stockman,UCL Institute of Ophthalmology,University College London, 11-43Bath Street, London EC1V 9EL, UK;[email protected].
Submitted: November 27, 2013Accepted: February 10, 2014
Citation: Stockman A, Henning GB,Moore AT, Webster AR, Michaelides M,Ripamonti C. Visual consequences ofmolecular changes in the guanylatecyclase-activating protein. Invest
Ophthalmol Vis Sci. 2014;55:1930–1940. DOI:10.1167/iovs.13-13682
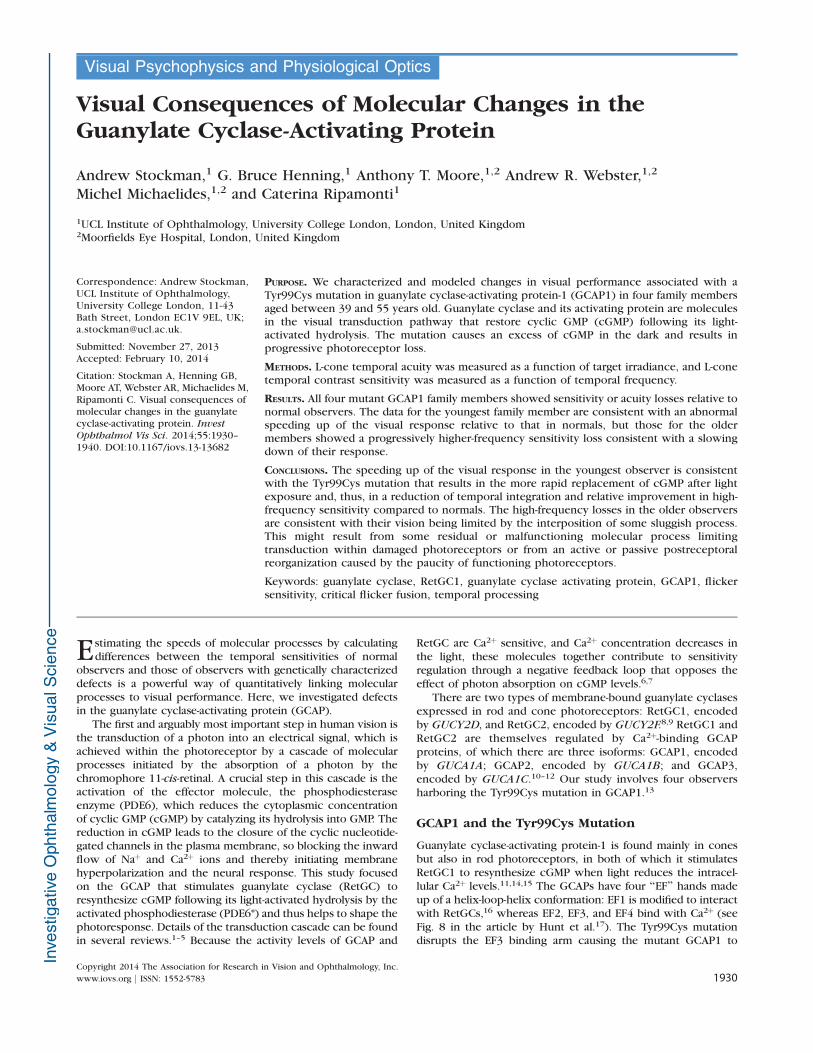
PURPOSE. We characterized and modeled changes in visual performance associated with aTyr99Cys mutation in guanylate cyclase-activating protein-1 (GCAP1) in four family membersaged between 39 and 55 years old. Guanylate cyclase and its activating protein are moleculesin the visual transduction pathway that restore cyclic GMP (cGMP) following its light-activated hydrolysis. The mutation causes an excess of cGMP in the dark and results inprogressive photoreceptor loss.
METHODS. L-cone temporal acuity was measured as a function of target irradiance, and L-conetemporal contrast sensitivity was measured as a function of temporal frequency.
RESULTS. All four mutant GCAP1 family members showed sensitivity or acuity losses relative tonormal observers. The data for the youngest family member are consistent with an abnormalspeeding up of the visual response relative to that in normals, but those for the oldermembers showed a progressively higher-frequency sensitivity loss consistent with a slowingdown of their response.
CONCLUSIONS. The speeding up of the visual response in the youngest observer is consistentwith the Tyr99Cys mutation that results in the more rapid replacement of cGMP after lightexposure and, thus, in a reduction of temporal integration and relative improvement in high-frequency sensitivity compared to normals. The high-frequency losses in the older observersare consistent with their vision being limited by the interposition of some sluggish process.This might result from some residual or malfunctioning molecular process limitingtransduction within damaged photoreceptors or from an active or passive postreceptoralreorganization caused by the paucity of functioning photoreceptors.
Keywords: guanylate cyclase, RetGC1, guanylate cyclase activating protein, GCAP1, flickersensitivity, critical flicker fusion, temporal processing
Estimating the speeds of molecular processes by calculatingdifferences between the temporal sensitivities of normal
observers and those of observers with genetically characterizeddefects is a powerful way of quantitatively linking molecularprocesses to visual performance. Here, we investigated defectsin the guanylate cyclase-activating protein (GCAP).
The first and arguably most important step in human vision isthe transduction of a photon into an electrical signal, which isachieved within the photoreceptor by a cascade of molecularprocesses initiated by the absorption of a photon by thechromophore 11-cis-retinal. A crucial step in this cascade is theactivation of the effector molecule, the phosphodiesteraseenzyme (PDE6), which reduces the cytoplasmic concentrationof cyclic GMP (cGMP) by catalyzing its hydrolysis into GMP. Thereduction in cGMP leads to the closure of the cyclic nucleotide-gated channels in the plasma membrane, so blocking the inwardflow of Naþ and Ca2þ ions and thereby initiating membranehyperpolarization and the neural response. This study focusedon the GCAP that stimulates guanylate cyclase (RetGC) toresynthesize cGMP following its light-activated hydrolysis by theactivated phosphodiesterase (PDE6*) and thus helps to shape thephotoresponse. Details of the transduction cascade can be foundin several reviews.1–5 Because the activity levels of GCAP and
RetGC are Ca2þ sensitive, and Ca2þ concentration decreases inthe light, these molecules together contribute to sensitivityregulation through a negative feedback loop that opposes theeffect of photon absorption on cGMP levels.6,7
There are two types of membrane-bound guanylate cyclasesexpressed in rod and cone photoreceptors: RetGC1, encodedby GUCY2D, and RetGC2, encoded by GUCY2F.8,9 RetGC1 andRetGC2 are themselves regulated by Ca2þ-binding GCAPproteins, of which there are three isoforms: GCAP1, encodedby GUCA1A; GCAP2, encoded by GUCA1B; and GCAP3,encoded by GUCA1C.10–12 Our study involves four observersharboring the Tyr99Cys mutation in GCAP1.13
GCAP1 and the Tyr99Cys Mutation
Guanylate cyclase-activating protein-1 is found mainly in conesbut also in rod photoreceptors, in both of which it stimulatesRetGC1 to resynthesize cGMP when light reduces the intracel-lular Ca2þ levels.11,14,15 The GCAPs have four ‘‘EF’’ hands madeup of a helix-loop-helix conformation: EF1 is modified to interactwith RetGCs,16 whereas EF2, EF3, and EF4 bind with Ca2þ (seeFig. 8 in the article by Hunt et al.17). The Tyr99Cys mutationdisrupts the EF3 binding arm causing the mutant GCAP1 to
Copyright 2014 The Association for Research in Vision and Ophthalmology, Inc.
www.iovs.org j ISSN: 1552-5783 1930
continue stimulating RetGC1 even in the dark when Ca2þ levelsare high and even in the presence of calcium-loaded wild-type(normal) GCAPs.18,19
Clinically, the Tyr99Cys mutant GCAP1 leads to dominantcone-rod dystrophy, and less frequently to cone dystrophy andisolated macular cone loss.13 Initial symptoms are mildphotophobia, reduced central vision and visual acuity, and aloss of color vision that usually becomes apparent between theages of 20 and 40 years old. Electrophysiologically there isultimately a reduction in the amplitude of photopic electro-retinograms (ERGs) to 30-Hz flicker and single flashes butwithout increases in implicit time (the latencies to peakresponses); and scotopic ERGs may be reduced if there is rodinvolvement. Visual acuity gradually deteriorates with age, butperipheral vision may be relatively preserved in patients with acone dystrophy or macular dystrophy phenotype.13,20–22
GCAP, cGMP, and the Visual Response: In VivoMurine Models
The Tyr99Cys mutant GCAP1 constitutively activates RetGC1even when the Ca2þ concentration is high and so produceshigher than normal concentrations of cGMP at lower lightlevels. Because of the enhanced activity at these levels, wemight also expect a more rapid replacement of cGMP thannormal following light activation. In addition, the excess ofcGMP in the dark should increase the Ca2þ level, which mightenhance the size of dim flash responses.
Much of the evidence concerning the effects of GCAP comesfrom rod measurements made in vivo in transgenic Tyr99Cysmutant GCAP1 mice (which also have wild-type GCAP1), and inknockout mice lacking GCAP1 and GCAP2. The key types ofrod data collected in mice are typically rod suction-electrodecurrent recordings for low-intensity single flashes that producesingle-photon responses and for series of single flashes fromlow to saturating intensity levels. Two key variables extractedfrom these measurements are srec (or sdim), the time constant ofexponential recovery after the peak of the single-photonresponse; and sD (or ssat), the dominant time constant ofexponential recovery after the rod responses to bright flashesreach saturation. In transgenic Tyr99Cys mutant GCAP1 mice,23
the single-photon response is approximately twice the size ofthe normal response, yet the exponential rates of decay afterthe peak are similar in the two cases (having analyzed the datafrom Fig. 6b in the article by Olshevskaya et al.,23 we estimatetime constants, srec, of approximately 250 and 230 ms forTyr99Cys mutant and normal responses, respectively). Bycomparison, the amplitude of the single-photon response inmice lacking both the GCAP1 and GCAP2 is approximately fivetimes greater than normal and the decay after the peak slower(srec¼ 313 ms).7,24 Clearly, GCAP1 and Ca2þ feedback to RetGCis important in shortening the offset of the dark-adapted rodflash response,24,25 but the Tyr99Cys mutation seems to haverelatively little effect on the rate of the offset compared to thatin the wild-type (normal) rod response.
In contrast, the dominant rate of recovery following rodresponse saturation in mice lacking GCAP1/GCAP2 is the same asthat in wild-type mice (sD¼240 ms), which suggests that at leastin the recovery from saturation, Ca2þ-dependent cGMP resyn-thesis is not rate limiting.7,25–27 Similarly, the Tyr99Cys mutationseems to cause only a modest increase in the duration ofsaturating response (see Fig. 6a in Olshevskaya et al.23).
On the basis of these murine rod measurements, we mightexpect the Tyr99Cys mutant GCAP1 to have relatively littleeffect on our temporal sensitivity measurements. However, thepsychophysical data are consistent with a speeding up of thephotopic visual response in our youngest Tyr99Cys mutantobserver.
Light Adaptation and Temporal Sensitivity
Light adaptation or sensitivity regulation, which is one of themost important functions of the cone photoreceptor, enablesresponses to small proportional changes in intensity over theenormous range of light levels to which cones can be exposedin the environment. Adaptation is achieved largely by aspeeding up of the visual response as the light level increasesand thus a shortening of the integration time (see Equation 3below; and for discussion, see Stockman et al.28). The murinedata apart (see above), one of the molecular mechanismsresponsible for this change in normal vision is probably theincreased activities of RetGC and GCAP in the light as the Ca2þ
level falls, which leads to the accelerated restoration of cGMP(see Table 1 in the article by Pugh et al.2). The effects ofspeeding up the photoreceptor response can be clearlyobserved in psychophysical measures of temporal sensitivity(i.e., as changes in an observer’s sensitivity to flickering lights),and most characteristically as relative increases in high-frequency sensitivity with increasing mean light level.29–31
If we are correct in supposing that the increased Ca2þ-dependent activities of RetGC and GCAP measurably speed upthe cone visual response, then observers carrying the Tyr99Cysmutant GCAP1, which leads to a more rapid replacement ofcGMP at lower light levels, might be expected to be relativelybetter at detecting higher temporal frequencies than normalobservers. A clear complication in linking the molecularchange to visual performance is that this type of cone–roddystrophy is progressive.21,22 Thus, although the initial directvisual effects of the molecular defect and the excessproduction of cGMP might be apparent in the visual behaviorof younger observers, in older observers any effects are likelyto be hidden by increasing loss or damage. An importantquestion, then, is what form does the increasing loss or damagetake? Is it consistent simply with loss of photoreceptors? Orwith a change in the function of the remaining photoreceptorsor postreceptoral pathways? Or, indeed, all three forms?
Our mutant GCAP1 observers are limited to a singlegeneration within the same family, as a result of which theage range is limited to 39 to 55 years old. Nevertheless, wefound a pattern of loss in the family of observers with theTyr99Cys mutant GCAP1 that was consistent with theimposition of an increasingly sluggish low-pass filter (i.e., aprocess that increasingly attenuates or blocks higher temporal-frequency flicker relative to low-frequency flicker). We did nothave access to the younger generation of the family, whoseconditions have not as yet been diagnosed.
METHODS
Observers
The experimental group consisted of four observers, GP1 toGP4, in the same family carrying a Tyr99Cys substitution inGCAP1.21 The observers’ sex, ages at testing, genotypes, andvisual acuities in the tested eyes are given in Table 1. Adultswith normal or corrected-to-normal visual acuity and normalcolor vision provided representative control data. (The normal
TABLE 1. Sex, Age at Testing, Genotype, and Visual Acuities in theTested Eye for Observers GP1 to GP4
Observer Sex Age Genotype Visual Acuity
GP1 M 39 GUCA1A p.Tyr99Cys 6/12
GP2 F 41 GUCA1A p.Tyr99Cys 6/12
GP3 M 51 GUCA1A p.Tyr99Cys 6/9
GP4 F 55 GUCA1A p.Tyr99Cys 6/12
Visual Effects of Changes in GCAP IOVS j March 2014 j Vol. 55 j No. 3 j 1931
observers all had normal color vision as assessed by theFarnsworth-Munsell 100 (FM-100) hue test and other standardcolor vision tests.)
The color vision test results for all the affected observerswere broadly consistent with a generalized loss of color vision.Observers GP1 and GP2 had low discrimination based on theFM-100 hue test, with deficits along tritan and protan lines (S-cone and L-cone deficiencies, respectively), whereas GP4 hadvery low discrimination (GP3 did not take this test). Red-greenRayleigh anomaloscope settings were highly variable and weresometimes consistent with normal or protanomalous settings(GP2), sometimes with deuteranomalous or protanomalous(abnormal M-cone and L-cone, respectively) settings (GP1 andGP3), and sometimes they were relatively normal (GP4).
All studies conformed to the standards set by theDeclaration of Helsinki, and the procedures were approvedby local ethics committees at Moorfields Eye Hospital and atUniversity College London.
Apparatus
The optical system for the experiments has been described indetail elsewhere.32 Briefly, the optics consisted of 2 channelswith a standard Maxwellian view system with a 2-mm exitpupil illuminated by a 900-W Xe arc lamp. One channel wasused to produce a circular background field of 98 diameterand the other to produce a concentric ‘‘target’’ field with adiameter of 48. The wavelengths of the target and backgroundwere determined by interference filters (Ealing Corporation,Holliston, MA, or Oriel, Stratford, CT) with full bandwidth athalf-maximum transmission of between 7 and 11 nm insertedinto collimated beams in each channel. The radiance in eachchannel was determined by a combination of neutral densityfilters (Oriel) also inserted into collimated beams and by therotation, under computer control, of a circular, variableneutral density filter (Rolyn Optics, Covina, CA) located neara focus within the target channel.
Sinusoidal variations in the target radiance were producedby pulse width modulation of the target beam by a fast, liquid-crystal light shutter located in the target beam and running at400 Hz, with rise and fall times faster than 50 ls (Displaytech,Longmont, CO), thus producing effectively rectangular pulsesof variable width at a fixed frequency of 400 Hz. The pulsewidth was varied sinusoidally under computer control usingprogrammable timers (product no. DT2819; Data Translation,Marlborough, MA) to produce sinusoidal stimuli at the desiredvisible frequencies and at signal modulations of up to 92%.(Frequencies near the 400-Hz rectangular pulse frequency andabove were much too high to be resolved, thus observers sawonly the sinusoidally varying stimuli produced by the variationof the pulse width.)
The patient’s head was fixed to the system by a hardeneddental impression mounted on a milling-machine head adjustedto locate the exit pupil of the optics at the center and in theplane of the patient’s right pupil.
Stimuli
We were primarily interested in L-cone responses andmeasured their temporal properties by sinusoidally flickeringthe 48 target. We refer to the amplitude of the flicker relative tothe mean radiance as the modulation, m, which is defined asthe conventional Michelson contrast
m ¼ Imax � Imin
Imax þ Imin; ð1Þ
where Imax and Imin are the maximum and minimum radiances
of the stimulus, respectively. Thus, for sinusoidal flicker, theflickering waveform, A (t), is given by
AðtÞ ¼ R 1þmsinð2pftÞf g; ð2Þ
where R is the mean radiance, f (Hz) is the rate of flicker, and t
is time (s). The modulation, m, could be varied undercomputer control and was limited to a maximum of 92%.
L-Cone Stimuli. A flickering target of 48 of visual angle indiameter and 650-nm wavelength was presented in the centerof a 98-diameter background field of 481 nm. Fixation wascentral. The 481-nm background, which delivered 8.24 logquanta s�1 deg�2 at the cornea (1.37 log10 photopic trolands or2.53 log10 scotopic trolands), served mainly to suppress therods but also selectively desensitized the M-cones relative to L-cones at lower target radiances. The background was presentfor all the experiments reported here. For the critical fusionfrequency (CFF) measurements, the target intensity was variedfrom 6.5 to 11.5 log10 quanta s�1 deg�2. These conditionsisolated the L-cone response over most of the intensity range;however, at high intensities, the M-cones may also havecontributed to flicker detection, but we were not concernedabout the possibility of a mixed M- and L-cone response athigher levels. For the temporal contrast sensitivity measure-ments, the target radiance was set to a time-averaged radianceof either 8.28, 9.30, or 10.28 log10 quanta s�1 deg�2, which weshall refer to as the low, medium, and high levels, respectively.
Procedures
All observers were light adapted to the background and targetfor 3 minutes before any measurements. They interacted withthe computer that controlled the apparatus by means of an 8-button keypad and received information and instructions viatones and a computer-controlled voice synthesizer. Eachexperiment was repeated three times, usually on separatedays. The means of the results for each experiment wereaveraged and the standard error determined. The visualstimulus, focused at the plane of the pupil, was the onlyvisible light source for the observers in an otherwise darkroom. The image of the source at the plane of the observers’pupils was always less than the minimal pupil size so thatretinal illumination was not affected by pupil size. The methodof adjustment was used to measure visual responses in theexperiments.
Two types of temporal sensitivity experiments wereperformed: CFF was measured as a function of target radiance,and temporal contrast sensitivity was measured as a function oftemporal frequency at the three mean target radiances.
Critical Fusion Measurements. The target modulationwas held fixed at 92%, and the time-averaged radiance set tovalues ranging from approximately 6 to 11 log10 quanta s�1 deg�2
by the experimenter inserting neutral density filters into thetarget channel. At each target radiance, the observer adjusted therate of flicker up or down by means of buttons to determine thehighest frequency of flicker at which flicker was just visible (i.e.,their flicker ‘‘threshold’’ or CFF) and indicated that they weresatisfied with their adjustment by pushing a third button. Theobserver then changed the flicker frequency away from theirthreshold setting and redetermined the highest frequency atwhich flicker was just visible. The process was repeated threetimes before the mean radiance of the target was changed. Allthree settings and their means were stored in the computer. Theexperiment was repeated on three separate occasions for thenormal observers and, depending on availability, on two or threeseparate occasions for the affected observers.
Temporal Contrast Sensitivity Measurements. Thefrequency of the flickering target was fixed at values ranging
Visual Effects of Changes in GCAP IOVS j March 2014 j Vol. 55 j No. 3 j 1932
from 0.5 to 50 Hz. The mean radiances of both the backgroundand target were also fixed. The observers adjusted themodulation of the flickering stimulus (m in Equation 2) todetermine the lowest modulation at which a given flicker wasjust visible. Modulation could be varied up or down in large orsmall steps depending on the button pressed. Again, observersindicated they were satisfied with their adjustment by pushinga third button. The observer then moved the modulation awayfrom their threshold setting and redetermined the thresholdagain. The process was repeated three times before the flickerfrequency of the target was automatically changed by thecomputer. All three settings and their means were stored in thecomputer, and the experiment was repeated on three separateoccasions. The averages and means and standard errorsobtained on three different occasions for the normal observersand, depending on availability, on two or three separateoccasions for the affected observers, are reported.
Calibration
The radiant fluxes of the target and background fields weremeasured at the plane of the exit pupil using an UDTradiometer calibrated by the manufacturer (Gamma Scientific)against a standard traceable to the US National Bureau ofStandards. The neutral density filters (and circular neutraldensity wedge) were calibrated in the optical system,separately for each wavelength used, using the radiometer.Target radiances are reported as time-averaged values. Neutraldensity filters, fixed and variable, were calibrated in situ for alltest and field wavelengths used. A spectroradiometer (GammaScientific, San Diego, CA) was used to measure the centerwavelength and the bandwidth at half-amplitude of eachinterference filter in situ.
RESULTS
L-Cone Critical Flicker Fusion
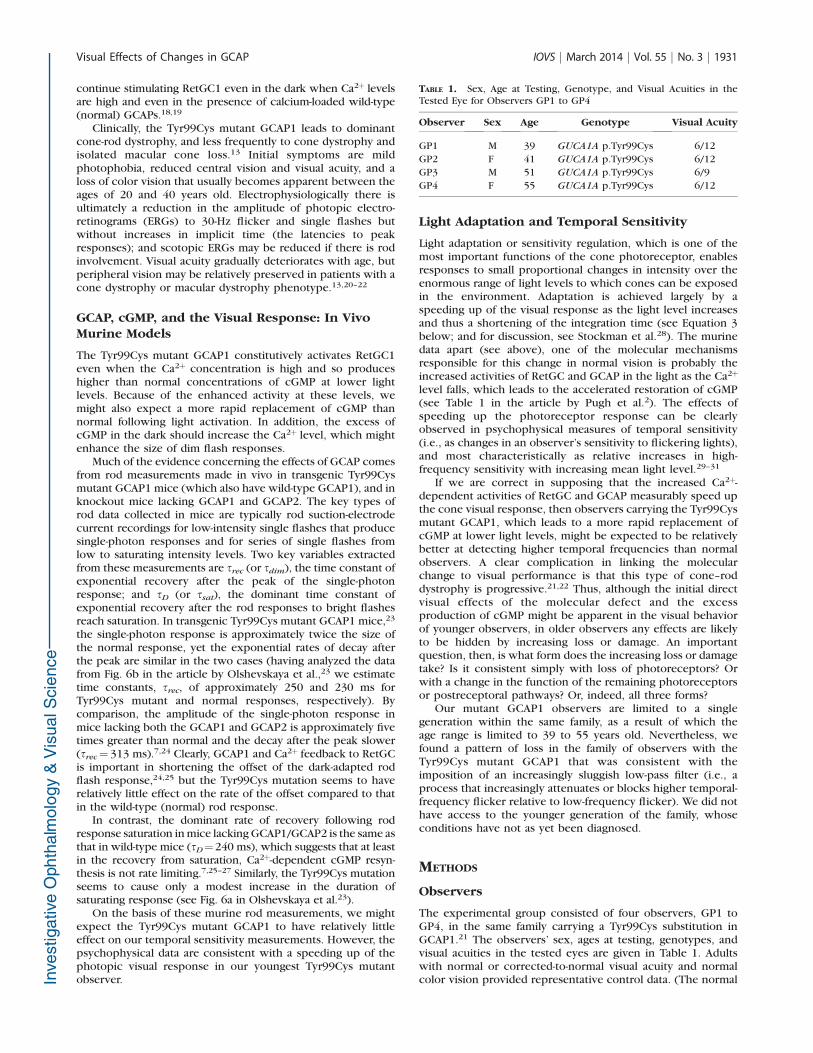
Figure 1 shows L-cone CFF (temporal acuity) data for the fourobservers with Tyr99Cys mutant GCAP1 plotted on a linearordinate as a function of log10 target radiance. The CFF at eachtarget radiance is the highest frequency at that radiance atwhich the target appears to flicker. Data for GP1 to GP4,whose ages increase from GP1 to GP4, are shown in Figure 1.The mean L-cone CFF data for 12 observers with normal visionare shown in Figure 1 as red squares. Error bars in all figures(visible only when they are larger than the symbols) are 61SEM within observers for the affected individuals and betweenobservers for the normal measurements.
In normal observers, L-cone CFF starts to rise at approx-imately 6.5 log10 quanta s�1 deg�2. And above approximately7.25 log10 quanta s�1 deg�2 the CFF increases (on thesecoordinates) with a linear slope until at approximately 9.75log10 quanta s�1 deg�2 it begins to approach a plateau near 40Hz.33,34 By contrast, the L-cone CFF functions for all fourobservers with the Tyr99Cys mutant GCAP1 show substantiallosses in CFF. Flicker is not detected in any of the affectedobservers until the mean 650-nm target radiance reaches at least7.7 log10 quanta s�1 deg�2, nearly 13 times more intense thanthat for normal observers. The differences suggest that thedeficit involves a loss of at least 1.2 log10 units of intensity. Forthe affected observers, as the radiance increases above 7.7 log10
quanta s�1 deg�2, the CFF increases but, except for GP3, inwhom no asymptote is apparent, approaches much lowerasymptotic CFF values than normal. The CFF loss is greater theolder the patient. The highest CFF for the mean normal observeris approximately 40 Hz but declines to 29, 23, 11, and 10 Hz for
observers GP1 to GP4, respectively (see also Fig. 3, Table 3). Interms of temporal acuity, the four observers with the Tyr99Cysmutant GCAP1 show losses that increase with age.
There is a region both for the normal and for the affectedobservers over which the CFF is approximately linearlyrelated to the logarithm of the target radiance. This linearrelationship, known as the Ferry-Porter law,35,36 holds, innormal observers, from approximately 7.25 to 9.75 log10
quanta s�1 deg�2. For the affected observers, with theexception of GP1, the slope over the Ferry-Porter region ismuch shallower, and the range over which it occurs isdisplaced to higher radiances. We can quantify and comparethe individual CFF data shown in Figure 1 in terms of theslope. The blue straight lines fitted to each set of CFF datashown in Figure 1 are the best fitting slopes over the Ferry-
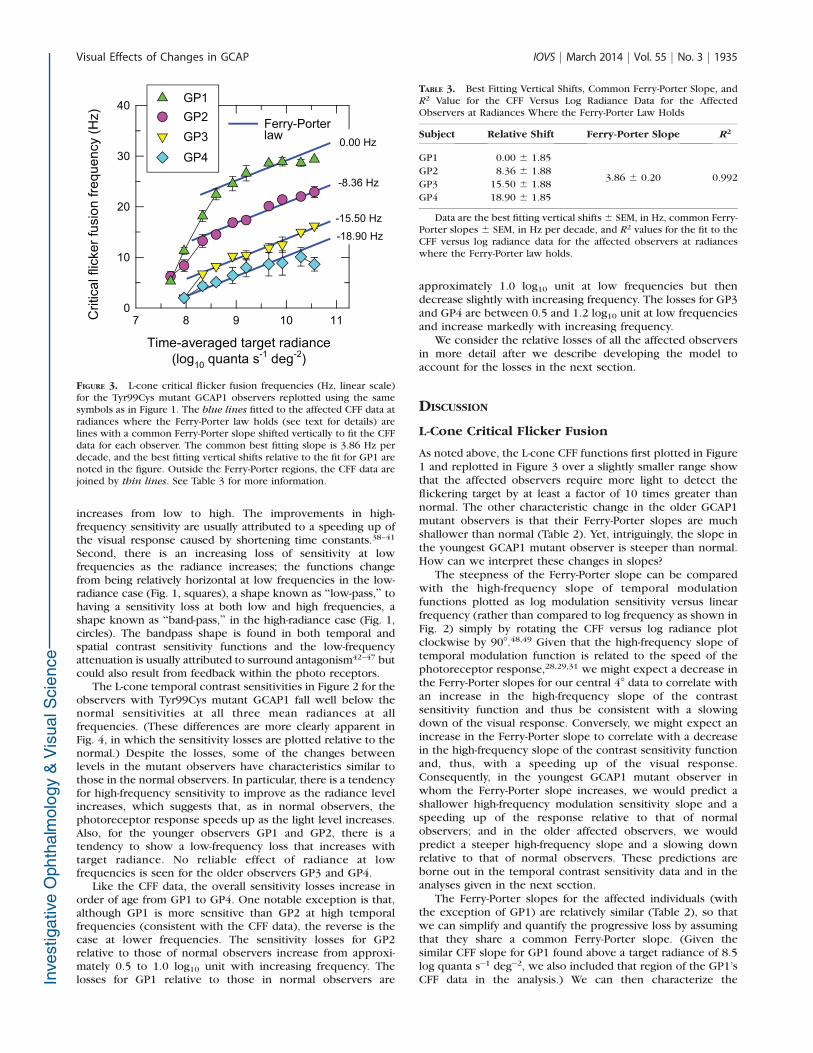
FIGURE 1. L-cone critical flicker fusion frequencies (Hz, linear scale)measured on a 481-nm background of 8.26 log10 quanta s�1 deg�2 areplotted as a function of the mean log radiance of a 650-nm flickeringtarget. Data are plotted for four observers with the GCAP1 Tyr99Cysmutations GP1 (green triangles), GP2 (purple circles), GP3 (yellow
inverted triangles), and GP4 (blue diamonds). The mean data for 12normal observers (red squares) are also shown. In all figures, the error
bars are 61 SEM for the affected observers and between observers forthe mean data. The blue lines are best fitting linear slopes fitted to themean data for normals and affected observer over radiances where theFerry-Porter law holds (see text for details). Outside the Ferry-Porterregions, the CFF data are joined by thin lines. The best fitting slopesare given in Table 1.
TABLE 2. Ferry-Porter Slopes for Best Fit to the CFF Versus LogRadiance Data for Each of the Affected Observers
Subject Ferry-Porter Slope R2
GP1 18.79 6 0.88 0.996
GP2 4.42 6 0.27 0.978
GP3 3.93 6 0.26 0.974
GP4 2.91 6 0.27 0.960
Normal 8.57 6 0.16 0.998
Data show the best fitting Ferry-Porter slopes 6 SEM, in Hz, perdecade and R2 values for fit to the CFF versus log radiance data for eachof the affected observers and for the mean normal observer data atradiances where the Ferry-Porter law holds (see Fig. 1).
Visual Effects of Changes in GCAP IOVS j March 2014 j Vol. 55 j No. 3 j 1933
Porter regions for each observer. The best fitting slopes, theirstandard errors, and R2 values are given in Table 2. The slopesfor GP2 to GP4, which are between 2.91 and 4.42 Hz perdecade, are much less than the normal slope of 8.57, yet,interestingly, the slope for GP1 at 18.79 Hz per decade istwice that of the normal slope. The high R2 values in Table 2suggest that the Ferry-Porter law is a plausible description ofthe data over the appropriate ranges. (The Ferry-Porter slopesare considered further in the Discussion.)
L-Cone Temporal Contrast Sensitivity
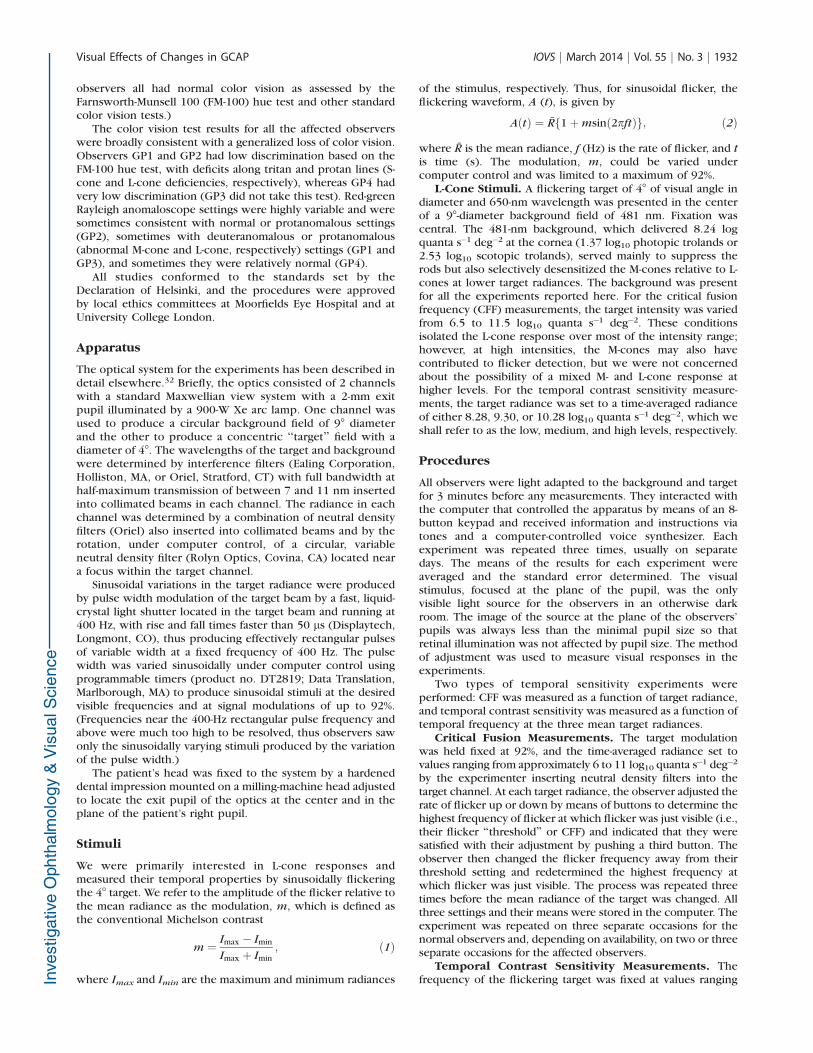
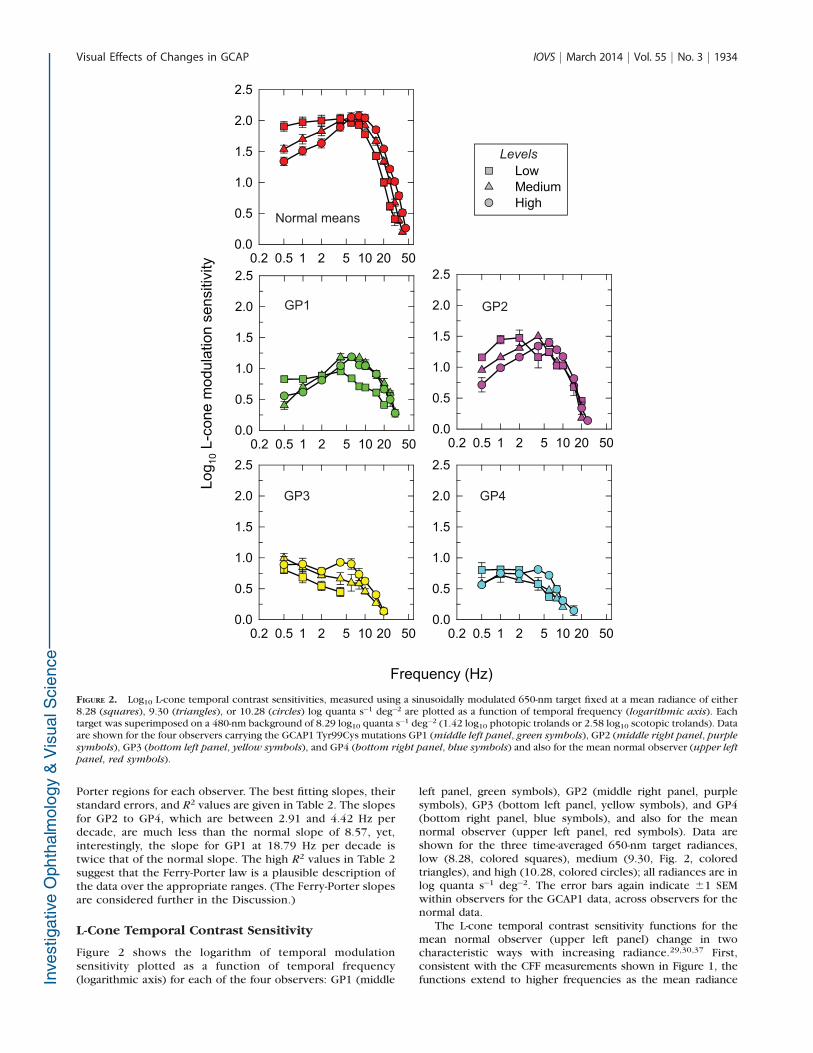
Figure 2 shows the logarithm of temporal modulationsensitivity plotted as a function of temporal frequency(logarithmic axis) for each of the four observers: GP1 (middle
left panel, green symbols), GP2 (middle right panel, purplesymbols), GP3 (bottom left panel, yellow symbols), and GP4(bottom right panel, blue symbols), and also for the meannormal observer (upper left panel, red symbols). Data areshown for the three time-averaged 650-nm target radiances,low (8.28, colored squares), medium (9.30, Fig. 2, coloredtriangles), and high (10.28, colored circles); all radiances are inlog quanta s�1 deg�2. The error bars again indicate 61 SEMwithin observers for the GCAP1 data, across observers for thenormal data.
The L-cone temporal contrast sensitivity functions for themean normal observer (upper left panel) change in twocharacteristic ways with increasing radiance.29,30,37 First,consistent with the CFF measurements shown in Figure 1, thefunctions extend to higher frequencies as the mean radiance
FIGURE 2. Log10 L-cone temporal contrast sensitivities, measured using a sinusoidally modulated 650-nm target fixed at a mean radiance of either8.28 (squares), 9.30 (triangles), or 10.28 (circles) log quanta s�1 deg�2 are plotted as a function of temporal frequency (logarithmic axis). Eachtarget was superimposed on a 480-nm background of 8.29 log10 quanta s�1 deg�2 (1.42 log10 photopic trolands or 2.58 log10 scotopic trolands). Dataare shown for the four observers carrying the GCAP1 Tyr99Cys mutations GP1 (middle left panel, green symbols), GP2 (middle right panel, purple
symbols), GP3 (bottom left panel, yellow symbols), and GP4 (bottom right panel, blue symbols) and also for the mean normal observer (upper left
panel, red symbols).
Visual Effects of Changes in GCAP IOVS j March 2014 j Vol. 55 j No. 3 j 1934
increases from low to high. The improvements in high-frequency sensitivity are usually attributed to a speeding up ofthe visual response caused by shortening time constants.38–41
Second, there is an increasing loss of sensitivity at lowfrequencies as the radiance increases; the functions changefrom being relatively horizontal at low frequencies in the low-radiance case (Fig. 1, squares), a shape known as ‘‘low-pass,’’ tohaving a sensitivity loss at both low and high frequencies, ashape known as ‘‘band-pass,’’ in the high-radiance case (Fig. 1,circles). The bandpass shape is found in both temporal andspatial contrast sensitivity functions and the low-frequencyattenuation is usually attributed to surround antagonism42–47 butcould also result from feedback within the photo receptors.
The L-cone temporal contrast sensitivities in Figure 2 for theobservers with Tyr99Cys mutant GCAP1 fall well below thenormal sensitivities at all three mean radiances at allfrequencies. (These differences are more clearly apparent inFig. 4, in which the sensitivity losses are plotted relative to thenormal.) Despite the losses, some of the changes betweenlevels in the mutant observers have characteristics similar tothose in the normal observers. In particular, there is a tendencyfor high-frequency sensitivity to improve as the radiance levelincreases, which suggests that, as in normal observers, thephotoreceptor response speeds up as the light level increases.Also, for the younger observers GP1 and GP2, there is atendency to show a low-frequency loss that increases withtarget radiance. No reliable effect of radiance at lowfrequencies is seen for the older observers GP3 and GP4.
Like the CFF data, the overall sensitivity losses increase inorder of age from GP1 to GP4. One notable exception is that,although GP1 is more sensitive than GP2 at high temporalfrequencies (consistent with the CFF data), the reverse is thecase at lower frequencies. The sensitivity losses for GP2relative to those of normal observers increase from approxi-mately 0.5 to 1.0 log10 unit with increasing frequency. Thelosses for GP1 relative to those in normal observers are
approximately 1.0 log10 unit at low frequencies but thendecrease slightly with increasing frequency. The losses for GP3and GP4 are between 0.5 and 1.2 log10 unit at low frequenciesand increase markedly with increasing frequency.
We consider the relative losses of all the affected observersin more detail after we describe developing the model toaccount for the losses in the next section.
DISCUSSION
L-Cone Critical Flicker Fusion
As noted above, the L-cone CFF functions first plotted in Figure1 and replotted in Figure 3 over a slightly smaller range showthat the affected observers require more light to detect theflickering target by at least a factor of 10 times greater thannormal. The other characteristic change in the older GCAP1mutant observers is that their Ferry-Porter slopes are muchshallower than normal (Table 2). Yet, intriguingly, the slope inthe youngest GCAP1 mutant observer is steeper than normal.How can we interpret these changes in slopes?
The steepness of the Ferry-Porter slope can be comparedwith the high-frequency slope of temporal modulationfunctions plotted as log modulation sensitivity versus linearfrequency (rather than compared to log frequency as shown inFig. 2) simply by rotating the CFF versus log radiance plotclockwise by 908.48,49 Given that the high-frequency slope oftemporal modulation function is related to the speed of thephotoreceptor response,28,29,31 we might expect a decrease inthe Ferry-Porter slopes for our central 48 data to correlate withan increase in the high-frequency slope of the contrastsensitivity function and thus be consistent with a slowingdown of the visual response. Conversely, we might expect anincrease in the Ferry-Porter slope to correlate with a decreasein the high-frequency slope of the contrast sensitivity functionand, thus, with a speeding up of the visual response.Consequently, in the youngest GCAP1 mutant observer inwhom the Ferry-Porter slope increases, we would predict ashallower high-frequency modulation sensitivity slope and aspeeding up of the response relative to that of normalobservers; and in the older affected observers, we wouldpredict a steeper high-frequency slope and a slowing downrelative to that of normal observers. These predictions areborne out in the temporal contrast sensitivity data and in theanalyses given in the next section.
The Ferry-Porter slopes for the affected individuals (withthe exception of GP1) are relatively similar (Table 2), so thatwe can simplify and quantify the progressive loss by assumingthat they share a common Ferry-Porter slope. (Given thesimilar CFF slope for GP1 found above a target radiance of 8.5log quanta s�1 deg�2, we also included that region of the GP1’sCFF data in the analysis.) We can then characterize the
FIGURE 3. L-cone critical flicker fusion frequencies (Hz, linear scale)for the Tyr99Cys mutant GCAP1 observers replotted using the samesymbols as in Figure 1. The blue lines fitted to the affected CFF data atradiances where the Ferry-Porter law holds (see text for details) arelines with a common Ferry-Porter slope shifted vertically to fit the CFFdata for each observer. The common best fitting slope is 3.86 Hz perdecade, and the best fitting vertical shifts relative to the fit for GP1 arenoted in the figure. Outside the Ferry-Porter regions, the CFF data arejoined by thin lines. See Table 3 for more information.
TABLE 3. Best Fitting Vertical Shifts, Common Ferry-Porter Slope, andR2 Value for the CFF Versus Log Radiance Data for the AffectedObservers at Radiances Where the Ferry-Porter Law Holds
Subject Relative Shift Ferry-Porter Slope R2
GP1 0.00 6 1.85
3.86 6 0.20 0.992GP2 8.36 6 1.88
GP3 15.50 6 1.88
GP4 18.90 6 1.85
Data are the best fitting vertical shifts 6 SEM, in Hz, common Ferry-Porter slopes 6 SEM, in Hz per decade, and R2 values for the fit to theCFF versus log radiance data for the affected observers at radianceswhere the Ferry-Porter law holds.
Visual Effects of Changes in GCAP IOVS j March 2014 j Vol. 55 j No. 3 j 1935
increasing losses among the affected observers as vertical shiftsin CFF (Hz). We estimated the shifts by simultaneously fitting aline of the same slope to the CFF data for all affected observersover their assumed Ferry-Porter ranges. The best-fitting lineswith a common slope of 3.86 Hz per decade are plotted inFigure 3 as blue lines, and the vertical shifts relative to the fitfor GP1 are also noted in the figure. The best fitting-parametersand their standard errors are given in Table 3. The R2 value, ameasure of the goodness of the fit, is 0.992 suggesting that thesimplification of having a common slope and accounting forthe damage or loss as vertical shifts in CFF is a plausibledescription of the data; yet, precisely how the loss in CFF in Hzcan be related to the underlying photoreceptor loss or damagein these observers is less certain. The fact that the Ferry-Porterslope is approximately constant suggests that the form of theresidual underlying visual response does not change near CFFdespite the progressive damage with age. As noted above, ashallower Ferry-Porter slope in Hz per decade implies a steeperloss in contrast sensitivity at higher temporal frequencies,
which is consistent with the damage resulting in a moresluggish visual response. We now address the differences insensitivity between normal and affected observers.
L-Cone Temporal Contrast Sensitivity
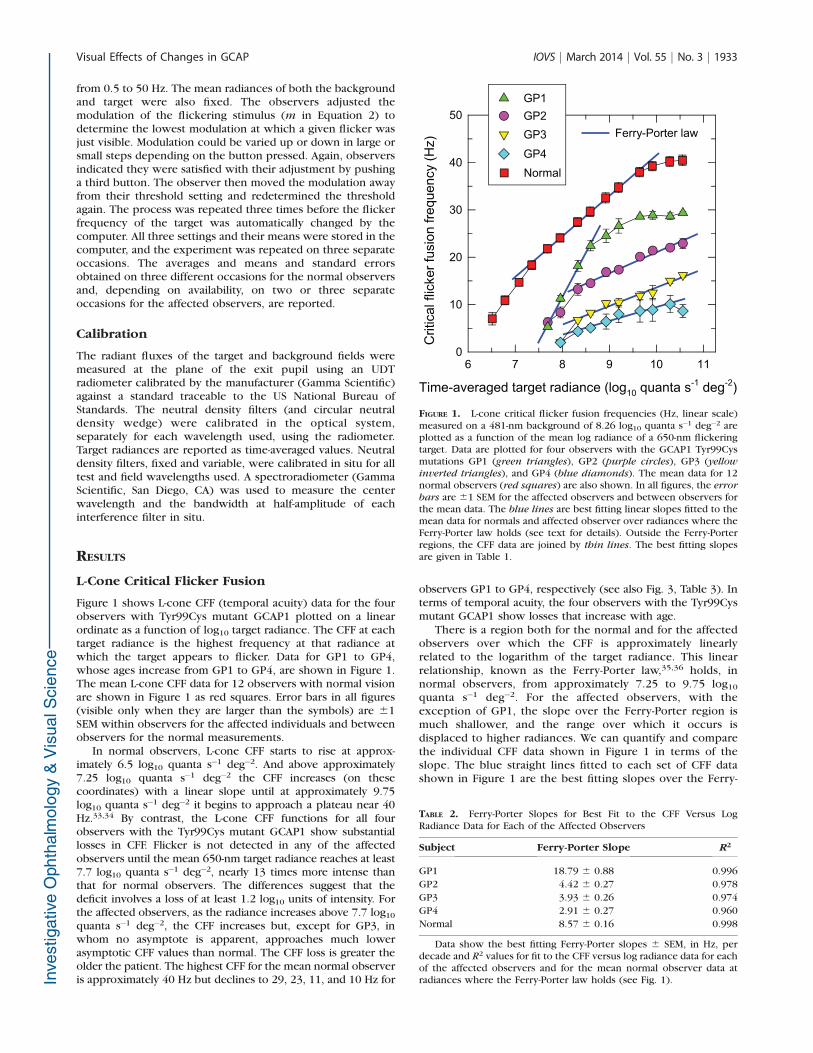
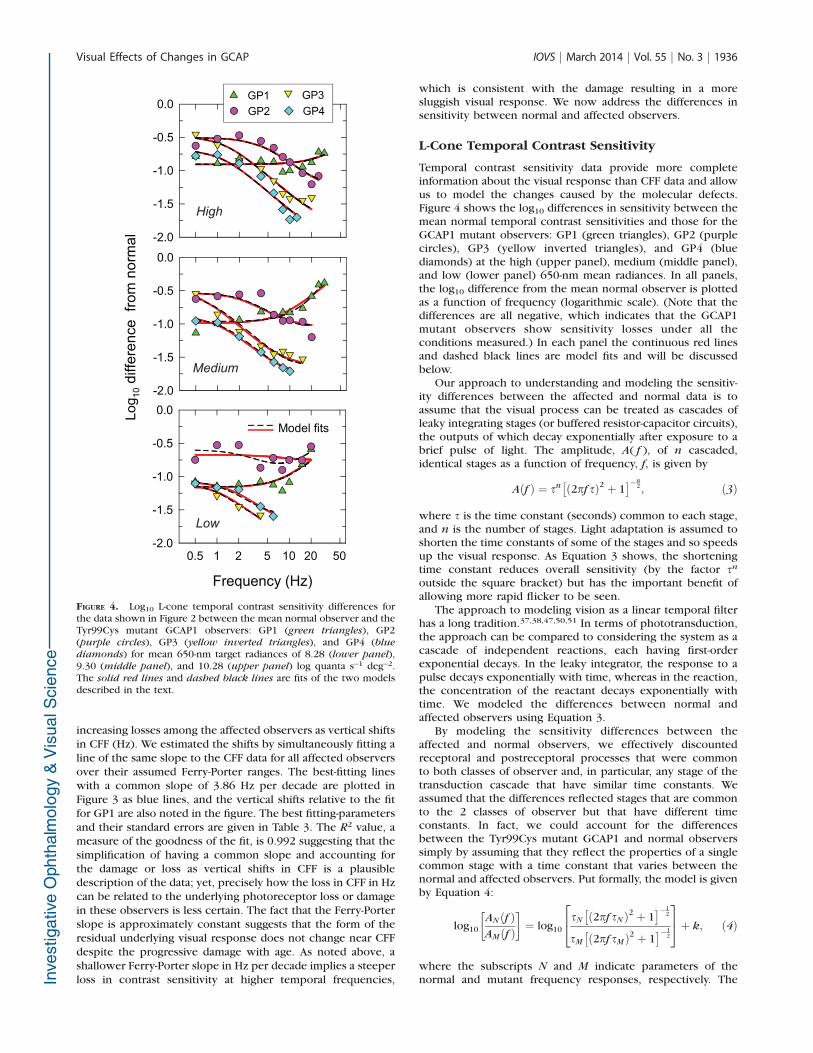
Temporal contrast sensitivity data provide more completeinformation about the visual response than CFF data and allowus to model the changes caused by the molecular defects.Figure 4 shows the log10 differences in sensitivity between themean normal temporal contrast sensitivities and those for theGCAP1 mutant observers: GP1 (green triangles), GP2 (purplecircles), GP3 (yellow inverted triangles), and GP4 (bluediamonds) at the high (upper panel), medium (middle panel),and low (lower panel) 650-nm mean radiances. In all panels,the log10 difference from the mean normal observer is plottedas a function of frequency (logarithmic scale). (Note that thedifferences are all negative, which indicates that the GCAP1mutant observers show sensitivity losses under all theconditions measured.) In each panel the continuous red linesand dashed black lines are model fits and will be discussedbelow.
Our approach to understanding and modeling the sensitiv-ity differences between the affected and normal data is toassume that the visual process can be treated as cascades ofleaky integrating stages (or buffered resistor-capacitor circuits),the outputs of which decay exponentially after exposure to abrief pulse of light. The amplitude, A( f ), of n cascaded,identical stages as a function of frequency, f, is given by
Aðf Þ ¼ sn ð2pf sÞ2 þ 1� ��n
2; ð3Þ
where s is the time constant (seconds) common to each stage,and n is the number of stages. Light adaptation is assumed toshorten the time constants of some of the stages and so speedsup the visual response. As Equation 3 shows, the shorteningtime constant reduces overall sensitivity (by the factor sn
outside the square bracket) but has the important benefit ofallowing more rapid flicker to be seen.
The approach to modeling vision as a linear temporal filterhas a long tradition.37,38,47,50,51 In terms of phototransduction,the approach can be compared to considering the system as acascade of independent reactions, each having first-orderexponential decays. In the leaky integrator, the response to apulse decays exponentially with time, whereas in the reaction,the concentration of the reactant decays exponentially withtime. We modeled the differences between normal andaffected observers using Equation 3.
By modeling the sensitivity differences between theaffected and normal observers, we effectively discountedreceptoral and postreceptoral processes that were commonto both classes of observer and, in particular, any stage of thetransduction cascade that have similar time constants. Weassumed that the differences reflected stages that are commonto the 2 classes of observer but that have different timeconstants. In fact, we could account for the differencesbetween the Tyr99Cys mutant GCAP1 and normal observerssimply by assuming that they reflect the properties of a singlecommon stage with a time constant that varies between thenormal and affected observers. Put formally, the model is givenby Equation 4:
log10
ANðf ÞAMðf Þ
� �¼ log10
sN ð2pf sN Þ2 þ 1� ��1
2
sM ð2pf sMÞ2 þ 1� ��1
2
24
35þ k; ð4Þ
where the subscripts N and M indicate parameters of thenormal and mutant frequency responses, respectively. The
FIGURE 4. Log10 L-cone temporal contrast sensitivity differences forthe data shown in Figure 2 between the mean normal observer and theTyr99Cys mutant GCAP1 observers: GP1 (green triangles), GP2(purple circles), GP3 (yellow inverted triangles), and GP4 (blue
diamonds) for mean 650-nm target radiances of 8.28 (lower panel),9.30 (middle panel), and 10.28 (upper panel) log quanta s�1 deg�2.The solid red lines and dashed black lines are fits of the two modelsdescribed in the text.
Visual Effects of Changes in GCAP IOVS j March 2014 j Vol. 55 j No. 3 j 1936
value of k represents a frequency-independent change inoverall sensitivity of the GCAP1 mutant observers relative tothat of normals (which as negative values corresponds to avertical shift down the logarithmic ordinate of Fig. 4).
At each level, the model was fitted simultaneously acrossthe four observers with a single best fitting time constant (sN)for the normal observer, relative to which the best fitting timeconstant (sM) and shift (k) values could be determined for eachaffected observer. (The time constants, generally, were limitedto a lower value of 1.59 ms because decreasing them belowthis value produces frequency-independent shifts in logsensitivity over the measured frequency range that are nearlyequivalent to increasing k, making joint fits of s and k unstable.For the fits in Fig. 4 it was necessary to limit sM to 1.59 ms onlyfor GP1.)
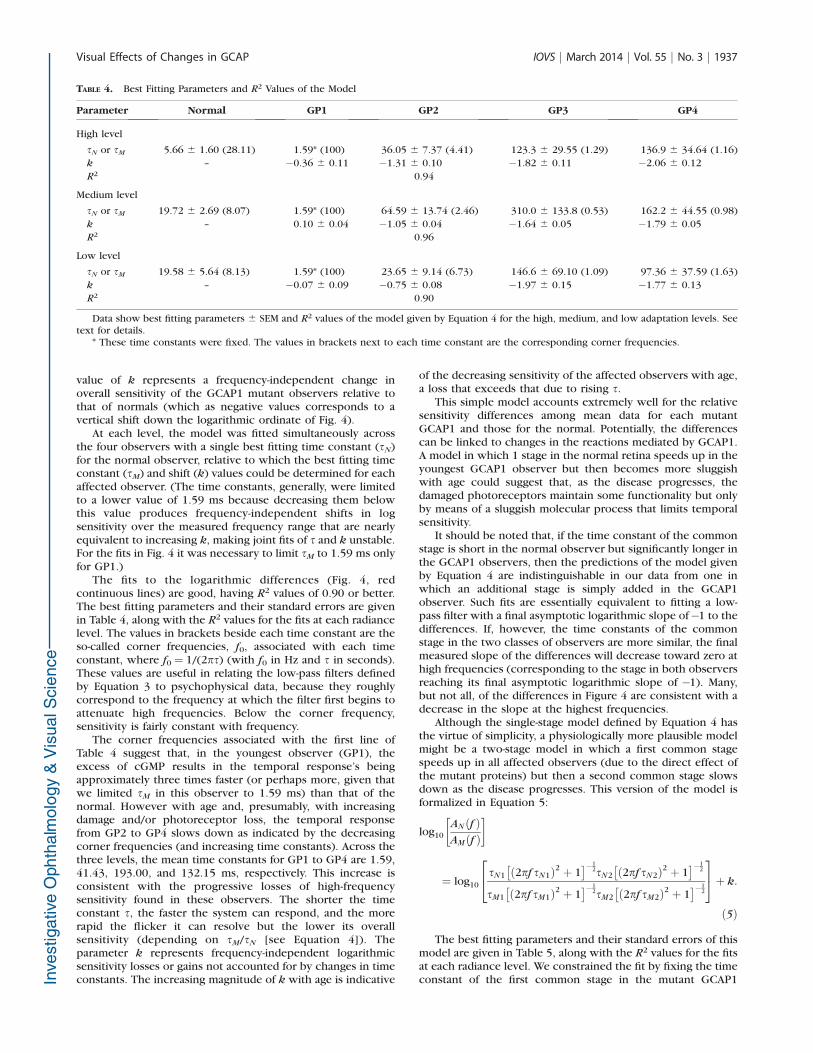
The fits to the logarithmic differences (Fig. 4, redcontinuous lines) are good, having R2 values of 0.90 or better.The best fitting parameters and their standard errors are givenin Table 4, along with the R2 values for the fits at each radiancelevel. The values in brackets beside each time constant are theso-called corner frequencies, f0, associated with each timeconstant, where f0¼ 1/(2ps) (with f0 in Hz and s in seconds).These values are useful in relating the low-pass filters definedby Equation 3 to psychophysical data, because they roughlycorrespond to the frequency at which the filter first begins toattenuate high frequencies. Below the corner frequency,sensitivity is fairly constant with frequency.
The corner frequencies associated with the first line ofTable 4 suggest that, in the youngest observer (GP1), theexcess of cGMP results in the temporal response’s beingapproximately three times faster (or perhaps more, given thatwe limited sM in this observer to 1.59 ms) than that of thenormal. However with age and, presumably, with increasingdamage and/or photoreceptor loss, the temporal responsefrom GP2 to GP4 slows down as indicated by the decreasingcorner frequencies (and increasing time constants). Across thethree levels, the mean time constants for GP1 to GP4 are 1.59,41.43, 193.00, and 132.15 ms, respectively. This increase isconsistent with the progressive losses of high-frequencysensitivity found in these observers. The shorter the timeconstant s, the faster the system can respond, and the morerapid the flicker it can resolve but the lower its overallsensitivity (depending on sM/sN [see Equation 4]). Theparameter k represents frequency-independent logarithmicsensitivity losses or gains not accounted for by changes in timeconstants. The increasing magnitude of k with age is indicative
of the decreasing sensitivity of the affected observers with age,a loss that exceeds that due to rising s.
This simple model accounts extremely well for the relativesensitivity differences among mean data for each mutantGCAP1 and those for the normal. Potentially, the differencescan be linked to changes in the reactions mediated by GCAP1.A model in which 1 stage in the normal retina speeds up in theyoungest GCAP1 observer but then becomes more sluggishwith age could suggest that, as the disease progresses, thedamaged photoreceptors maintain some functionality but onlyby means of a sluggish molecular process that limits temporalsensitivity.
It should be noted that, if the time constant of the commonstage is short in the normal observer but significantly longer inthe GCAP1 observers, then the predictions of the model givenby Equation 4 are indistinguishable in our data from one inwhich an additional stage is simply added in the GCAP1observer. Such fits are essentially equivalent to fitting a low-pass filter with a final asymptotic logarithmic slope of�1 to thedifferences. If, however, the time constants of the commonstage in the two classes of observers are more similar, the finalmeasured slope of the differences will decrease toward zero athigh frequencies (corresponding to the stage in both observersreaching its final asymptotic logarithmic slope of �1). Many,but not all, of the differences in Figure 4 are consistent with adecrease in the slope at the highest frequencies.
Although the single-stage model defined by Equation 4 hasthe virtue of simplicity, a physiologically more plausible modelmight be a two-stage model in which a first common stagespeeds up in all affected observers (due to the direct effect ofthe mutant proteins) but then a second common stage slowsdown as the disease progresses. This version of the model isformalized in Equation 5:
log10
ANðf ÞAMðf Þ
� �
¼ log10
sN1 ð2pf sN1Þ2 þ 1� ��1
2sN2 ð2pf sN2Þ2 þ 1� ��1
2
sM1 ð2pf sM1Þ2 þ 1� ��1
2sM2 ð2pf sM2Þ2 þ 1� ��1
2
24
35þ k:
ð5Þ
The best fitting parameters and their standard errors of thismodel are given in Table 5, along with the R2 values for the fitsat each radiance level. We constrained the fit by fixing the timeconstant of the first common stage in the mutant GCAP1
TABLE 4. Best Fitting Parameters and R2 Values of the Model
Parameter Normal GP1 GP2 GP3 GP4
High level
sN or sM 5.66 6 1.60 (28.11) 1.59* (100) 36.05 6 7.37 (4.41) 123.3 6 29.55 (1.29) 136.9 6 34.64 (1.16)
k – �0.36 6 0.11 �1.31 6 0.10 �1.82 6 0.11 �2.06 6 0.12
R2 0.94
Medium level
sN or sM 19.72 6 2.69 (8.07) 1.59* (100) 64.59 6 13.74 (2.46) 310.0 6 133.8 (0.53) 162.2 6 44.55 (0.98)
k – 0.10 6 0.04 �1.05 6 0.04 �1.64 6 0.05 �1.79 6 0.05
R2 0.96
Low level
sN or sM 19.58 6 5.64 (8.13) 1.59* (100) 23.65 6 9.14 (6.73) 146.6 6 69.10 (1.09) 97.36 6 37.59 (1.63)
k – �0.07 6 0.09 �0.75 6 0.08 �1.97 6 0.15 �1.77 6 0.13
R2 0.90
Data show best fitting parameters 6 SEM and R2 values of the model given by Equation 4 for the high, medium, and low adaptation levels. Seetext for details.
* These time constants were fixed. The values in brackets next to each time constant are the corresponding corner frequencies.
Visual Effects of Changes in GCAP IOVS j March 2014 j Vol. 55 j No. 3 j 1937
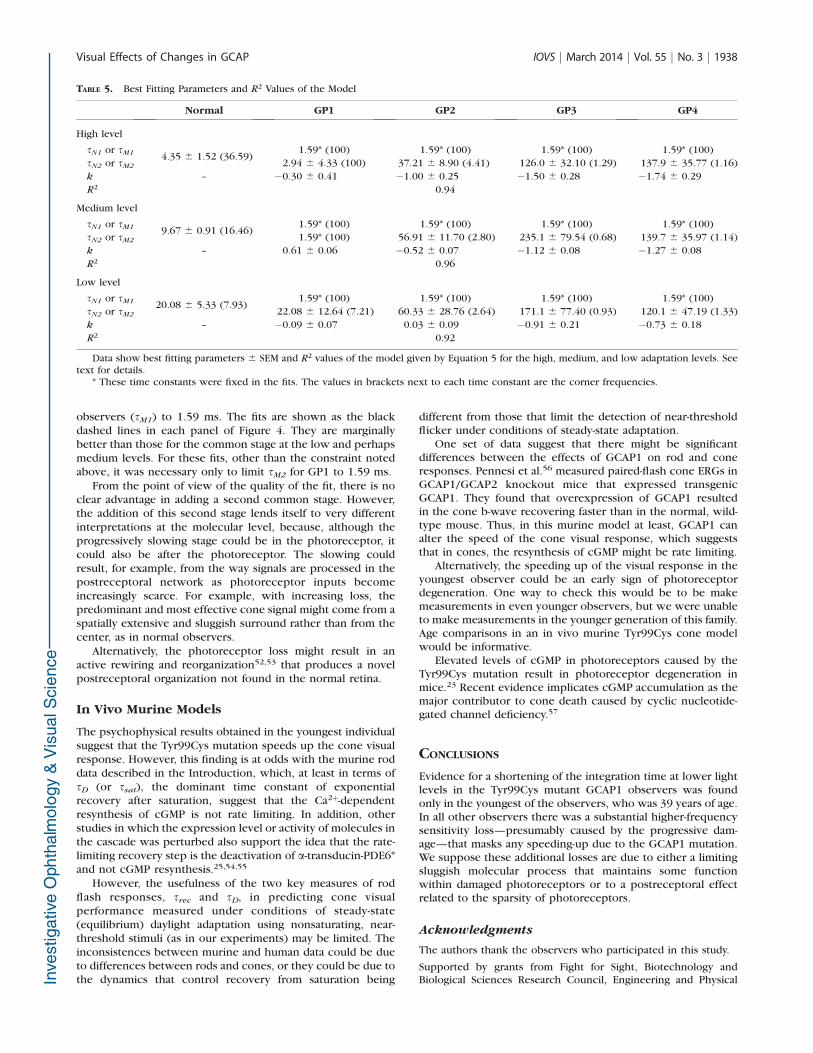
observers (sM1) to 1.59 ms. The fits are shown as the blackdashed lines in each panel of Figure 4. They are marginallybetter than those for the common stage at the low and perhapsmedium levels. For these fits, other than the constraint notedabove, it was necessary only to limit sM2 for GP1 to 1.59 ms.
From the point of view of the quality of the fit, there is noclear advantage in adding a second common stage. However,the addition of this second stage lends itself to very differentinterpretations at the molecular level, because, although theprogressively slowing stage could be in the photoreceptor, itcould also be after the photoreceptor. The slowing couldresult, for example, from the way signals are processed in thepostreceptoral network as photoreceptor inputs becomeincreasingly scarce. For example, with increasing loss, thepredominant and most effective cone signal might come from aspatially extensive and sluggish surround rather than from thecenter, as in normal observers.
Alternatively, the photoreceptor loss might result in anactive rewiring and reorganization52,53 that produces a novelpostreceptoral organization not found in the normal retina.
In Vivo Murine Models
The psychophysical results obtained in the youngest individualsuggest that the Tyr99Cys mutation speeds up the cone visualresponse. However, this finding is at odds with the murine roddata described in the Introduction, which, at least in terms ofsD (or ssat), the dominant time constant of exponentialrecovery after saturation, suggest that the Ca2þ-dependentresynthesis of cGMP is not rate limiting. In addition, otherstudies in which the expression level or activity of molecules inthe cascade was perturbed also support the idea that the rate-limiting recovery step is the deactivation of a-transducin-PDE6*and not cGMP resynthesis.25,54,55
However, the usefulness of the two key measures of rodflash responses, srec and sD, in predicting cone visualperformance measured under conditions of steady-state(equilibrium) daylight adaptation using nonsaturating, near-threshold stimuli (as in our experiments) may be limited. Theinconsistences between murine and human data could be dueto differences between rods and cones, or they could be due tothe dynamics that control recovery from saturation being
different from those that limit the detection of near-thresholdflicker under conditions of steady-state adaptation.
One set of data suggest that there might be significantdifferences between the effects of GCAP1 on rod and coneresponses. Pennesi et al.56 measured paired-flash cone ERGs inGCAP1/GCAP2 knockout mice that expressed transgenicGCAP1. They found that overexpression of GCAP1 resultedin the cone b-wave recovering faster than in the normal, wild-type mouse. Thus, in this murine model at least, GCAP1 canalter the speed of the cone visual response, which suggeststhat in cones, the resynthesis of cGMP might be rate limiting.
Alternatively, the speeding up of the visual response in theyoungest observer could be an early sign of photoreceptordegeneration. One way to check this would be to be makemeasurements in even younger observers, but we were unableto make measurements in the younger generation of this family.Age comparisons in an in vivo murine Tyr99Cys cone modelwould be informative.
Elevated levels of cGMP in photoreceptors caused by theTyr99Cys mutation result in photoreceptor degeneration inmice.23 Recent evidence implicates cGMP accumulation as themajor contributor to cone death caused by cyclic nucleotide-gated channel deficiency.57
CONCLUSIONS
Evidence for a shortening of the integration time at lower lightlevels in the Tyr99Cys mutant GCAP1 observers was foundonly in the youngest of the observers, who was 39 years of age.In all other observers there was a substantial higher-frequencysensitivity loss—presumably caused by the progressive dam-age—that masks any speeding-up due to the GCAP1 mutation.We suppose these additional losses are due to either a limitingsluggish molecular process that maintains some functionwithin damaged photoreceptors or to a postreceptoral effectrelated to the sparsity of photoreceptors.
Acknowledgments
The authors thank the observers who participated in this study.
Supported by grants from Fight for Sight, Biotechnology andBiological Sciences Research Council, Engineering and Physical
TABLE 5. Best Fitting Parameters and R2 Values of the Model
Normal GP1 GP2 GP3 GP4
High level
sN1 or sM1 4.35 6 1.52 (36.59)1.59* (100) 1.59* (100) 1.59* (100) 1.59* (100)
sN2 or sM2 2.94 6 4.33 (100) 37.21 6 8.90 (4.41) 126.0 6 32.10 (1.29) 137.9 6 35.77 (1.16)
k – �0.30 6 0.41 �1.00 6 0.25 �1.50 6 0.28 �1.74 6 0.29
R2 0.94
Medium level
sN1 or sM1 9.67 6 0.91 (16.46)1.59* (100) 1.59* (100) 1.59* (100) 1.59* (100)
sN2 or sM2 1.59* (100) 56.91 6 11.70 (2.80) 235.1 6 79.54 (0.68) 139.7 6 35.97 (1.14)
k – 0.61 6 0.06 �0.52 6 0.07 �1.12 6 0.08 �1.27 6 0.08
R2 0.96
Low level
sN1 or sM1 20.08 6 5.33 (7.93)1.59* (100) 1.59* (100) 1.59* (100) 1.59* (100)
sN2 or sM2 22.08 6 12.64 (7.21) 60.33 6 28.76 (2.64) 171.1 6 77.40 (0.93) 120.1 6 47.19 (1.33)
k – �0.09 6 0.07 0.03 6 0.09 �0.91 6 0.21 �0.73 6 0.18
R2 0.92
Data show best fitting parameters 6 SEM and R2 values of the model given by Equation 5 for the high, medium, and low adaptation levels. Seetext for details.
* These time constants were fixed in the fits. The values in brackets next to each time constant are the corner frequencies.
Visual Effects of Changes in GCAP IOVS j March 2014 j Vol. 55 j No. 3 j 1938
Sciences Research Council, Moorfields Eye Hospital SpecialTrustees, and National Institutes for Health Research BiomedicalResearch Centre at Moorfields Eye Hospital, NHS Foundation Trustand UCL Institute of Ophthalmology; a Foundation FightingBlindness Research Center grant for the Study of RetinalDegenerative Diseases (ARW, ATM, and MM); and a FoundationFighting Blindness Career Development Award (MM).
Disclosure: A. Stockman, None; G.B. Henning, None; A.T.Moore, None; A.R. Webster, None; M. Michaelides, None; C.Ripamonti, None
References
1. Perlman I, Normann RA. Light adaptation and sensitivitycontrolling mechanisms in vertebrate photoreceptors. Prog
Retin Eye Res. 1998;17:523–563.
2. Pugh EN Jr, Nikonov S, Lamb TD. Molecular mechanisms ofvertebrate photoreceptor light adaptation. Cur Opin Neuro-
biol. 1999;9:410–418.
3. Pugh EN Jr, Lamb TD. Phototransduction in vertebrate rodsand cones: molecular mechanisms of amplification, recoveryand light adaptation. In: Stavenga DG, de Grip WJ, Pugh EN,eds. Handbook of Biological Physics: Molecular Mechanisms
in Visual Transduction. Vol. 3. Amsterdam: Elsevier; 2000:183–255.
4. Burns ME, Baylor DA. Activation, deactivation and adaptationin vertebrate photoreceptor cells. Annu Rev Neurosci. 2001;24:779–805.
5. Arshavsky VY, Lamb TD, Pugh EN Jr. G proteins andphototransduction. Annu Rev Physiol. 2002;64:153–187.
6. Fain GL, Matthews HR, Cornwall MC, Koutalos Y. Adaptationin vertebrate photoreceptors. Physiol Rev. 2001;80:117–151.
7. Burns ME, Mendez A, Chen J, Baylor DA. Dynamics of cyclicGMP synthesis in retinal rods. Neuron. 2002;36:81–91.
8. Liu X, Seno K, Nishizawa Y, et al. Ultrastructural localization ofretinal guanylate cyclase in human and monkey retinas. Exp
Eye Res. 1994;59:761–768.
9. Yang RB, Foster DC, Garbers DL, Fulle HJ. Two membraneforms of guanylyl cyclase found in the eye. Proc Natl Acad Sci
U S A. 1995;92:602–606.
10. Dizhoor AM, Olshevskaya EV, Henzel WJ, et al. Cloning,sequencing, and expression of a 24-kDa Ca2þ-binding proteinactivating photoreceptor guanylyl cyclase. J Biol Chem. 1995;270:25200–25206.
11. Gorczyca WA, Polans AS, Surgucheva IG, Subbaraya I, Baehr W,Palczewski K. Guanylyl cyclase activating protein. A calcium-sensitive regulator of phototransduction. J Biol Chem. 1995;270:22029–22036.
12. Imanishi Y, Li N, Sokal I, et al. Characterization of retinalguanylate cyclase-activating protein 3 (GCAP3) from zebrafishto man. Eur J Neurosci. 2002;15:63–78.
13. Payne AM, Downes SM, Bessant DA, et al. A mutation inguanylate cyclase activator 1A (GUCA1A) in an autosomaldominant cone dystrophy pedigree mapping to a new locuson chromosome 6p21.1. Hum Mol Genet. 1998;7:273–277.
14. Cuenca N, Lopez S, Howes K, Kolb H. The localization ofguanylyl cyclase-activating proteins in the mammalian retina.Invest Ophthalmol Vis Sci. 1998;39:1243–1250.
15. Dizhoor AM, Lowe DG, Olshevskaya EV, Laura RP, Hurley JB.The human photoreceptor membrane guanylyl cyclase,RetGC, is present in outer segments and is regulated bycalcium and a soluble activator. Neuron. 1994;12:1345–1352.
16. Ermilov AN, Olshevskaya EV, Dizhoor AM. Instead of bindingcalcium, one of the EF-hand structures in guanylyl cyclaseactivating protein-2 is required for targeting photoreceptorguanylyl cyclase. J Biol Chem. 2001;276:48143–48148.
17. Hunt DM, Buch P, Michaelides M. Guanylate cyclases andassociated activator proteins in retinal disease. Mol Cell
Biochem. 2010;334:157–168.
18. Dizhoor AM, Boikov SG, Olshevskaya EV. Constitutive activa-tion of photoreceptor guanylate cyclase by Y99C mutant ofGCAP-1. Possible role in causing human autosomal dominantcone degeneration. J Biol Chem. 1998;273:17311–17314.
19. Sokal I, Li N, Surgucheva I, et al. GCAP1 (Y99C) mutant isconstitutively active in autosomal dominant cone dystrophy.Mol Cell. 1998;2:129–133.
20. Downes SM, Holder GE, Fitzke FW, et al. Autosomal dominantcone and cone-rod dystrophy with mutations in the guanylatecyclase activator 1A gene-encoding guanylate cyclase activat-ing protein-1. Arch Ophthalmol. 2001;119:96–105.
21. Michaelides M, Wilkie SE, Jenkins S, et al. Mutation in the geneGUCA1A, encoding guanylate cyclase-activating protein 1,causes cone, cone-rod, and macular dystrophy. Ophthalmol-
ogy. 2005;112:1442–1447.
22. Michaelides M, Hardcastle AJ, Hunt DM, Moore AT. Progressivecone and cone-rod dystrophies: phenotypes and underlyingmolecular genetic basis. Surv Ophthalmol. 2006;51:232–258.
23. Olshevskaya EV, Calvert PD, Woodruff ML, et al. The Y99Cmutation in guanylyl cyclase-activating protein 1 increasesintracellular Ca2þ and causes photoreceptor degeneration intransgenic mice. J Neurosci. 2004;24:6078–6085.
24. Mendez A, Burns ME, Sokal I, et al. Role of guanylate cyclase-activating proteins (GCAPs) in setting the flash sensitivity ofrod photoreceptors. Proc Natl Acad Sci U S A. 2001;98:9948–9953.
25. Burns ME. Deactivation mechanisms of rod phototransduc-tion: the Cogan lecture. Invest Ophthalmol Vis Sci. 2010;51:1283–1288.
26. Lyubarsky A, Nikonov S, Pugh EN Jr. The kinetics ofinactivation of the rod phototransduction cascade withconstant Ca2þi. J Gen Physiol. 1996;107:19–34.
27. Nikonov S, Engheta N, Pugh EN Jr. Kinetics of recovery of thedark-adapted salamander rod photoresponse. J Gen Physiol.1998;111:7–37.
28. Stockman A, Langendorfer M, Smithson HE, Sharpe LT. Humancone light adaptation: from behavioral measurements tomolecular mechanisms. J Vis. 2006;6:1194–1213.
29. de Lange H. Research into the dynamic nature of the humanfovea-cortex systems with intermittent and modulated light. I.Attenuation characteristics with white and colored light. J Opt
Soc Am A Opt Image Sci Vis. 1958;48:777–784.
30. Kelly DH. Visual responses to time-dependent stimuli I.Amplitude sensitivity measurements. J Opt Soc Am A Opt
Image Sci Vis. 1961;51:422–429.
31. Roufs JAJ. Dynamic properties of vision-I. Experimentalrelationships between flicker and flash thresholds. Vision
Res. 1972;12:261–278.
32. Stockman A, Plummer DJ, Montag ED. Spectrally-opponentinputs to the human luminance pathway: slow þM and �Lcone inputs revealed by intense long-wavelength adaptation. J
Physiol. 2005;566:61–76.
33. Hecht S, Verrijp CD. The influence of intensity, color andretinal location on the fusion frequency of intermittentillumination. Proc Natl Acad Sci U S A. 1933;19:522–535.
34. Hecht S, Shlaer S. Intermittent stimulation by light. V. Therelation between intensity and critical frequency for differentparts of the spectrum. J Gen Physiol. 1936;19:965–977.
35. Ferry ES. Persistence of vision. Am J Sci. 1892;44:192–207.
36. Porter TC. Contributions to the study of flicker. Paper II. Proc
R Soc Lond. 1902;70:31–329.
37. Roufs JAJ. Dynamic properties of vision. II. Theoreticalrelationship between flicker and flash thresholds. Vision
Res. 1972;12:279–292.
Visual Effects of Changes in GCAP IOVS j March 2014 j Vol. 55 j No. 3 j 1939
38. Ives HE. A theory of intermittent vision. J Opt Soc Am A Opt
Image Sci Vis. 1922;6:343–361.
39. Fourtes MGF, Hodgkin AL. Changes in time scale andsensitivity in the ommatidia of Limulus. J Physiol. 1964;172:239–263.
40. Matin L. Critical duration, the differential luminance threshold,critical flicker frequency, and visual adaptation: a theoreticaltreatment. J Opt Soc Am A Opt Image Sci Vis. 1968;58:404–415.
41. Sperling G, Sondhi MM. Model for visual luminance discrim-ination and flicker detection. J Opt Soc Am A Opt Image Sci
Vis. 1968;58:1133–1145.
42. Schober HAW, Hilz R. Contrast sensitivity of the human eye forsquare-wave gratings. J Opt Soc Am A Opt Image Sci Vis. 1965;55:1086–1091.
43. Robson JG. Spatial and temporal contrast sensitivity functionsof the visual system. J Opt Soc Am A Opt Image Sci Vis. 1966;56:1141–1142.
44. Nachmias J. Effect of exposure duration on visual contrastsensitivity with square-wave gratings. J Opt Soc Am A Opt
Image Sci Vis. 1967;57:421–427.
45. Ratliff F, Knight BW, Toyoda J-I, Hartline HK. Enhancement offlicker by lateral inhibition. Science. 1967;158:392–393.
46. Kelly DH. Flickering patterns and lateral inhibition. J Opt Soc
Am A Opt Image Sci Vis. 1969;59:1361–1370.
47. Watson AB. Temporal sensitivity. In: Boff K, Kaufman L,Thomas J, eds. Handbook of Perception and Human
Performance. New York: Wiley; 1986:6.1–6.43.
48. Tyler CW. Analysis of visual modulation sensitivity. II.Peripheral retina and the role of photoreceptor dimensions.J Opt Soc Am A Opt Image Sci Vis. 1985;2:393–398.
49. Tyler CW, Hamer RD. Analysis of visual modulation sensitivity.IV. Validity of the Ferry-Porter law. J Opt Soc Am A Opt Image
Sci Vis. 1990;7:743–758.
50. de Lange H. Experiments on flicker and some calculations onan electrical analogue of the foveal systems. Physica. 1952;18:935–950.
51. Kelly DH. Visual responses to time-dependent stimuli II.Single-channel model of the photopic visual system. J Opt Soc
Am A Opt Image Sci Vis. 1961;51:747–754.
52. Jones BW, Watt CB, Frederick JM, et al. Retinal remodelingtriggered by photoreceptor degenerations. J Comp Neurol.2003;464:1–16.
53. Marc RE, Jones BW, Watt CB, Strettoi E. Neural remodeling inretinal degeneration. Prog Retin Eye Res. 2003;22:607–655.
54. Burns ME, Pugh EN Jr. RGS9 concentration matters in rodphototransduction. Biophys J. 2009;97:1538–1547.
55. Krispel CM, Chen D, Melling N, et al. RGS expression rate-limits recovery of rod photoresponses. Neuron. 2006;51:409–416.
56. Pennesi ME, Howes KA, Baehr W, Wu SM. Guanylate cyclase-activating protein (GCAP) 1 rescues cone recovery kinetics inGCAP1/GCAP2 knockout mice. Proc Natl Acad Sci U S A.2003;100:6783–6788.
57. Xu J, Morris L, Thapa A, et al. cGMP accumulation causesphotoreceptor degeneration in CNG channel deficiency:evidence of cGMP cytotoxicity independently of enhancedCNG channel function. J Neurosci. 2013;33:14939–14948.
Visual Effects of Changes in GCAP IOVS j March 2014 j Vol. 55 j No. 3 j 1940
Recommended


