Land Restoration / Reclamation Monitoring of 76 Opencast Coal
Mines Projects of CIL producing more than 5 mcm (Coal+OB) annually based on Satellite Data for the Year 2021
Y
E
A
R
2
0
2
1
CMPDI
Job No 561410027 1
Land Restoration / Reclamation Monitoring of 76 Opencast Coal Mines Projects of CIL producing more than 5 mcm (Coal+OB) annually based on Satellite Data for the Year
2021
March- 2022
Remote Sensing Cell Geomatics Division
CMPDI, Ranchi
CMPDI
Job No 561410027 2
CONTENTS
Executive Summary 3 1.0 Background 9 2.0 Objective 10 3.0 Methodology 10 4.0 Work plan 13 5.0 Land Reclamation in WCL 15 6.0 Land Reclamation in SECL 50 7.0 Land Reclamation in NCL 104
8.0 Land Reclamation in MCL 130
9.0 Land Reclamation in CCL 169 10.0 Land Reclamation in ECL 206
CMPDI
Job No 561410027 3
Executive Summary
1.0 Project Land restoration / reclamation monitoring of 76 opencast coal mines in different subsidiaries of Coal India Ltd. (CIL) producing 5 million cu.m. and more (Coal+OB) per year based on satellite data of year 2021 on annual basis.
2.0 Objective Objective of the land restoration / reclamation monitoring is to
assess the area under backfilling, plantation, social forestry, active mining area, water bodies, distribution of wasteland, agricultural land and forest in the leasehold area of the projects. This will help in assessing the progressive status of mined land reclamation and to take up remedial measures, if any, required for environmental protection.
3.0 Salient Findings
In the year 2021, amongst projects of different subsidiaries of Coal India Ltd. taken up for monitoring, WCL has included 4 more mines. CCL has included 8 more mines, SECL has included more 11 mines and MCL has included 2 more mine for monitoring from this year as per directive received from CIL. Some of these additional mines were previously monitored under Less than 5 mcm (Coal+OB) Category and some mines are new additions Hence, total of 76 mines were selected for monitoring this year instead of 51 mines that were monitored in the year 2020.
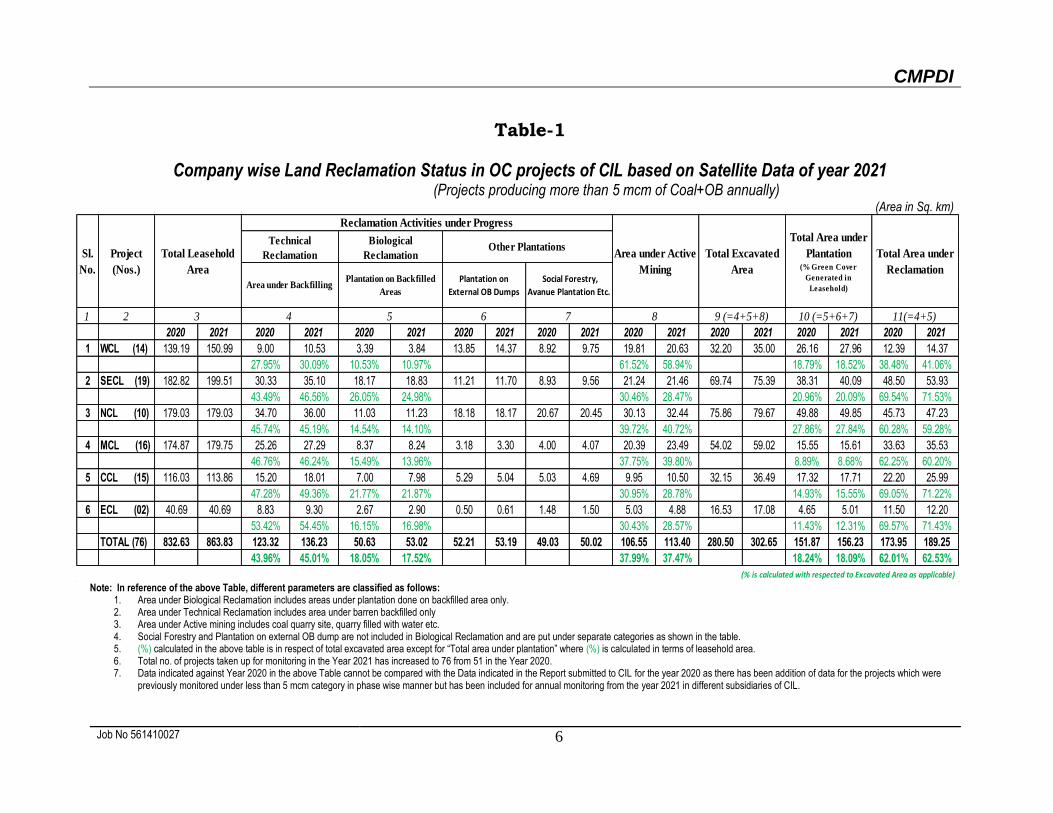
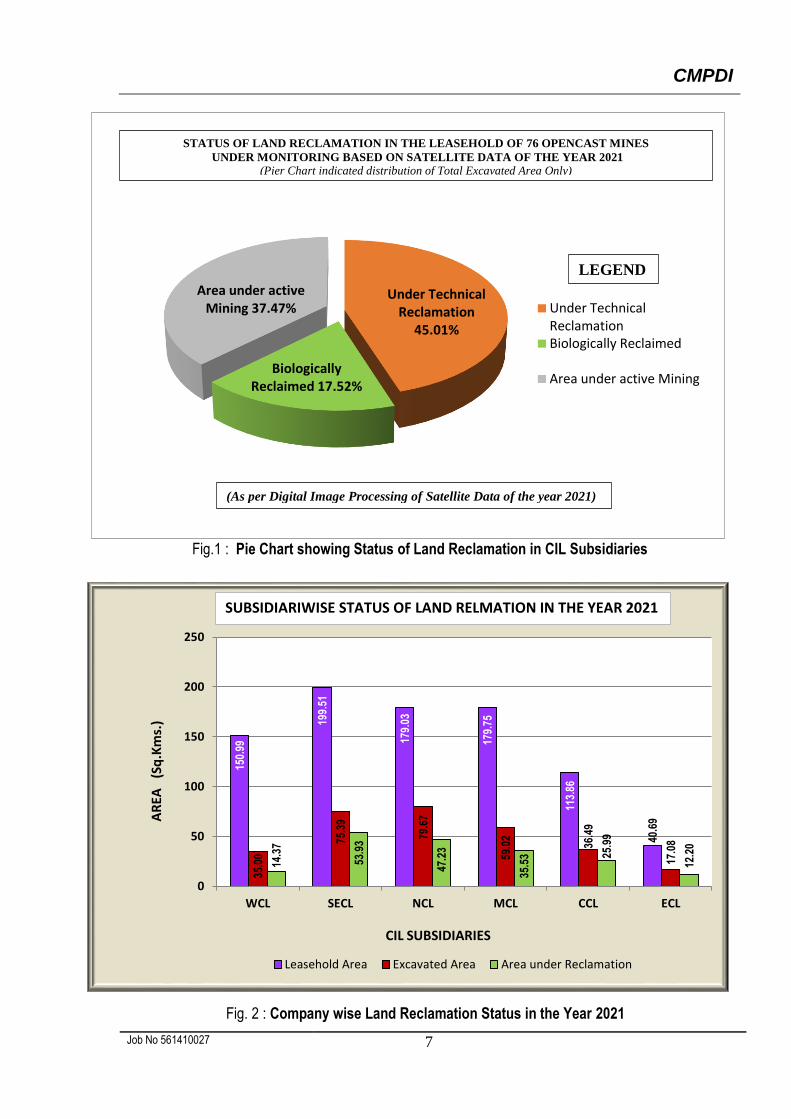
Out of the total mine leasehold area of 863.83 Km2 of the 76 OC projects considered for monitoring during 2021-22; total excavated area is 302.65 Km2; out of which 136.23 Km2 area (45.01%) is under backfilling (Technical Reclamation), 53.02 Km2 area (17.52%) has been planted (Biologically Reclaimed) and 113.40 Km2 area (37.47%) is under active mining. It is evident from the analysis that 189.25 Km2 (62.53%) area out of the total excavated area of 302.65 Km2 of the 76 OC projects is already under reclamation and balance 113.40 Km2 (37.47%) area is under active mining. Company wise details are given in Table - 1 & Fig-1.
On comparing the status of land reclamation carried out in year 2020-21 with respect to years 2021-22 in the 76 Opencast projects of different CIL subsidiaries, it is evident from the analysis of the satellite data of the year 2021 that area under land reclamation has increased from 173.95 Km2 (Yr. 2020-21) to
CMPDI
Job No 561410027 4
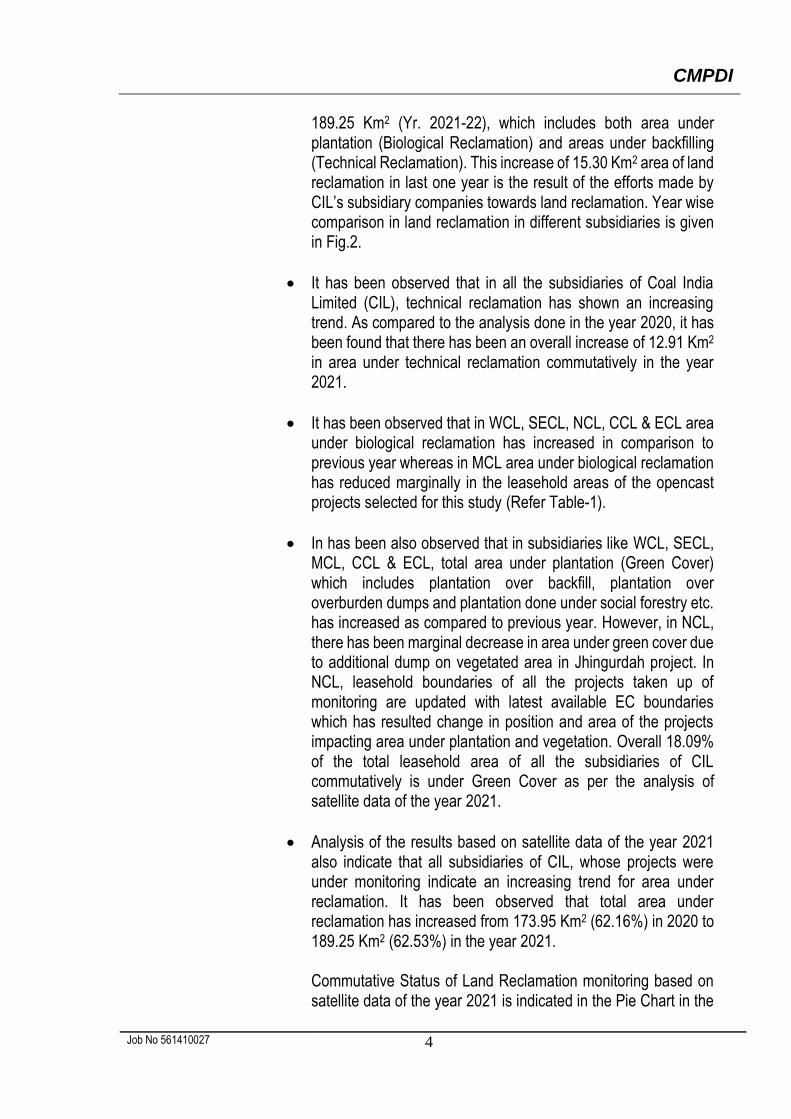
189.25 Km2 (Yr. 2021-22), which includes both area under plantation (Biological Reclamation) and areas under backfilling (Technical Reclamation). This increase of 15.30 Km2 area of land reclamation in last one year is the result of the efforts made by CIL’s subsidiary companies towards land reclamation. Year wise comparison in land reclamation in different subsidiaries is given in Fig.2.
It has been observed that in all the subsidiaries of Coal India Limited (CIL), technical reclamation has shown an increasing trend. As compared to the analysis done in the year 2020, it has been found that there has been an overall increase of 12.91 Km2 in area under technical reclamation commutatively in the year 2021.
It has been observed that in WCL, SECL, NCL, CCL & ECL area under biological reclamation has increased in comparison to previous year whereas in MCL area under biological reclamation has reduced marginally in the leasehold areas of the opencast projects selected for this study (Refer Table-1).
In has been also observed that in subsidiaries like WCL, SECL, MCL, CCL & ECL, total area under plantation (Green Cover) which includes plantation over backfill, plantation over overburden dumps and plantation done under social forestry etc. has increased as compared to previous year. However, in NCL, there has been marginal decrease in area under green cover due to additional dump on vegetated area in Jhingurdah project. In NCL, leasehold boundaries of all the projects taken up of monitoring are updated with latest available EC boundaries which has resulted change in position and area of the projects impacting area under plantation and vegetation. Overall 18.09% of the total leasehold area of all the subsidiaries of CIL commutatively is under Green Cover as per the analysis of satellite data of the year 2021.
Analysis of the results based on satellite data of the year 2021 also indicate that all subsidiaries of CIL, whose projects were under monitoring indicate an increasing trend for area under reclamation. It has been observed that total area under reclamation has increased from 173.95 Km2 (62.16%) in 2020 to 189.25 Km2 (62.53%) in the year 2021.
Commutative Status of Land Reclamation monitoring based on satellite data of the year 2021 is indicated in the Pie Chart in the
CMPDI
Job No 561410027 5
Fig. 1. Subsidiary wise status of Land Reclamation Monitoring of the projects monitored based on satellite data of the year 2021 is shown in form of Bar Chart at Fig 2. Comparison of Area under Reclamation in different subsidiaries of Coal India Limited between the years 2020 to 2021 has been shown in form of Bar- Chart in Fig 3.
CMPDI
Job No 561410027 6
Table-1
Company wise Land Reclamation Status in OC projects of CIL based on Satellite Data of year 2021 (Projects producing more than 5 mcm of Coal+OB annually)
(Area in Sq. km)
Note: In reference of the above Table, different parameters are classified as follows:
1. Area under Biological Reclamation includes areas under plantation done on backfilled area only. 2. Area under Technical Reclamation includes area under barren backfilled only 3. Area under Active mining includes coal quarry site, quarry filled with water etc. 4. Social Forestry and Plantation on external OB dump are not included in Biological Reclamation and are put under separate categories as shown in the table. 5. (%) calculated in the above table is in respect of total excavated area except for “Total area under plantation” where (%) is calculated in terms of leasehold area. 6. Total no. of projects taken up for monitoring in the Year 2021 has increased to 76 from 51 in the Year 2020. 7. Data indicated against Year 2020 in the above Table cannot be compared with the Data indicated in the Report submitted to CIL for the year 2020 as there has been addition of data for the projects which were
previously monitored under less than 5 mcm category in phase wise manner but has been included for annual monitoring from the year 2021 in different subsidiaries of CIL.
1 2
2020 2021 2020 2021 2020 2021 2020 2021 2020 2021 2020 2021 2020 2021 2020 2021 2020 2021
1 WCL (14) 139.19 150.99 9.00 10.53 3.39 3.84 13.85 14.37 8.92 9.75 19.81 20.63 32.20 35.00 26.16 27.96 12.39 14.37
27.95% 30.09% 10.53% 10.97% 61.52% 58.94% 18.79% 18.52% 38.48% 41.06%
2 SECL (19) 182.82 199.51 30.33 35.10 18.17 18.83 11.21 11.70 8.93 9.56 21.24 21.46 69.74 75.39 38.31 40.09 48.50 53.93
43.49% 46.56% 26.05% 24.98% 30.46% 28.47% 20.96% 20.09% 69.54% 71.53%
3 NCL (10) 179.03 179.03 34.70 36.00 11.03 11.23 18.18 18.17 20.67 20.45 30.13 32.44 75.86 79.67 49.88 49.85 45.73 47.23
45.74% 45.19% 14.54% 14.10% 39.72% 40.72% 27.86% 27.84% 60.28% 59.28%
4 MCL (16) 174.87 179.75 25.26 27.29 8.37 8.24 3.18 3.30 4.00 4.07 20.39 23.49 54.02 59.02 15.55 15.61 33.63 35.53
46.76% 46.24% 15.49% 13.96% 37.75% 39.80% 8.89% 8.68% 62.25% 60.20%
5 CCL (15) 116.03 113.86 15.20 18.01 7.00 7.98 5.29 5.04 5.03 4.69 9.95 10.50 32.15 36.49 17.32 17.71 22.20 25.99
47.28% 49.36% 21.77% 21.87% 30.95% 28.78% 14.93% 15.55% 69.05% 71.22%
6 ECL (02) 40.69 40.69 8.83 9.30 2.67 2.90 0.50 0.61 1.48 1.50 5.03 4.88 16.53 17.08 4.65 5.01 11.50 12.20
53.42% 54.45% 16.15% 16.98% 30.43% 28.57% 11.43% 12.31% 69.57% 71.43%
TOTAL (76) 832.63 863.83 123.32 136.23 50.63 53.02 52.21 53.19 49.03 50.02 106.55 113.40 280.50 302.65 151.87 156.23 173.95 189.25
43.96% 45.01% 18.05% 17.52% 37.99% 37.47% 18.24% 18.09% 62.01% 62.53%
Sl.
No.
Project
(Nos.)
Total Leasehold
Area
Reclamation Activities under Progress
Area under Active
Mining
Total Excavated
Area
Total Area under
Plantation (% Green Cover
Generated in
Leasehold)
Total Area under
Reclamation
Technical
Reclamation
Biological
ReclamationOther Plantations
Area under BackfillingPlantation on Backfilled
Areas
Plantation on
External OB Dumps
Social Forestry,
Avanue Plantation Etc.
9 (=4+5+8) 10 (=5+6+7) 11(=4+5)
(% is calculated with respected to Excavated Area as applicable)
3 4 5 6 7 8
CMPDI
Job No 561410027 7
Fig.1 : Pie Chart showing Status of Land Reclamation in CIL Subsidiaries
Under Technical Reclamation
45.01%
Biologically Reclaimed 17.52%
Area under active Mining 37.47% Under Technical
ReclamationBiologically Reclaimed
Area under active Mining
150.
99
199.
51
179.
03
179.
75
113.
86
40.6
9
35.0
0
75.3
9
79.6
7
59.0
2
36.4
9
17.0
8
14.3
7
53.9
3
47.2
3
35.5
3 25.9
9
12.2
0
0
50
100
150
200
250
WCL SECL NCL MCL CCL ECL
Leasehold Area Excavated Area Area under Reclamation
CIL SUBSIDIARIES
AR
EA(S
q.K
ms.
)
Fig. 2 : Company wise Land Reclamation Status in the Year 2021
SUBSIDIARIWISE STATUS OF LAND RELMATION IN THE YEAR 2021
STATUS OF LAND RECLAMATION IN THE LEASEHOLD OF 76 OPENCAST MINES
UNDER MONITORING BASED ON SATELLITE DATA OF THE YEAR 2021 (Pier Chart indicated distribution of Total Excavated Area Only)
(As per Digital Image Processing of Satellite Data of the year 2021)
LEGEND
CMPDI
Job No 561410027 8
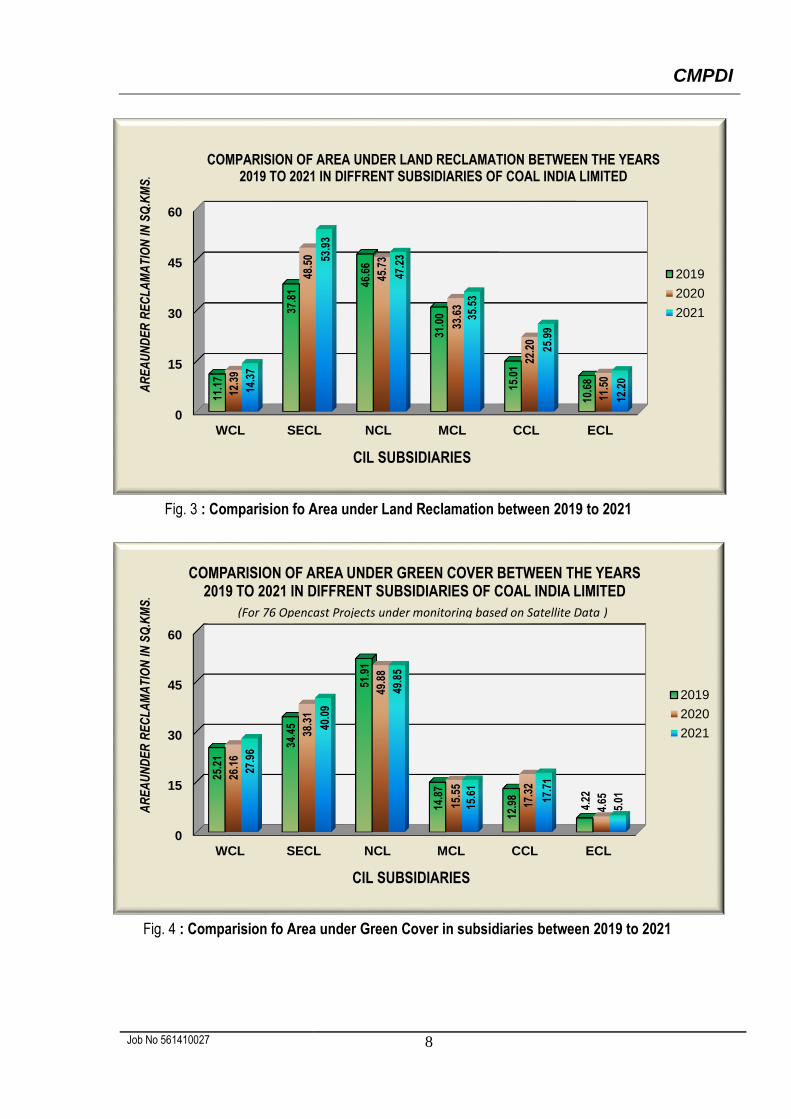
Fig. 3 : Comparision fo Area under Land Reclamation between 2019 to 2021
Fig. 4 : Comparision fo Area under Green Cover in subsidiaries between 2019 to 2021
0
15
30
45
60
WCL SECL NCL MCL CCL ECL
11.1
7
37.8
1
46.6
6
31.0
0
15.0
1
10.6
8
12.3
9
48.5
0
45.7
3
33.6
3
22.2
0
11.5
0
14.3
7
53.9
3
47.2
3
35.5
3
25.9
9
12.2
0
COMPARISION OF AREA UNDER LAND RECLAMATION BETWEEN THE YEARS 2019 TO 2021 IN DIFFRENT SUBSIDIARIES OF COAL INDIA LIMITED
2019
2020
2021
CIL SUBSIDIARIES
AR
EA
UN
DE
R R
EC
LA
MA
TIO
NIN
SQ
.KM
S.
0
15
30
45
60
WCL SECL NCL MCL CCL ECL
25.2
1
34.4
5
51.9
1
14.8
7
12.9
8
4.22
26.1
6
38.3
1
49.8
8
15.5
5
17.3
2
4.65
27.9
6
40.0
9
49.8
5
15.6
1
17.7
1
5.01
COMPARISION OF AREA UNDER GREEN COVER BETWEEN THE YEARS 2019 TO 2021 IN DIFFRENT SUBSIDIARIES OF COAL INDIA LIMITED
2019
2020
2021
CIL SUBSIDIARIES
AR
EA
UN
DE
R R
EC
LA
MA
TIO
NIN
SQ
.KM
S.
(For 76 Opencast Projects under monitoring based on Satellite Data )
CMPDI
Job No 561410027 9
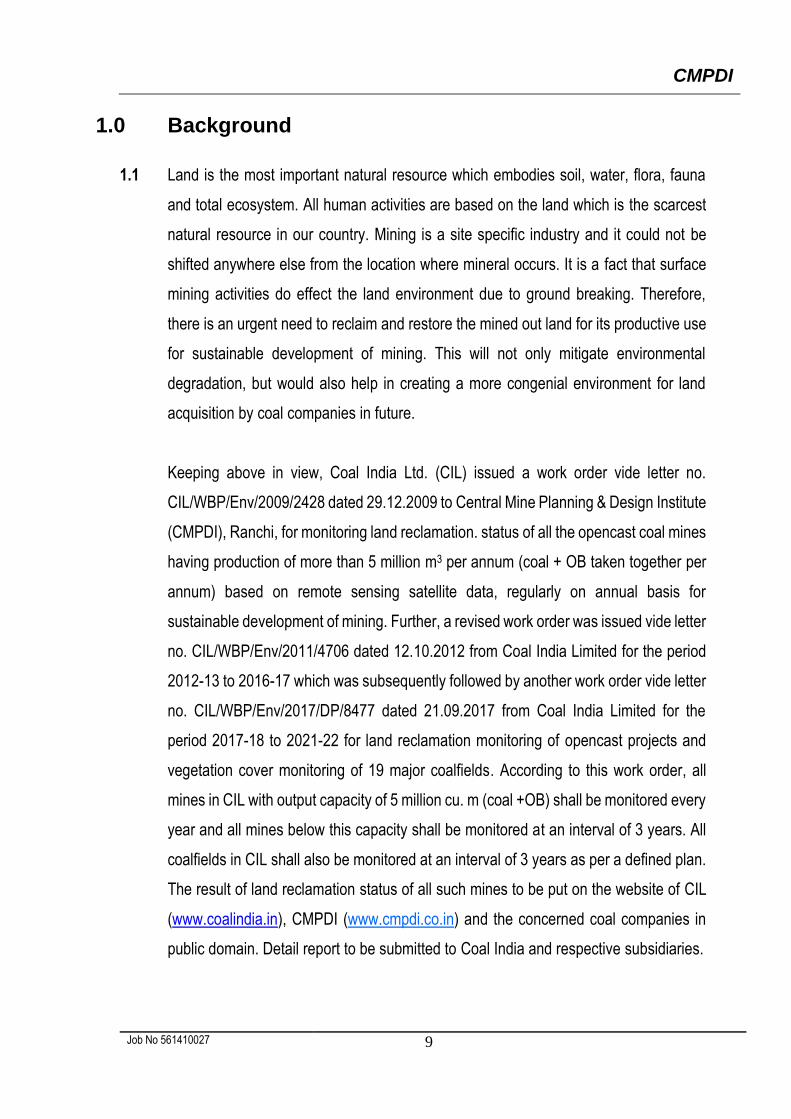
1.0 Background
1.1 Land is the most important natural resource which embodies soil, water, flora, fauna
and total ecosystem. All human activities are based on the land which is the scarcest
natural resource in our country. Mining is a site specific industry and it could not be
shifted anywhere else from the location where mineral occurs. It is a fact that surface
mining activities do effect the land environment due to ground breaking. Therefore,
there is an urgent need to reclaim and restore the mined out land for its productive use
for sustainable development of mining. This will not only mitigate environmental
degradation, but would also help in creating a more congenial environment for land
acquisition by coal companies in future.
Keeping above in view, Coal India Ltd. (CIL) issued a work order vide letter no.
CIL/WBP/Env/2009/2428 dated 29.12.2009 to Central Mine Planning & Design Institute
(CMPDI), Ranchi, for monitoring land reclamation. status of all the opencast coal mines
having production of more than 5 million m3 per annum (coal + OB taken together per
annum) based on remote sensing satellite data, regularly on annual basis for
sustainable development of mining. Further, a revised work order was issued vide letter
no. CIL/WBP/Env/2011/4706 dated 12.10.2012 from Coal India Limited for the period
2012-13 to 2016-17 which was subsequently followed by another work order vide letter
no. CIL/WBP/Env/2017/DP/8477 dated 21.09.2017 from Coal India Limited for the
period 2017-18 to 2021-22 for land reclamation monitoring of opencast projects and
vegetation cover monitoring of 19 major coalfields. According to this work order, all
mines in CIL with output capacity of 5 million cu. m (coal +OB) shall be monitored every
year and all mines below this capacity shall be monitored at an interval of 3 years. All
coalfields in CIL shall also be monitored at an interval of 3 years as per a defined plan.
The result of land reclamation status of all such mines to be put on the website of CIL
(www.coalindia.in), CMPDI (www.cmpdi.co.in) and the concerned coal companies in
public domain. Detail report to be submitted to Coal India and respective subsidiaries.
CMPDI
Job No 561410027 10
1.2 Land reclamation monitoring of all opencast coal mining projects would also comply the
statutory requirements of Ministry of Environment, Forest & Climate Change
(MoEF&CC), GoI. Such monitoring would not only facilitate in taking timely mitigation
measures against environmental degradation but would also enable coal companies to
utilize the reclaimed land for larger socio-economic benefits in a planned way.
1.3 CMPDI undertook the above study and the present report is embodying the findings in
nutshell carrying out for the 76 opencast projects of different subsidiaries producing 5
million cubic m. coal +OB or more in the year 2021-22. This study is being carried out
in since year 2008 on annual basis and progressive changes in the status of land
reclamation have been assessed. It is to be noted that BCCL has excluded this
previous year for more than 5 Million Cubic m. (Coal+OB) monitoring category.
2.0 Objective
Objective of the land reclamation/restoration monitoring is to assess the area of
backfilled, plantation, OB dumps, social forestry, active mining area, settlements and
water bodies, distribution of wasteland, agricultural land and forest land in the leasehold
area of the project. This is an important step taken up for assessing the progressive
status of mined land reclamation and for taking up remedial measures, if any, required
for environmental protection.
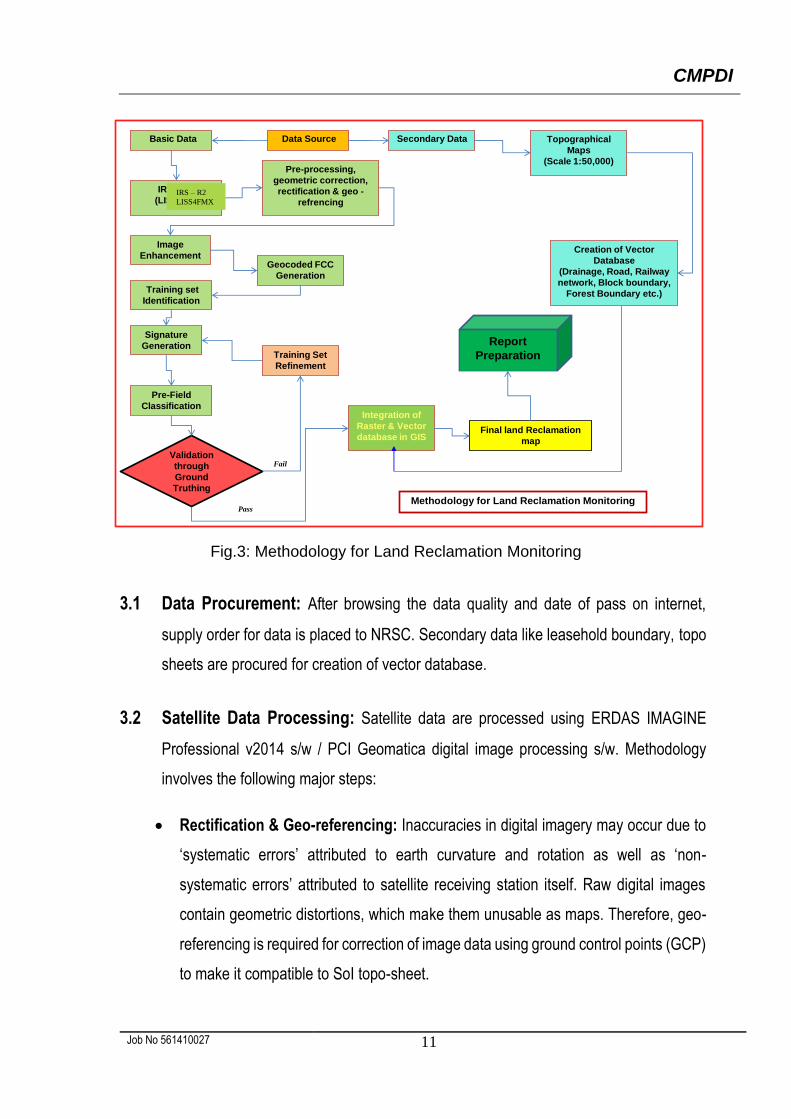
3.0 Methodology
There are number of steps involved between raw satellite data procurement and
preparation of final map. National Remote Sensing Centre (NRSC) Hyderabad, being
the nodal agency for satellite data supply in India, provides only raw digital satellite
data, which needs further digital image processing for extracting the information and
map preparation before uploading the same in the website. Methodology for land
reclamation monitoring is given in fig 3. Following steps are involved in land reclamation
/restoration monitoring:
CMPDI
Job No 561410027 11
Fig.3: Methodology for Land Reclamation Monitoring
3.1 Data Procurement: After browsing the data quality and date of pass on internet,
supply order for data is placed to NRSC. Secondary data like leasehold boundary, topo
sheets are procured for creation of vector database.
3.2 Satellite Data Processing: Satellite data are processed using ERDAS IMAGINE
Professional v2014 s/w / PCI Geomatica digital image processing s/w. Methodology
involves the following major steps:
Rectification & Geo-referencing: Inaccuracies in digital imagery may occur due to
‘systematic errors’ attributed to earth curvature and rotation as well as ‘non-
systematic errors’ attributed to satellite receiving station itself. Raw digital images
contain geometric distortions, which make them unusable as maps. Therefore, geo-
referencing is required for correction of image data using ground control points (GCP)
to make it compatible to SoI topo-sheet.
Validation
through
Ground
Truthing
Report
Preparation
Data Source Secondary DataBasic Data
IRS – P6
(LISS - IV)
Topographical
Maps
(Scale 1:50,000)
Creation of Vector
Database
(Drainage, Road, Railway
network, Block boundary,
Forest Boundary etc.)
Signature
Generation
Pre-Field
ClassificationIntegration of
Raster & Vector
database in GISFinal land Reclamation
map
Training Set
Refinement
Pass
Fail
Geocoded FCC
Generation
Methodology for Land Reclamation Monitoring
Pre-processing,
geometric correction,
rectification & geo -
refrencing
Image
Enhancement
Training set
Identification
IRS – R2
LISS4FMX
CMPDI
Job No 561410027 12
Image enhancement:
To improve the interpretability of the raw data, image enhancement is necessary.
Local operations modify the value of each pixel based on brightness value of
neighbouring pixels using ERDAS IMAGINE Professional v2014 s/w / PCI Geomatica
digital image processing s/w and enhance the image quality for proper interpretation.
Training set selection
Training set requires to be selected, so that software can classify the image data
accurately. The image data are analysed based on the interpretation keys. These
keys are evolved from certain fundamental image-elements such as tone/colour, size,
shape, texture, pattern, location, association and shadow. Based on the image-
elements and other geo-technical elements like land form, drainage pattern and
physiography; training sets were selected/identified for each land use/cover class.
Field survey was carried out by taking selective traverses in order to collect the
ground information (or reference data) so that training sets are selected accurately in
the image. This was intended to serve as an aid for classification.
Classification and Accuracy assessment
Image classification is carried out using the maximum likelihood algorithm. The
classification proceeds through the following steps: (a) calculation of statistics [i.e.
signature generation] for the identified training areas, and (b) the decision boundary
of maximum probability based on the mean vector, variance, covariance and
correlation matrix of the pixels. After evaluating the statistical parameters of the
training sets, reliability test of training sets is conducted by measuring the statistical
separation between the classes that resulted from computing divergence matrix. The
overall accuracy of the classification was finally assessed with reference to ground
truth data.
Area calculation
The area of each land use class in the leasehold is determined using ERDAS
IMAGINE Professional v2014/ PCI Geomatica digital image processing s/w.
CMPDI
Job No 561410027 13
Overlay of Vector data base
Vector data base created based on secondary data. Vector layer like drainage,
railway line, leasehold boundary, forest boundary etc. are superimposed on the
image as vector layer in the Arc GIS database.
Pre-field map preparation
Pre-field map is prepared for validation of the classification result
3.3 Ground Truthing:
Selective ground verification of the land use classes are carried out in the field and
necessary corrections if required, are incorporated before map finalization.
3.4 Land reclamation database on GIS:
Land reclamation database is created on GIS platform to identify the temporal changes
identified from satellite data of different cut-off dates.
4.0 Work Plan
4.1 Total 76 opencast projects producing 5 million cubic m. and more (Coal + OB together)
during the year 2021-22 were taken up for the study. Based on the RESOURCESAT-
2 satellite data, land reclamation / mine closure monitoring was carried out using
ERDAS IMAGINE digital image processing s/w and Arc-Info GIS. Baseline data on
reclamation of these OC projects of CIL’s subsidiaries have been generated and the
same has been annually updated since year 2008.
4.2 Besides project wise land reclamation monitoring, coalfield wise vegetation cover
monitoring on regional scale has also been planned for the major 19 coalfields of India
at regular interval of three years using remote sensing satellite data to assess the
regional impact of coal mining and associated industrialization on the land use and
vegetation cover in the coalfield. Geo-environmental baseline data for Raniganj,
Jharia, East Bokaro, West Bokaro, Karanpura, Singrauli (Moher Sub-basin), Korba,
CMPDI
Job No 561410027 14
Bisrampur, Shohagpur, Mand-Raigarh, Talcher, Ib Valley, Wardha Valley, Bander,
Kamptee, Umrer, Pench Kanhan and Makum coalfields based on the satellite data
have been generated and will be monitored regularly at three years’ interval.
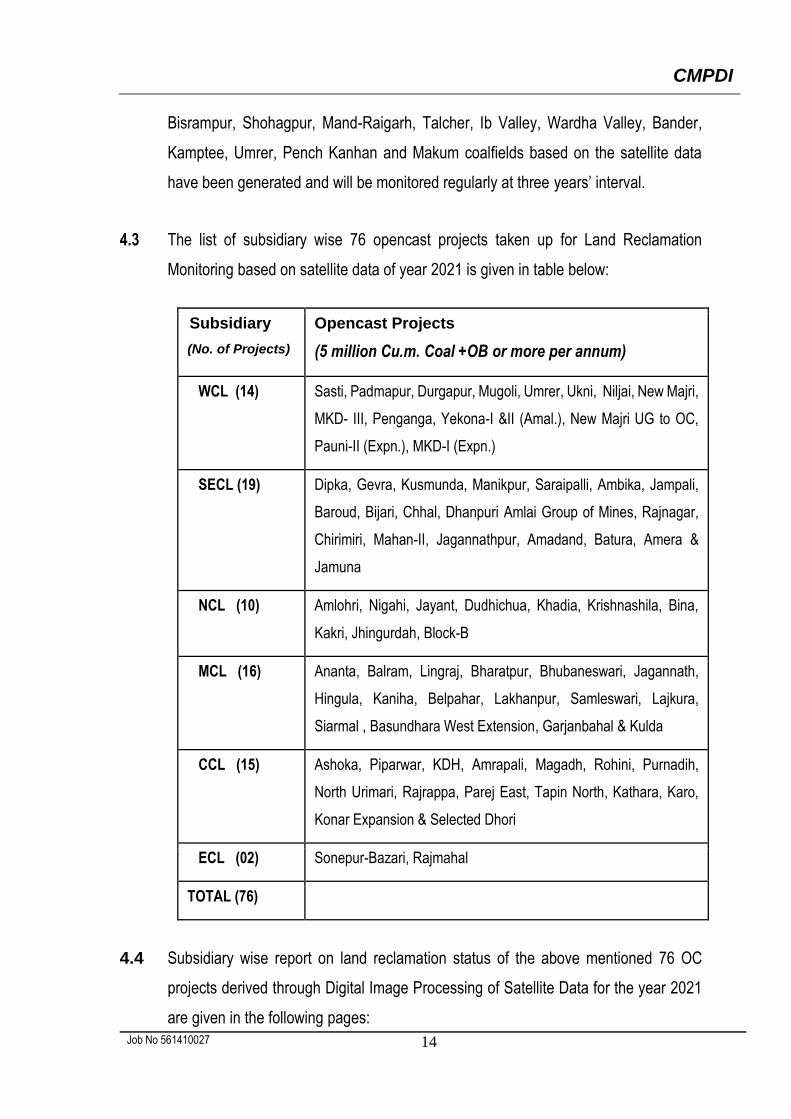
4.3 The list of subsidiary wise 76 opencast projects taken up for Land Reclamation
Monitoring based on satellite data of year 2021 is given in table below:
Subsidiary
(No. of Projects)
Opencast Projects
(5 million Cu.m. Coal +OB or more per annum)
WCL (14) Sasti, Padmapur, Durgapur, Mugoli, Umrer, Ukni, Niljai, New Majri,
MKD- III, Penganga, Yekona-I &II (Amal.), New Majri UG to OC,
Pauni-II (Expn.), MKD-I (Expn.)
SECL (19) Dipka, Gevra, Kusmunda, Manikpur, Saraipalli, Ambika, Jampali,
Baroud, Bijari, Chhal, Dhanpuri Amlai Group of Mines, Rajnagar,
Chirimiri, Mahan-II, Jagannathpur, Amadand, Batura, Amera &
Jamuna
NCL (10) Amlohri, Nigahi, Jayant, Dudhichua, Khadia, Krishnashila, Bina,
Kakri, Jhingurdah, Block-B
MCL (16) Ananta, Balram, Lingraj, Bharatpur, Bhubaneswari, Jagannath,
Hingula, Kaniha, Belpahar, Lakhanpur, Samleswari, Lajkura,
Siarmal , Basundhara West Extension, Garjanbahal & Kulda
CCL (15) Ashoka, Piparwar, KDH, Amrapali, Magadh, Rohini, Purnadih,
North Urimari, Rajrappa, Parej East, Tapin North, Kathara, Karo,
Konar Expansion & Selected Dhori
ECL (02) Sonepur-Bazari, Rajmahal
TOTAL (76)
4.4 Subsidiary wise report on land reclamation status of the above mentioned 76 OC
projects derived through Digital Image Processing of Satellite Data for the year 2021
are given in the following pages:
WESTERN COALFIELDS LIMITED
CMPDI
Job No 561410027 16
5.0 Land Reclamation Status in Western Coalfields Ltd.
5.1 Following 14 OC projects producing more than 5 million cubic m. (Coal + OB together)
of Western Coalfields Ltd. have been taken up for land reclamation monitoring based
on Satellite Data of the year 2021:
Sasti
Padmapur
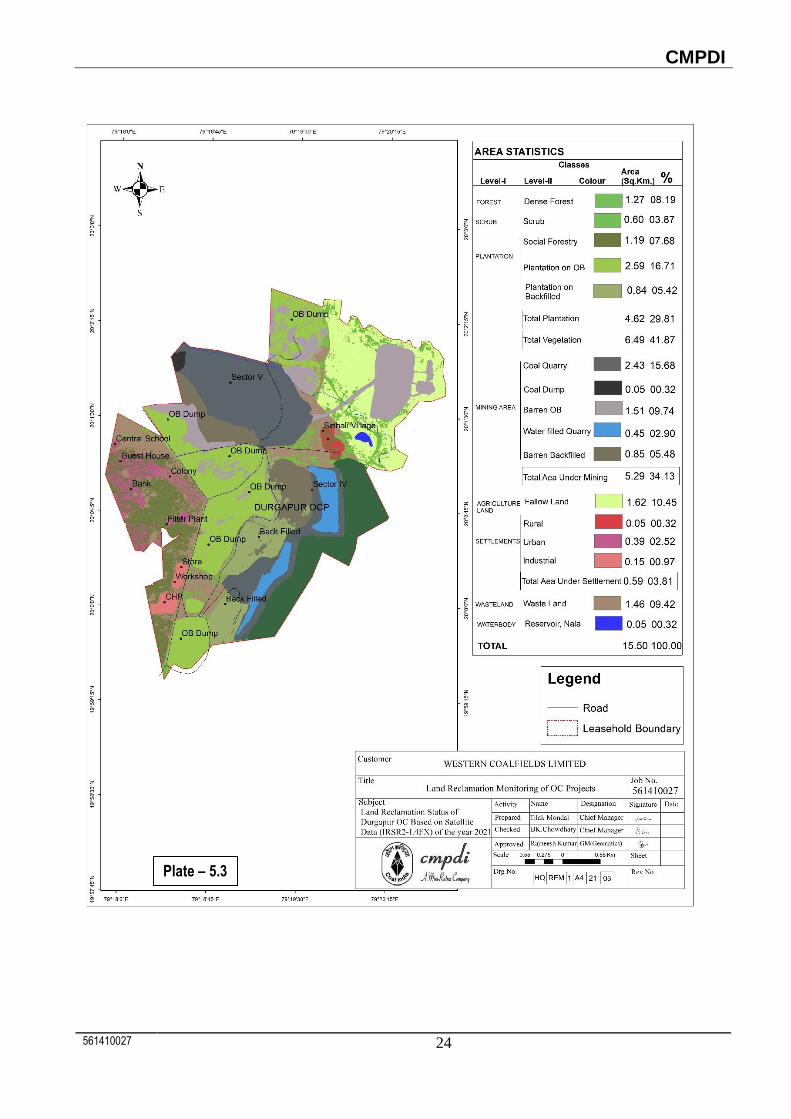
Durgapur
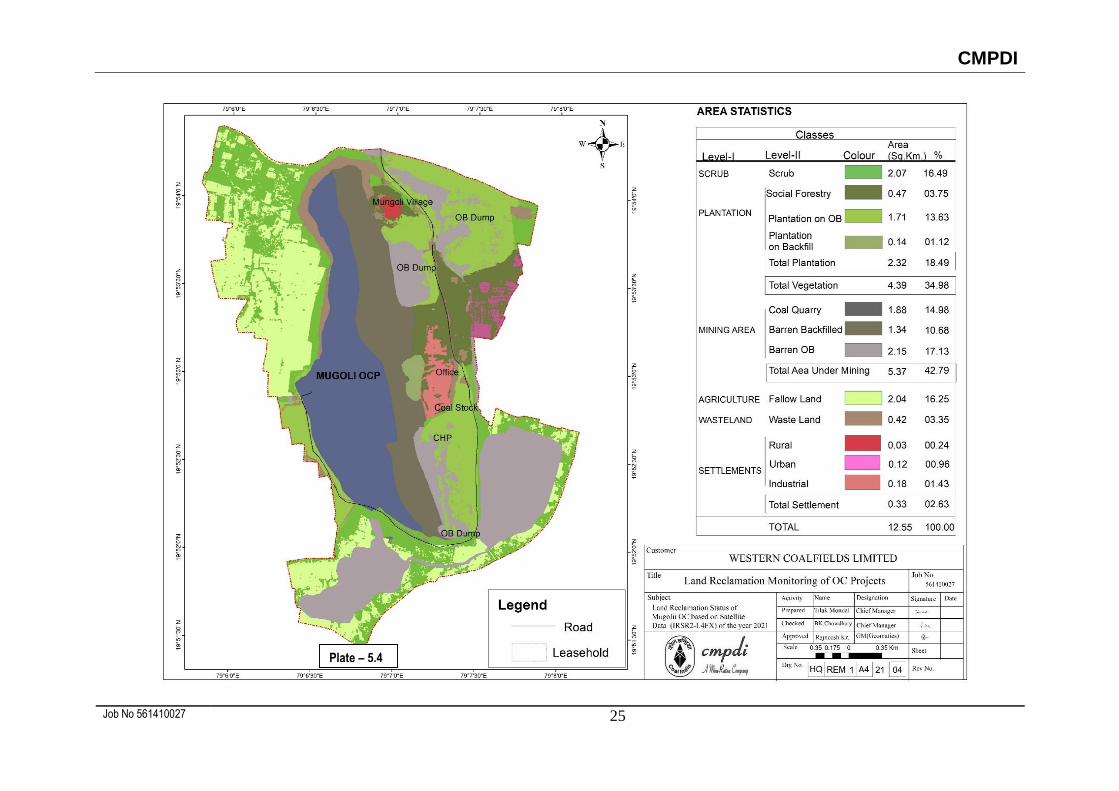
Mugoli
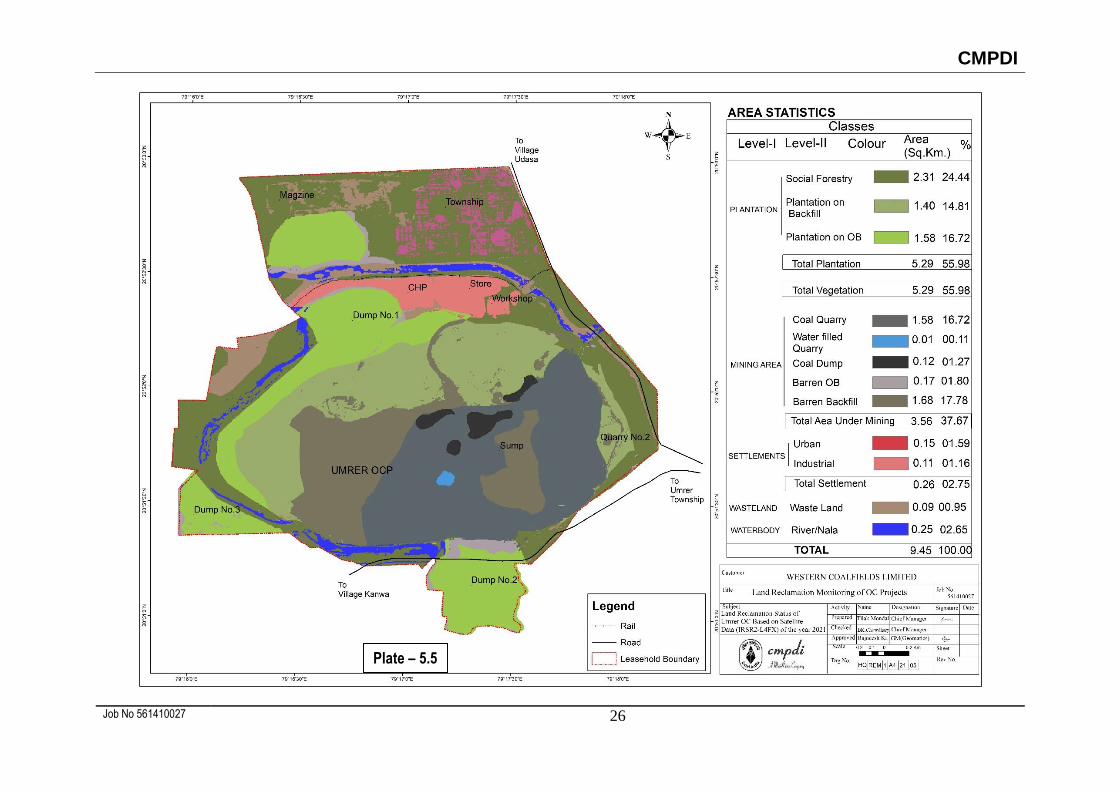
Umrer
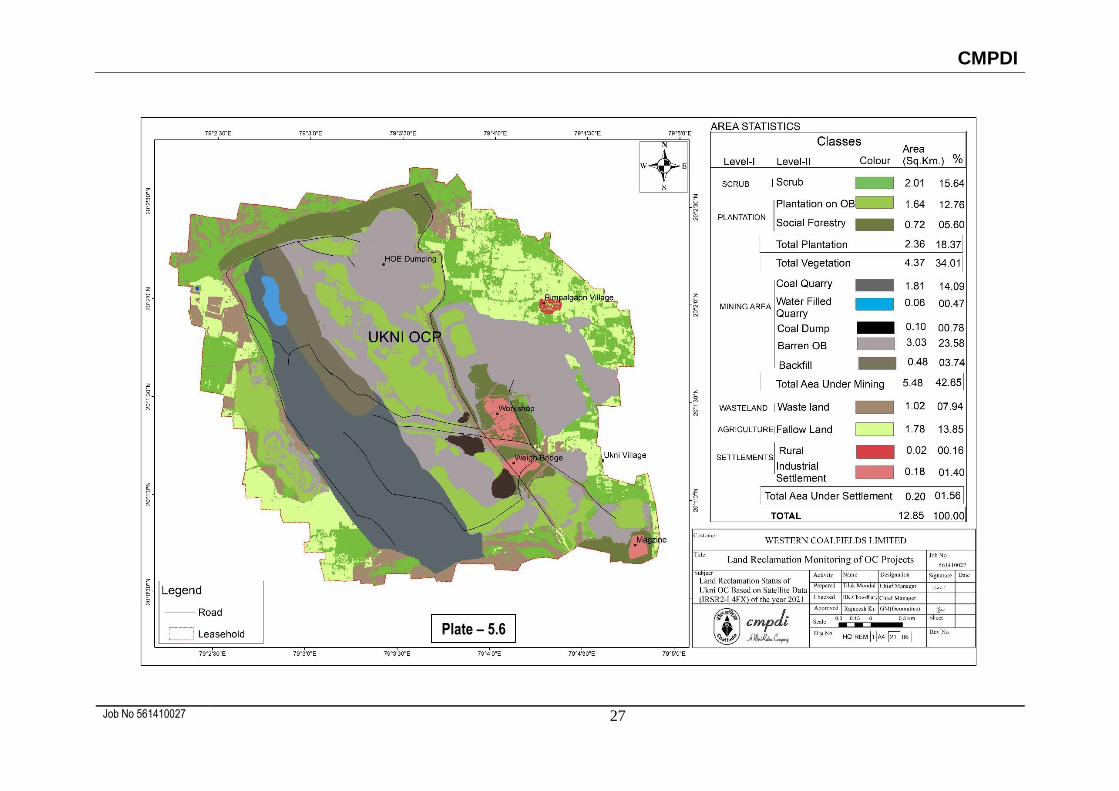
Ukni
Niljai
New Majri
MKD-III
Penganga
Yekona-I&II (Amal.)
New Majri UG to OC
Pauni-II (Expn.)
MKD-I(Expn.)
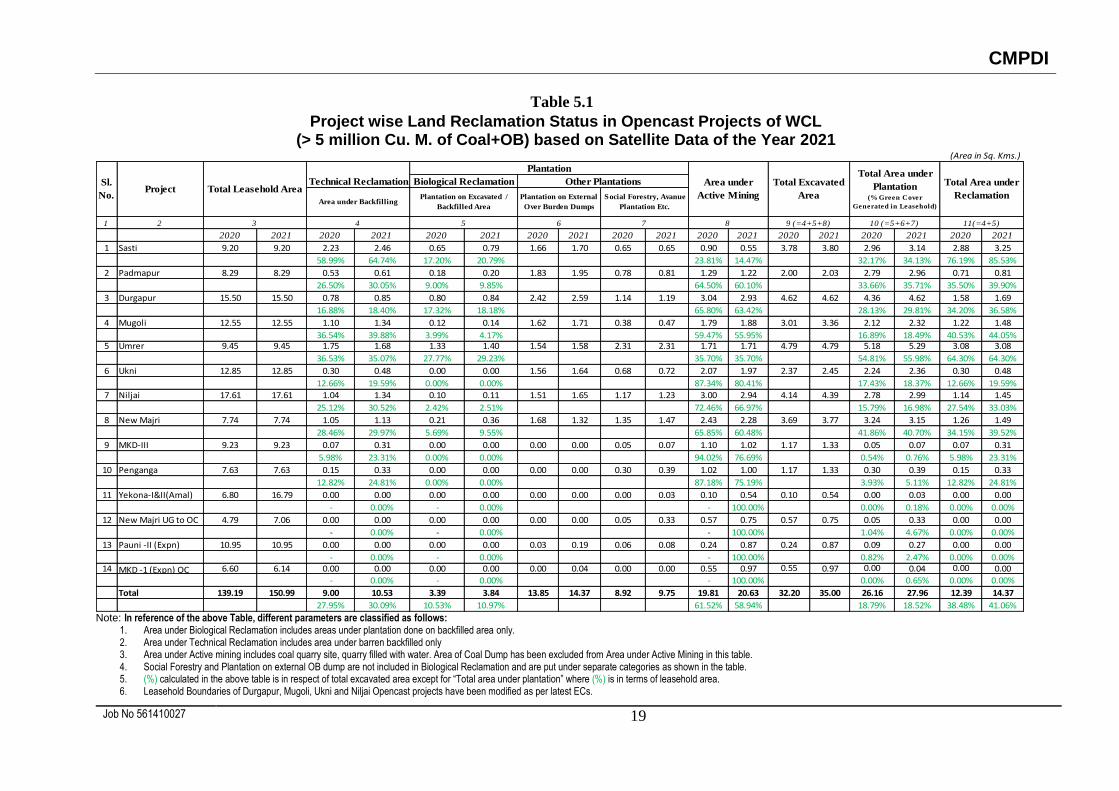
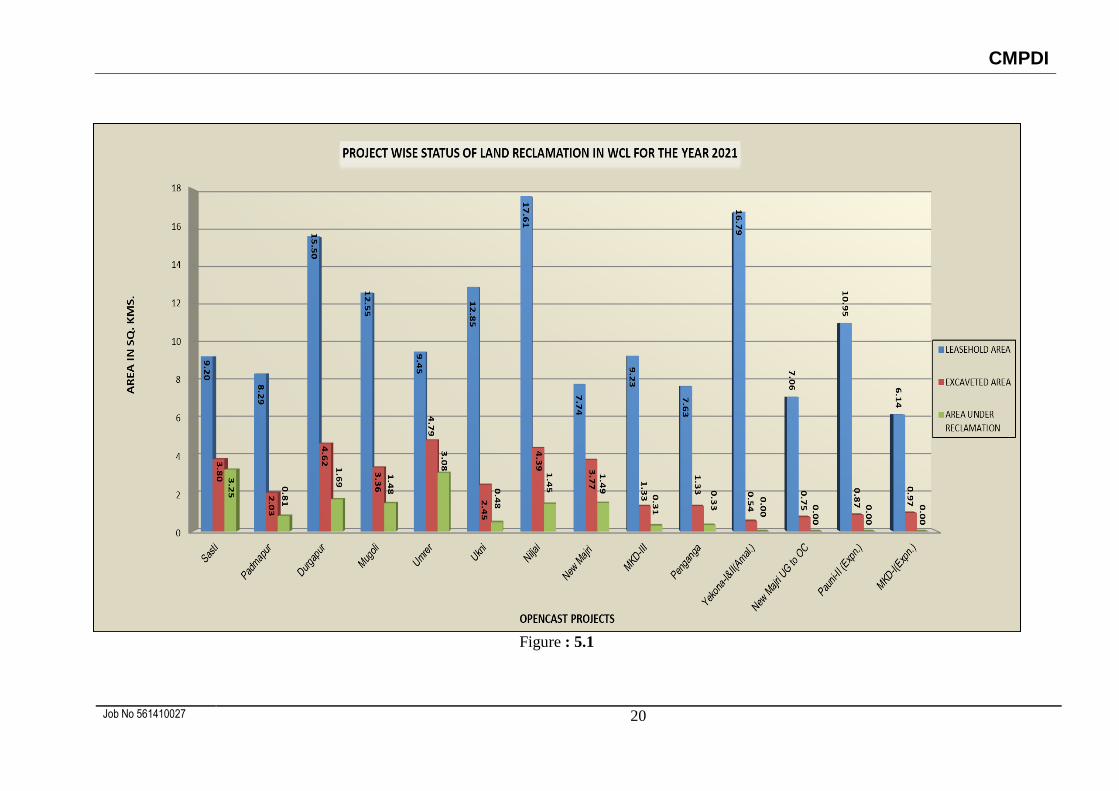
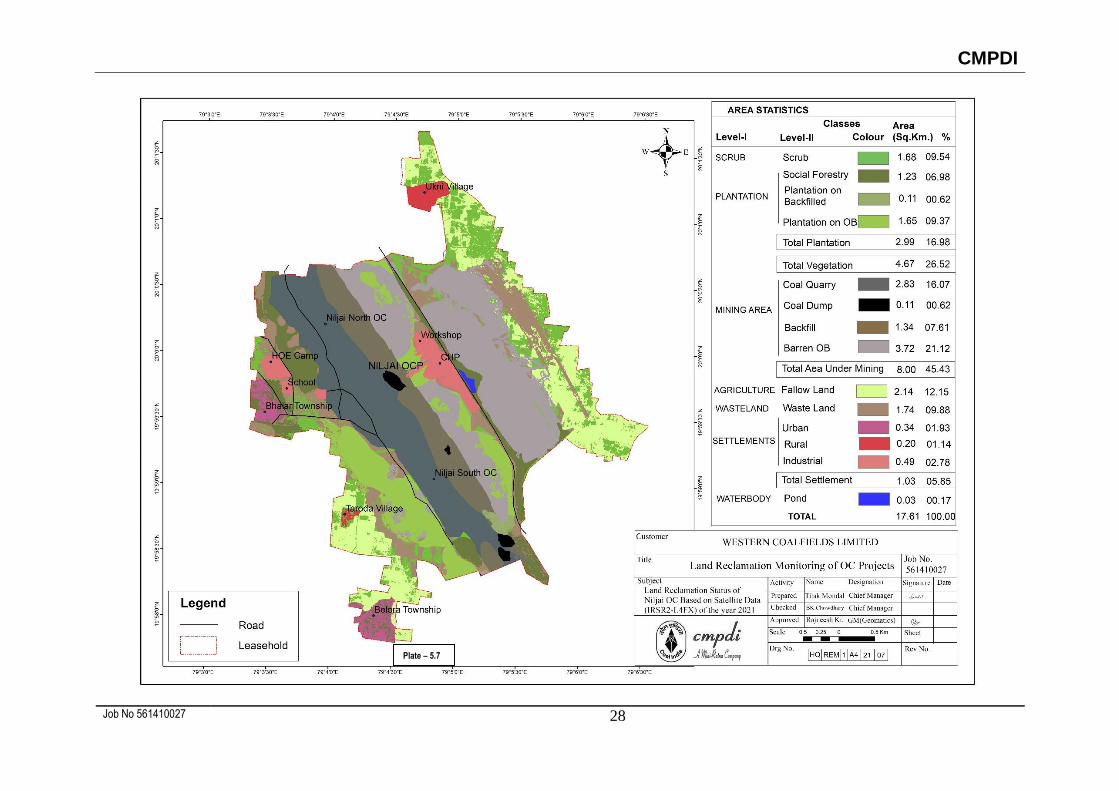
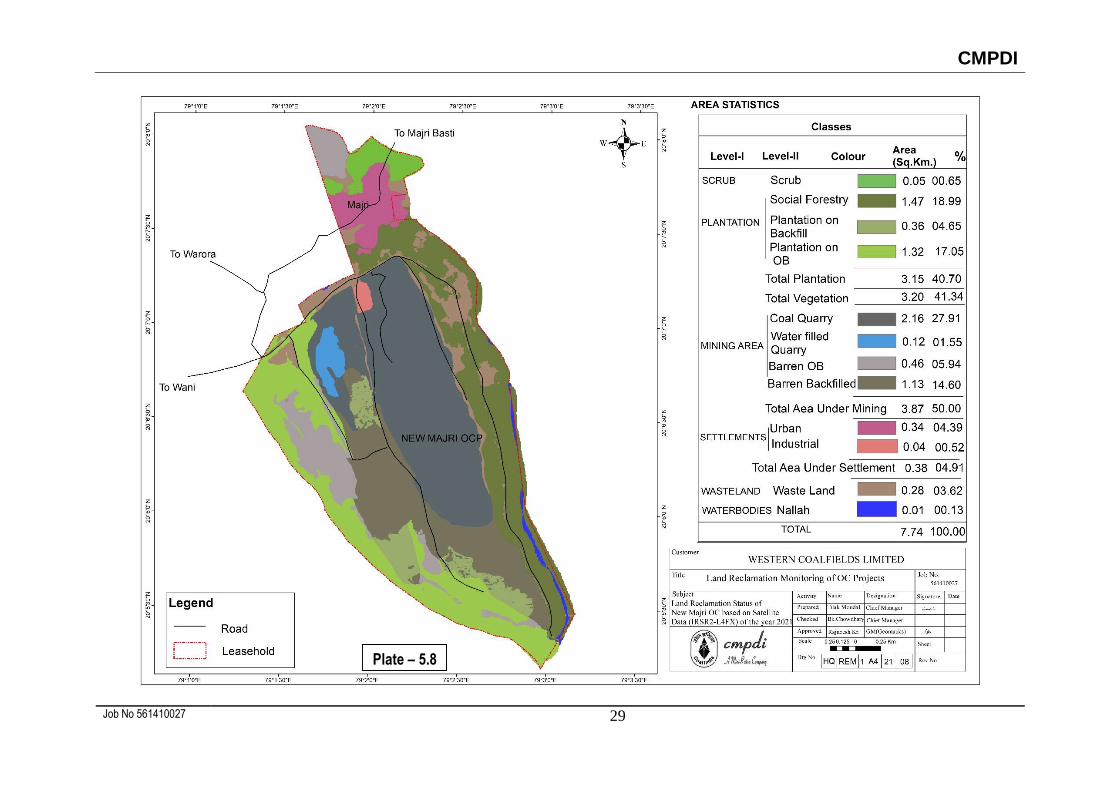
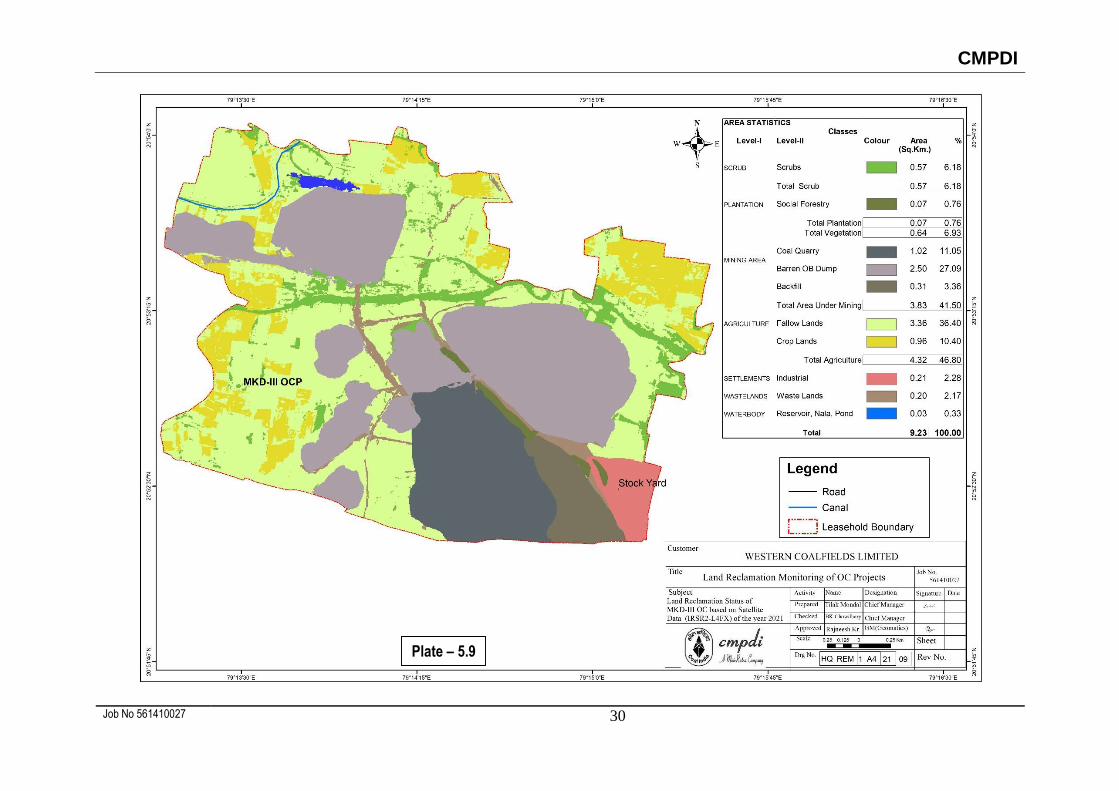
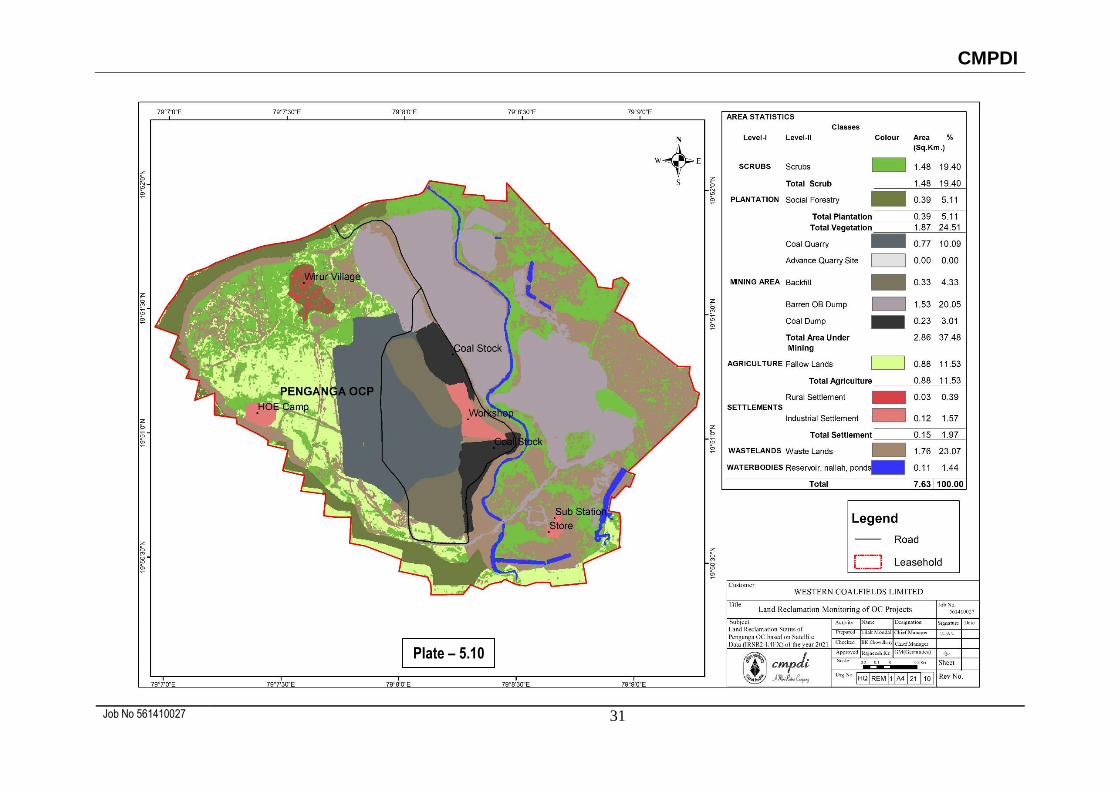
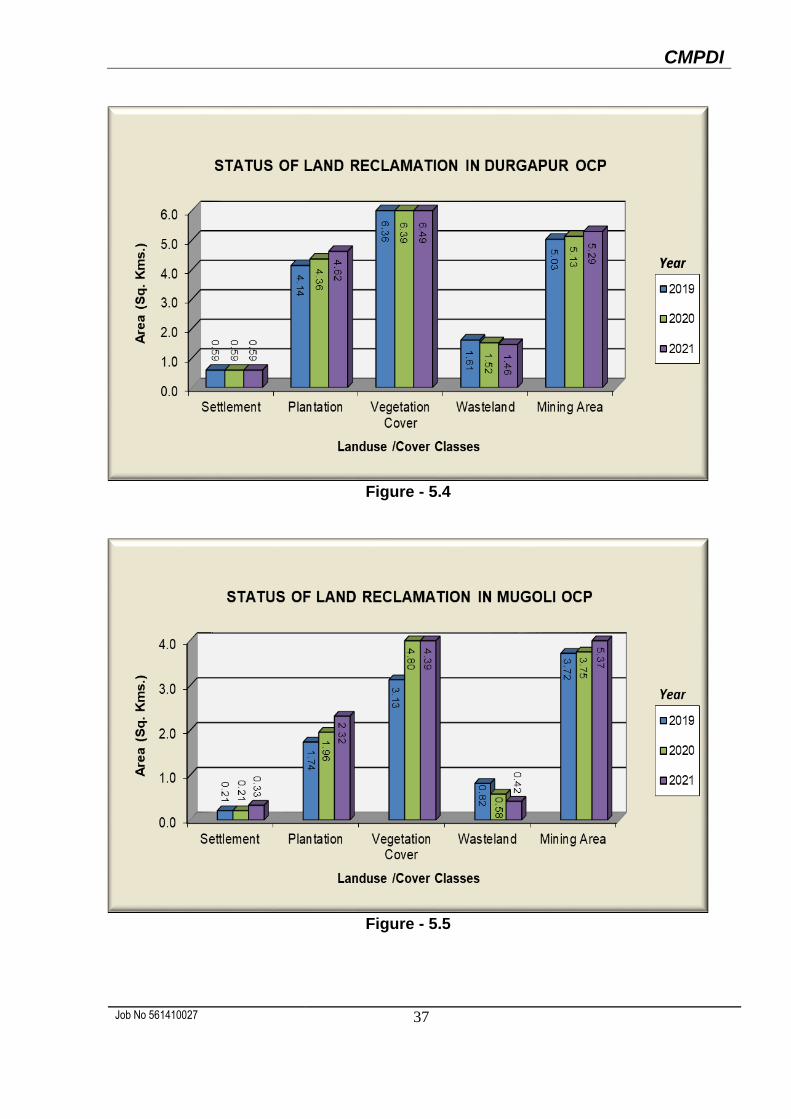
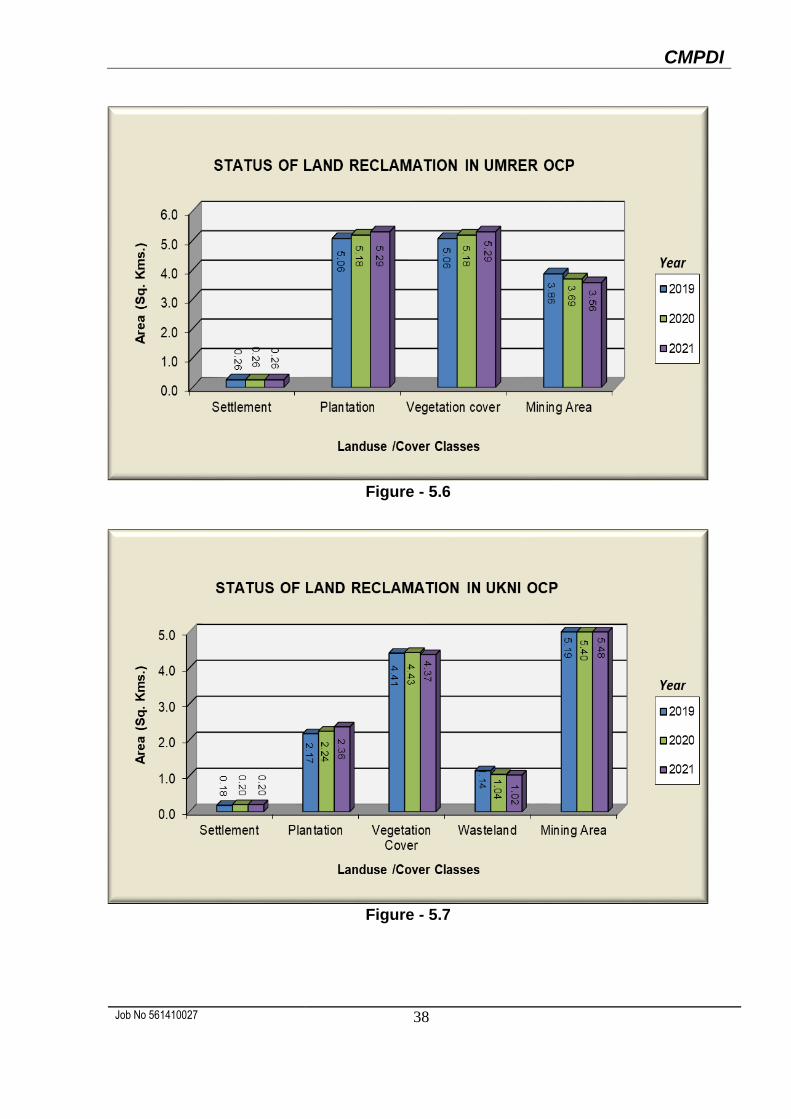
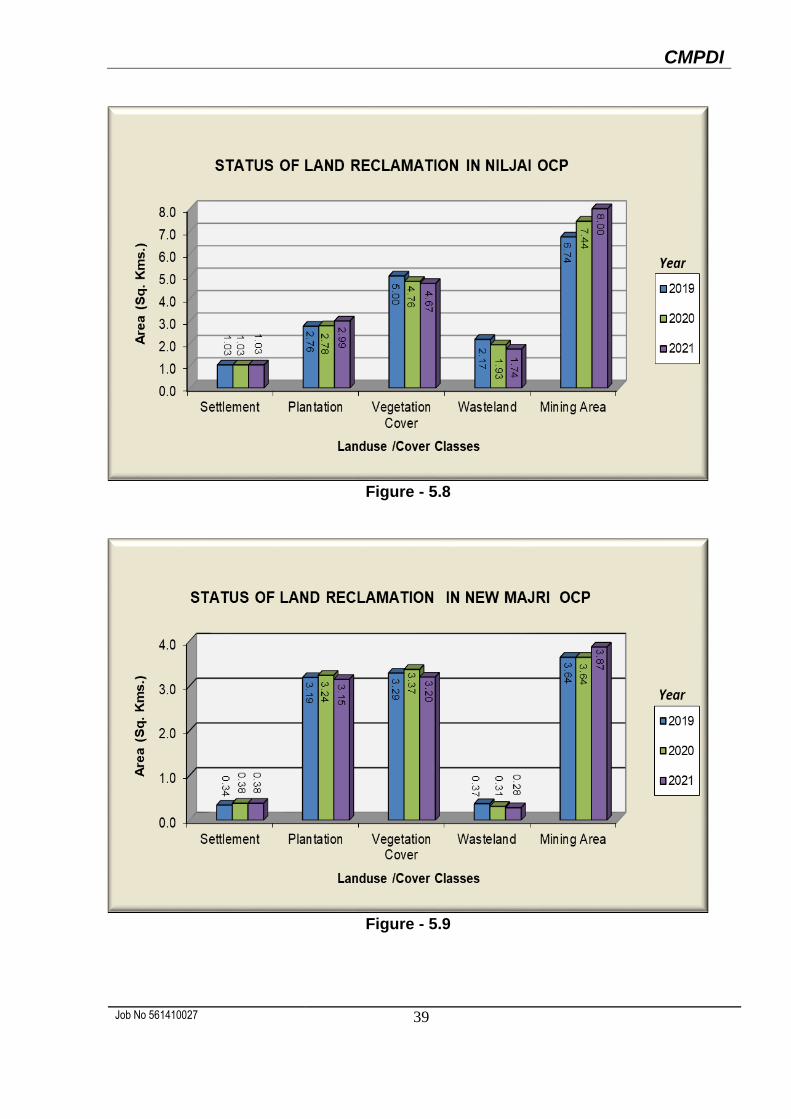
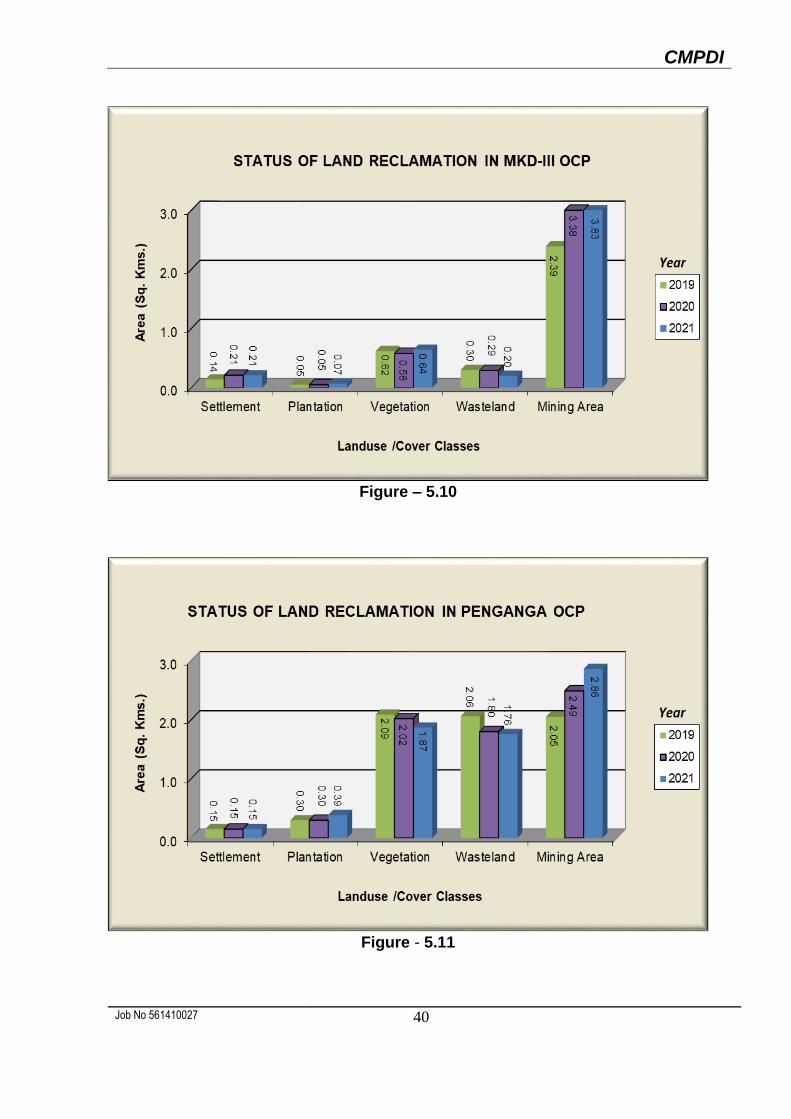
5.2 Project wise Land Reclamation status in WCL for the year 2021 is given in Table 5.1
and also shown graphically in Fig 5.1. Area statistics of different land use class present
in the mine leasehold boundaries of the above projects for the year 2021 are shown in
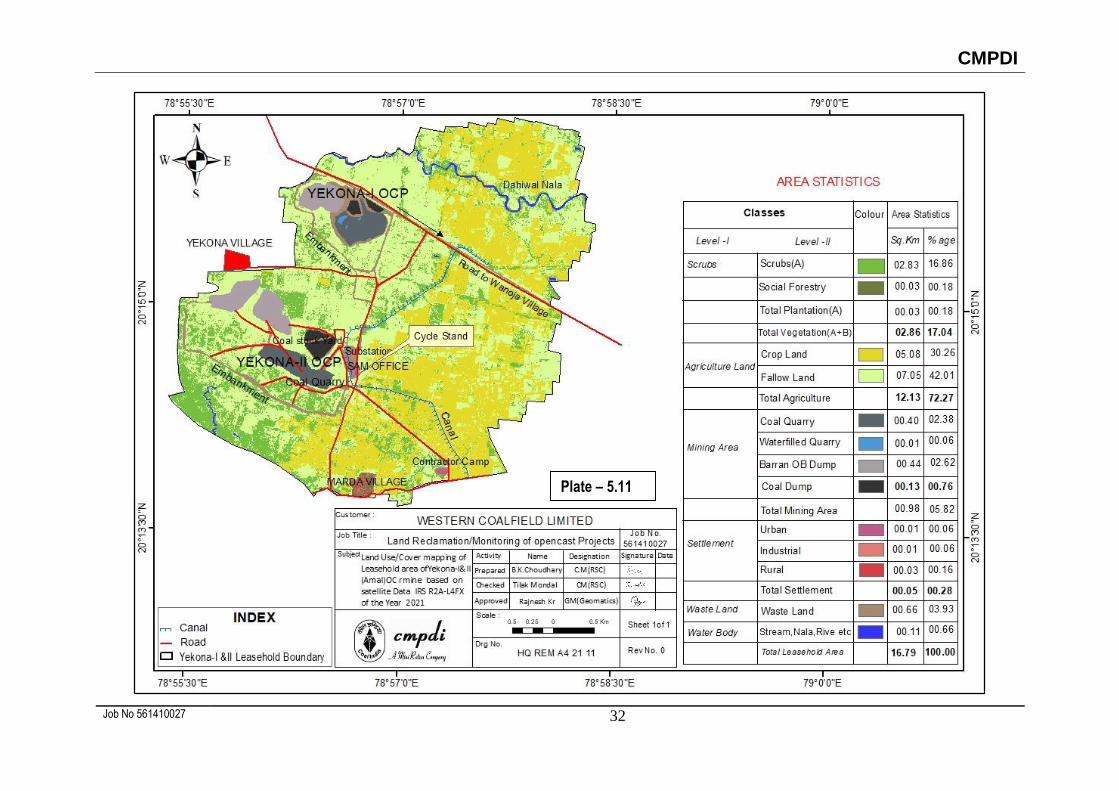
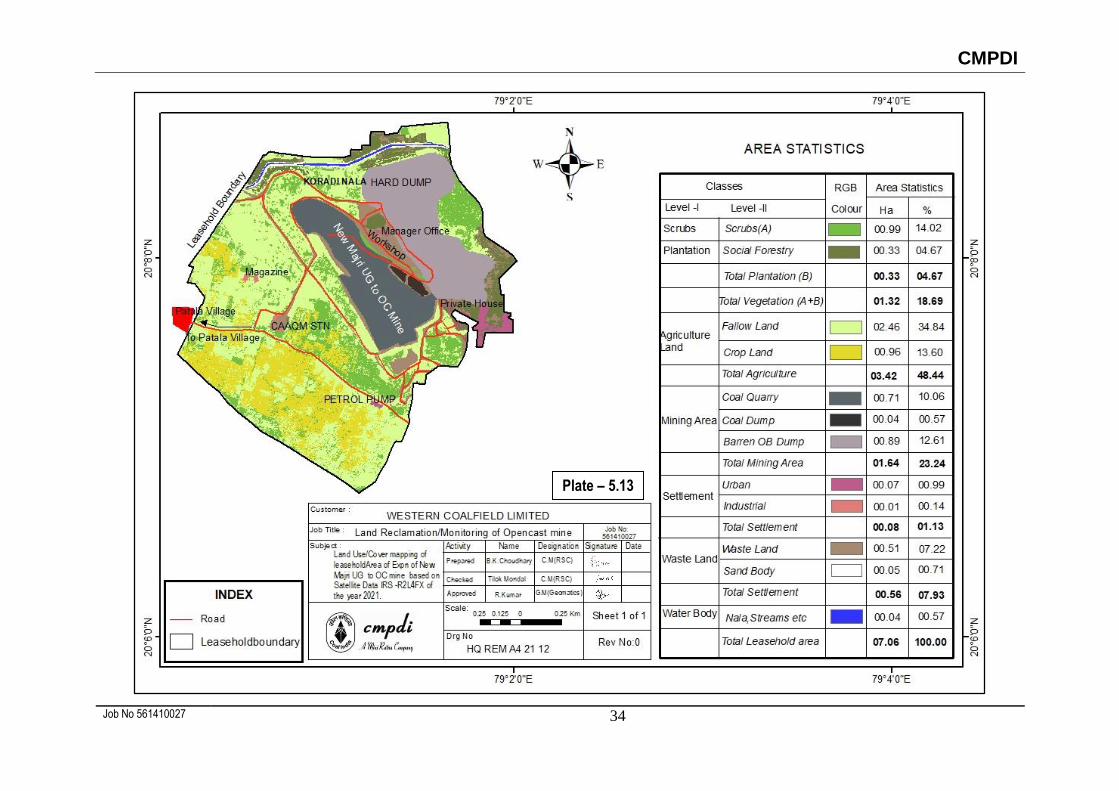
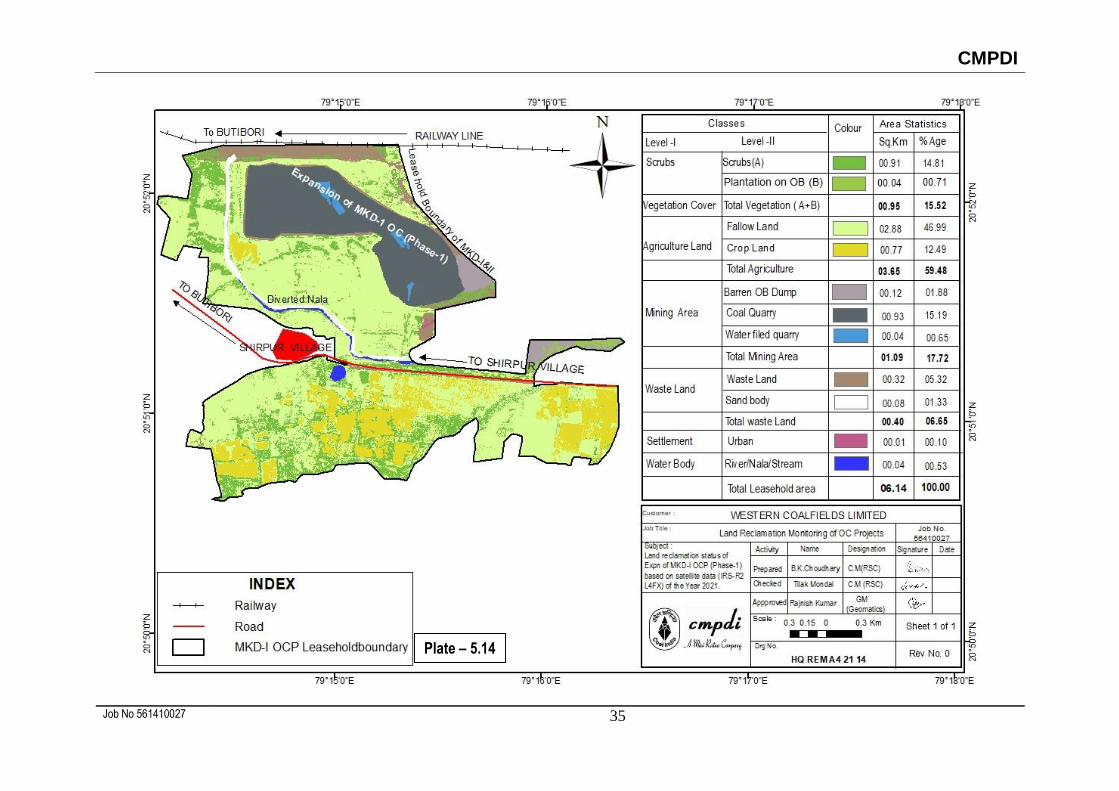
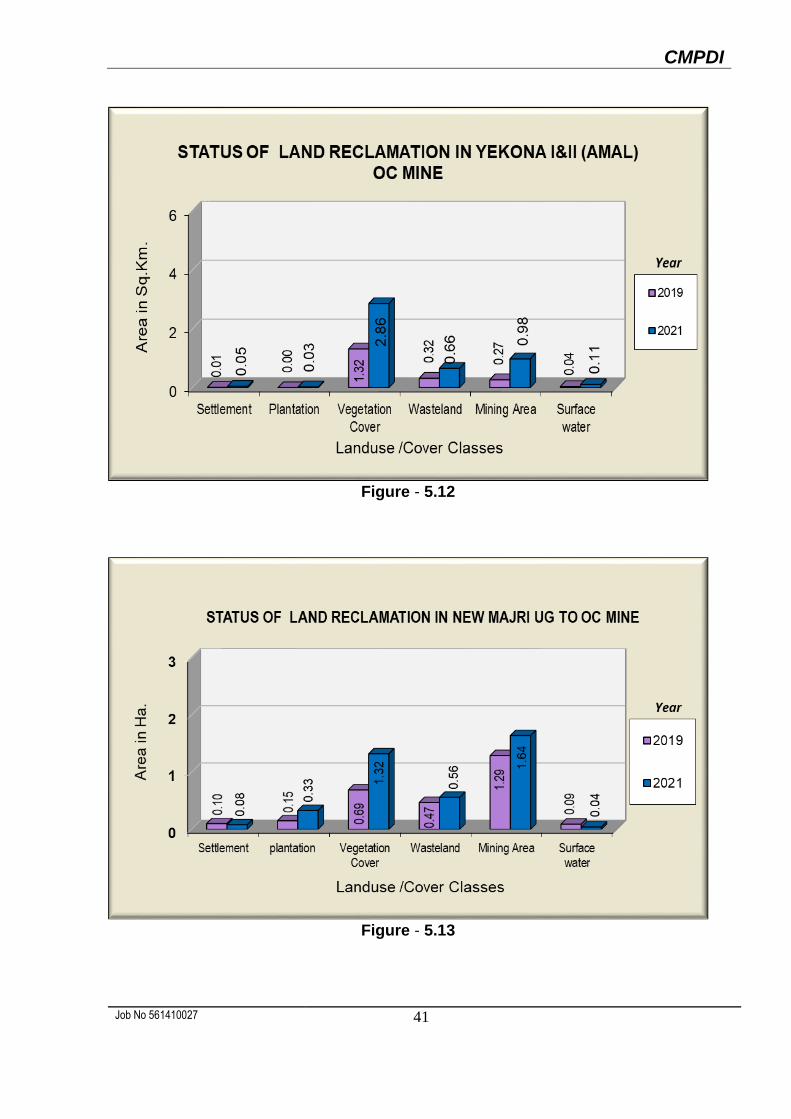
the Table - 5.2. It is important to mention here that leasehold boundaries of Yekona-
I&II (Amal), New Majri UG to OC and MKD-I (Expn.) projects have been modified as
per latest EC. Land use maps derived from satellite data are shown in Plate 5.1-5.14.
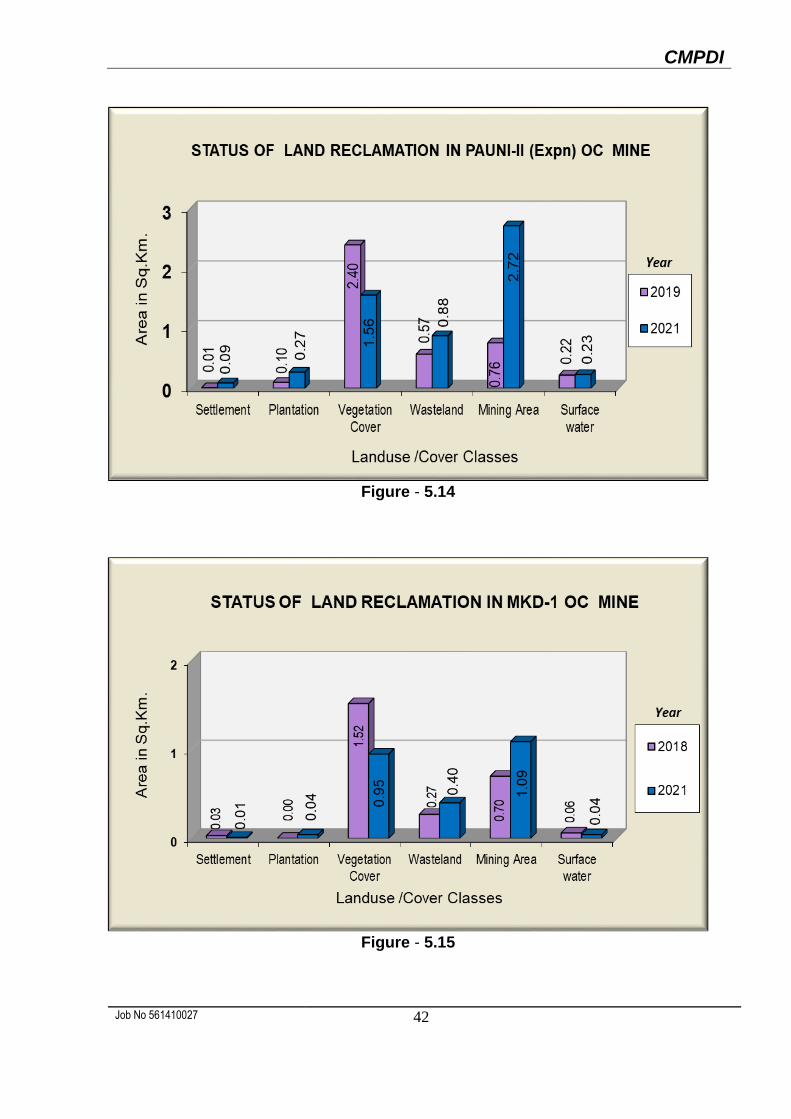
Year wise changes in the different land use classes based on satellite data are depicted
in Bar Charts in Fig. 5.2 - 5.15 for the last three years only.
CMPDI
Job No 561410027 17
5.3 Study reveals that 14.37 Km2 (41.06%) of excavated area has been under reclamation
in the above mentioned mines of WCL out of which 3.84 Km2 (10.97%) area has been
revegetated and 10.53 Km2 (30.09%) area is under backfilling. There is an overall
increase of 1.98 Km2 in area under reclamation in WCL in the year 2021 with respect
to the year 2020, out of which there is an increase of 1.53 Km2 in area under technical
reclamation (Barren Backfilling) and an increase of 0.45 Km2 in area under biological
reclamation (Plantation on Backfilled Areas) (Refer Table 5.1). In New Majri OC project
plantation on OB has been reduced by 0.36 Km2 on account of tree felling for the
purpose of coal mining.
5.4 Analysis of satellite data also indicates that total area under active mining has
increased from 19.81 Km2 (Yr.2020) to 20.63 Km2 (Yr.2021). In some OC project area
under active mining has reduced due to increase in area under backfilling.
5.5 After comparing the satellite data of year 2021 vs. 2020 study reveals that area under
backfilling has increased from 9.00 Km2 (Yr.2020) to 10.53 Km2 (Yr.2021). Area under
backfilling in Umrer OC project have been reduced due to rehandling of Quarry 2.
5.6 Total area under biological reclamation has increased from 3.39 Km2 (Yr.2020) to 3.84
Km2 (Yr.2021). There is no biological reclamation in Yekona-I&II (Amal.), New Majri UG
to OC, Pauni-II (Expn.), MKD-I and MKD-III OC
5.7 Analysis of satellite data also indicates that total area under plantation (Green Cover)
has increased from 26.16 Km2 (Yr.2020) to 27.96 Km2 (Yr.2021). The increase of 1.80
Km2 area under Green Cover areas may be attributed to continuous effort of WCL
towards environmental protection).
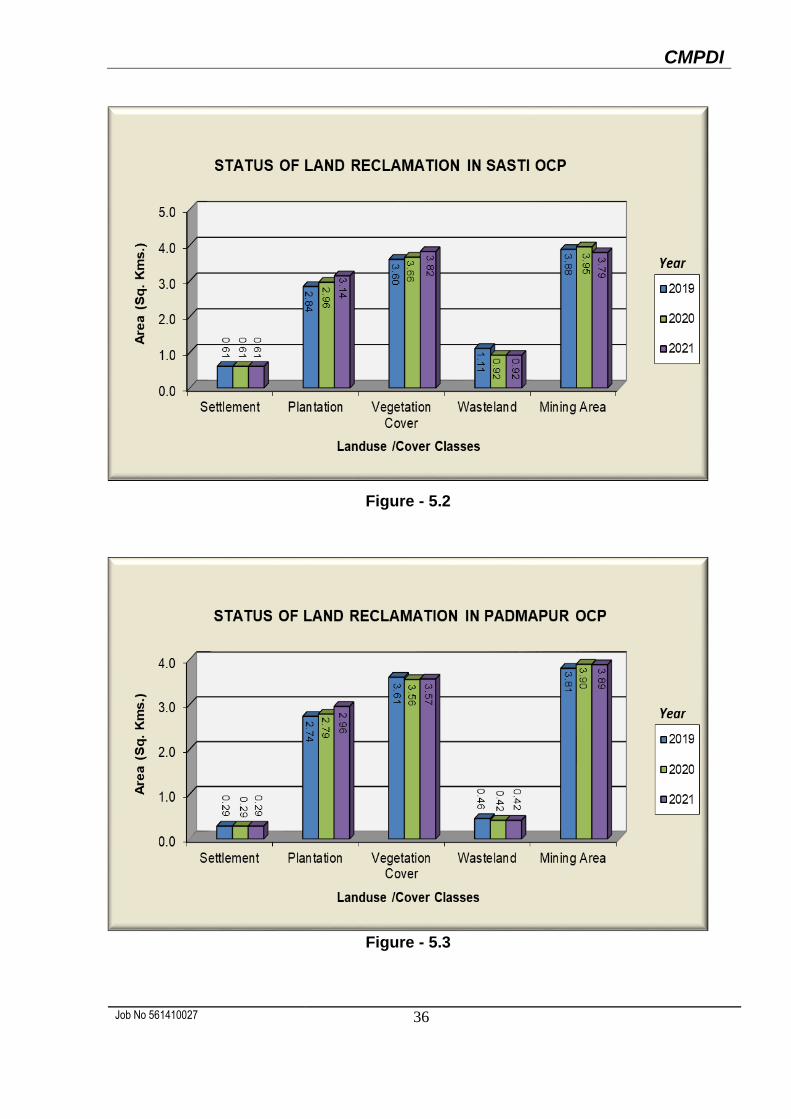
5.8 After comparing the satellite data of year 2021 vs. 2020, it is evident that total area
under plantation (Green Cover) in Sasti, Padmapur, Durgapur, Mugoli, Niljai,
Makardhokra-III and Penganga Opencast Projects has increased. It has been also
CMPDI
Job No 561410027 18
observed in some of the projects natural vegetation has also started growing on
stabilized old backfilled areas and overburden dumps due to high soil fertility.
5.9 On comparing the status of land reclamation for the year 2021 with respect to the year
2020 in different projects, it is evident that the total area under reclamation has
increased from 12.39 Km2 (Yr. 2020) to 14.37 Km2 (Yr. 2021).
5.10 Out of 14 projects of WCL, maximum area under reclamation is in Sasti Opencast
Project (85.53%) followed by Umrer OC (64.30%) and Mugoli OC (44.05%).
CMPDI
Job No 561410027 19
Project wise Land Reclamation Status in Opencast Projects of WCL
(> 5 million Cu. M. of Coal+OB) based on Satellite Data of the Year 2021
Note: In reference of the above Table, different parameters are classified as follows:
1. Area under Biological Reclamation includes areas under plantation done on backfilled area only. 2. Area under Technical Reclamation includes area under barren backfilled only 3. Area under Active mining includes coal quarry site, quarry filled with water. Area of Coal Dump has been excluded from Area under Active Mining in this table. 4. Social Forestry and Plantation on external OB dump are not included in Biological Reclamation and are put under separate categories as shown in the table. 5. (%) calculated in the above table is in respect of total excavated area except for “Total area under plantation” where (%) is in terms of leasehold area. 6. Leasehold Boundaries of Durgapur, Mugoli, Ukni and Niljai Opencast projects have been modified as per latest ECs.
1 2
2020 2021 2020 2021 2020 2021 2020 2021 2020 2021 2020 2021 2020 2021 2020 2021 2020 2021
1 Sasti 9.20 9.20 2.23 2.46 0.65 0.79 1.66 1.70 0.65 0.65 0.90 0.55 3.78 3.80 2.96 3.14 2.88 3.25
58.99% 64.74% 17.20% 20.79% 23.81% 14.47% 32.17% 34.13% 76.19% 85.53%
2 Padmapur 8.29 8.29 0.53 0.61 0.18 0.20 1.83 1.95 0.78 0.81 1.29 1.22 2.00 2.03 2.79 2.96 0.71 0.81
26.50% 30.05% 9.00% 9.85% 64.50% 60.10% 33.66% 35.71% 35.50% 39.90%
3 Durgapur 15.50 15.50 0.78 0.85 0.80 0.84 2.42 2.59 1.14 1.19 3.04 2.93 4.62 4.62 4.36 4.62 1.58 1.69
16.88% 18.40% 17.32% 18.18% 65.80% 63.42% 28.13% 29.81% 34.20% 36.58%
4 Mugoli 12.55 12.55 1.10 1.34 0.12 0.14 1.62 1.71 0.38 0.47 1.79 1.88 3.01 3.36 2.12 2.32 1.22 1.48
36.54% 39.88% 3.99% 4.17% 59.47% 55.95% 16.89% 18.49% 40.53% 44.05%5 Umrer 9.45 9.45 1.75 1.68 1.33 1.40 1.54 1.58 2.31 2.31 1.71 1.71 4.79 4.79 5.18 5.29 3.08 3.08
36.53% 35.07% 27.77% 29.23% 35.70% 35.70% 54.81% 55.98% 64.30% 64.30%
6 Ukni 12.85 12.85 0.30 0.48 0.00 0.00 1.56 1.64 0.68 0.72 2.07 1.97 2.37 2.45 2.24 2.36 0.30 0.48
12.66% 19.59% 0.00% 0.00% 87.34% 80.41% 17.43% 18.37% 12.66% 19.59%
7 Niljai 17.61 17.61 1.04 1.34 0.10 0.11 1.51 1.65 1.17 1.23 3.00 2.94 4.14 4.39 2.78 2.99 1.14 1.45
25.12% 30.52% 2.42% 2.51% 72.46% 66.97% 15.79% 16.98% 27.54% 33.03%
8 New Majri 7.74 7.74 1.05 1.13 0.21 0.36 1.68 1.32 1.35 1.47 2.43 2.28 3.69 3.77 3.24 3.15 1.26 1.49
28.46% 29.97% 5.69% 9.55% 65.85% 60.48% 41.86% 40.70% 34.15% 39.52%
9 MKD-III 9.23 9.23 0.07 0.31 0.00 0.00 0.00 0.00 0.05 0.07 1.10 1.02 1.17 1.33 0.05 0.07 0.07 0.31
5.98% 23.31% 0.00% 0.00% 94.02% 76.69% 0.54% 0.76% 5.98% 23.31%
10 Penganga 7.63 7.63 0.15 0.33 0.00 0.00 0.00 0.00 0.30 0.39 1.02 1.00 1.17 1.33 0.30 0.39 0.15 0.33
12.82% 24.81% 0.00% 0.00% 87.18% 75.19% 3.93% 5.11% 12.82% 24.81%
11 Yekona-I&II(Amal) 6.80 16.79 0.00 0.00 0.00 0.00 0.00 0.00 0.00 0.03 0.10 0.54 0.10 0.54 0.00 0.03 0.00 0.00
- 0.00% - 0.00% - 100.00% 0.00% 0.18% 0.00% 0.00%
12 New Majri UG to OC 4.79 7.06 0.00 0.00 0.00 0.00 0.00 0.00 0.05 0.33 0.57 0.75 0.57 0.75 0.05 0.33 0.00 0.00
- 0.00% - 0.00% - 100.00% 1.04% 4.67% 0.00% 0.00%
13 Pauni -II (Expn) 10.95 10.95 0.00 0.00 0.00 0.00 0.03 0.19 0.06 0.08 0.24 0.87 0.24 0.87 0.09 0.27 0.00 0.00
- 0.00% - 0.00% - 100.00% 0.82% 2.47% 0.00% 0.00%14 MKD -1 (Expn) OC 6.60 6.14 0.00 0.00 0.00 0.00 0.00 0.04 0.00 0.00 0.55 0.97 0.55 0.97 0.00 0.04 0.00 0.00
- 0.00% - 0.00% - 100.00% 0.00% 0.65% 0.00% 0.00%
Total 139.19 150.99 9.00 10.53 3.39 3.84 13.85 14.37 8.92 9.75 19.81 20.63 32.20 35.00 26.16 27.96 12.39 14.37
27.95% 30.09% 10.53% 10.97% 61.52% 58.94% 18.79% 18.52% 38.48% 41.06%
Total Area under
Reclamation
8
Sl.
No.Project
Other Plantations
Social Forestry, Avanue
Plantation Etc.
9 (=4+5+8)6 7
(Area in Sq. Kms.)
3
Area under Backfilling
Technical Reclamation
Plantation
Total Leasehold Area
4 11(=4+5)10 (=5+6+7)
Area under
Active Mining
Total Excavated
Area
Total Area under
Plantation (% Green Cover
Generated in Leasehold)
5
Plantation on Excavated /
Backfilled Area
Biological Reclamation
Plantation on External
Over Burden Dumps
Table 5.1
CMPDI
Job No 561410027 20
Figure : 5.1
CMPDI
Job No 561410027 21
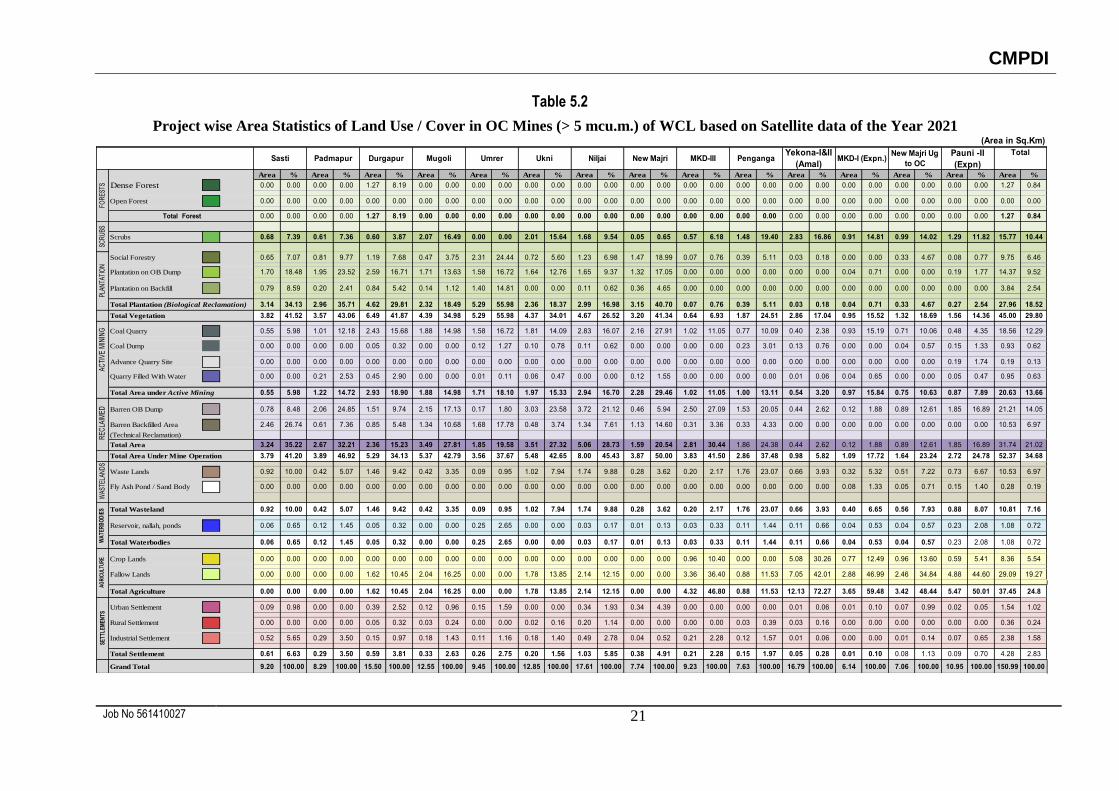
Table 5.2
Project wise Area Statistics of Land Use / Cover in OC Mines (> 5 mcu.m.) of WCL based on Satellite data of the Year 2021
Area % Area % Area % Area % Area % Area % Area % Area % Area % Area % Area % Area % Area % Area % Area %
Dense Forest 0.00 0.00 0.00 0.00 1.27 8.19 0.00 0.00 0.00 0.00 0.00 0.00 0.00 0.00 0.00 0.00 0.00 0.00 0.00 0.00 0.00 0.00 0.00 0.00 0.00 0.00 0.00 0.00 1.27 0.84
Open Forest 0.00 0.00 0.00 0.00 0.00 0.00 0.00 0.00 0.00 0.00 0.00 0.00 0.00 0.00 0.00 0.00 0.00 0.00 0.00 0.00 0.00 0.00 0.00 0.00 0.00 0.00 0.00 0.00 0.00 0.00
Total Forest 0.00 0.00 0.00 0.00 1.27 8.19 0.00 0.00 0.00 0.00 0.00 0.00 0.00 0.00 0.00 0.00 0.00 0.00 0.00 0.00 0.00 0.00 0.00 0.00 0.00 0.00 0.00 0.00 1.27 0.84
Scrubs 0.68 7.39 0.61 7.36 0.60 3.87 2.07 16.49 0.00 0.00 2.01 15.64 1.68 9.54 0.05 0.65 0.57 6.18 1.48 19.40 2.83 16.86 0.91 14.81 0.99 14.02 1.29 11.82 15.77 10.44
Social Forestry 0.65 7.07 0.81 9.77 1.19 7.68 0.47 3.75 2.31 24.44 0.72 5.60 1.23 6.98 1.47 18.99 0.07 0.76 0.39 5.11 0.03 0.18 0.00 0.00 0.33 4.67 0.08 0.77 9.75 6.46
Plantation on OB Dump 1.70 18.48 1.95 23.52 2.59 16.71 1.71 13.63 1.58 16.72 1.64 12.76 1.65 9.37 1.32 17.05 0.00 0.00 0.00 0.00 0.00 0.00 0.04 0.71 0.00 0.00 0.19 1.77 14.37 9.52
Plantation on Backfill 0.79 8.59 0.20 2.41 0.84 5.42 0.14 1.12 1.40 14.81 0.00 0.00 0.11 0.62 0.36 4.65 0.00 0.00 0.00 0.00 0.00 0.00 0.00 0.00 0.00 0.00 0.00 0.00 3.84 2.54
Total Plantation (Biological Reclamation) 3.14 34.13 2.96 35.71 4.62 29.81 2.32 18.49 5.29 55.98 2.36 18.37 2.99 16.98 3.15 40.70 0.07 0.76 0.39 5.11 0.03 0.18 0.04 0.71 0.33 4.67 0.27 2.54 27.96 18.52
Total Vegetation 3.82 41.52 3.57 43.06 6.49 41.87 4.39 34.98 5.29 55.98 4.37 34.01 4.67 26.52 3.20 41.34 0.64 6.93 1.87 24.51 2.86 17.04 0.95 15.52 1.32 18.69 1.56 14.36 45.00 29.80
Coal Quarry 0.55 5.98 1.01 12.18 2.43 15.68 1.88 14.98 1.58 16.72 1.81 14.09 2.83 16.07 2.16 27.91 1.02 11.05 0.77 10.09 0.40 2.38 0.93 15.19 0.71 10.06 0.48 4.35 18.56 12.29
Coal Dump 0.00 0.00 0.00 0.00 0.05 0.32 0.00 0.00 0.12 1.27 0.10 0.78 0.11 0.62 0.00 0.00 0.00 0.00 0.23 3.01 0.13 0.76 0.00 0.00 0.04 0.57 0.15 1.33 0.93 0.62
Advance Quarry Site 0.00 0.00 0.00 0.00 0.00 0.00 0.00 0.00 0.00 0.00 0.00 0.00 0.00 0.00 0.00 0.00 0.00 0.00 0.00 0.00 0.00 0.00 0.00 0.00 0.00 0.00 0.19 1.74 0.19 0.13
Quarry Filled With Water 0.00 0.00 0.21 2.53 0.45 2.90 0.00 0.00 0.01 0.11 0.06 0.47 0.00 0.00 0.12 1.55 0.00 0.00 0.00 0.00 0.01 0.06 0.04 0.65 0.00 0.00 0.05 0.47 0.95 0.63
Total Area under Active Mining 0.55 5.98 1.22 14.72 2.93 18.90 1.88 14.98 1.71 18.10 1.97 15.33 2.94 16.70 2.28 29.46 1.02 11.05 1.00 13.11 0.54 3.20 0.97 15.84 0.75 10.63 0.87 7.89 20.63 13.66
Barren OB Dump 0.78 8.48 2.06 24.85 1.51 9.74 2.15 17.13 0.17 1.80 3.03 23.58 3.72 21.12 0.46 5.94 2.50 27.09 1.53 20.05 0.44 2.62 0.12 1.88 0.89 12.61 1.85 16.89 21.21 14.05
Barren Backfilled Area 2.46 26.74 0.61 7.36 0.85 5.48 1.34 10.68 1.68 17.78 0.48 3.74 1.34 7.61 1.13 14.60 0.31 3.36 0.33 4.33 0.00 0.00 0.00 0.00 0.00 0.00 0.00 0.00 10.53 6.97
(Technical Reclamation)
Total Area 3.24 35.22 2.67 32.21 2.36 15.23 3.49 27.81 1.85 19.58 3.51 27.32 5.06 28.73 1.59 20.54 2.81 30.44 1.86 24.38 0.44 2.62 0.12 1.88 0.89 12.61 1.85 16.89 31.74 21.02
Total Area Under Mine Operation 3.79 41.20 3.89 46.92 5.29 34.13 5.37 42.79 3.56 37.67 5.48 42.65 8.00 45.43 3.87 50.00 3.83 41.50 2.86 37.48 0.98 5.82 1.09 17.72 1.64 23.24 2.72 24.78 52.37 34.68
Waste Lands 0.92 10.00 0.42 5.07 1.46 9.42 0.42 3.35 0.09 0.95 1.02 7.94 1.74 9.88 0.28 3.62 0.20 2.17 1.76 23.07 0.66 3.93 0.32 5.32 0.51 7.22 0.73 6.67 10.53 6.97
Fly Ash Pond / Sand Body 0.00 0.00 0.00 0.00 0.00 0.00 0.00 0.00 0.00 0.00 0.00 0.00 0.00 0.00 0.00 0.00 0.00 0.00 0.00 0.00 0.00 0.00 0.08 1.33 0.05 0.71 0.15 1.40 0.28 0.19
Total Wasteland 0.92 10.00 0.42 5.07 1.46 9.42 0.42 3.35 0.09 0.95 1.02 7.94 1.74 9.88 0.28 3.62 0.20 2.17 1.76 23.07 0.66 3.93 0.40 6.65 0.56 7.93 0.88 8.07 10.81 7.16
Reservoir, nallah, ponds 0.06 0.65 0.12 1.45 0.05 0.32 0.00 0.00 0.25 2.65 0.00 0.00 0.03 0.17 0.01 0.13 0.03 0.33 0.11 1.44 0.11 0.66 0.04 0.53 0.04 0.57 0.23 2.08 1.08 0.72
Total Waterbodies 0.06 0.65 0.12 1.45 0.05 0.32 0.00 0.00 0.25 2.65 0.00 0.00 0.03 0.17 0.01 0.13 0.03 0.33 0.11 1.44 0.11 0.66 0.04 0.53 0.04 0.57 0.23 2.08 1.08 0.72
Crop Lands 0.00 0.00 0.00 0.00 0.00 0.00 0.00 0.00 0.00 0.00 0.00 0.00 0.00 0.00 0.00 0.00 0.96 10.40 0.00 0.00 5.08 30.26 0.77 12.49 0.96 13.60 0.59 5.41 8.36 5.54
Fallow Lands 0.00 0.00 0.00 0.00 1.62 10.45 2.04 16.25 0.00 0.00 1.78 13.85 2.14 12.15 0.00 0.00 3.36 36.40 0.88 11.53 7.05 42.01 2.88 46.99 2.46 34.84 4.88 44.60 29.09 19.27
Total Agriculture 0.00 0.00 0.00 0.00 1.62 10.45 2.04 16.25 0.00 0.00 1.78 13.85 2.14 12.15 0.00 0.00 4.32 46.80 0.88 11.53 12.13 72.27 3.65 59.48 3.42 48.44 5.47 50.01 37.45 24.8
Urban Settlement 0.09 0.98 0.00 0.00 0.39 2.52 0.12 0.96 0.15 1.59 0.00 0.00 0.34 1.93 0.34 4.39 0.00 0.00 0.00 0.00 0.01 0.06 0.01 0.10 0.07 0.99 0.02 0.05 1.54 1.02
Rural Settlement 0.00 0.00 0.00 0.00 0.05 0.32 0.03 0.24 0.00 0.00 0.02 0.16 0.20 1.14 0.00 0.00 0.00 0.00 0.03 0.39 0.03 0.16 0.00 0.00 0.00 0.00 0.00 0.00 0.36 0.24
Industrial Settlement 0.52 5.65 0.29 3.50 0.15 0.97 0.18 1.43 0.11 1.16 0.18 1.40 0.49 2.78 0.04 0.52 0.21 2.28 0.12 1.57 0.01 0.06 0.00 0.00 0.01 0.14 0.07 0.65 2.38 1.58
Total Settlement 0.61 6.63 0.29 3.50 0.59 3.81 0.33 2.63 0.26 2.75 0.20 1.56 1.03 5.85 0.38 4.91 0.21 2.28 0.15 1.97 0.05 0.28 0.01 0.10 0.08 1.13 0.09 0.70 4.28 2.83
Grand Total 9.20 100.00 8.29 100.00 15.50 100.00 12.55 100.00 9.45 100.00 12.85 100.00 17.61 100.00 7.74 100.00 9.23 100.00 7.63 100.00 16.79 100.00 6.14 100.00 7.06 100.00 10.95 100.00 150.99 100.00
MKD-III PengangaYekona-I&II
(Amal)MKD-I (Expn.)
New Majri Ug
to OCSasti Padmapur Durgapur
(Area in Sq.Km)
TotalUkni Niljai New Majri
Pauni -II
(Expn)
SE
TTLE
ME
NTS
AC
TIV
E M
ININ
GR
EC
LAIM
ED
WAS
TELA
ND
SW
ATE
RB
OD
IES
AG
RIC
ULT
UR
EFO
RES
TSSC
RU
BSPL
ANTA
TIO
N
Mugoli Umrer
CMPDI
Job No 561410027 22
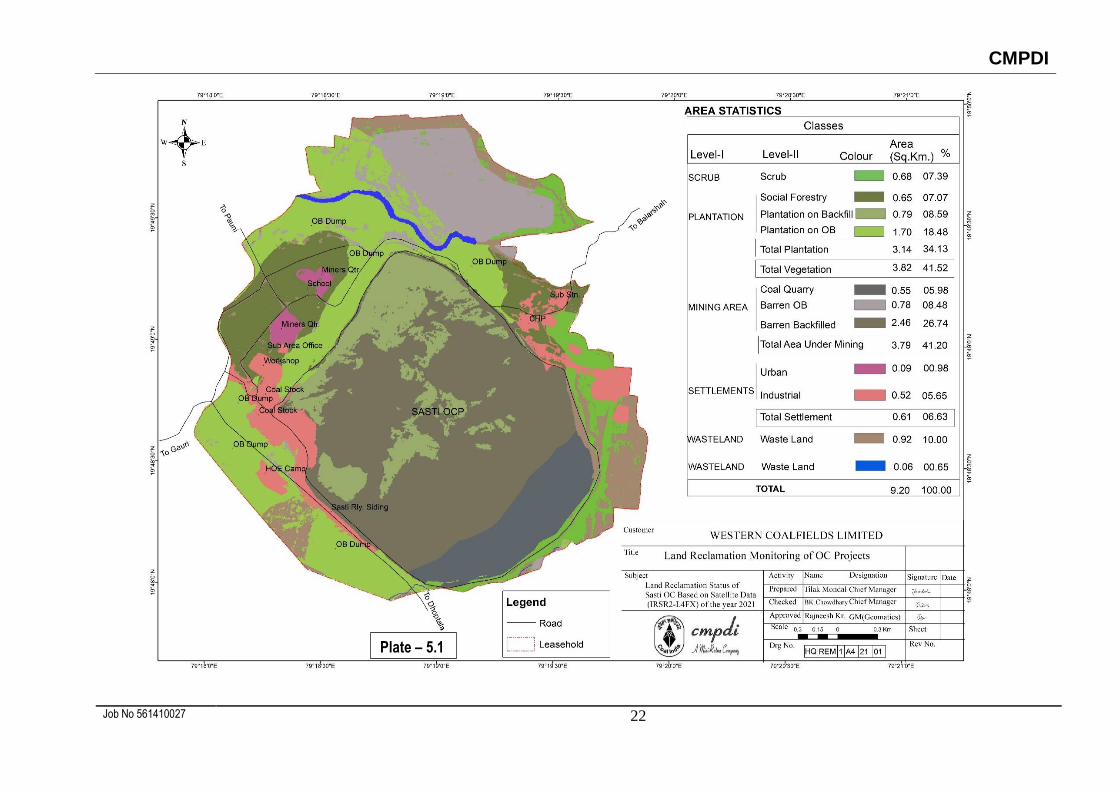
Plate – 5.1
CMPDI
Job No 561410027 23
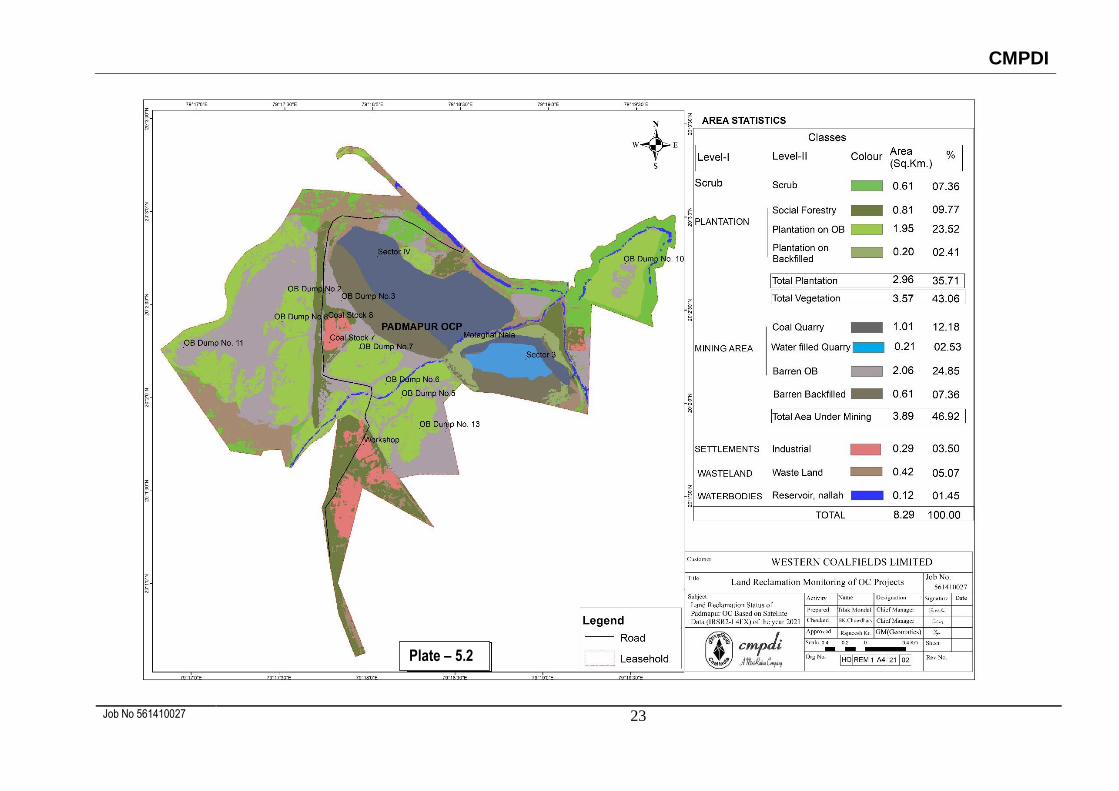
Plate – 5.2 Plate – 5.2
CMPDI
561410027 24
Plate – 5.3
CMPDI
Job No 561410027 25
Plate – 5.4
CMPDI
Job No 561410027 26
Plate – 5.5
CMPDI
Job No 561410027 27
Plate – 5.6
CMPDI
Job No 561410027 28
Plate – 5.7
CMPDI
Job No 561410027 29
Plate – 5.8
CMPDI
Job No 561410027 30
Plate – 5.9
CMPDI
Job No 561410027 31
Plate – 5.10
CMPDI
Job No 561410027 32
Plate – 5.11

CMPDI
Job No 561410027 33
Plate – 5.12
CMPDI
Job No 561410027 34
Plate – 5.13
CMPDI
Job No 561410027 35
Plate – 5.14
CMPDI
Job No 561410027 36
Figure - 5.2
Figure - 5.3
CMPDI
Job No 561410027 37
Figure - 5.4
Figure - 5.5
CMPDI
Job No 561410027 38
Figure - 5.6
Figure - 5.7
CMPDI
Job No 561410027 39
Figure - 5.8
Figure - 5.9
CMPDI
Job No 561410027 40
Figure – 5.10
Figure - 5.11
CMPDI
Job No 561410027 41
Figure - 5.12
Figure - 5.13
CMPDI
Job No 561410027 42
Figure - 5.14
Figure - 5.15
CMPDI
Job No 561410027 43
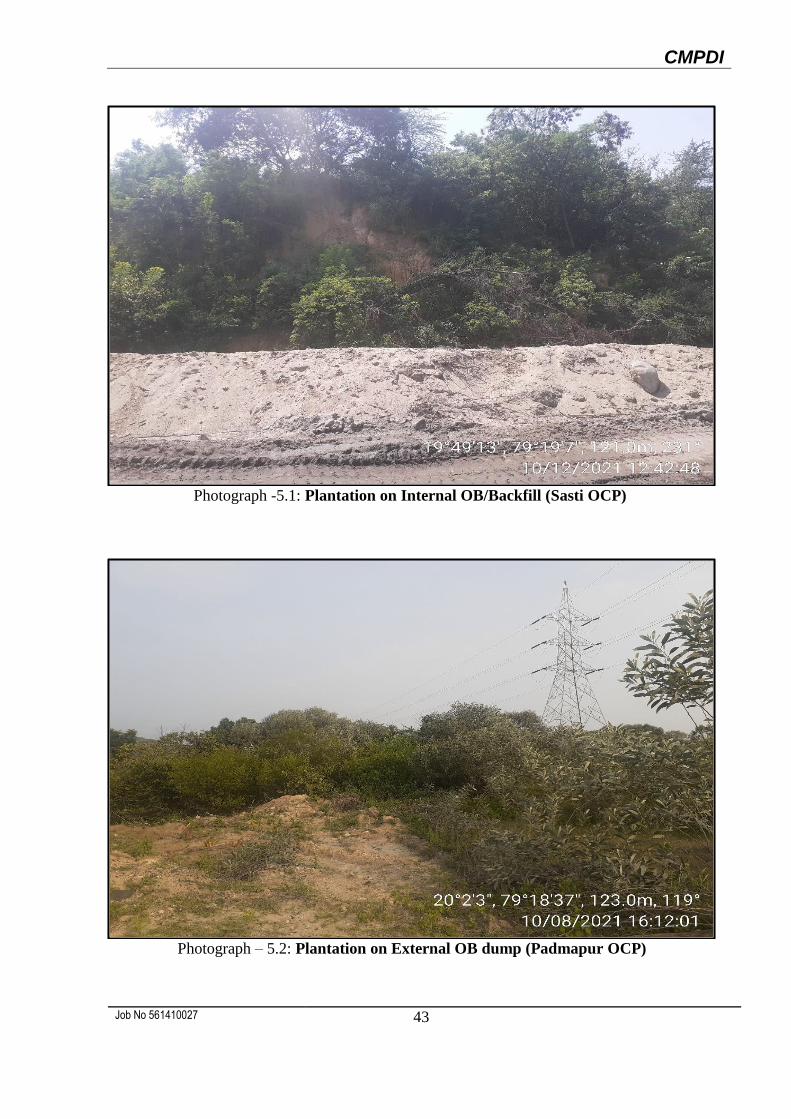
Photograph -5.1: Plantation on Internal OB/Backfill (Sasti OCP)
Photograph – 5.2: Plantation on External OB dump (Padmapur OCP)
CMPDI
Job No 561410027 44
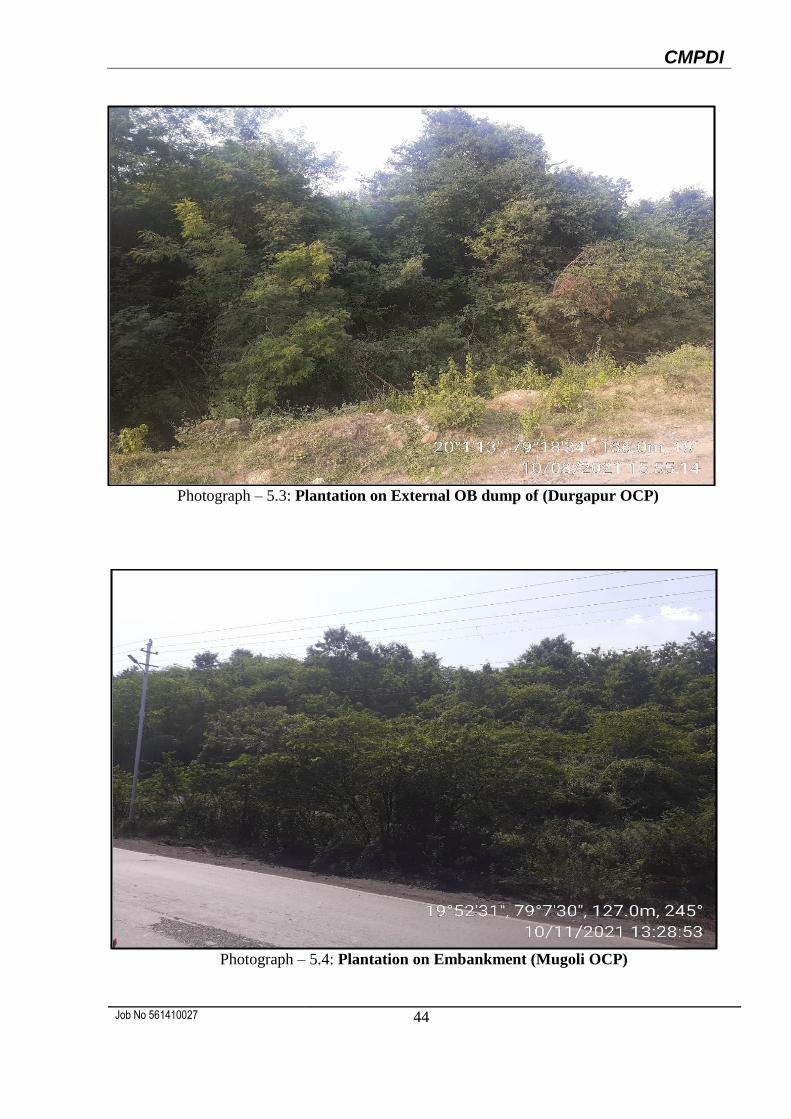
Photograph – 5.3: Plantation on External OB dump of (Durgapur OCP)
Photograph – 5.4: Plantation on Embankment (Mugoli OCP)
CMPDI
Job No 561410027 45
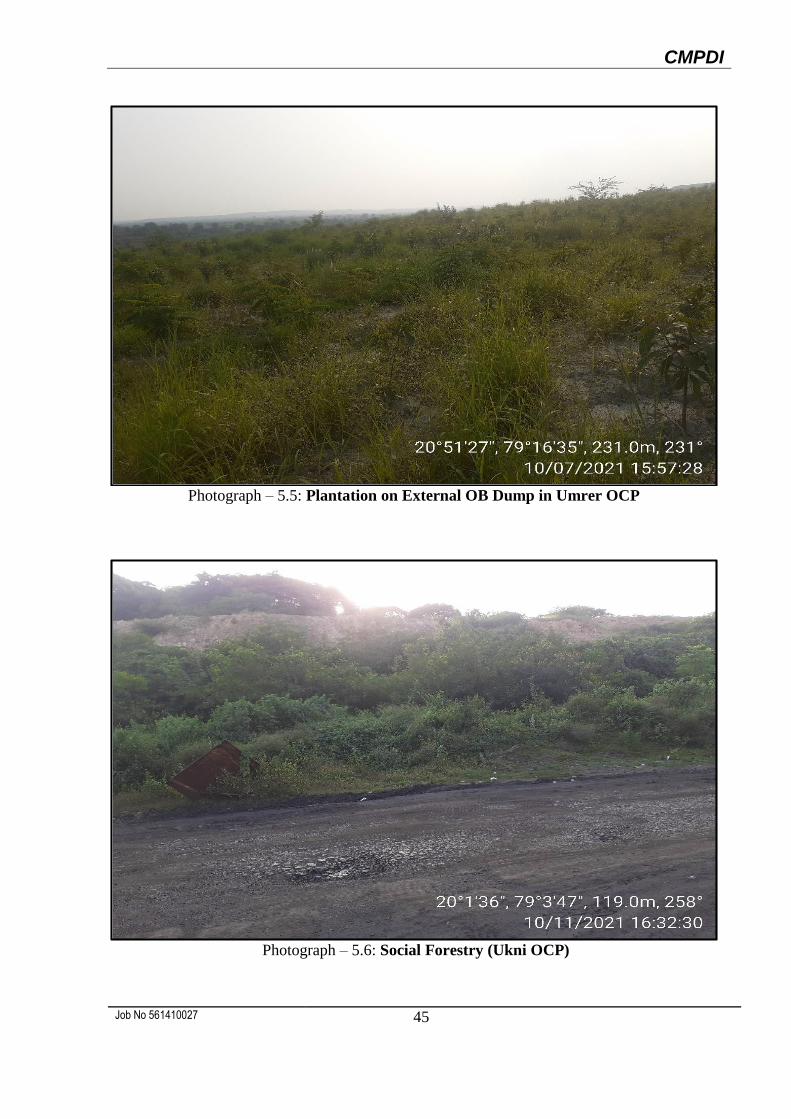
Photograph – 5.5: Plantation on External OB Dump in Umrer OCP
Photograph – 5.6: Social Forestry (Ukni OCP)
CMPDI
Job No 561410027 46
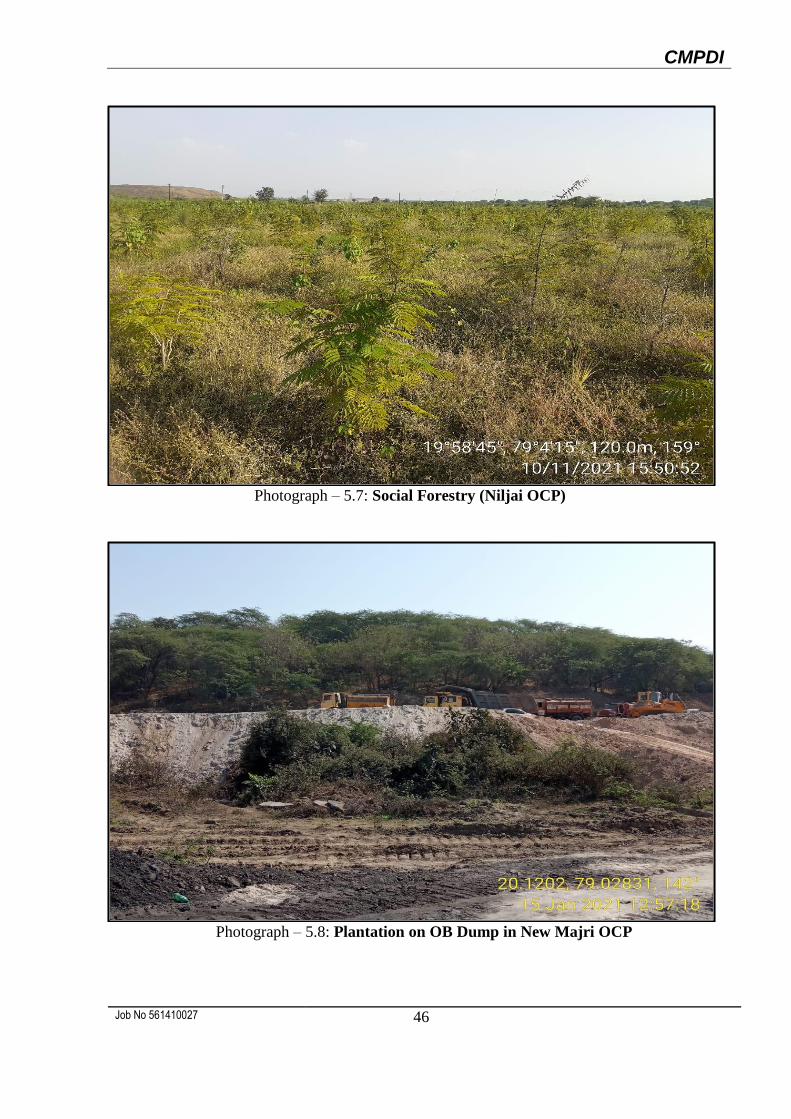
Photograph – 5.7: Social Forestry (Niljai OCP)
Photograph – 5.8: Plantation on OB Dump in New Majri OCP
CMPDI
Job No 561410027 47
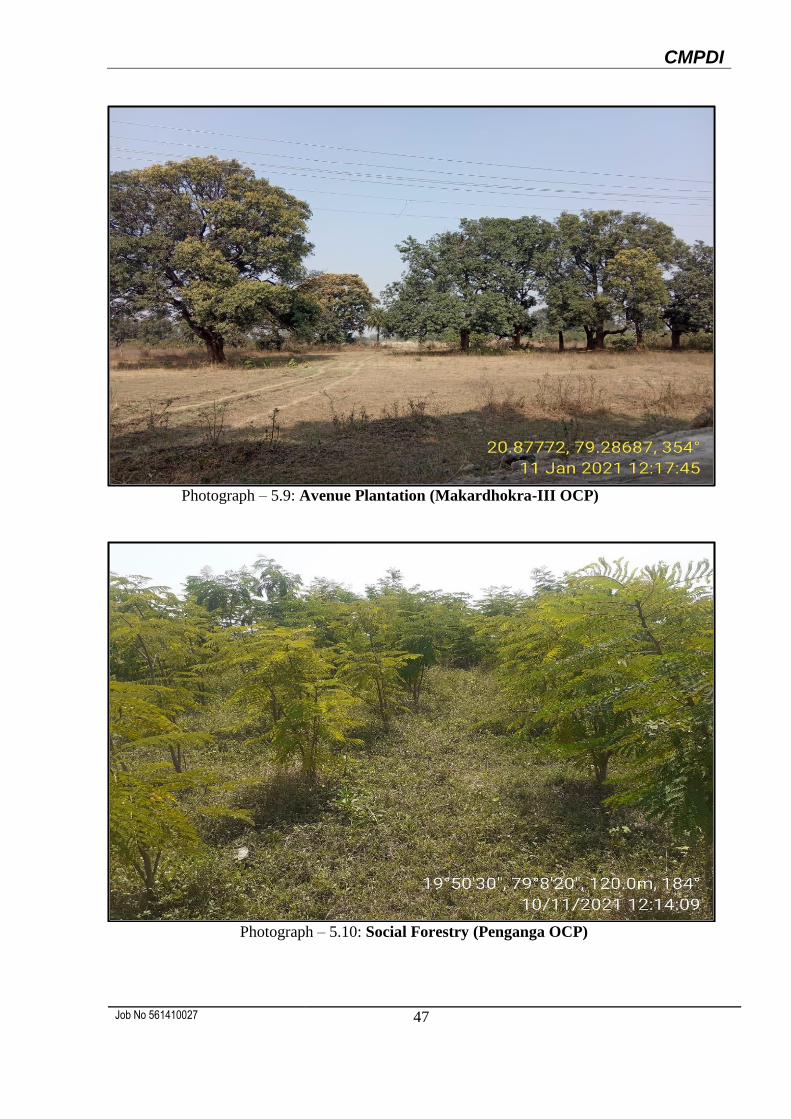
Photograph – 5.9: Avenue Plantation (Makardhokra-III OCP)
Photograph – 5.10: Social Forestry (Penganga OCP)
CMPDI
Job No 561410027 48
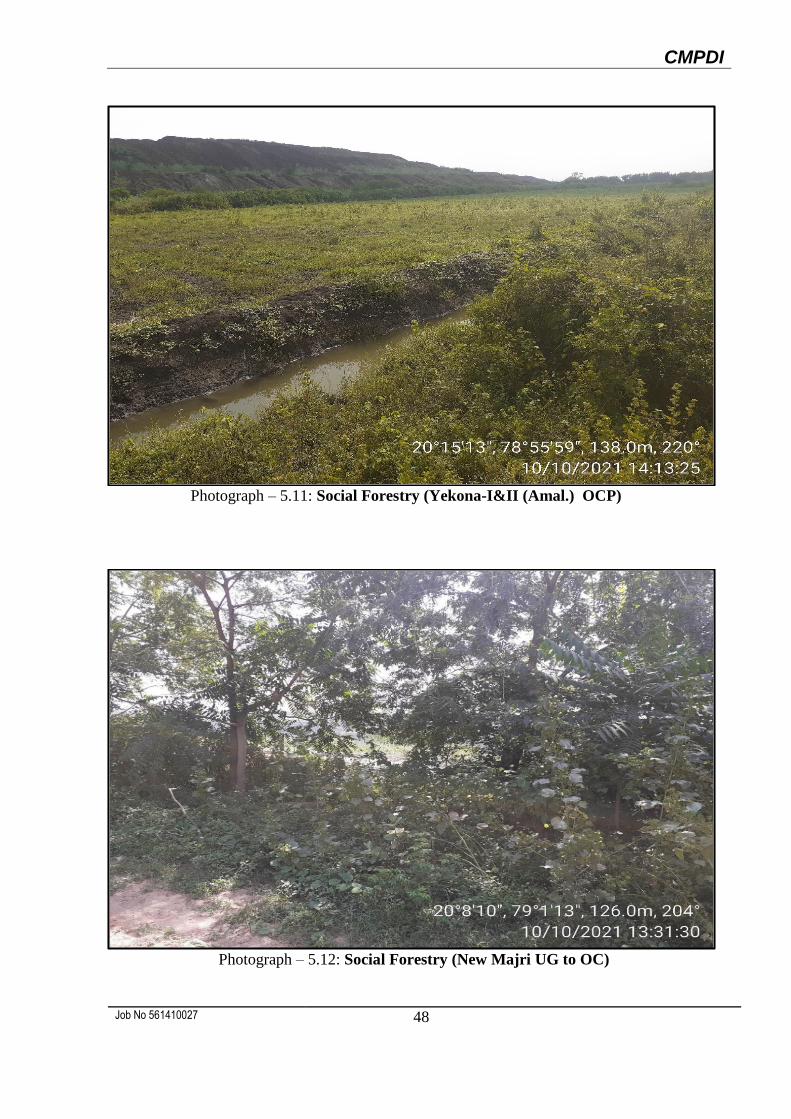
Photograph – 5.11: Social Forestry (Yekona-I&II (Amal.) OCP)
Photograph – 5.12: Social Forestry (New Majri UG to OC)
CMPDI
Job No 561410027 49
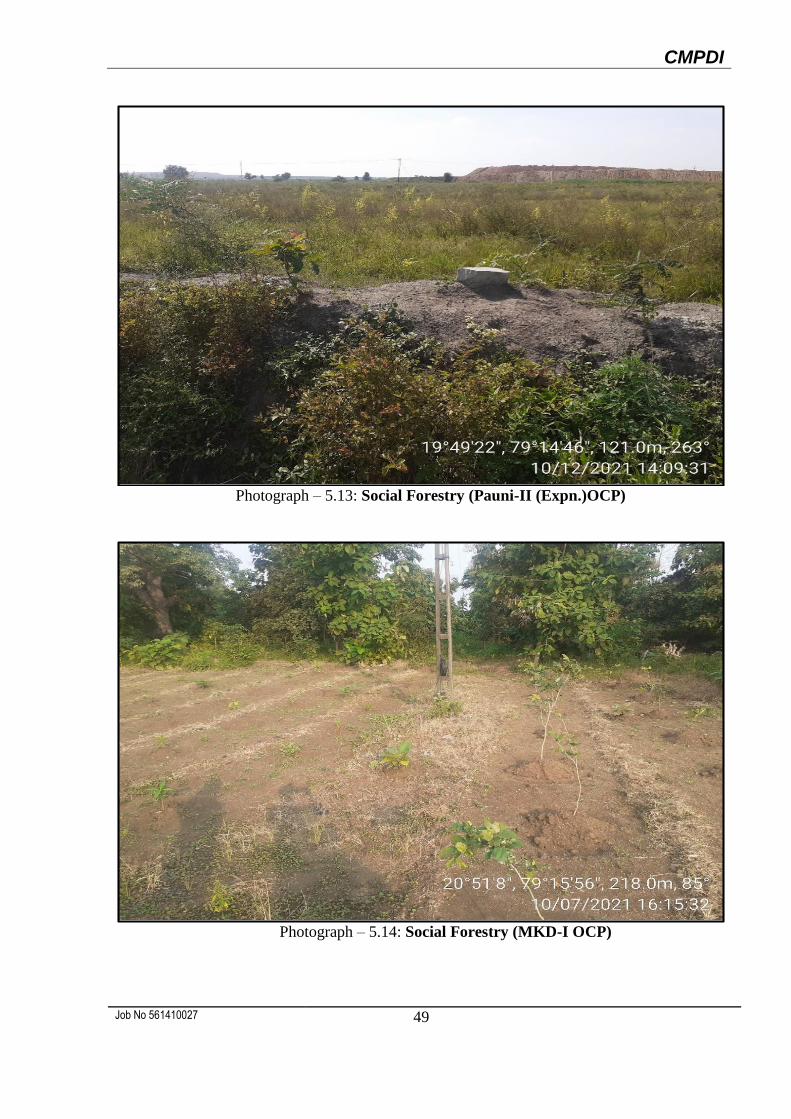
Photograph – 5.13: Social Forestry (Pauni-II (Expn.)OCP)
Photograph – 5.14: Social Forestry (MKD-I OCP)

SOUTH EASTERN COALFIELDS IMITED
CMPDI
Job No 561410027 51
6.0 Land Reclamation Status in South Eastern Coalfields Limited
6.1 Following nineteen opencast projects of SECL producing 5 million cubic m. or more
(Coal+OB) together were taken up for land reclamation monitoring based on satellite
data during the year 2021-22:
Dipka
Gevra
Kusmunda
Manikpur
Chirimiri
Rajnagar
Dhanpuri
Jamuna
Saraipali
Bijari
Chhal
Mahan- II
Amadand
Amera
Batura
Jampali
Ambika
Jagannathpur
6.2 Project wise Land Reclamation status of the above 19 projects of SECL for the year
2021 is given in Table 6.1 & 6.2 and also shown graphically in Fig 6.1. Area statistics
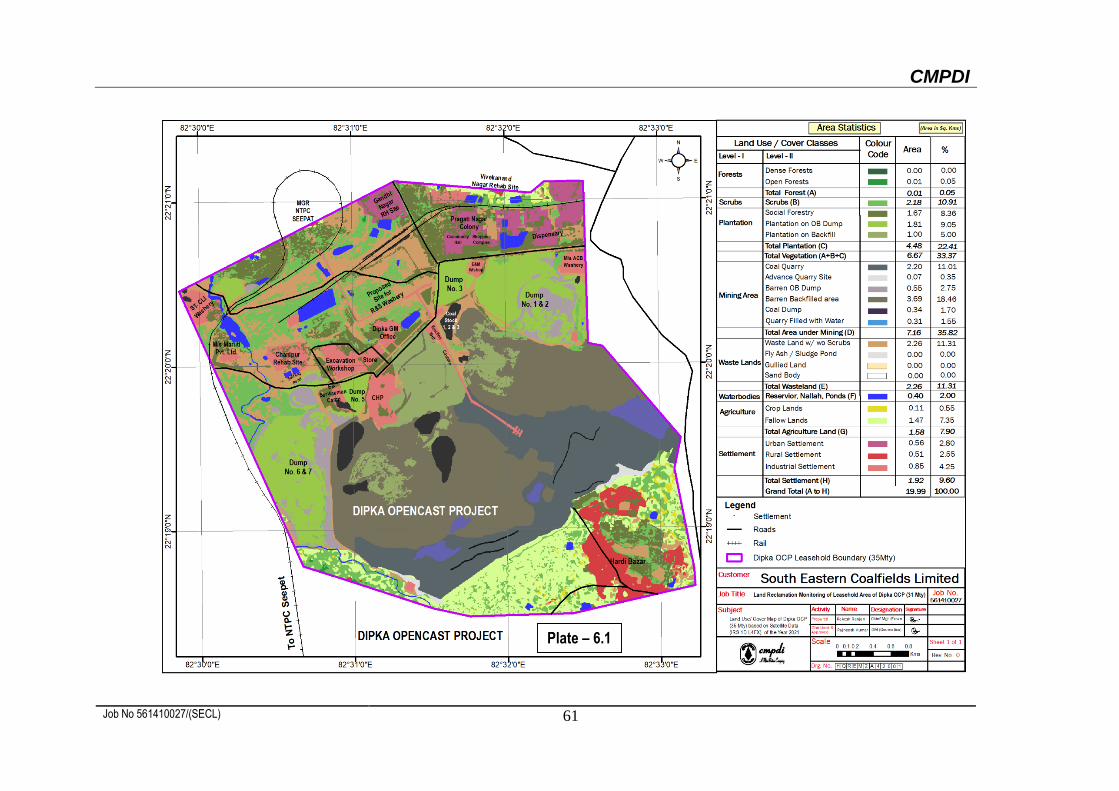
of different land use cover / class present in the mine leasehold boundaries of the above
projects for the year 2021 are shown in the Table –6.3. Land use / cover maps derived
from satellite data are shown in Plate 6.1 - 6.19. Year wise changes in the different land
use / cover classes in last three years based on satellite data are depicted in Bar Charts
in Fig. 6.2 - 6.20.
CMPDI
Job No 561410027 52
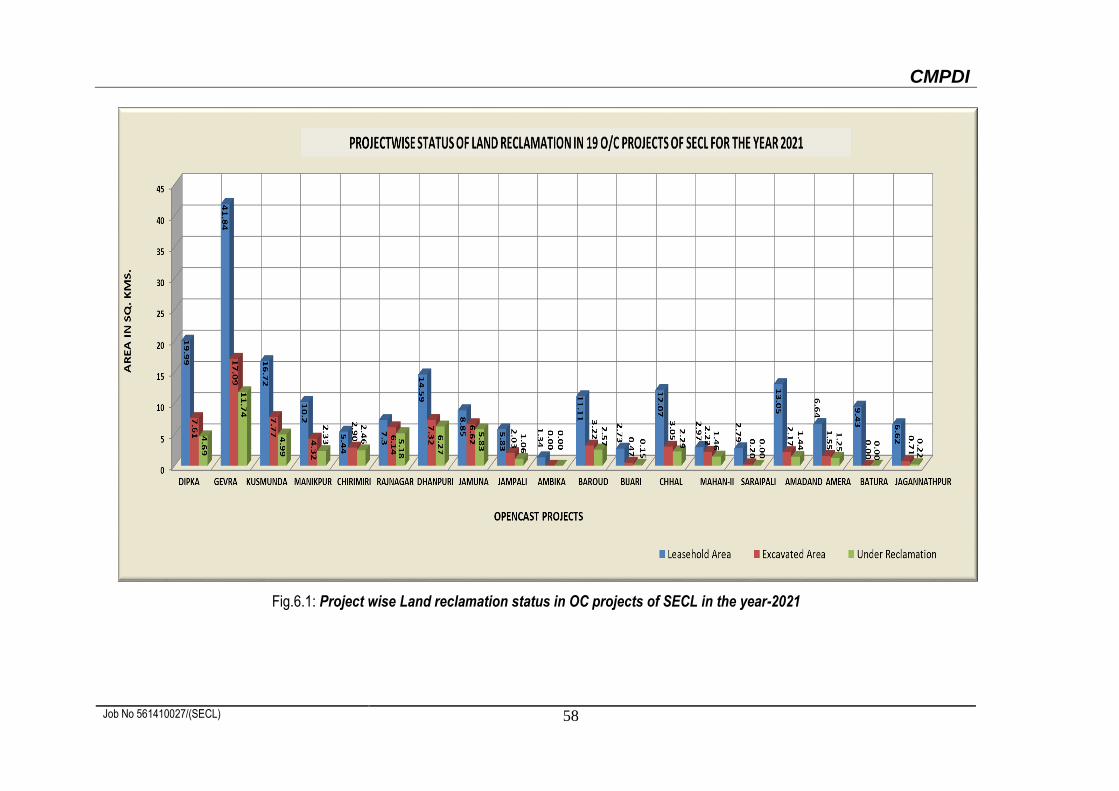
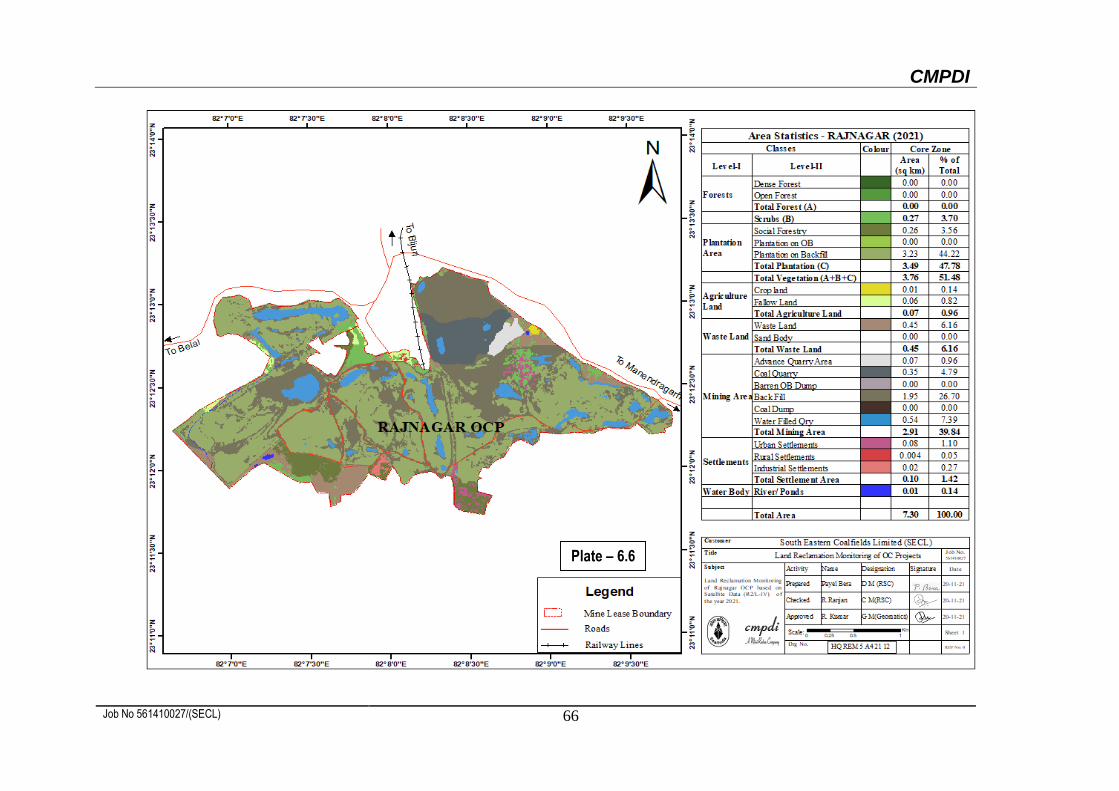
6.3 Study reveals that in the above mentioned 19 projects of SECL under more than 5 mcm
(Coal+OB) per annum category, out of total 75.39 Km2 excavated area; 53.93 Km2 area
(71.53%) is under reclamation, out of which 35.10 Km2 (46.56%) area is under
technical reclamation and 18.83 Km2 (24.98%) area is already under biological
reclamation.
6.4 After analyzing the satellite data of the year 2021, it is evident that area under land
reclamation for the selected eight (08) projects of SECL under Group A (Table 6.1) viz
Dipka, Gevra, Kusmunda, Manikpur, Chirimiri, Rajnagar, Dhanpuri Amlai Group of
Mines and Jamuna has increased from 41.03 Km2 (70.70%) in the year 2020 to 43.49
Km2 (72.76%) in the year 2021 in a period of one year. There is an increase of 2.46
Km2 of area under reclamation in projects under Group A, out of which 2.18 Km2 area
is under technical reclamation and 0.28 Km2 area is under Biological reclamation.
6.5 Study indicates that although there has been overall a substantial increase of 2.18 Km2
of area under technical reclamation (Barren Backfilling) for the mines under Group A
(Table 6.1) during the year 2021, but for projects like Chirimiri, Rajnagar & Jamuna
OCPs, area under technical reclamation has gone down slightly as compared to the year
2020 as more areas are coming under Biological Reclamation
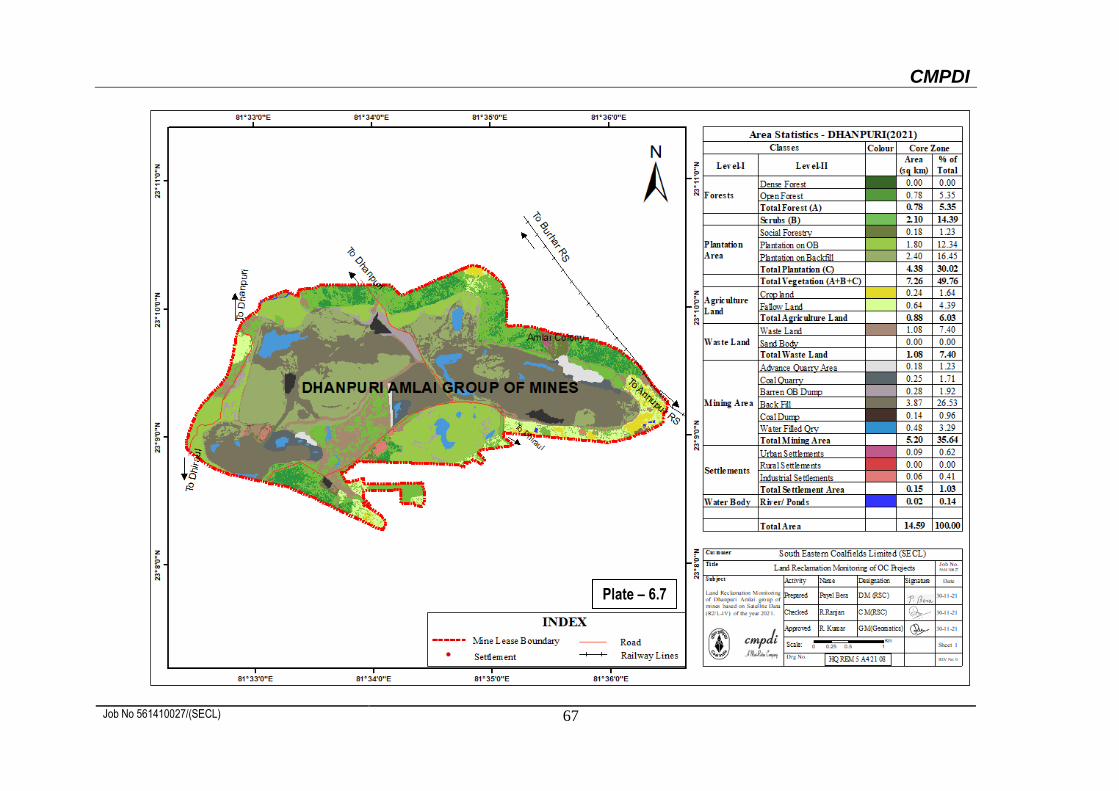
6.6 Similarly, it has been also observed that in projects like Gevra, Kusmunda & Dhanpuri
Amlai Group of mines, the area under Biological Reclamation has been slightly reduced
which may have resulted due to biotic interference or due to OB dumping on vegetated
backfilled area in view of constrain of dumping space.
6.7 Total Green Cover generated in the leasehold of the eight projects of Group A has
increased from 35.40 Km2 (26.38%) in the year 2020 to 36.12 Km2 (28.91%) in the year
2021 in a period of one year. There has been an increase of 0.72 Km2 of Green Cover
in the leasehold of eight projects of Group A, however in projects like Kusmunda,
CMPDI
Job No 561410027 53
Manikpur and Dhanpuri Amlai Group of mines there has been a slight reduction in area
under Green Cover. In Kusmunda, a planted OB Dump on western side of OCP has
been rehandled to make space for Coal Stock whereas in Manikpur OCP, the leasehold
boundaries of the project has been modified as per EC notified area which has resulted
in loss of Green Cover area. In Dhanpuri Amlai Group of mines there has been
infrastructure development within the leasehold boundary resulting in loss of area under
Green Cover.
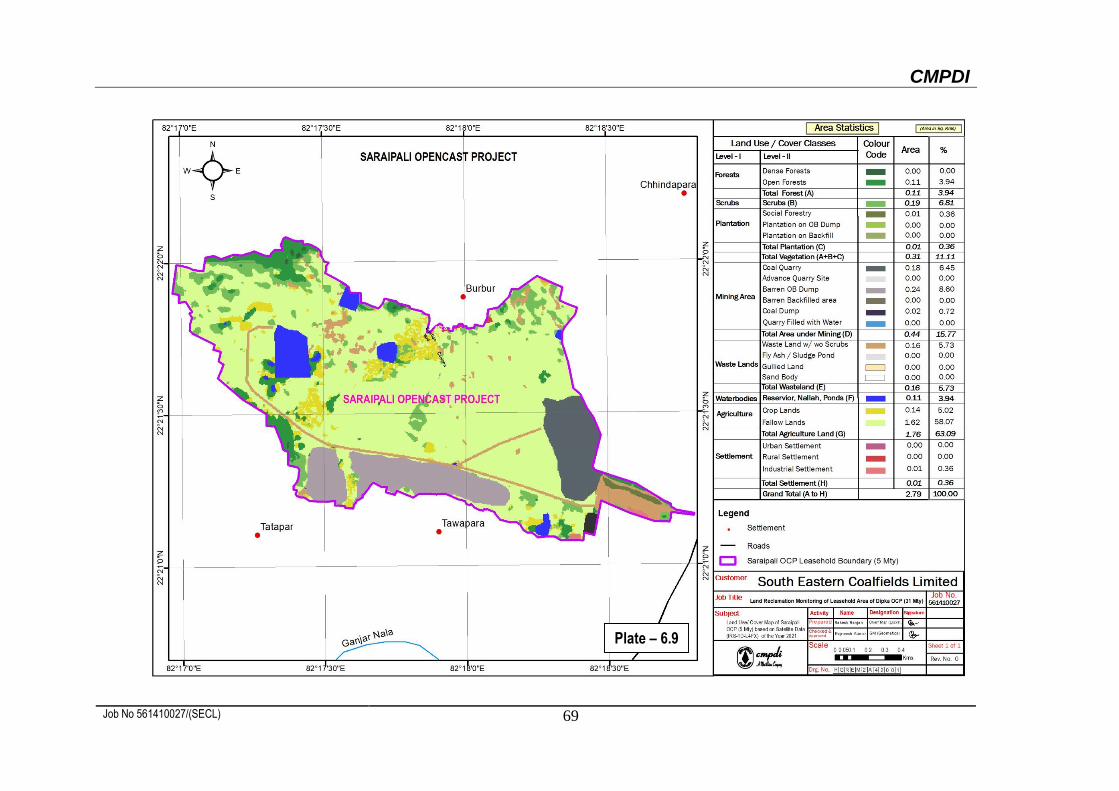
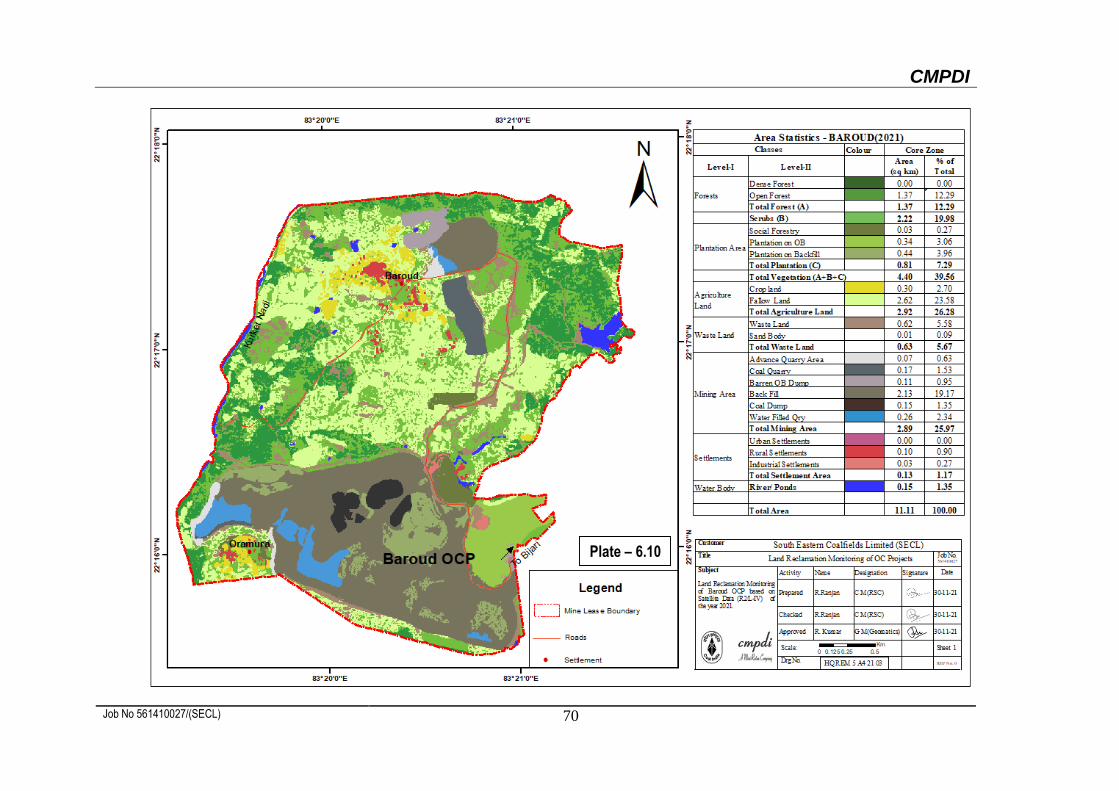
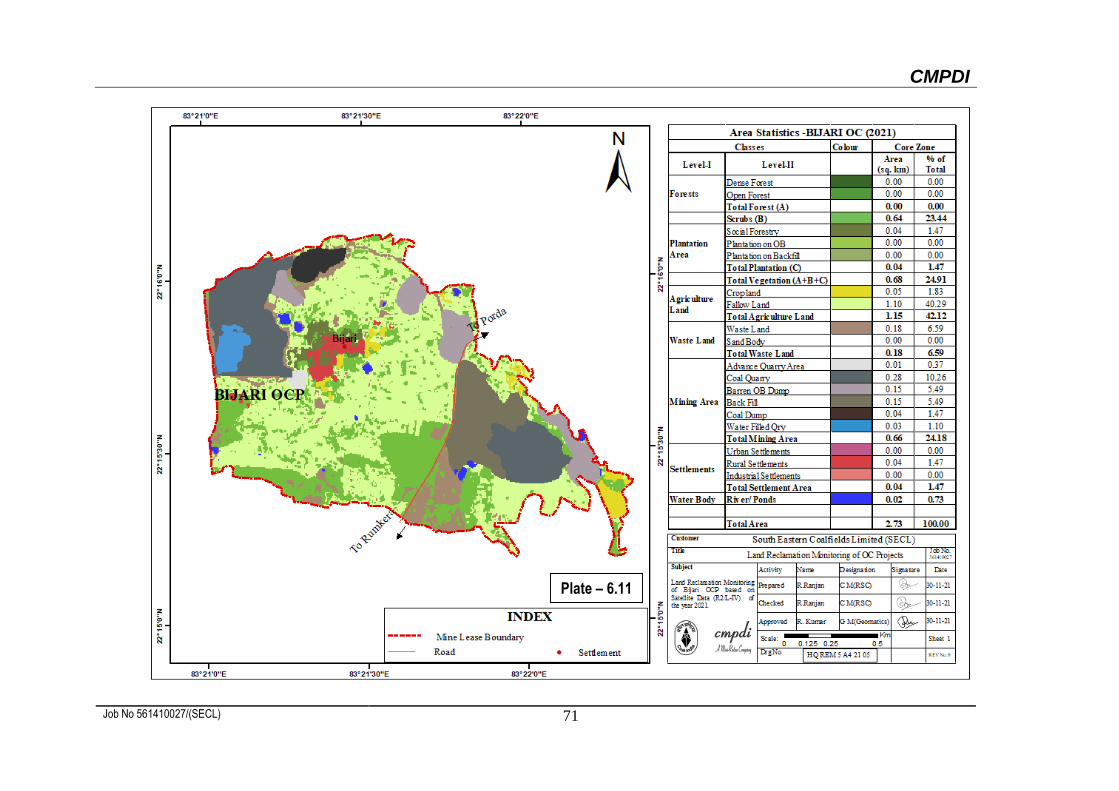
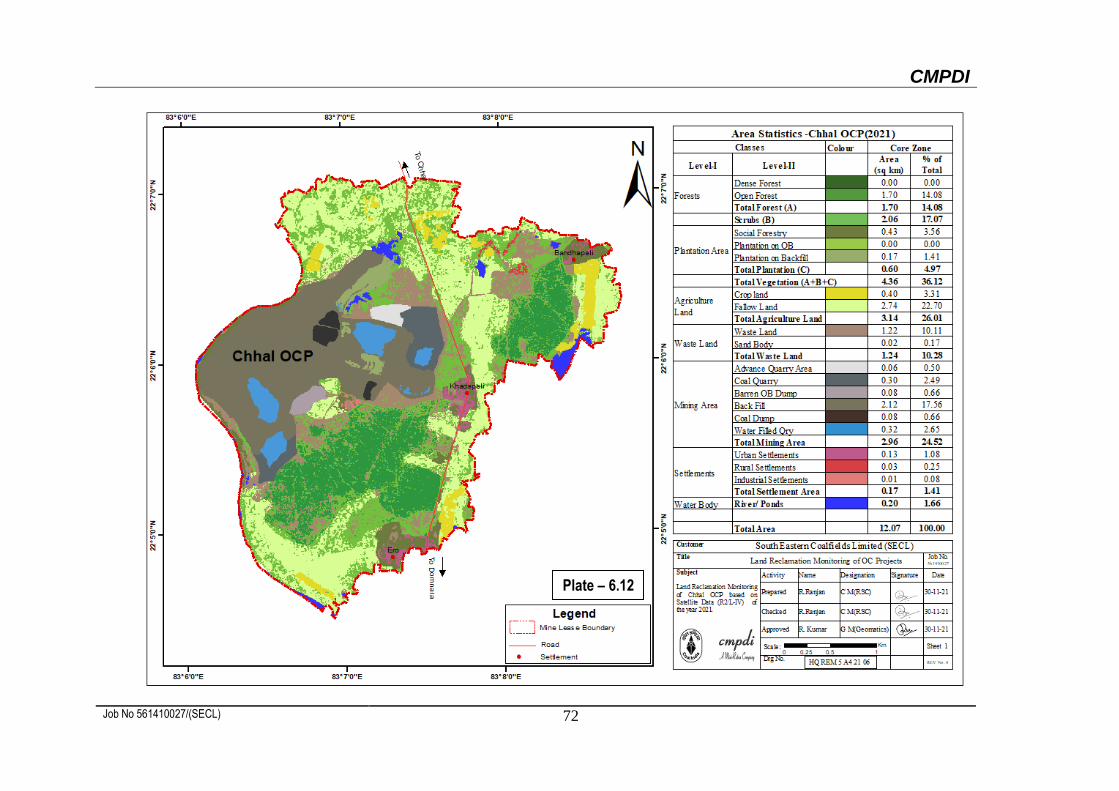
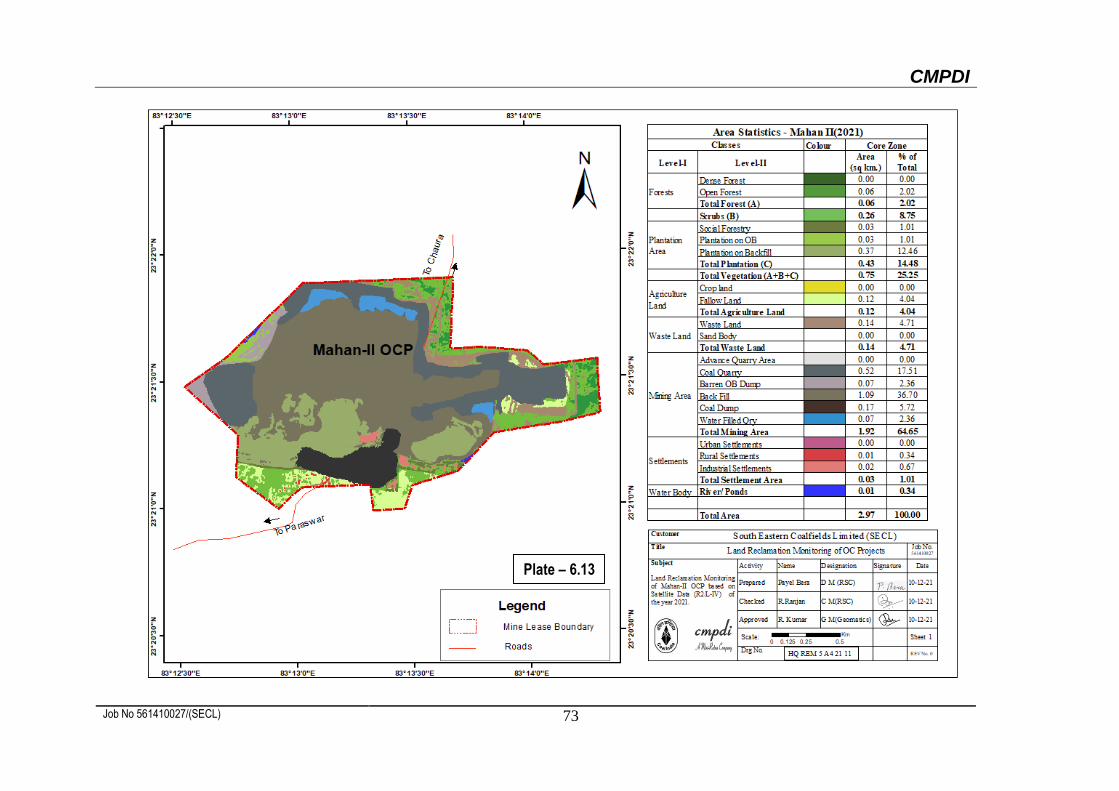
6.8 In projects under Group B (Table-6.1), viz Saraipali, Baroud, Bijari, Chhal and Mahan
II, area under land reclamation has increased from 5.51 Km2 (64.52%) in the year 2020
to 6.47 Km2 (70.63%) in the year 2021. There is an increase of 0.96 Km2 of area under
reclamation in projects under Group B, out of which 0.86 Km2 area is under technical
reclamation and 0.10 Km2 area is under Biological reclamation.
The projects under Group B (Table-6.1) were previously monitored under Less than
5mcm (Coal+OB) per annum category at an interval of three years. The previous cycle
of Land Reclamation monitoring of these projects was done in 2020-21.
6.9 It has been observed that there has been overall an increase of 0.86 Km2 of area under
technical reclamation (Barren Backfilling) for the mines under Group B(Table-6.1)
during the year 2021. The overall status of Technical Reclamation in Projects under
Group B is indicating positive trend.
6.10 It has been also observed that there has been overall an increase of 0.10 Km2 of area
under biological reclamation (Plantation on Backfilled areas) for the mines under Group
B during the year 2021. The overall status of Biological Reclamation in Projects under
Group B is indicating positive trend.
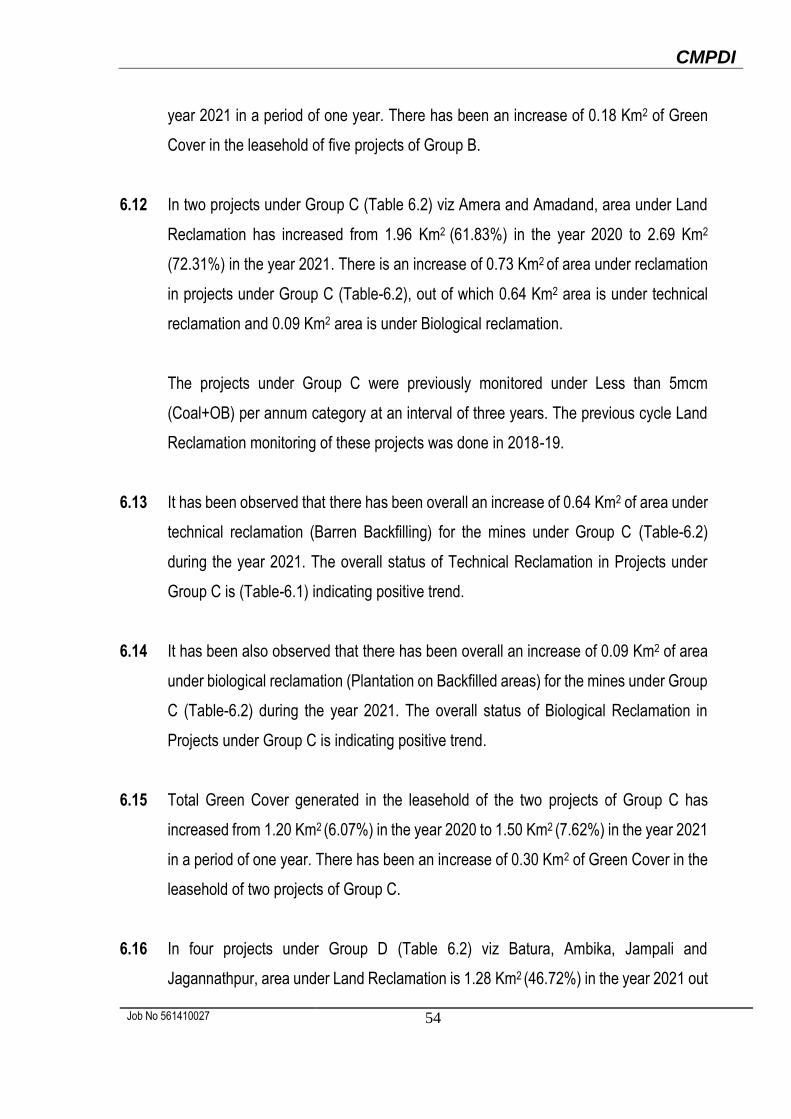
6.11 Total Green Cover generated in the leasehold of the five projects of Group B(Table-
6.1) has increased from 1.71 Km2 (5.92%) in the year 2020 to 1.89 Km2 (5.97%) in the
CMPDI
Job No 561410027 54
year 2021 in a period of one year. There has been an increase of 0.18 Km2 of Green
Cover in the leasehold of five projects of Group B.
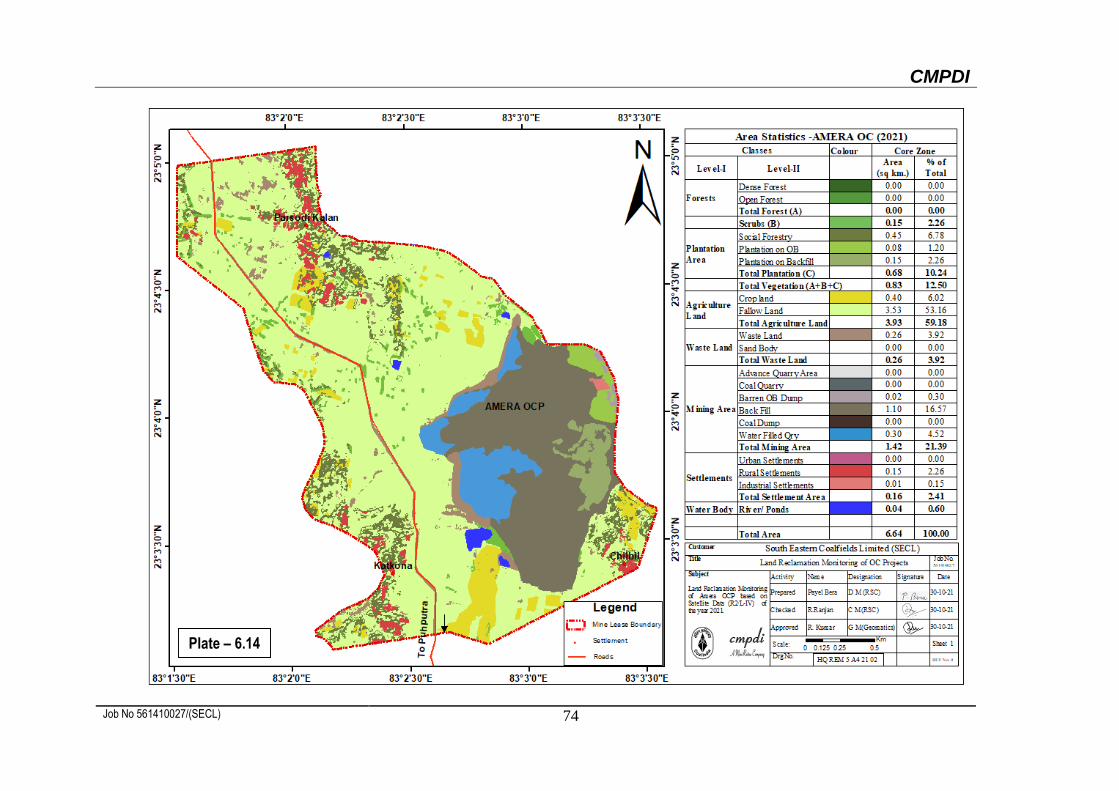
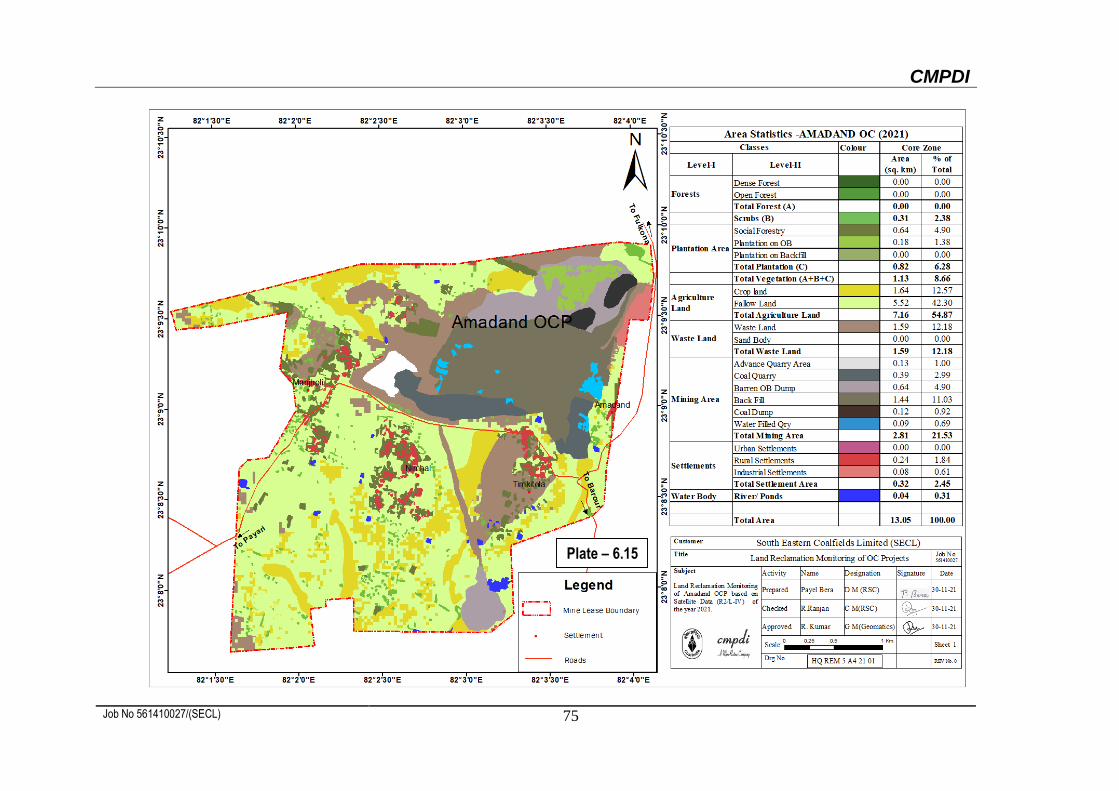
6.12 In two projects under Group C (Table 6.2) viz Amera and Amadand, area under Land
Reclamation has increased from 1.96 Km2 (61.83%) in the year 2020 to 2.69 Km2
(72.31%) in the year 2021. There is an increase of 0.73 Km2 of area under reclamation
in projects under Group C (Table-6.2), out of which 0.64 Km2 area is under technical
reclamation and 0.09 Km2 area is under Biological reclamation.
The projects under Group C were previously monitored under Less than 5mcm
(Coal+OB) per annum category at an interval of three years. The previous cycle Land
Reclamation monitoring of these projects was done in 2018-19.
6.13 It has been observed that there has been overall an increase of 0.64 Km2 of area under
technical reclamation (Barren Backfilling) for the mines under Group C (Table-6.2)
during the year 2021. The overall status of Technical Reclamation in Projects under
Group C is (Table-6.1) indicating positive trend.
6.14 It has been also observed that there has been overall an increase of 0.09 Km2 of area
under biological reclamation (Plantation on Backfilled areas) for the mines under Group
C (Table-6.2) during the year 2021. The overall status of Biological Reclamation in
Projects under Group C is indicating positive trend.
6.15 Total Green Cover generated in the leasehold of the two projects of Group C has
increased from 1.20 Km2 (6.07%) in the year 2020 to 1.50 Km2 (7.62%) in the year 2021
in a period of one year. There has been an increase of 0.30 Km2 of Green Cover in the
leasehold of two projects of Group C.
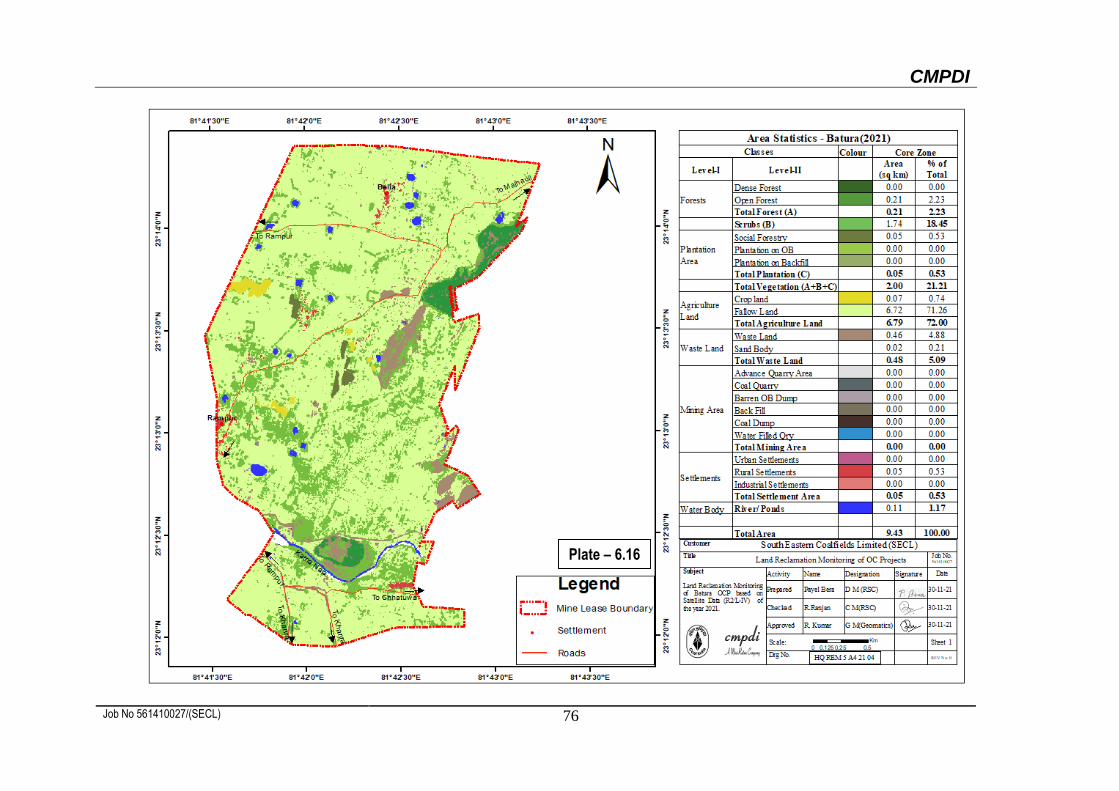
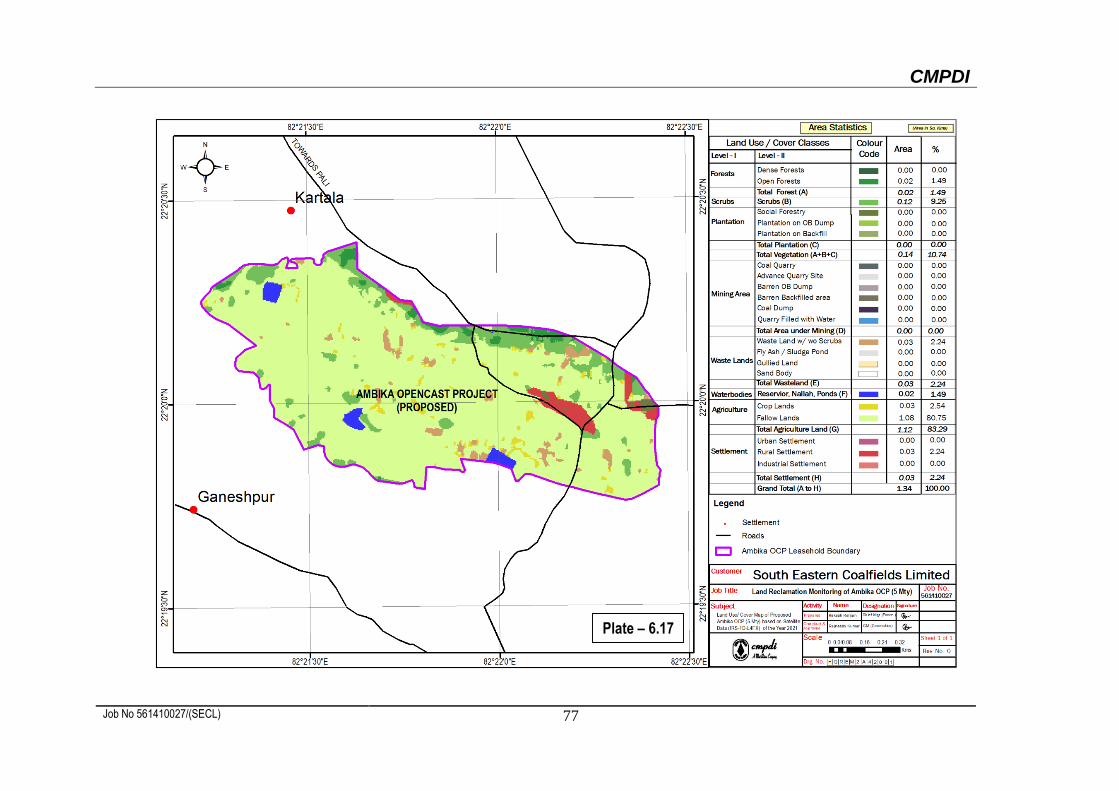
6.16 In four projects under Group D (Table 6.2) viz Batura, Ambika, Jampali and
Jagannathpur, area under Land Reclamation is 1.28 Km2 (46.72%) in the year 2021 out
CMPDI
Job No 561410027 55
of which 1.09 Km2 area is under technical reclamation and 0.19 Km2 area is under
Biological reclamation. Total Green Cover generated in the leasehold of the four
projects of Group D is 0.58 Km2 (2.50%) in the year 2021.
The projects under Group D are being monitored for Land Reclamation for the first time,
therefore, no comparative analysis has been done.
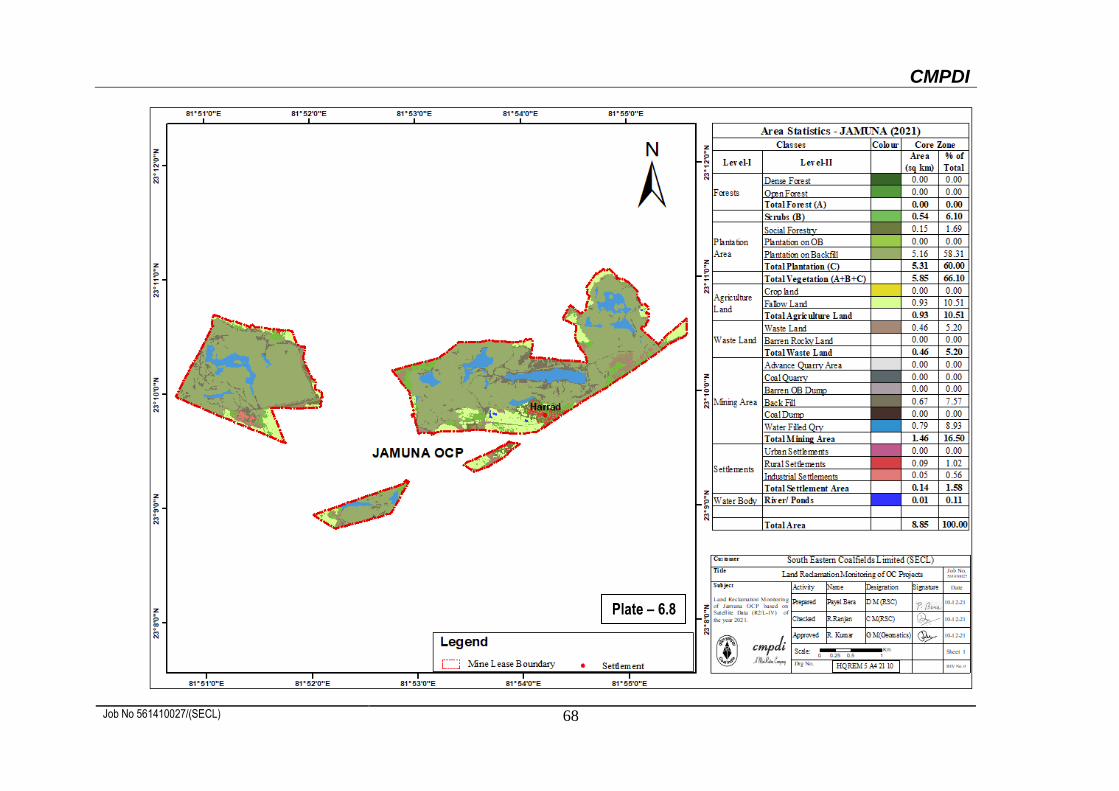
6.17 Out of 19 projects of SECL, Jamuna OCP ranks on top for land reclamation (88.07%)
followed by Rajnagar (85.66%) and Chirimiri (84.83%) in the year 2021-22.
CMPDI
Job No 561410027/(SECL) 56
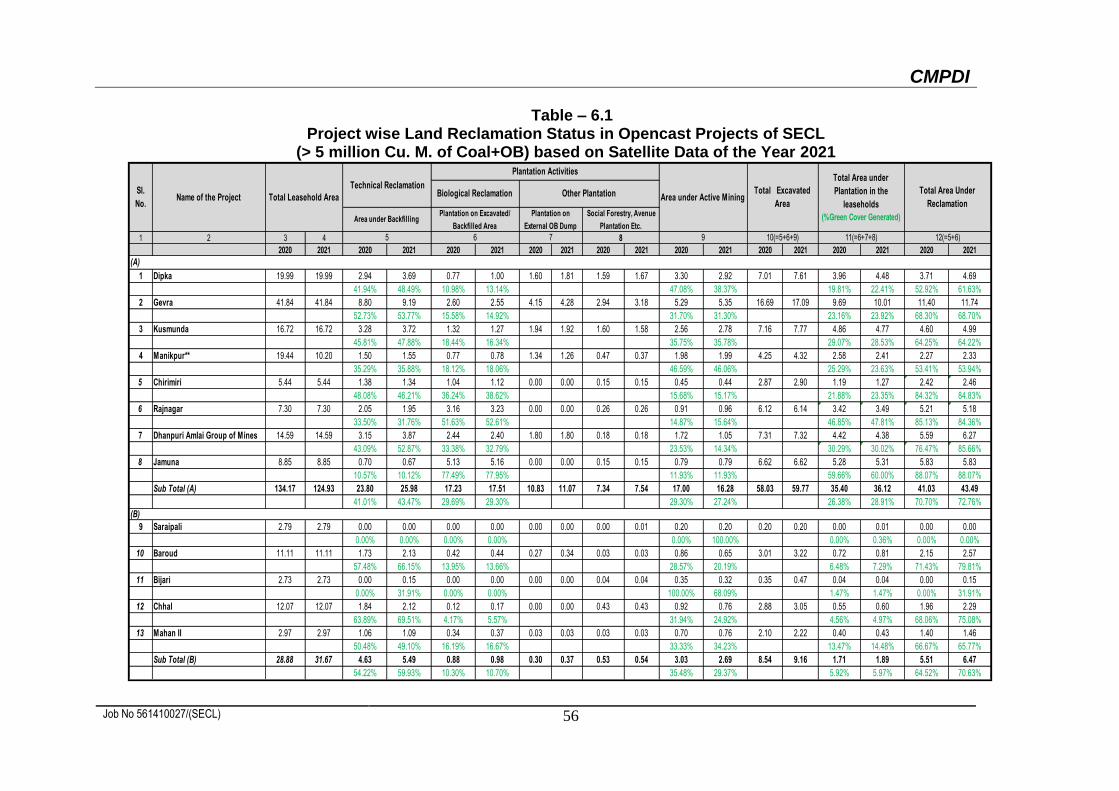
Table – 6.1 Project wise Land Reclamation Status in Opencast Projects of SECL
(> 5 million Cu. M. of Coal+OB) based on Satellite Data of the Year 2021
1 2 3 4
2020 2021 2020 2021 2020 2021 2020 2021 2020 2021 2020 2021 2020 2021 2020 2021 2020 2021
1 Dipka 19.99 19.99 2.94 3.69 0.77 1.00 1.60 1.81 1.59 1.67 3.30 2.92 7.01 7.61 3.96 4.48 3.71 4.69
41.94% 48.49% 10.98% 13.14% 47.08% 38.37% 19.81% 22.41% 52.92% 61.63%
2 Gevra 41.84 41.84 8.80 9.19 2.60 2.55 4.15 4.28 2.94 3.18 5.29 5.35 16.69 17.09 9.69 10.01 11.40 11.74
52.73% 53.77% 15.58% 14.92% 31.70% 31.30% 23.16% 23.92% 68.30% 68.70%
3 Kusmunda 16.72 16.72 3.28 3.72 1.32 1.27 1.94 1.92 1.60 1.58 2.56 2.78 7.16 7.77 4.86 4.77 4.60 4.99
45.81% 47.88% 18.44% 16.34% 35.75% 35.78% 29.07% 28.53% 64.25% 64.22%
4 Manikpur** 19.44 10.20 1.50 1.55 0.77 0.78 1.34 1.26 0.47 0.37 1.98 1.99 4.25 4.32 2.58 2.41 2.27 2.33
35.29% 35.88% 18.12% 18.06% 46.59% 46.06% 25.29% 23.63% 53.41% 53.94%
5 Chirimiri 5.44 5.44 1.38 1.34 1.04 1.12 0.00 0.00 0.15 0.15 0.45 0.44 2.87 2.90 1.19 1.27 2.42 2.46
48.08% 46.21% 36.24% 38.62% 15.68% 15.17% 21.88% 23.35% 84.32% 84.83%
6 Rajnagar 7.30 7.30 2.05 1.95 3.16 3.23 0.00 0.00 0.26 0.26 0.91 0.96 6.12 6.14 3.42 3.49 5.21 5.18
33.50% 31.76% 51.63% 52.61% 14.87% 15.64% 46.85% 47.81% 85.13% 84.36%
7 Dhanpuri Amlai Group of Mines 14.59 14.59 3.15 3.87 2.44 2.40 1.80 1.80 0.18 0.18 1.72 1.05 7.31 7.32 4.42 4.38 5.59 6.27
43.09% 52.87% 33.38% 32.79% 23.53% 14.34% 30.29% 30.02% 76.47% 85.66%
8 Jamuna 8.85 8.85 0.70 0.67 5.13 5.16 0.00 0.00 0.15 0.15 0.79 0.79 6.62 6.62 5.28 5.31 5.83 5.83
10.57% 10.12% 77.49% 77.95% 11.93% 11.93% 59.66% 60.00% 88.07% 88.07%
Sub Total (A) 134.17 124.93 23.80 25.98 17.23 17.51 10.83 11.07 7.34 7.54 17.00 16.28 58.03 59.77 35.40 36.12 41.03 43.49
41.01% 43.47% 29.69% 29.30% 29.30% 27.24% 26.38% 28.91% 70.70% 72.76%
9 Saraipali 2.79 2.79 0.00 0.00 0.00 0.00 0.00 0.00 0.00 0.01 0.20 0.20 0.20 0.20 0.00 0.01 0.00 0.00
0.00% 0.00% 0.00% 0.00% 0.00% 100.00% 0.00% 0.36% 0.00% 0.00%
10 Baroud 11.11 11.11 1.73 2.13 0.42 0.44 0.27 0.34 0.03 0.03 0.86 0.65 3.01 3.22 0.72 0.81 2.15 2.57
57.48% 66.15% 13.95% 13.66% 28.57% 20.19% 6.48% 7.29% 71.43% 79.81%
11 Bijari 2.73 2.73 0.00 0.15 0.00 0.00 0.00 0.00 0.04 0.04 0.35 0.32 0.35 0.47 0.04 0.04 0.00 0.15
0.00% 31.91% 0.00% 0.00% 100.00% 68.09% 1.47% 1.47% 0.00% 31.91%
12 Chhal 12.07 12.07 1.84 2.12 0.12 0.17 0.00 0.00 0.43 0.43 0.92 0.76 2.88 3.05 0.55 0.60 1.96 2.29
63.89% 69.51% 4.17% 5.57% 31.94% 24.92% 4.56% 4.97% 68.06% 75.08%
13 Mahan II 2.97 2.97 1.06 1.09 0.34 0.37 0.03 0.03 0.03 0.03 0.70 0.76 2.10 2.22 0.40 0.43 1.40 1.46
50.48% 49.10% 16.19% 16.67% 33.33% 34.23% 13.47% 14.48% 66.67% 65.77%
Sub Total (B) 28.88 31.67 4.63 5.49 0.88 0.98 0.30 0.37 0.53 0.54 3.03 2.69 8.54 9.16 1.71 1.89 5.51 6.47
54.22% 59.93% 10.30% 10.70% 35.48% 29.37% 5.92% 5.97% 64.52% 70.63%
(A)
Sl.
No.Name of the Project
Technical Reclamation
Plantation Activities
Area under Active MiningTotal Excavated
Area
Total Area under
Plantation in the
leaseholds
(%Green Cover Generated)
Total Area Under
ReclamationBiological Reclamation Other Plantation
Area under Backfilling
(B)
5
Total Leasehold Area
9
Plantation on Excavated/
Backfilled Area
Plantation on
External OB Dump
Social Forestry, Avenue
Plantation Etc.
6 7 8 10(=5+6+9) 11(=6+7+8) 12(=5+6)
CMPDI
Job No 561410027/(SECL) 57
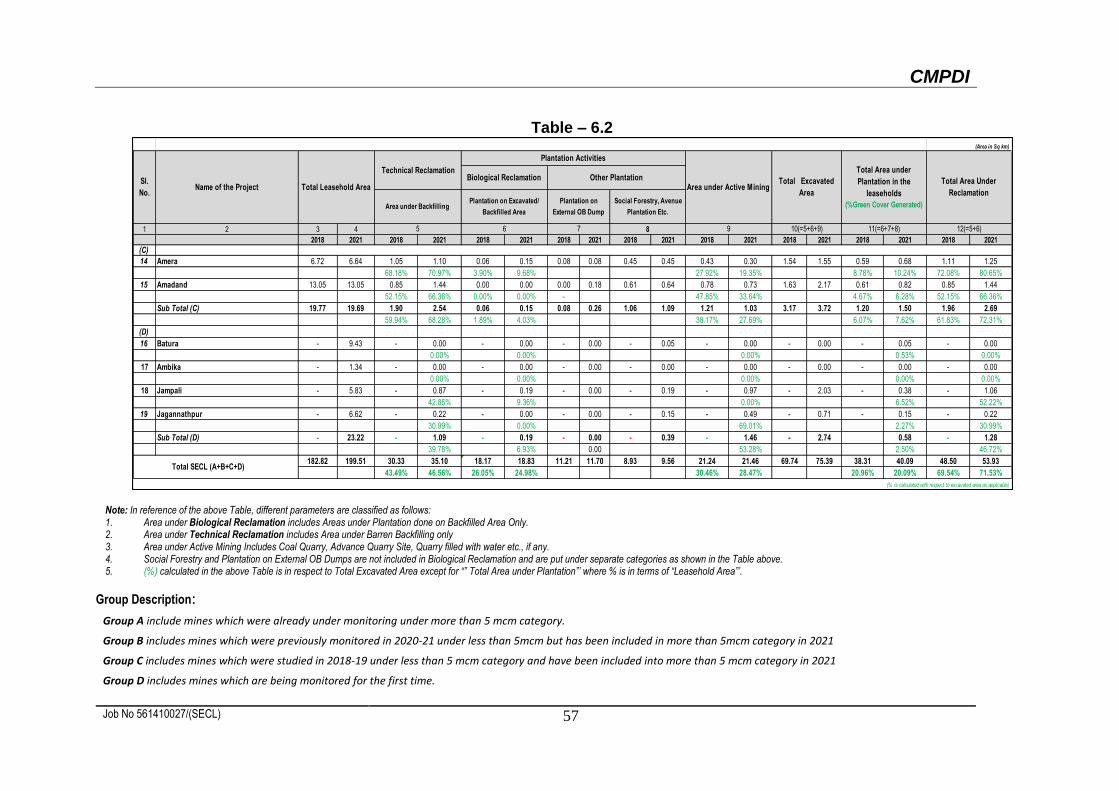
Table – 6.2
Note: In reference of the above Table, different parameters are classified as follows: 1. Area under Biological Reclamation includes Areas under Plantation done on Backfilled Area Only. 2. Area under Technical Reclamation includes Area under Barren Backfilling only 3. Area under Active Mining Includes Coal Quarry, Advance Quarry Site, Quarry filled with water etc., if any. 4. Social Forestry and Plantation on External OB Dumps are not included in Biological Reclamation and are put under separate categories as shown in the Table above. 5. (%) calculated in the above Table is in respect to Total Excavated Area except for “” Total Area under Plantation”’ where % is in terms of “Leasehold Area”’.
Group Description:
Group A include mines which were already under monitoring under more than 5 mcm category.
Group B includes mines which were previously monitored in 2020-21 under less than 5mcm but has been included in more than 5mcm category in 2021
Group C includes mines which were studied in 2018-19 under less than 5 mcm category and have been included into more than 5 mcm category in 2021
Group D includes mines which are being monitored for the first time.
1 2 3 4
2018 2021 2018 2021 2018 2021 2018 2021 2018 2021 2018 2021 2018 2021 2018 2021 2018 2021
(C)
14 Amera 6.72 6.64 1.05 1.10 0.06 0.15 0.08 0.08 0.45 0.45 0.43 0.30 1.54 1.55 0.59 0.68 1.11 1.25
68.18% 70.97% 3.90% 9.68% 27.92% 19.35% 8.78% 10.24% 72.08% 80.65%
15 Amadand 13.05 13.05 0.85 1.44 0.00 0.00 0.00 0.18 0.61 0.64 0.78 0.73 1.63 2.17 0.61 0.82 0.85 1.44
52.15% 66.36% 0.00% 0.00% - 47.85% 33.64% 4.67% 6.28% 52.15% 66.36%
Sub Total (C) 19.77 19.69 1.90 2.54 0.06 0.15 0.08 0.26 1.06 1.09 1.21 1.03 3.17 3.72 1.20 1.50 1.96 2.69
59.94% 68.28% 1.89% 4.03% 38.17% 27.69% 6.07% 7.62% 61.83% 72.31%
(D)
16 Batura - 9.43 - 0.00 - 0.00 - 0.00 - 0.05 - 0.00 - 0.00 - 0.05 - 0.00
0.00% 0.00% 0.00% 0.53% 0.00%
17 Ambika - 1.34 - 0.00 - 0.00 - 0.00 - 0.00 - 0.00 - 0.00 - 0.00 - 0.00
0.00% 0.00% 0.00% 0.00% 0.00%
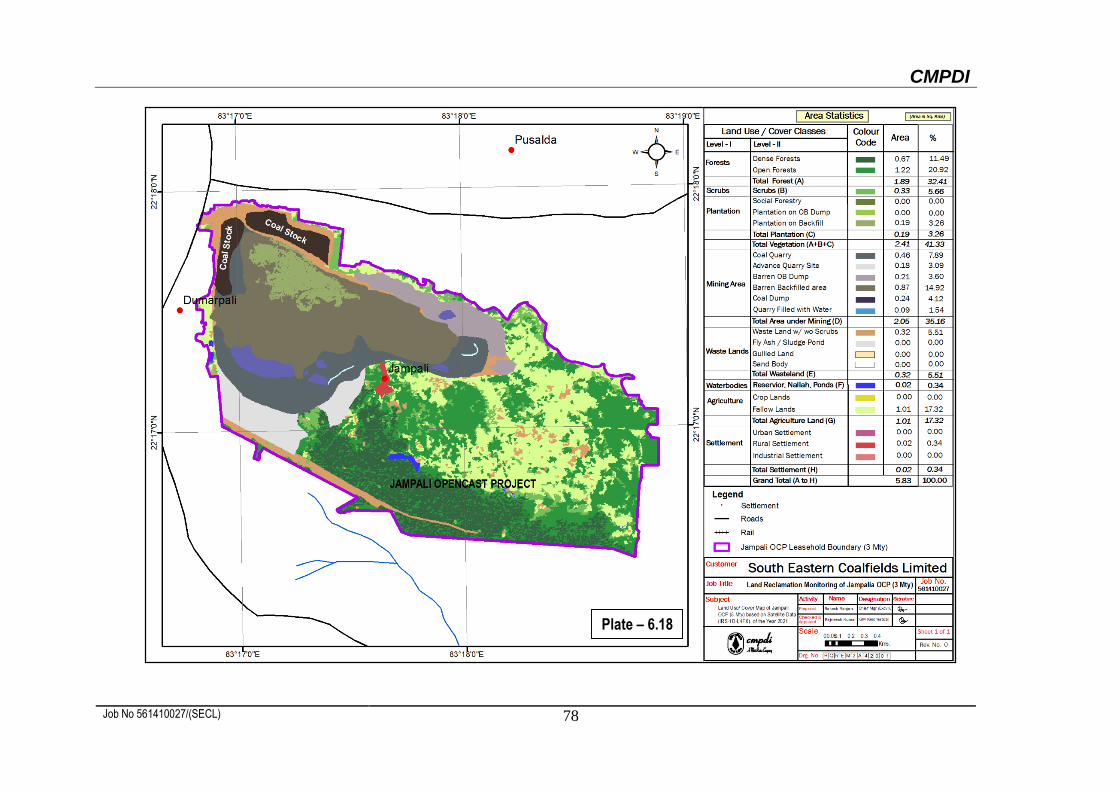
18 Jampali - 5.83 - 0.87 - 0.19 - 0.00 - 0.19 - 0.97 - 2.03 - 0.38 - 1.06
42.86% 9.36% 0.00% 6.52% 52.22%
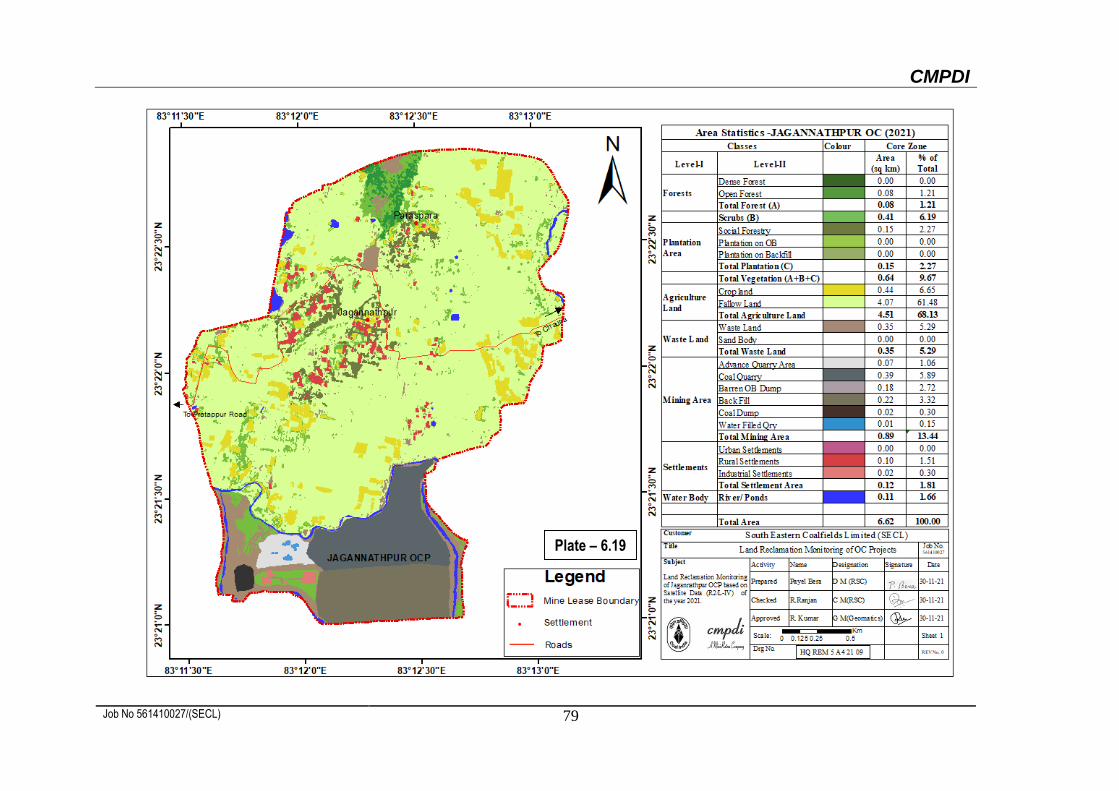
19 Jagannathpur - 6.62 - 0.22 - 0.00 - 0.00 - 0.15 - 0.49 - 0.71 - 0.15 - 0.22
30.99% 0.00% 69.01% 2.27% 30.99%
Sub Total (D) - 23.22 - 1.09 - 0.19 - 0.00 - 0.39 - 1.46 - 2.74 0.58 - 1.28
39.78% 6.93% 0.00 53.28% 2.50% 46.72%
182.82 199.51 30.33 35.10 18.17 18.83 11.21 11.70 8.93 9.56 21.24 21.46 69.74 75.39 38.31 40.09 48.50 53.93
43.49% 46.56% 26.05% 24.98% 30.46% 28.47% 20.96% 20.09% 69.54% 71.53%
(% is calculated with respect to excavated area as applicable)
(Area in Sq km)
Sl.
No.Name of the Project
Technical Reclamation
Plantation Activities
Area under Active MiningTotal Excavated
Area
Total Area under
Plantation in the
leaseholds
(%Green Cover Generated)
Total Area Under
Reclamation
Biological Reclamation Other Plantation
Area under Backfilling
Total SECL (A+B+C+D)
5
Total Leasehold Area
9
Plantation on Excavated/
Backfilled Area
Plantation on
External OB Dump
Social Forestry, Avenue
Plantation Etc.
6 7 8 10(=5+6+9) 11(=6+7+8) 12(=5+6)
CMPDI
Job No 561410027/(SECL) 58
Fig.6.1: Project wise Land reclamation status in OC projects of SECL in the year-2021
CMPDI
Job No 561410027/(SECL) 59
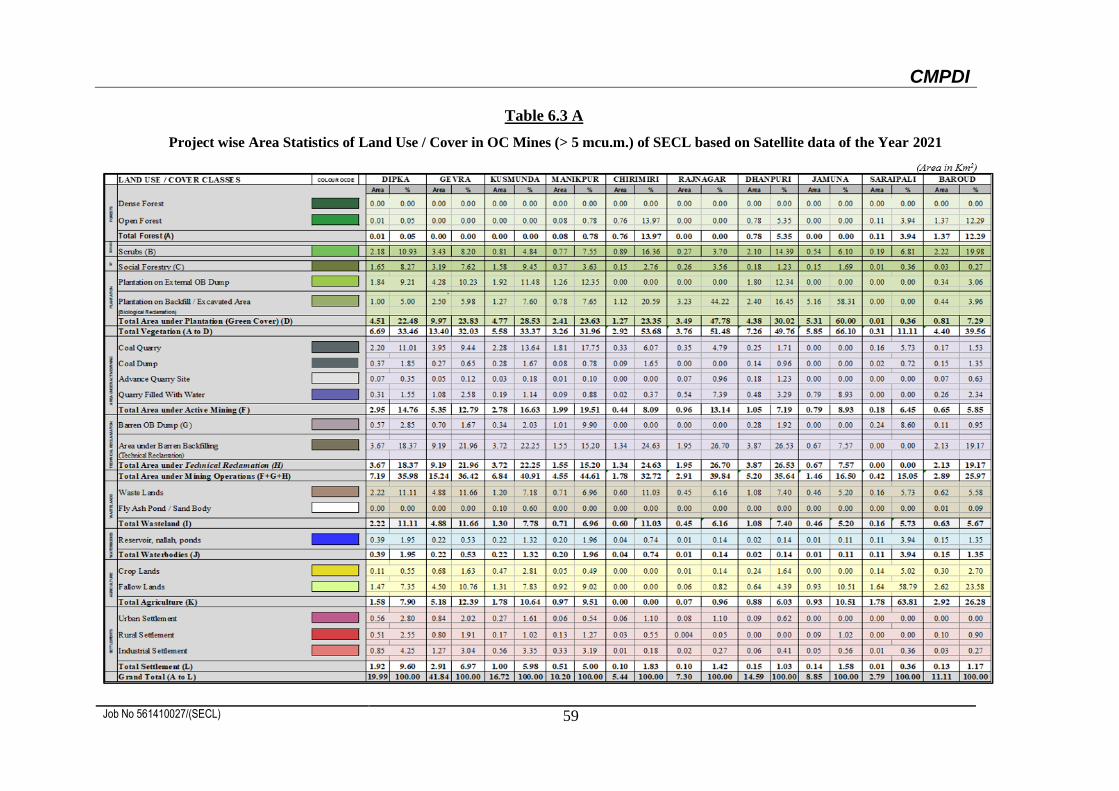
Table 6.3 A
Project wise Area Statistics of Land Use / Cover in OC Mines (> 5 mcu.m.) of SECL based on Satellite data of the Year 2021
CMPDI
Job No 561410027/(SECL) 60
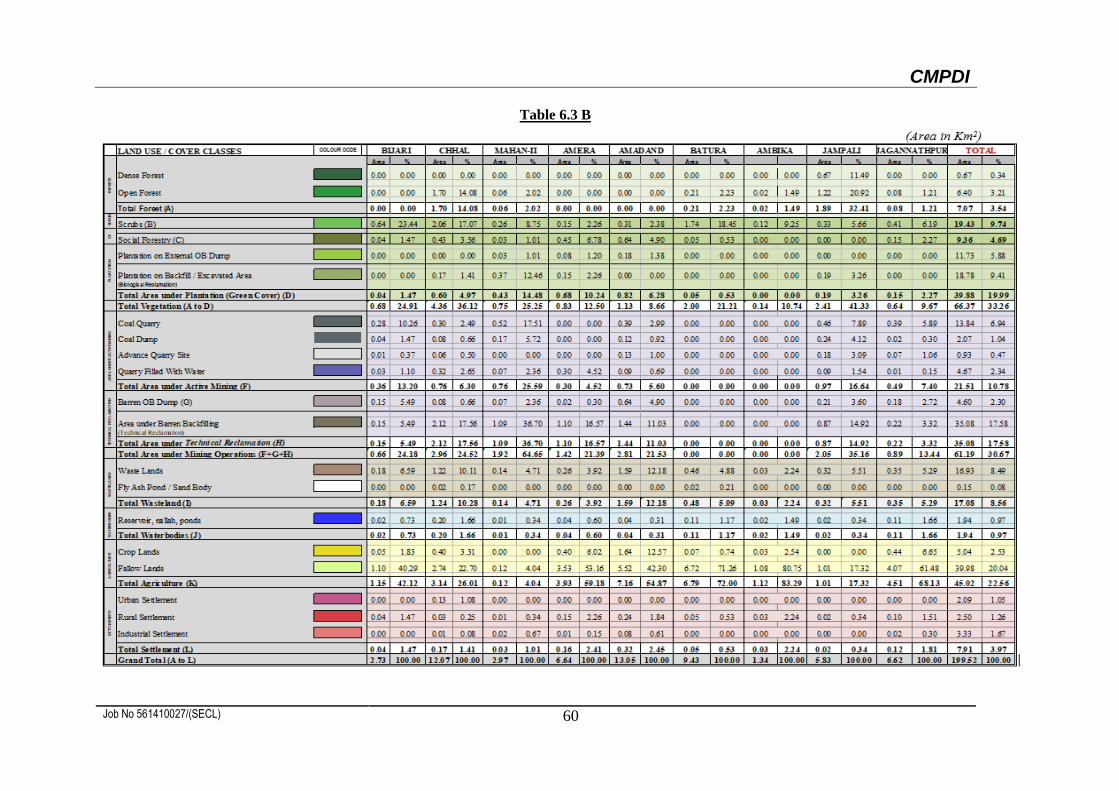
Table 6.3 B
CMPDI
Job No 561410027/(SECL) 61
Plate – 6.1
CMPDI
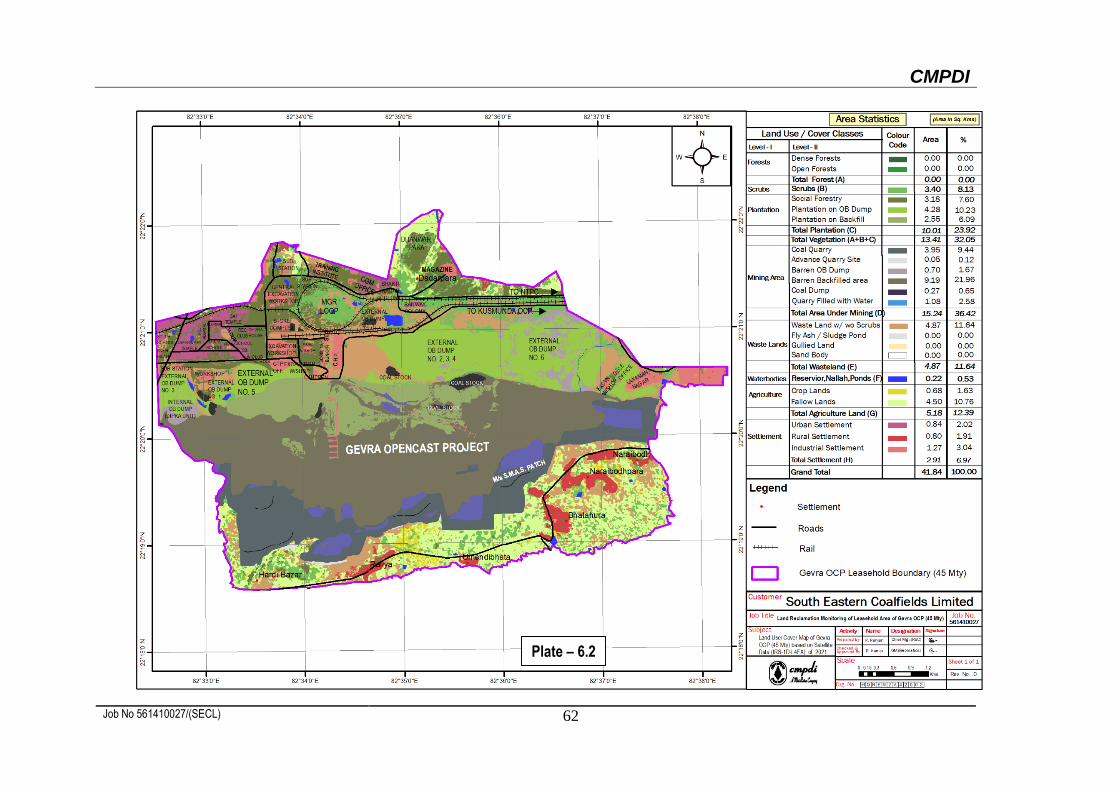
Job No 561410027/(SECL) 62
Plate – 6.2
CMPDI
Job No 561410027/(SECL) 63
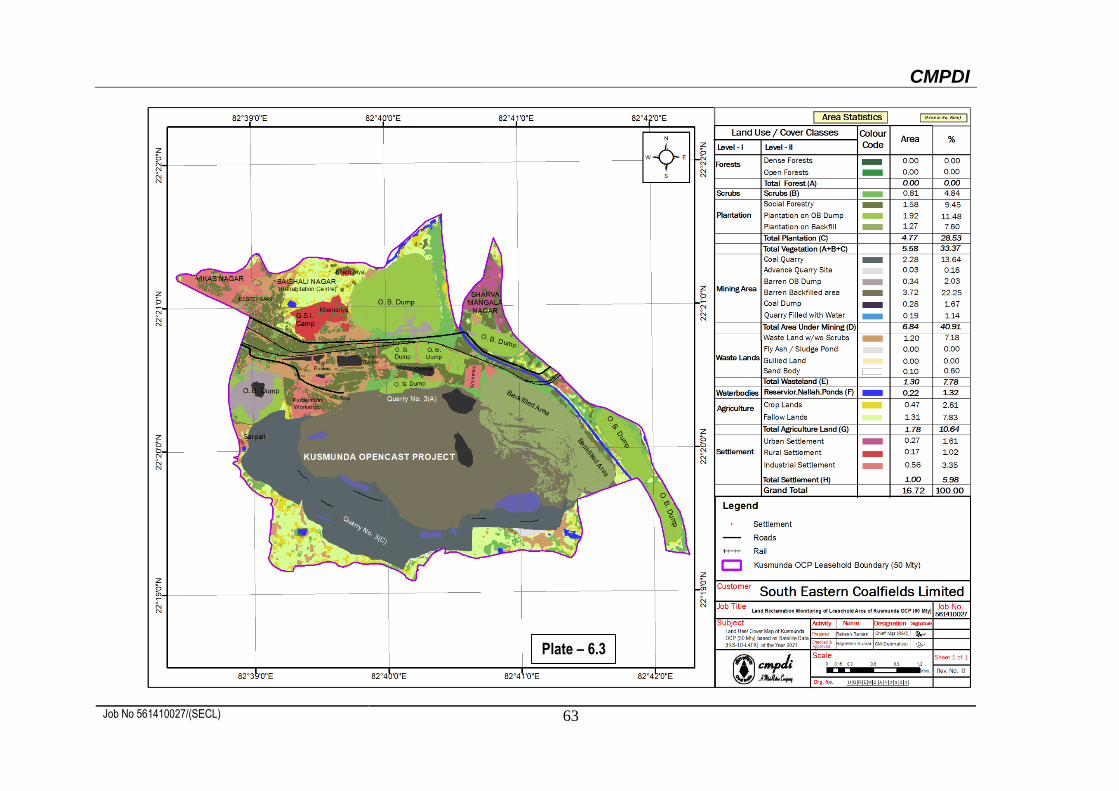
Plate – 6.3
CMPDI
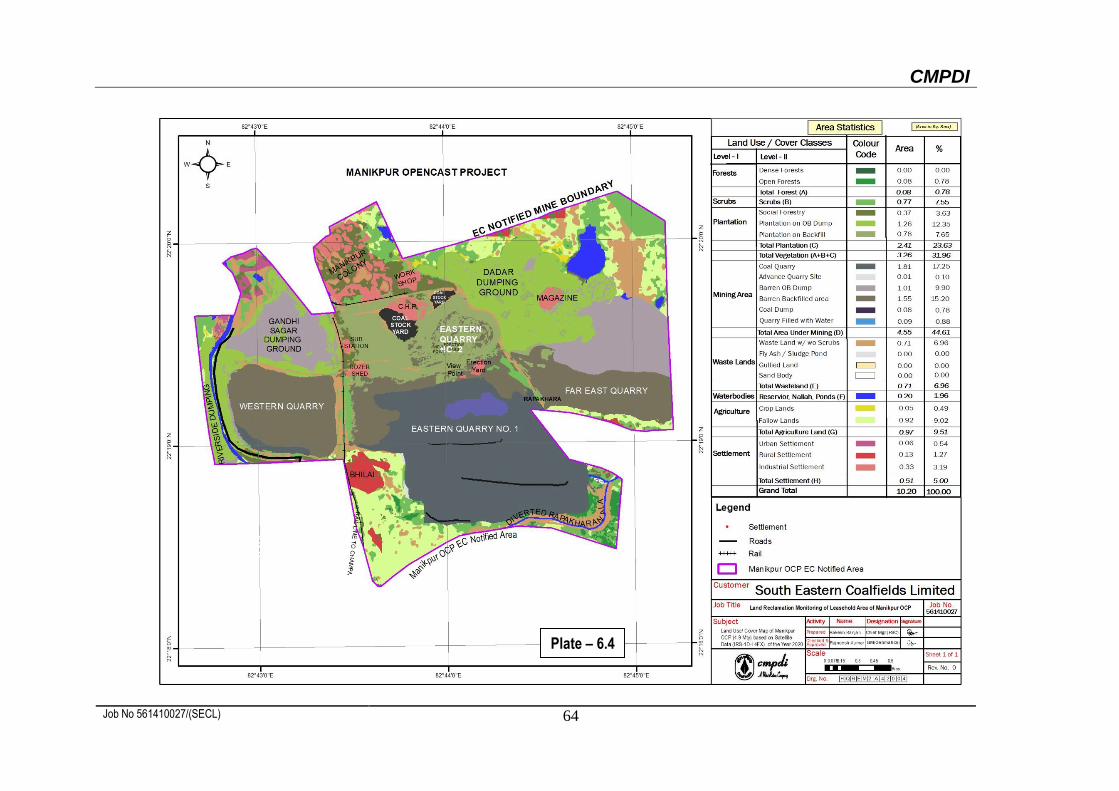
Job No 561410027/(SECL) 64
Plate – 6.4
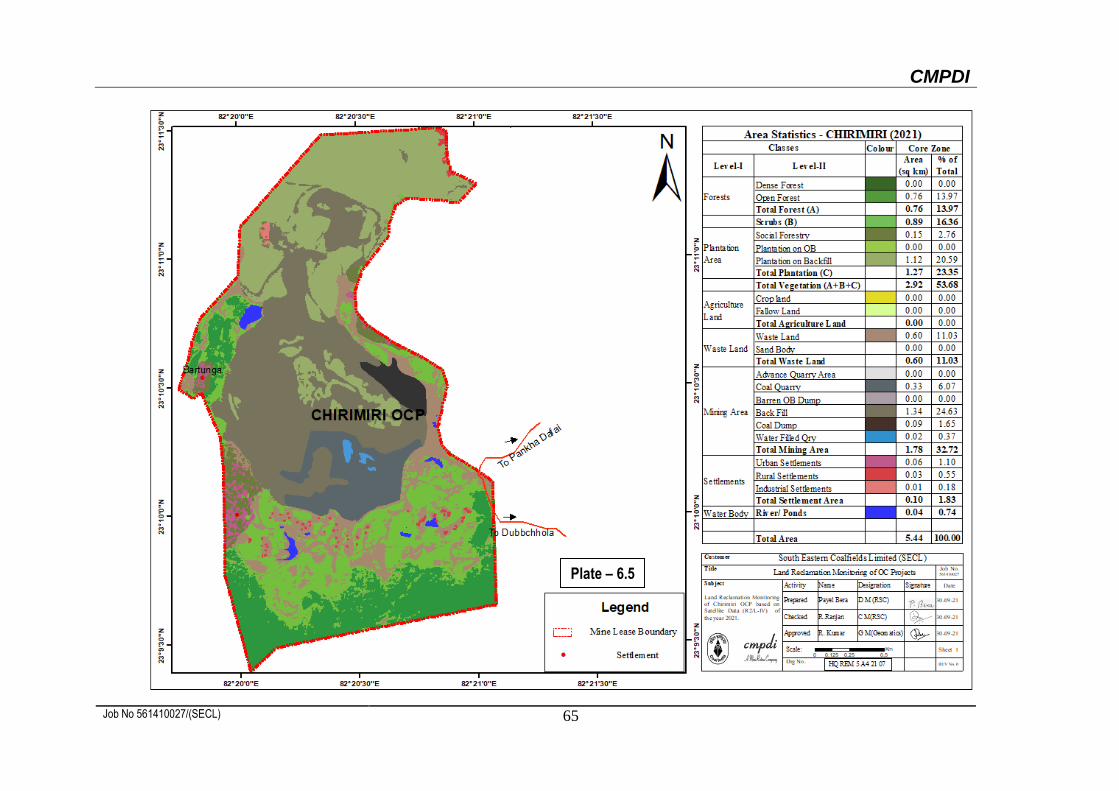
CMPDI
Job No 561410027/(SECL) 65
Plate – 6.5
CMPDI
Job No 561410027/(SECL) 66
Plate – 6.6
CMPDI
Job No 561410027/(SECL) 67
Plate – 6.7
CMPDI
Job No 561410027/(SECL) 68
Plate – 6.8
CMPDI
Job No 561410027/(SECL) 69
Plate – 6.9
CMPDI
Job No 561410027/(SECL) 70
Plate – 6.10
CMPDI
Job No 561410027/(SECL) 71
Plate – 6.11
CMPDI
Job No 561410027/(SECL) 72
Plate – 6.12
CMPDI
Job No 561410027/(SECL) 73
Plate – 6.13
CMPDI
Job No 561410027/(SECL) 74
Plate – 6.14
CMPDI
Job No 561410027/(SECL) 75
Plate – 6.15
CMPDI
Job No 561410027/(SECL) 76
Plate – 6.16
CMPDI
Job No 561410027/(SECL) 77
Plate – 6.17
CMPDI
Job No 561410027/(SECL) 78
Plate – 6.18
CMPDI
Job No 561410027/(SECL) 79
Plate – 6.19
CMPDI
Job No 561410027 80
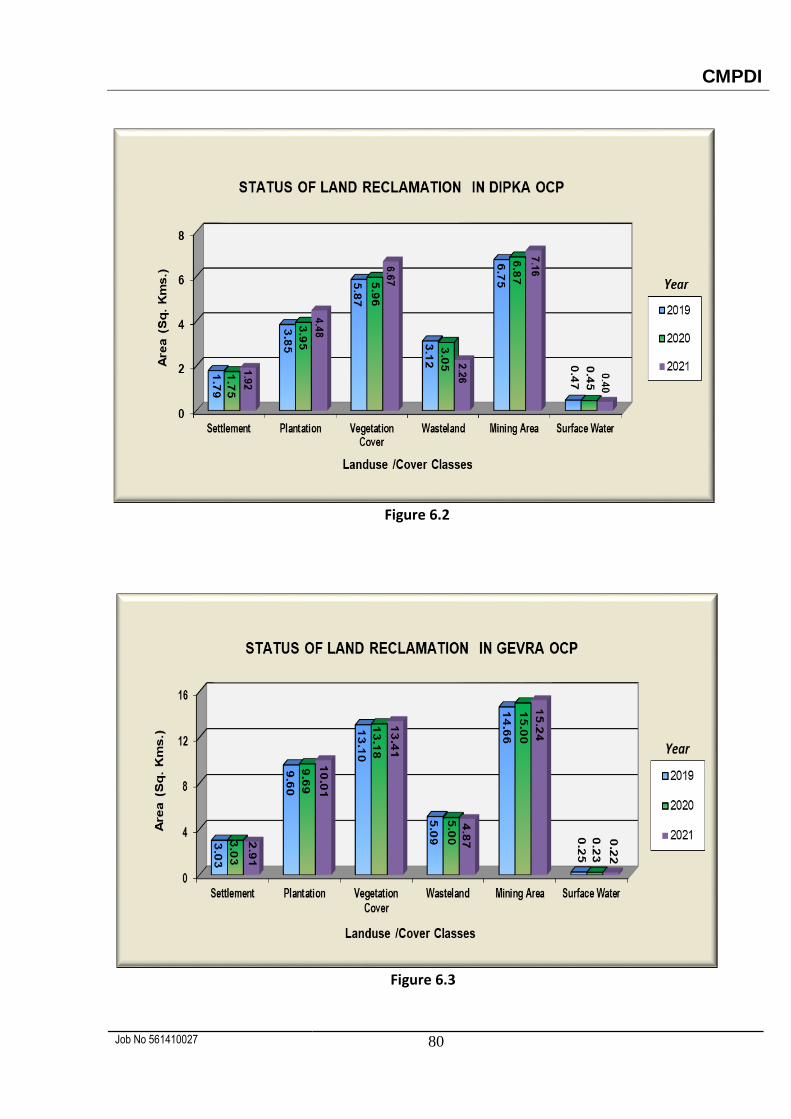
Figure 6.2
Figure 6.3
CMPDI
Job No 561410027 81
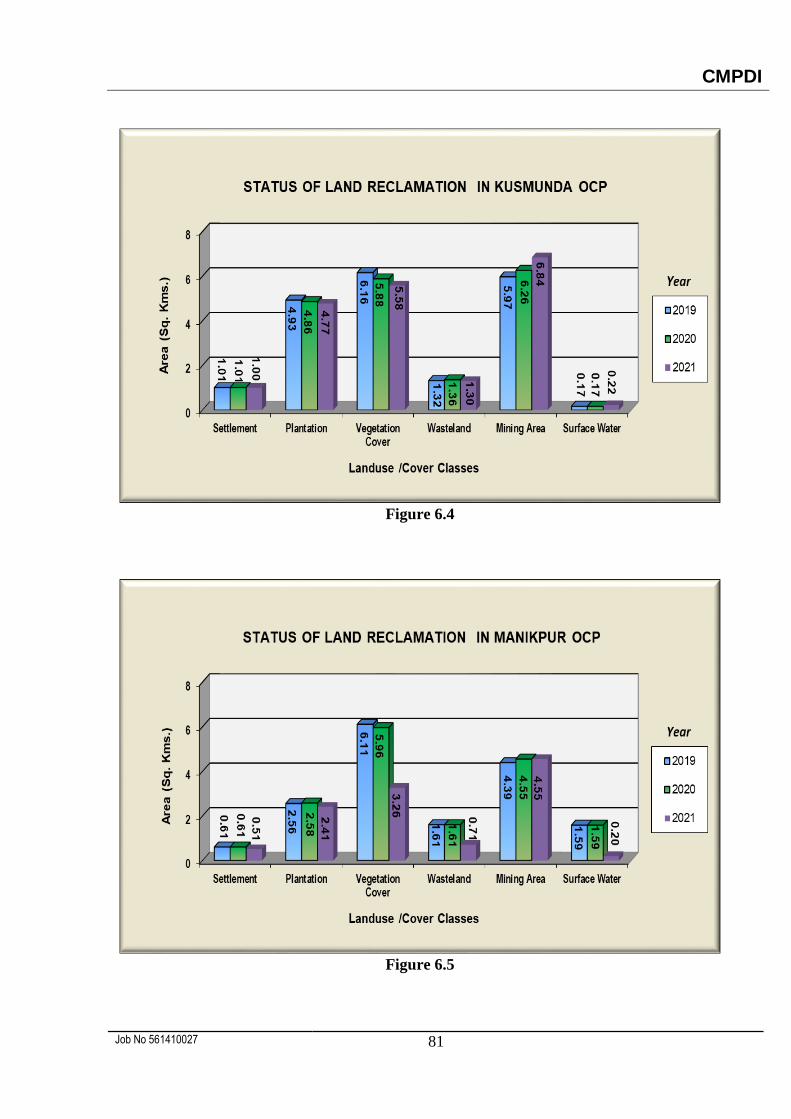
Figure 6.4
Figure 6.5
CMPDI
Job No 561410027 82
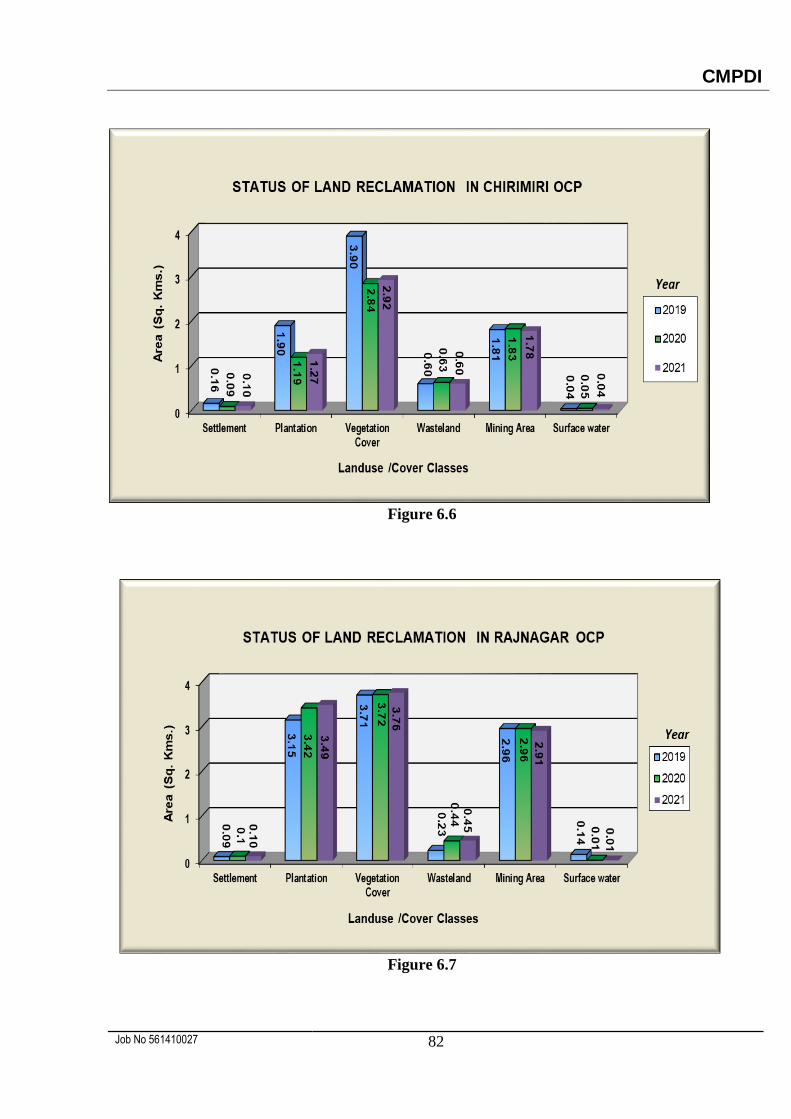
Figure 6.6
Figure 6.7
CMPDI
Job No 561410027 83
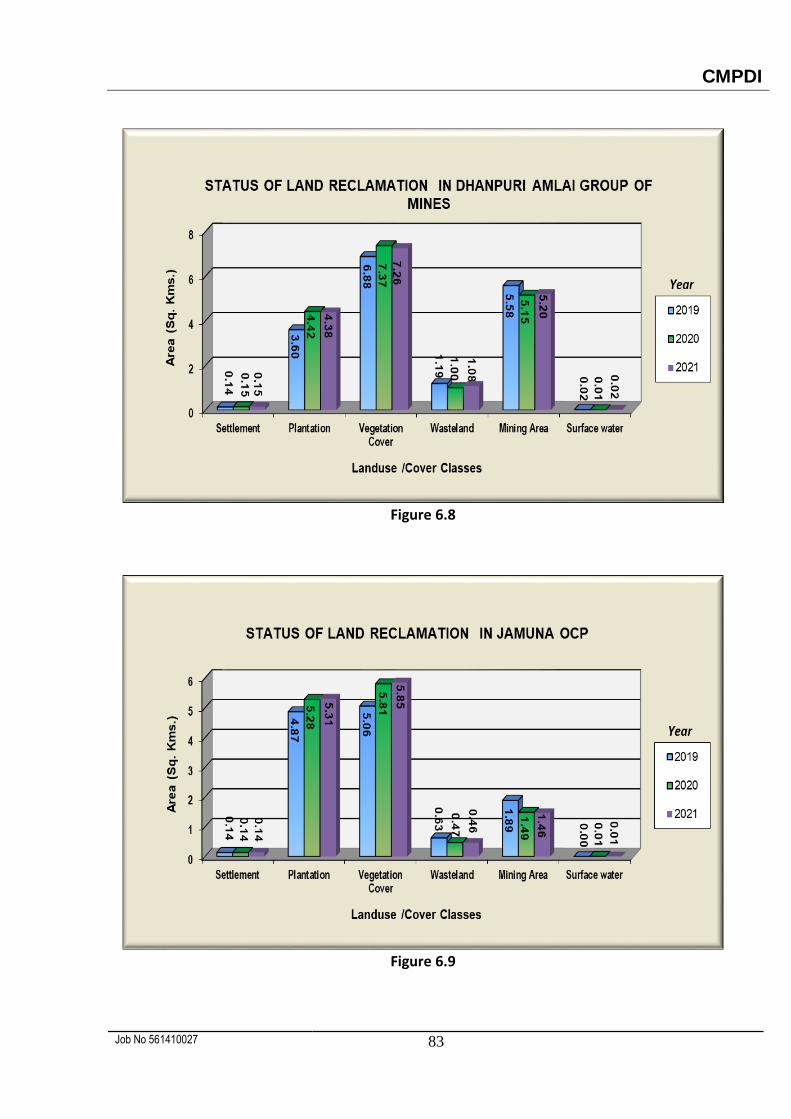
Figure 6.8
Figure 6.9
CMPDI
Job No 561410027 84
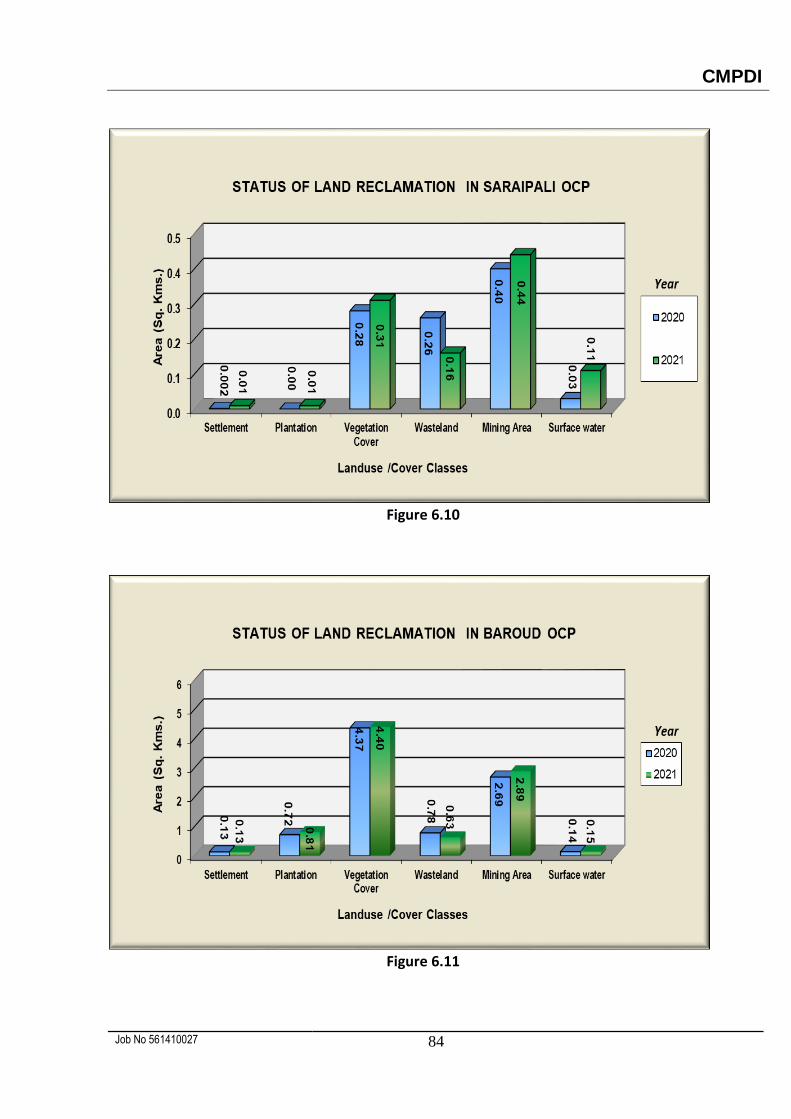
Figure 6.10
Figure 6.11
CMPDI
Job No 561410027 85
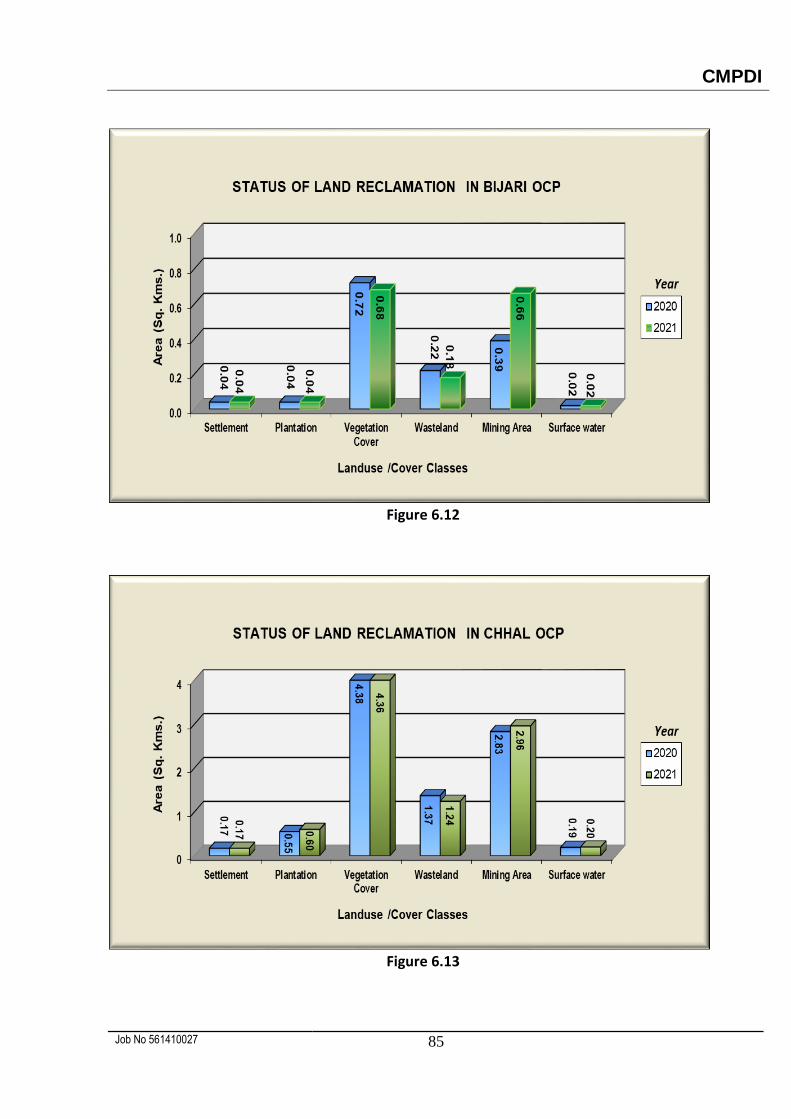
Figure 6.12
Figure 6.13
CMPDI
Job No 561410027 86
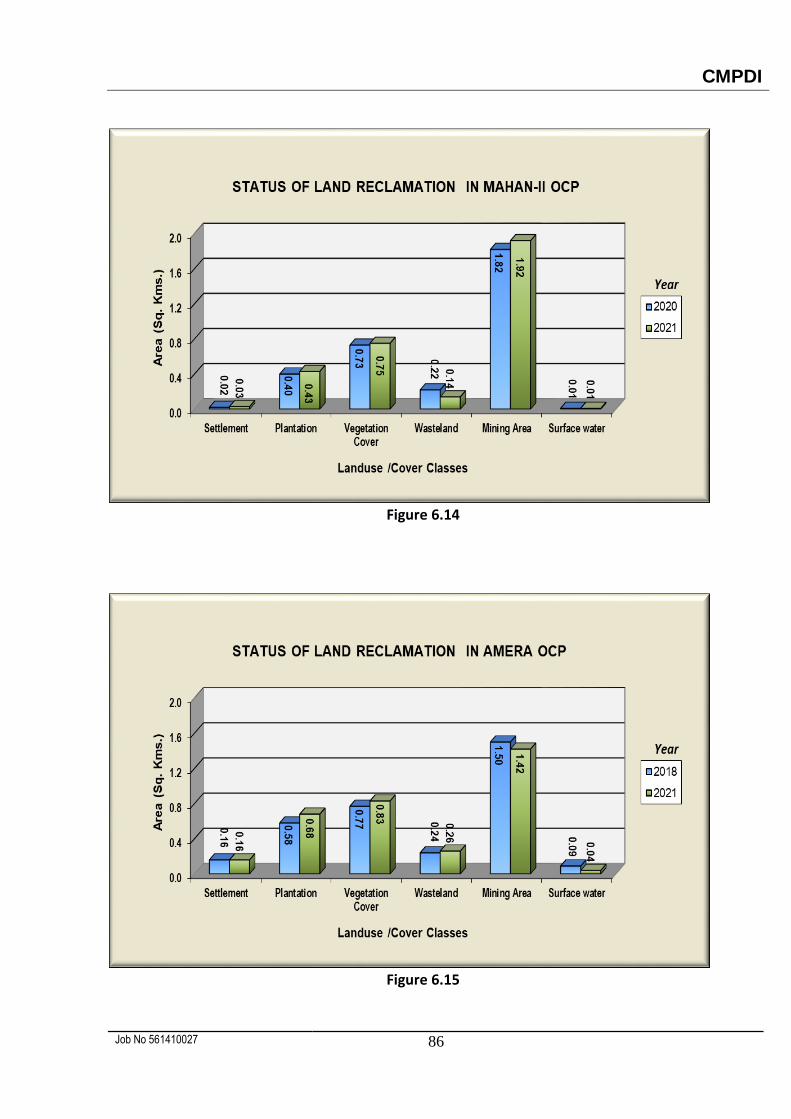
Figure 6.14
Figure 6.15
CMPDI
Job No 561410027 87
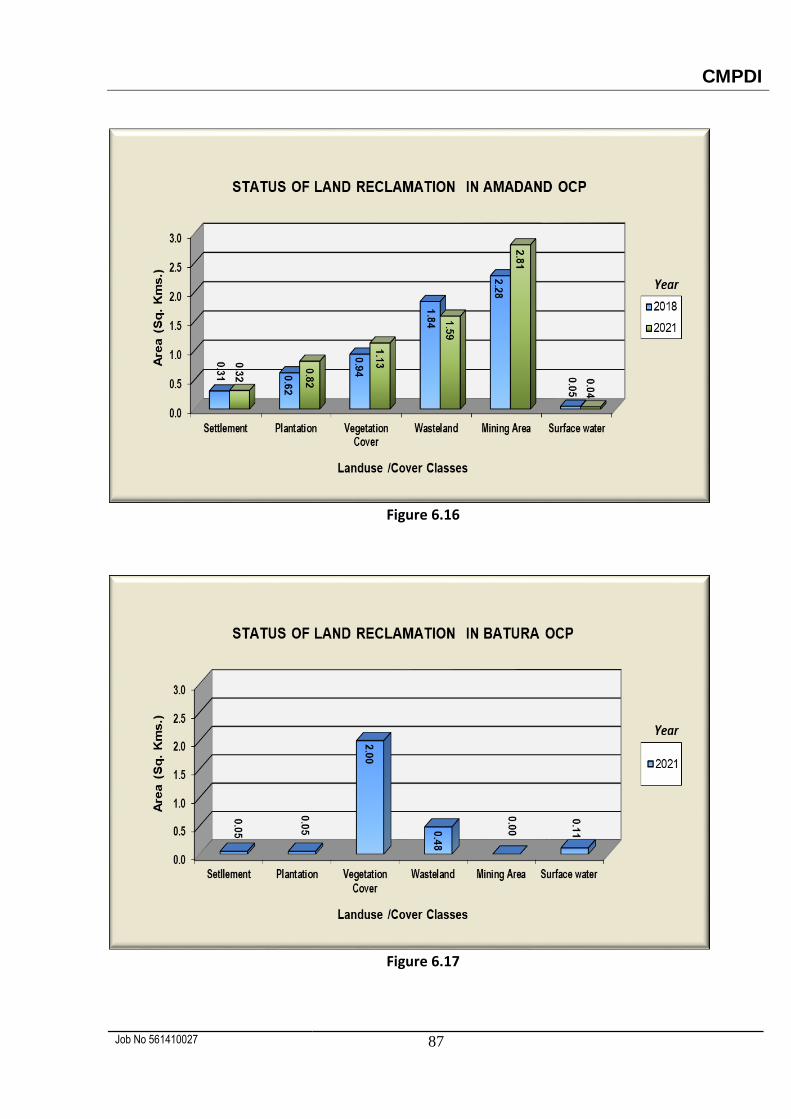
Figure 6.16
Figure 6.17
CMPDI
Job No 561410027 88
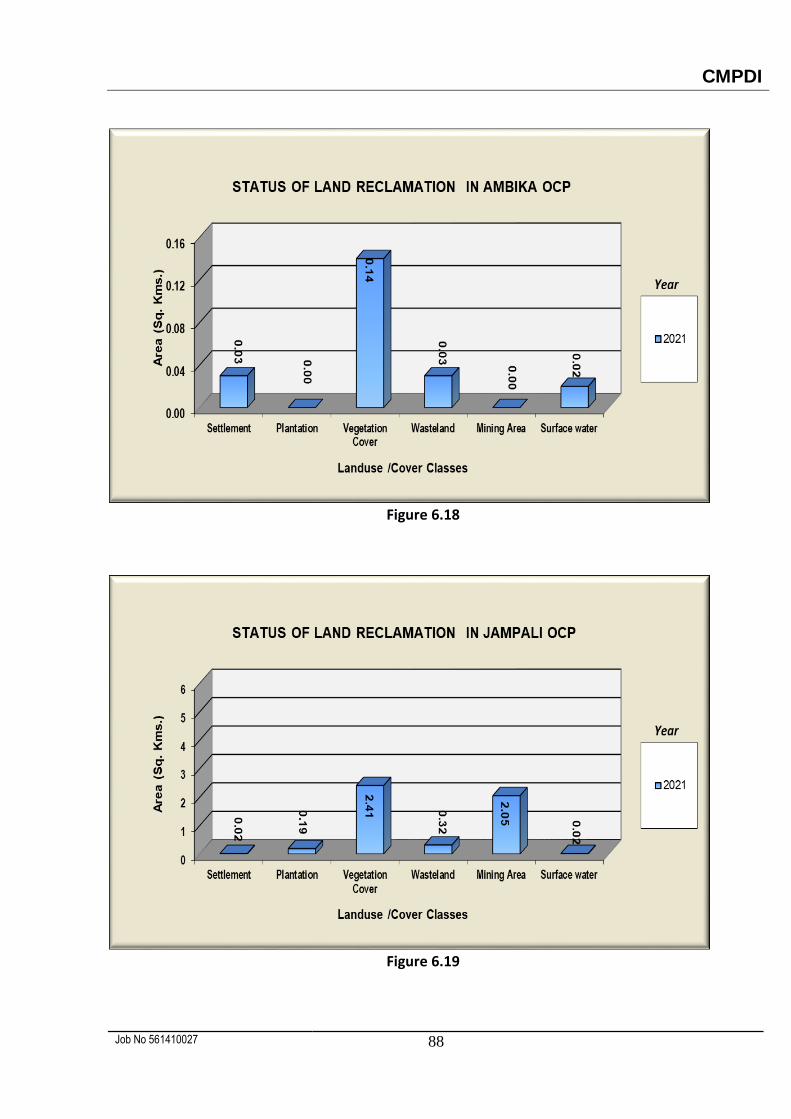
Figure 6.18
Figure 6.19
CMPDI
Job No 561410027 89
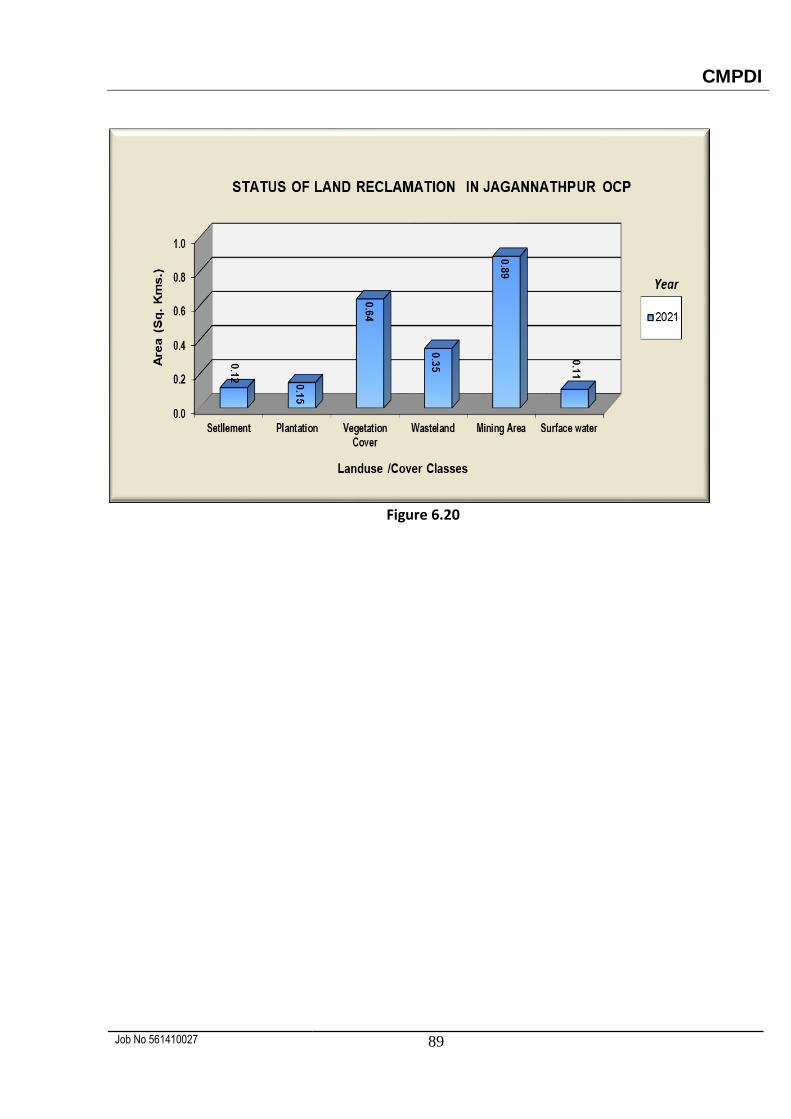
Figure 6.20
CMPDI
Job No 561410027 90
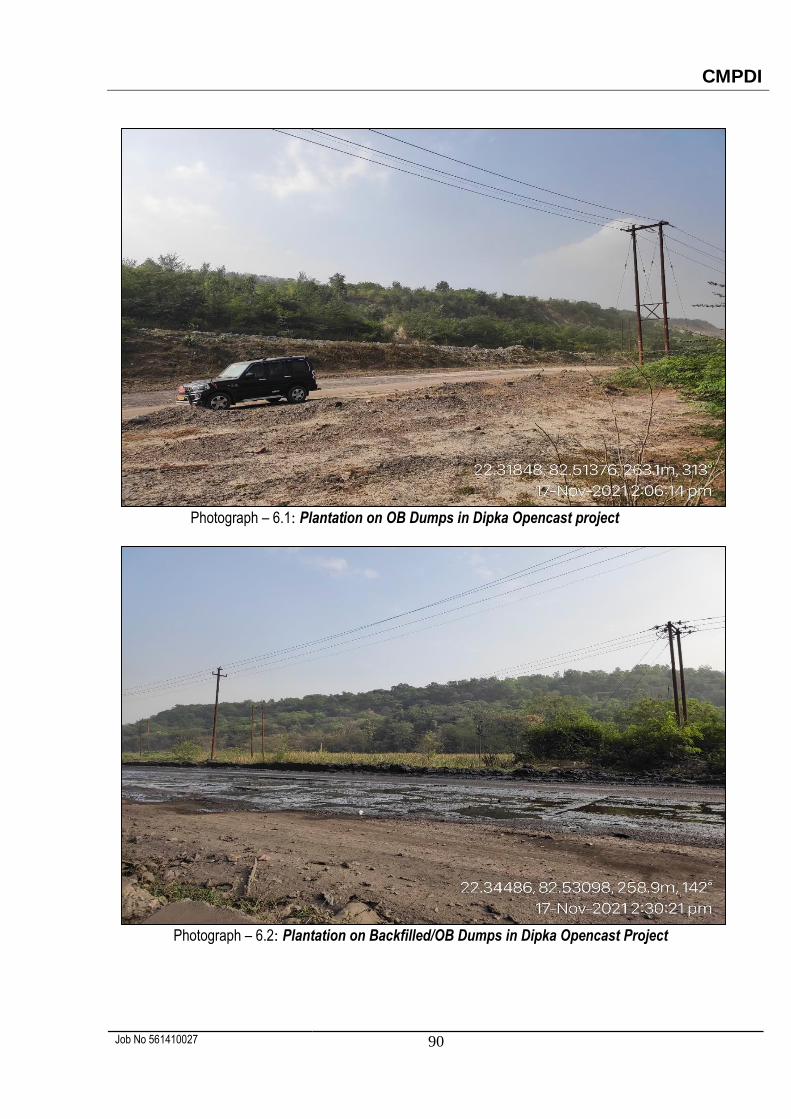
Photograph – 6.1: Plantation on OB Dumps in Dipka Opencast project
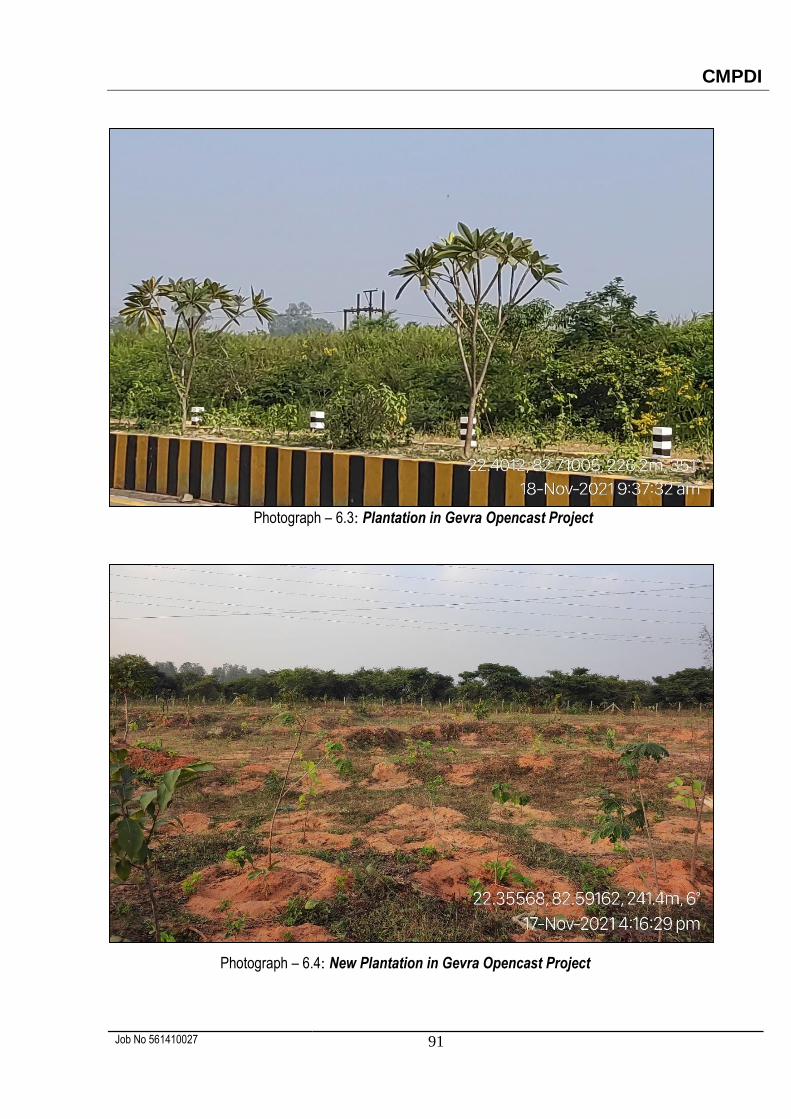
Photograph – 6.2: Plantation on Backfilled/OB Dumps in Dipka Opencast Project
CMPDI
Job No 561410027 91
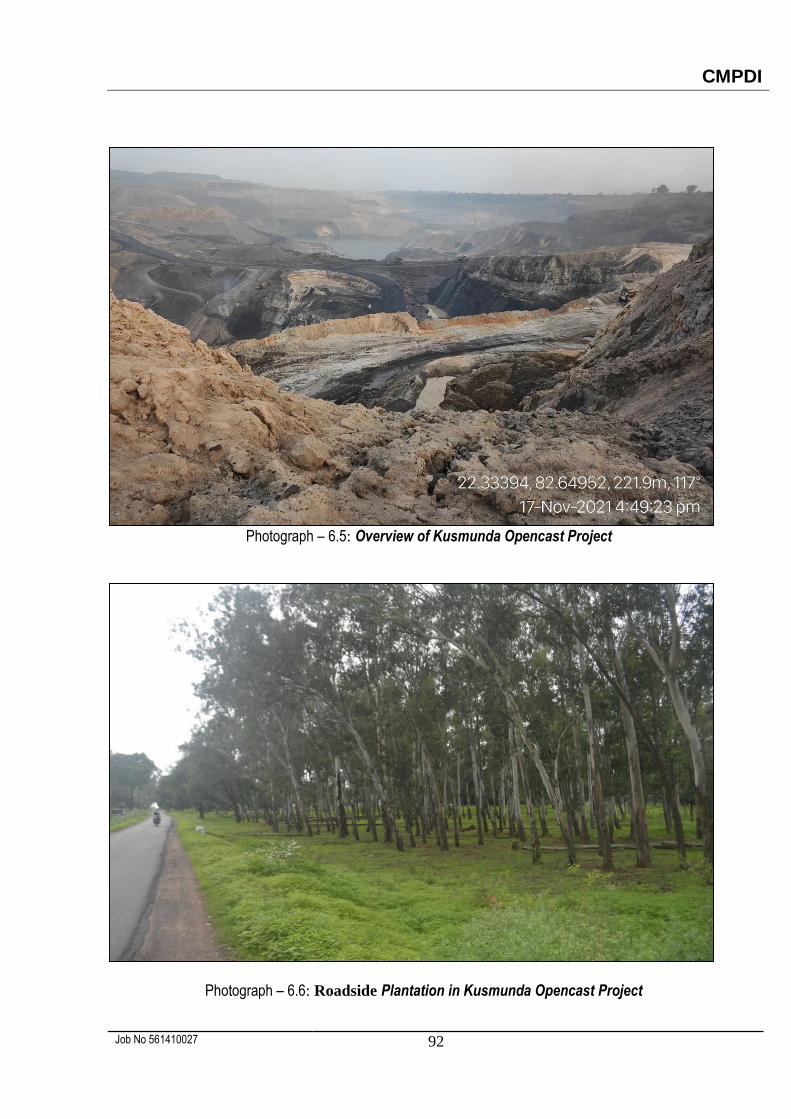
Photograph – 6.3: Plantation in Gevra Opencast Project
Photograph – 6.4: New Plantation in Gevra Opencast Project
CMPDI
Job No 561410027 92
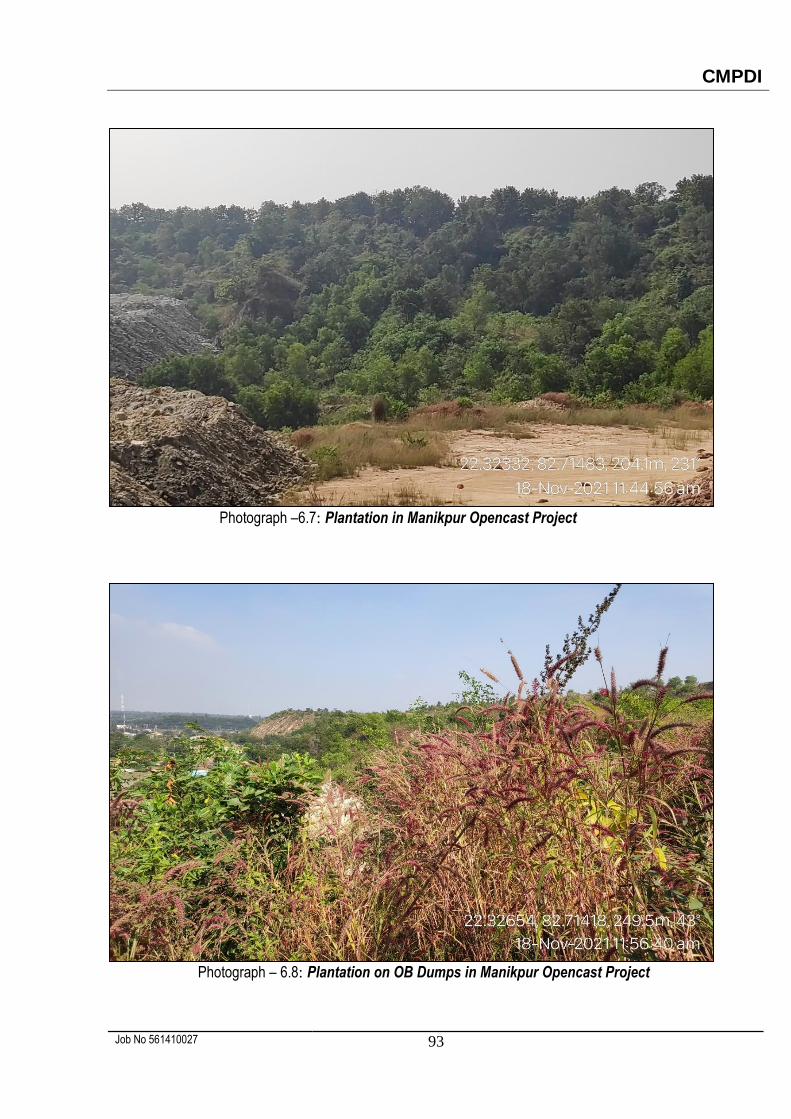
Photograph – 6.5: Overview of Kusmunda Opencast Project
Photograph – 6.6: Roadside Plantation in Kusmunda Opencast Project
CMPDI
Job No 561410027 93
Photograph –6.7: Plantation in Manikpur Opencast Project
Photograph – 6.8: Plantation on OB Dumps in Manikpur Opencast Project
CMPDI
Job No 561410027 94
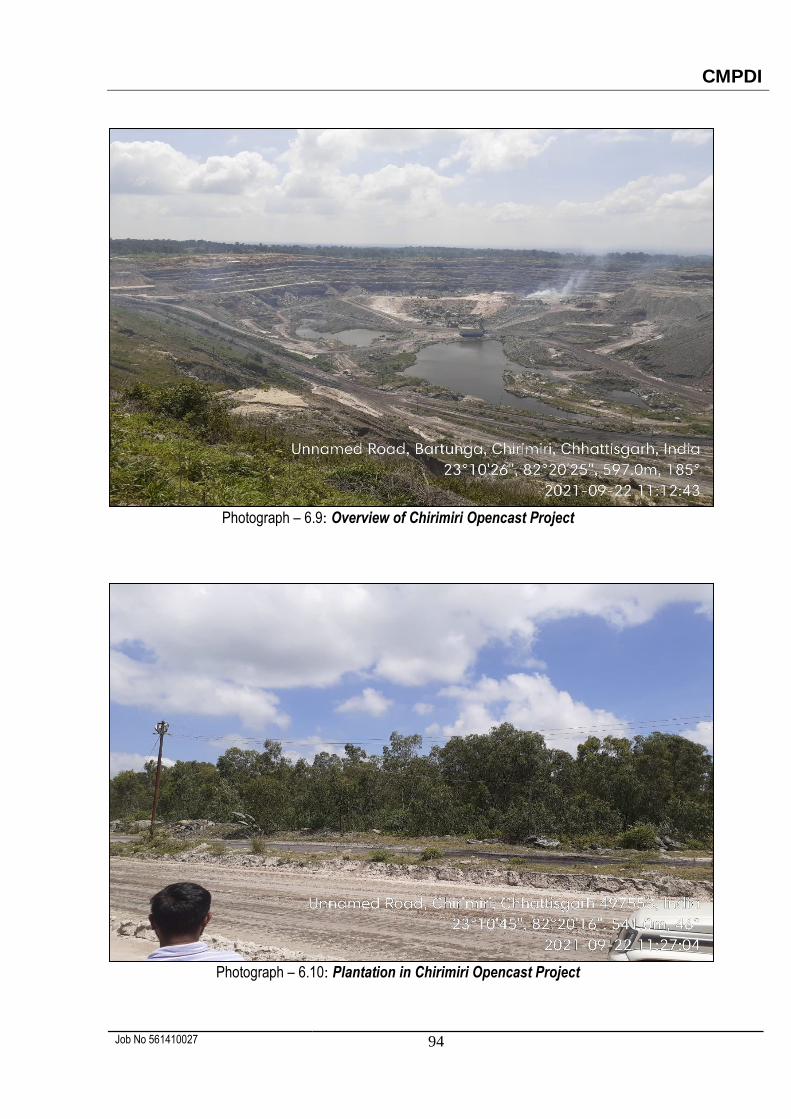
Photograph – 6.9: Overview of Chirimiri Opencast Project
Photograph – 6.10: Plantation in Chirimiri Opencast Project
CMPDI
Job No 561410027 95
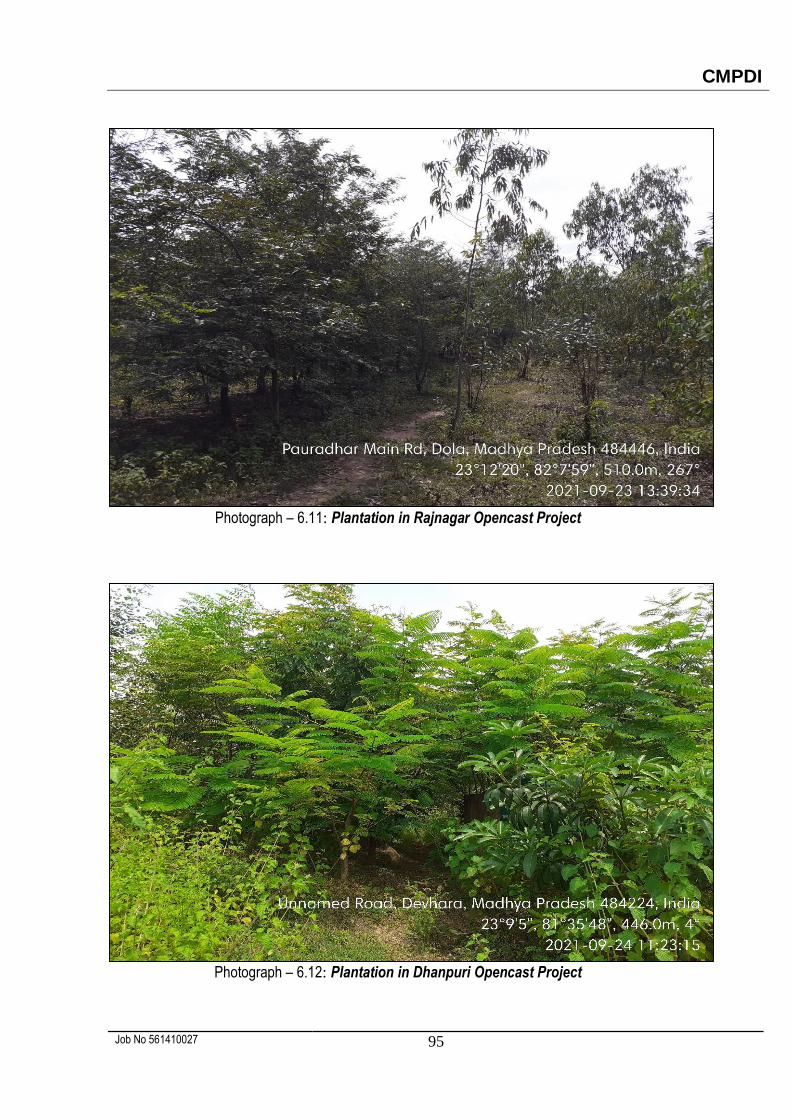
Photograph – 6.11: Plantation in Rajnagar Opencast Project
Photograph – 6.12: Plantation in Dhanpuri Opencast Project
CMPDI
Job No 561410027 96
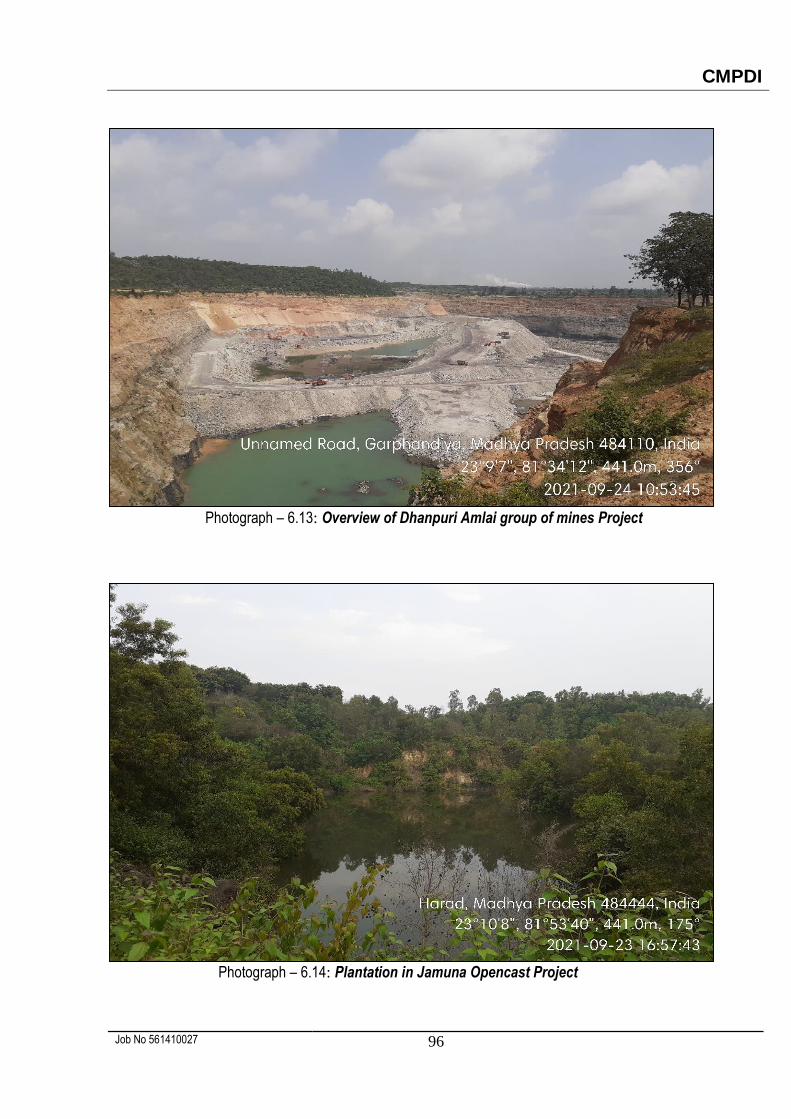
Photograph – 6.13: Overview of Dhanpuri Amlai group of mines Project
Photograph – 6.14: Plantation in Jamuna Opencast Project
CMPDI
Job No 561410027 97
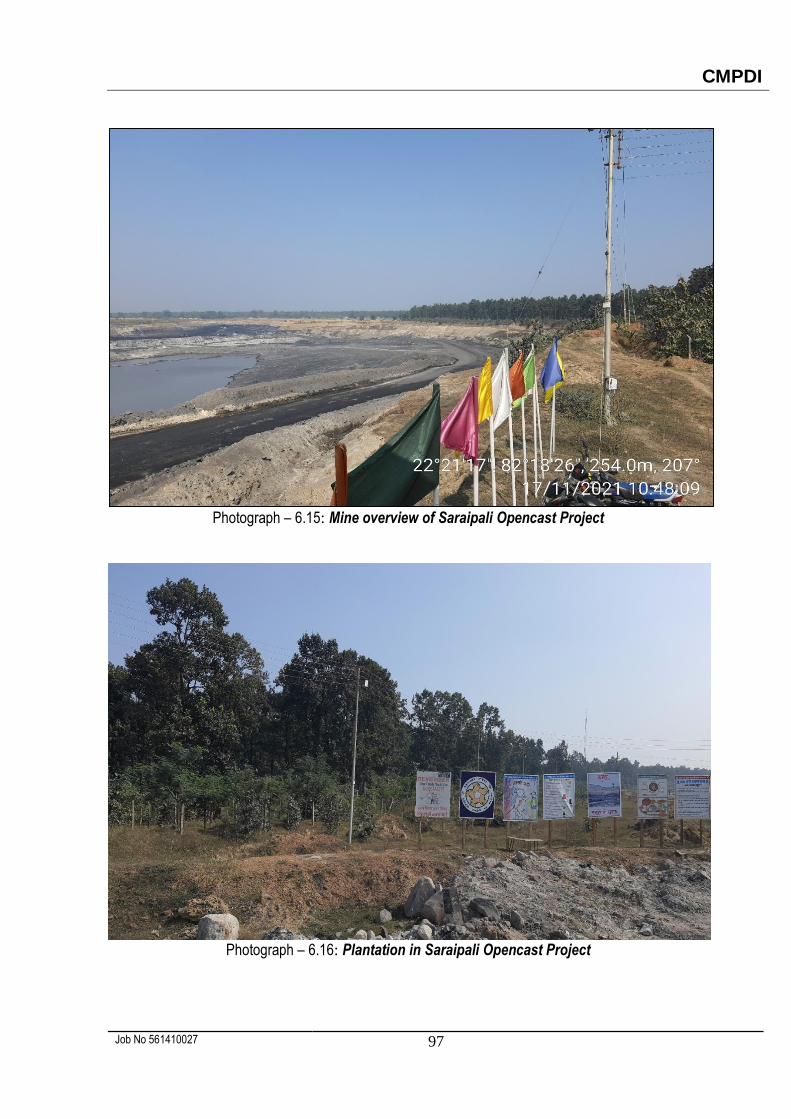
Photograph – 6.15: Mine overview of Saraipali Opencast Project
Photograph – 6.16: Plantation in Saraipali Opencast Project
CMPDI
Job No 561410027 98
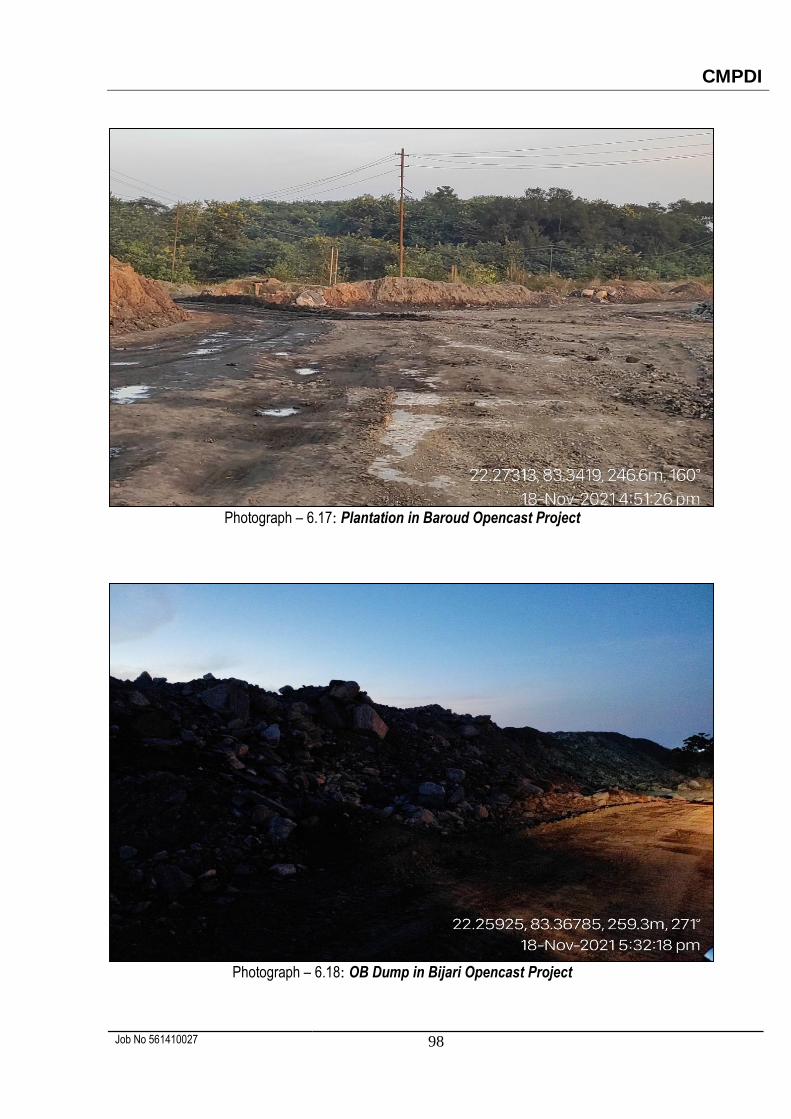
Photograph – 6.17: Plantation in Baroud Opencast Project
Photograph – 6.18: OB Dump in Bijari Opencast Project
CMPDI
Job No 561410027 99
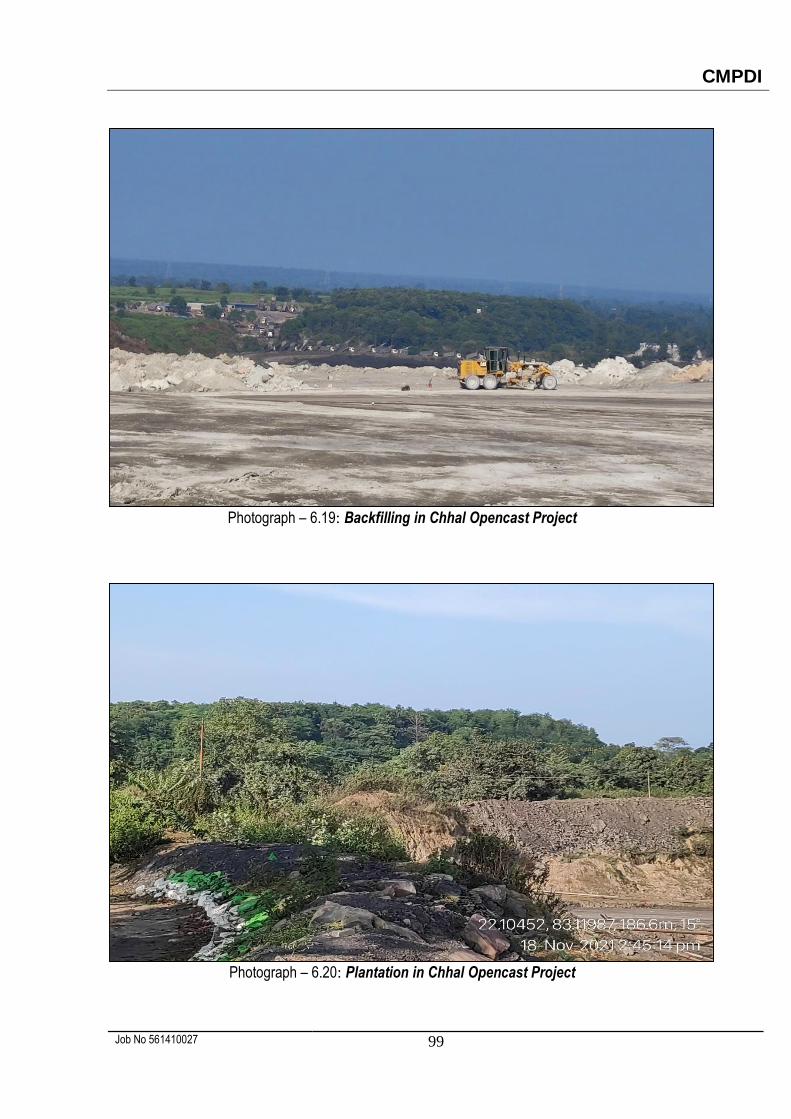
Photograph – 6.19: Backfilling in Chhal Opencast Project
Photograph – 6.20: Plantation in Chhal Opencast Project
CMPDI
Job No 561410027 100
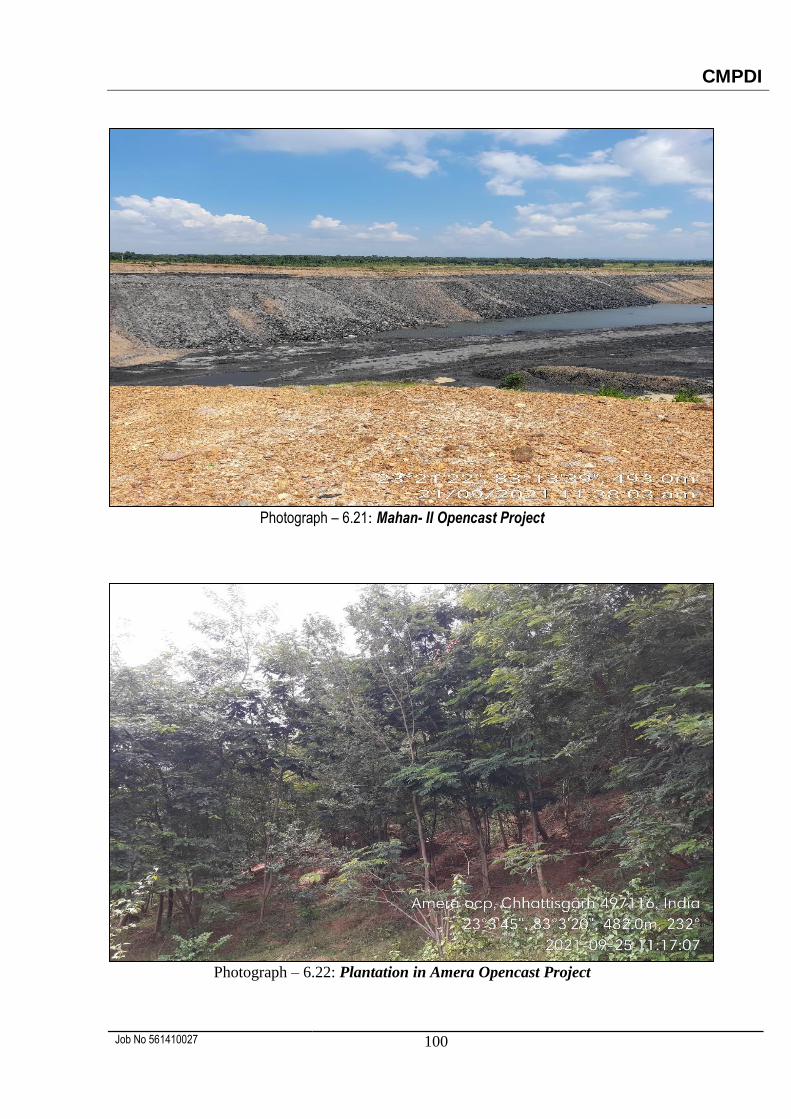
Photograph – 6.21: Mahan- II Opencast Project
Photograph – 6.22: Plantation in Amera Opencast Project
CMPDI
Job No 561410027 101
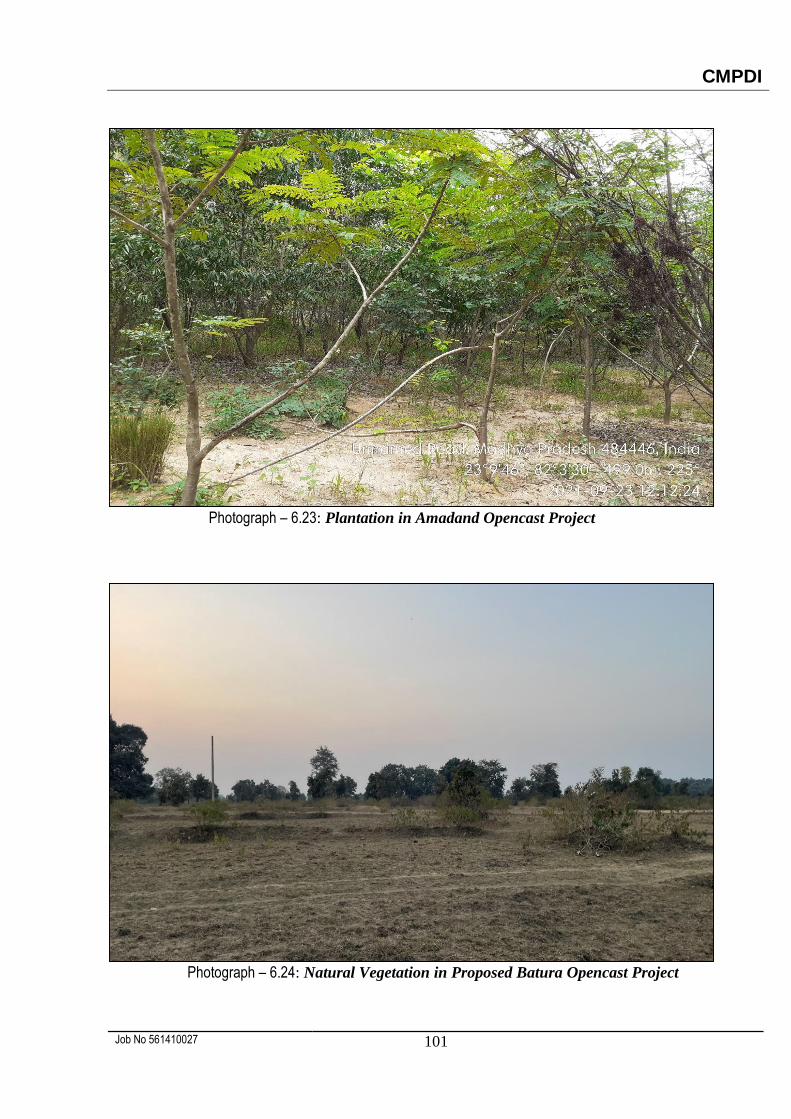
Photograph – 6.23: Plantation in Amadand Opencast Project
Photograph – 6.24: Natural Vegetation in Proposed Batura Opencast Project
CMPDI
Job No 561410027 102
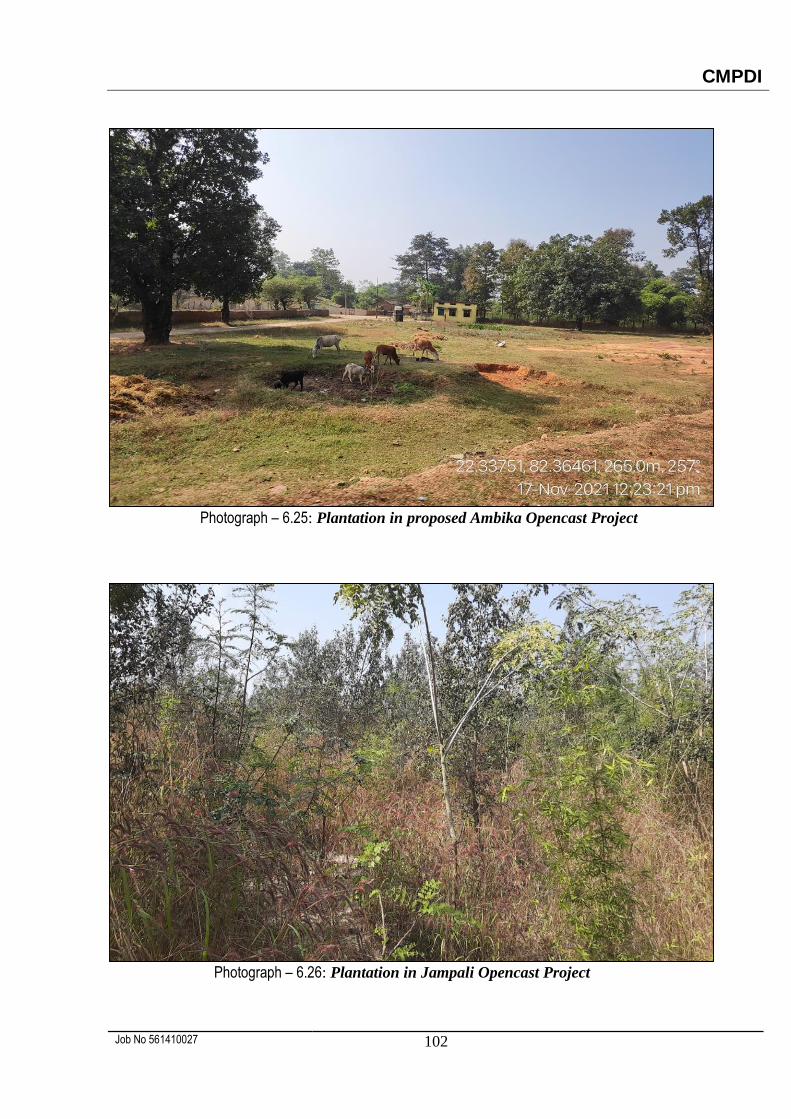
Photograph – 6.25: Plantation in proposed Ambika Opencast Project
Photograph – 6.26: Plantation in Jampali Opencast Project
CMPDI
Job No 561410027 103
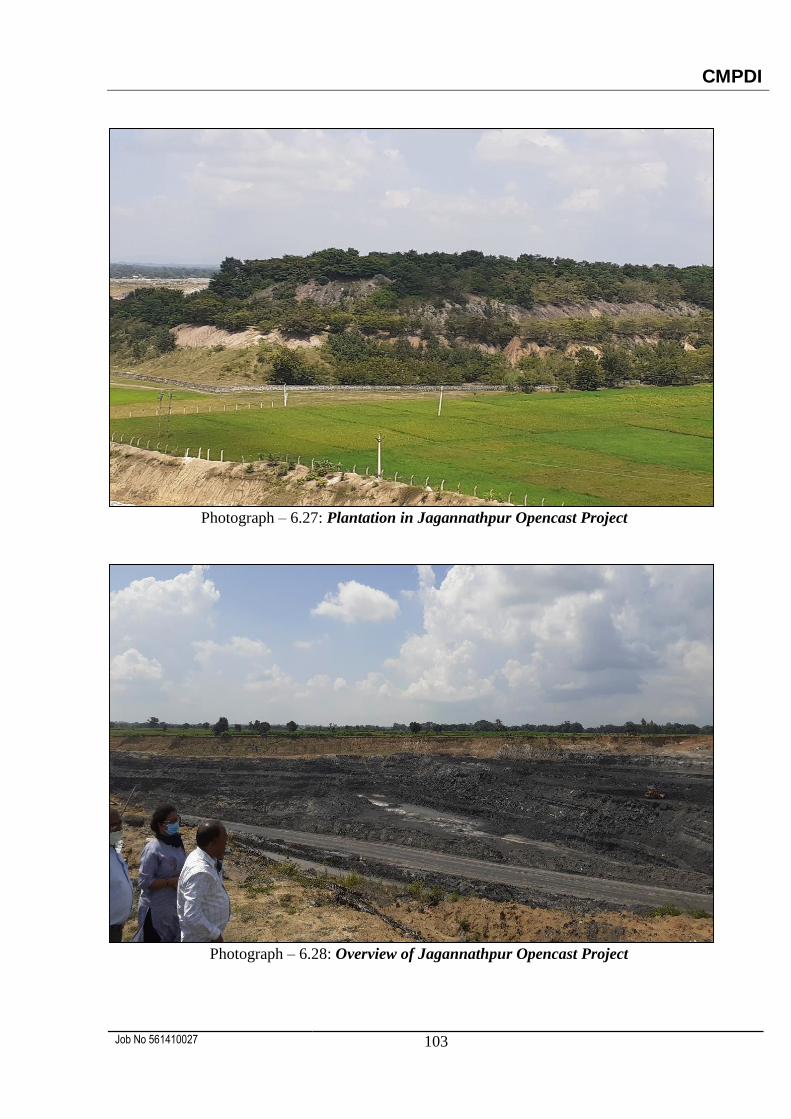
Photograph – 6.27: Plantation in Jagannathpur Opencast Project
Photograph – 6.28: Overview of Jagannathpur Opencast Project
NORTHERN COALFIELDS LIMITED
CMPDI
Job No 561410027 105
7.0 Land Reclamation Status in Northern Coalfields Ltd.
7.1 Following 10 OC projects producing more than 5 million cubic m. (Coal + OB together)
of Northern Coalfields Ltd. have been taken up for land reclamation monitoring based
on satellite data of the year 2021:
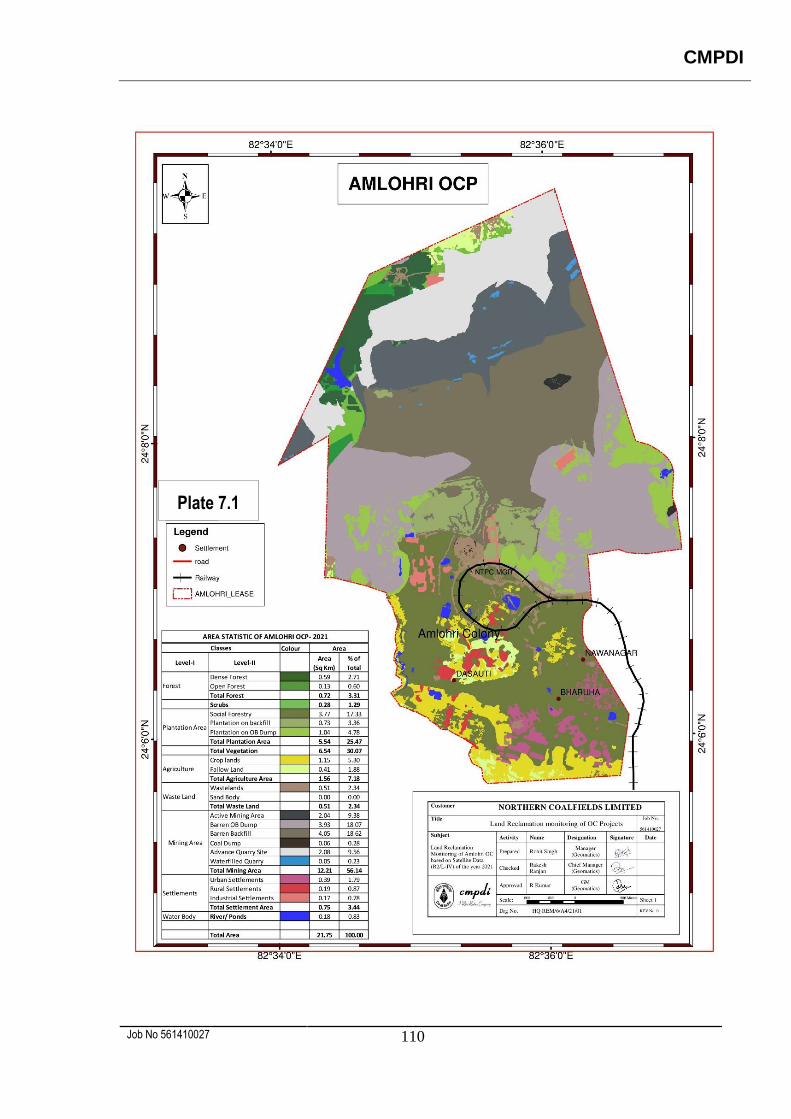
Amlohri
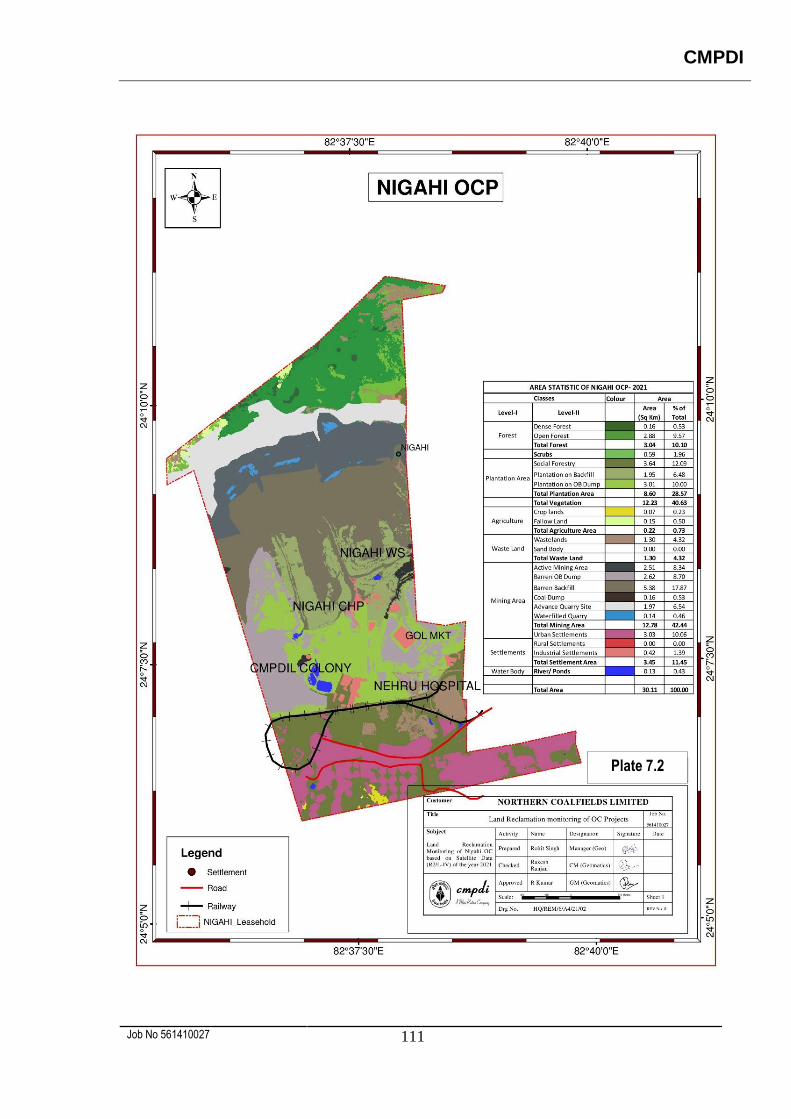
Nigahi
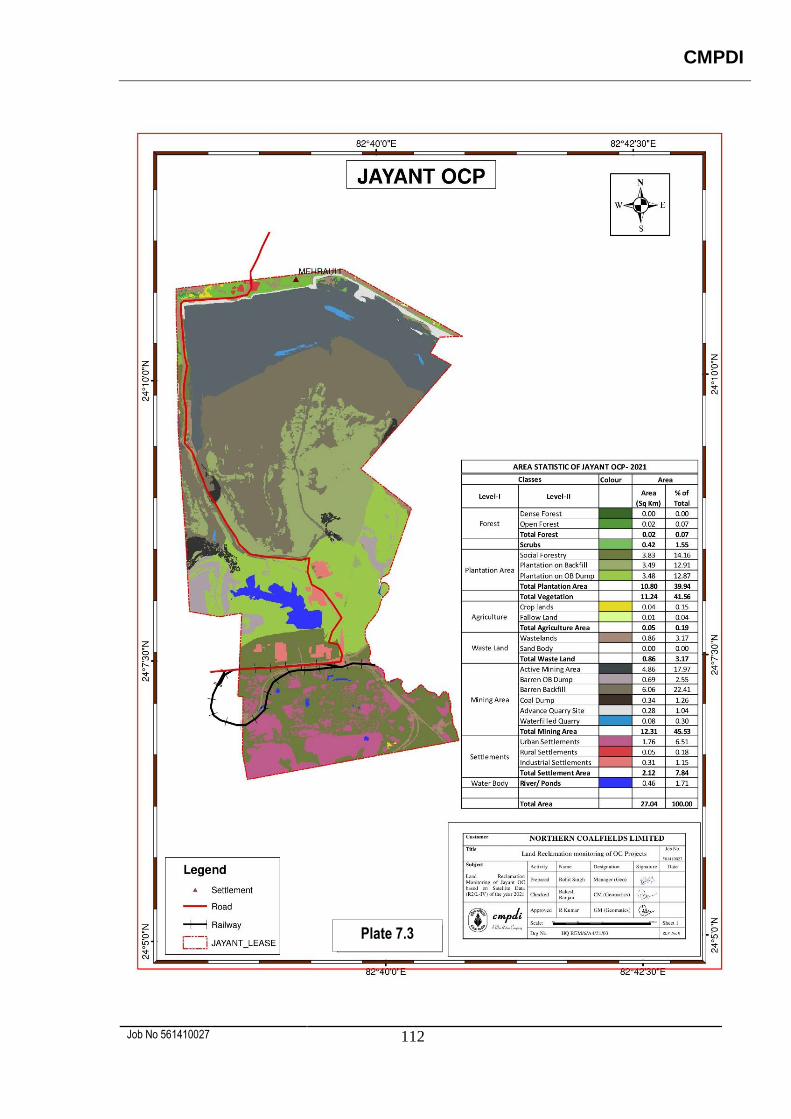
Jayant
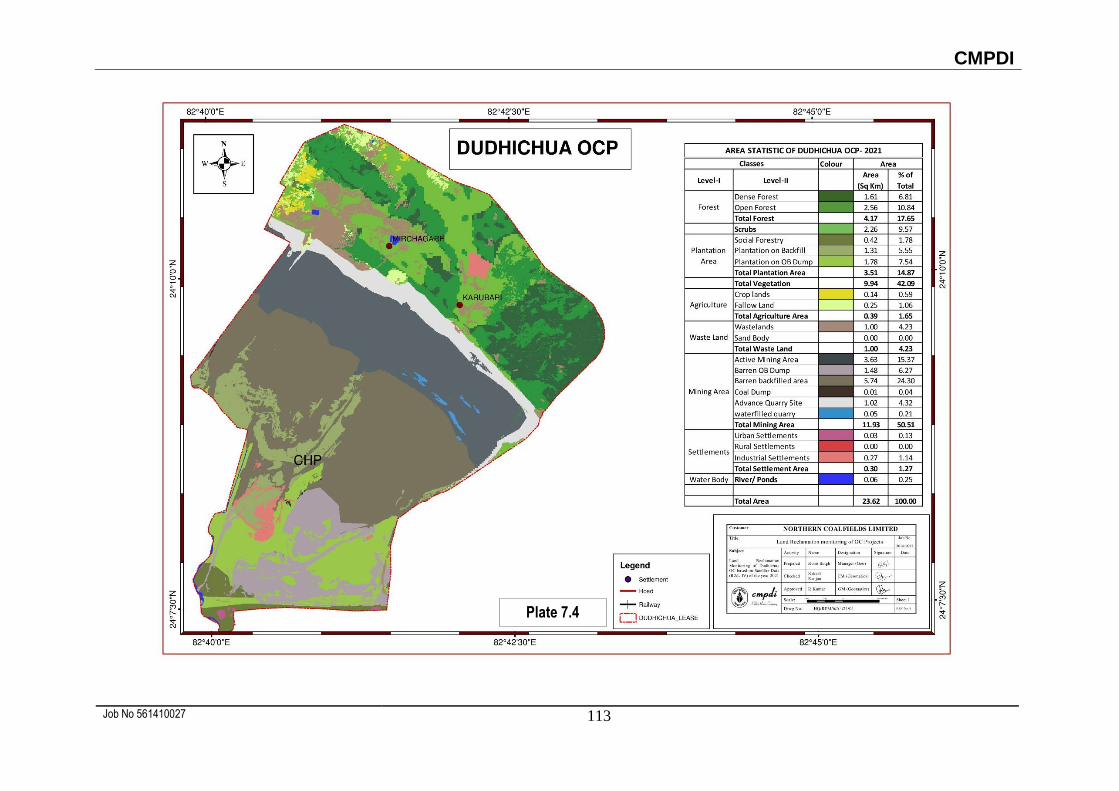
Dudhichua
Khadia
Krishnashila
Bina
Kakri
Jhingurdah
Block-B
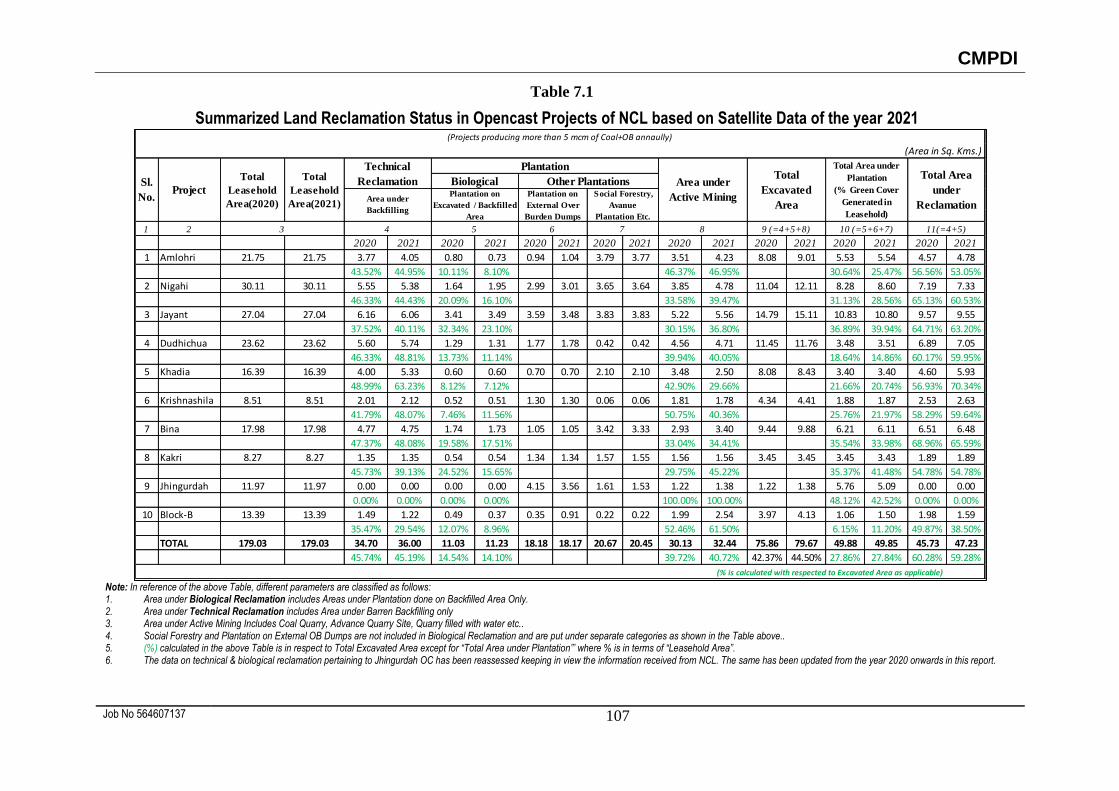
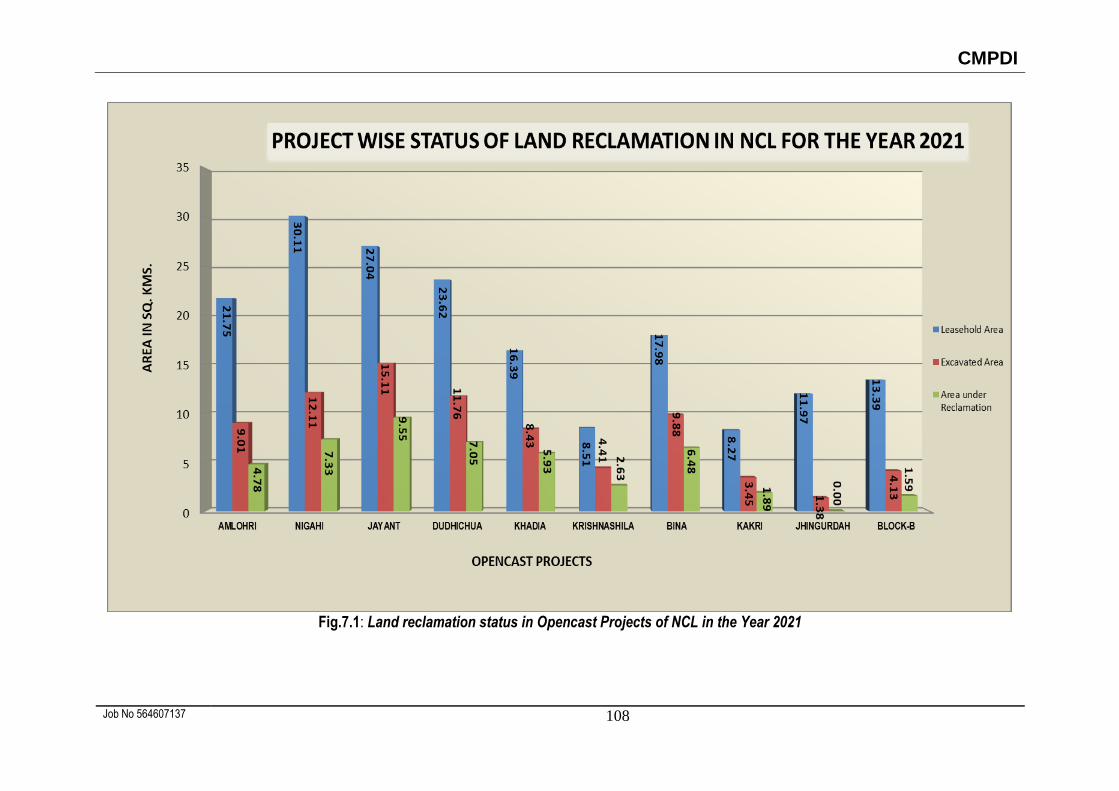
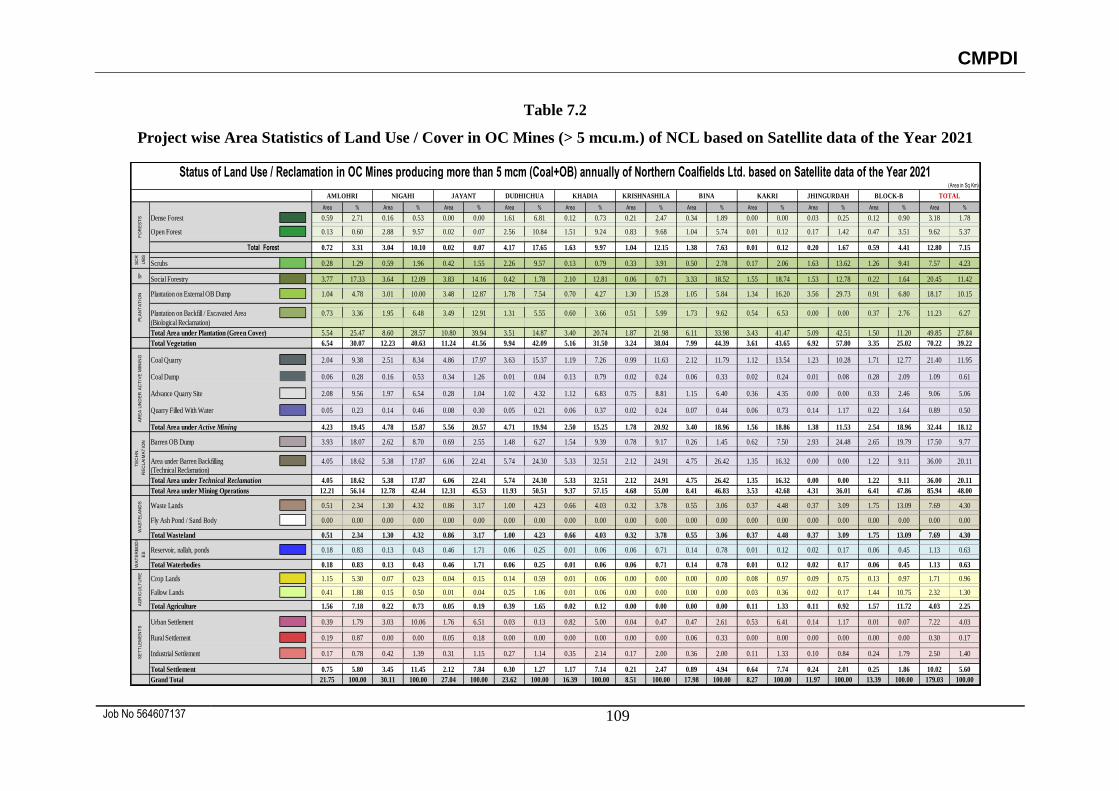
7.2 Project wise Land Reclamation status in NCL for the year 2021 is given in Table 7.1 and
also shown graphically in Fig 7.1. Area statistics of different land use / cover classes
present in the mine leasehold of the above projects for the year 2021 are shown in the
Table – 7.2. Land use/cover maps derived from satellite data are shown in Plate 7.1 –
7.10. Land reclamation status of the above mentioned 10 projects were prepared
regularly since 2008. Year wise changes in the different land use classes based on
satellite data for the last three years are depicted in Bar Charts in Fig. 7.2 to 7.11.
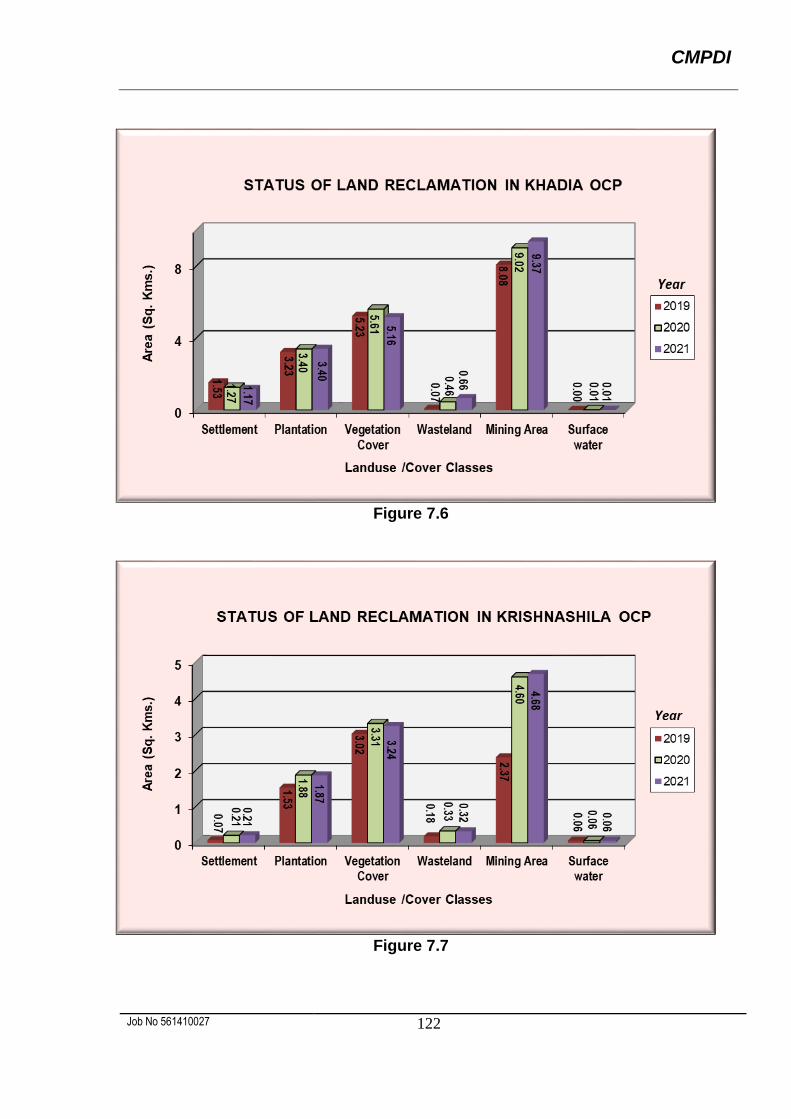
7.3 Study reveals that out of total excavated area of 79.67 Km2, 47.23 Km2 (59.28%) of area
is under reclamation out of which 36.00 Km2 (45.19%) area is under backfilling
(Technical Reclamation) and 11.23 Km2 (14.10%) area has been revegetated
(Biological Reclamation). There is an increase of 1.50 Km2 for area under reclamation
CMPDI
Job No 561410027 106
in NCL in the year 2021 with respect to the year 2020. This increase is due to effort
towards environment by NCL.
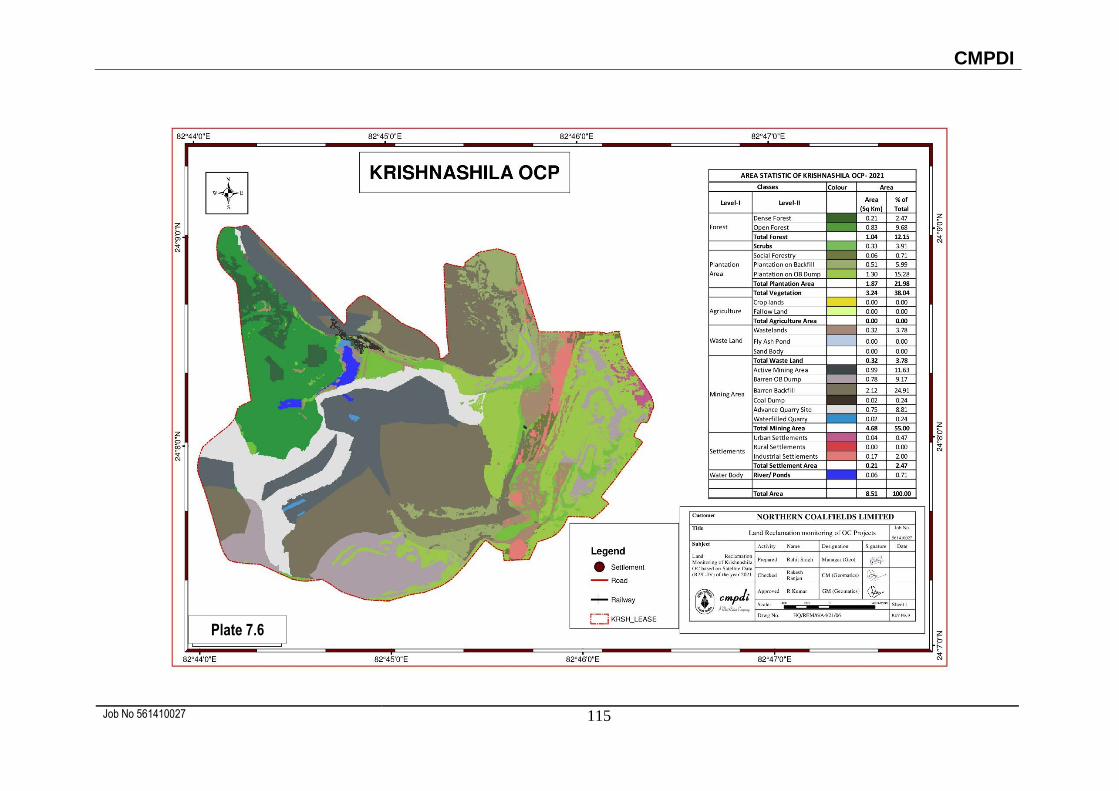
7.4 After analyzing the satellite data of year 2021 vs. 2020, it is evident that area under
plantation (biological reclamation) has increased from 11.03 km2 in 2020 to 11.23 km2
in 2021, while reduced marginally in Krishnashila, Bina, & Block B projects due to
dumping on vegetated area.
7.5 Study also reveal that area under barren backfilling (Technical Reclamation) has
increased from 34.70 km2 in 2020 to 36.00 km2 in 2021. All the 10 projects of NCL
selected for monitoring are showing an increasing trend in technical reclamation except
Bina and Block B due to change in backfilled to external OB class.
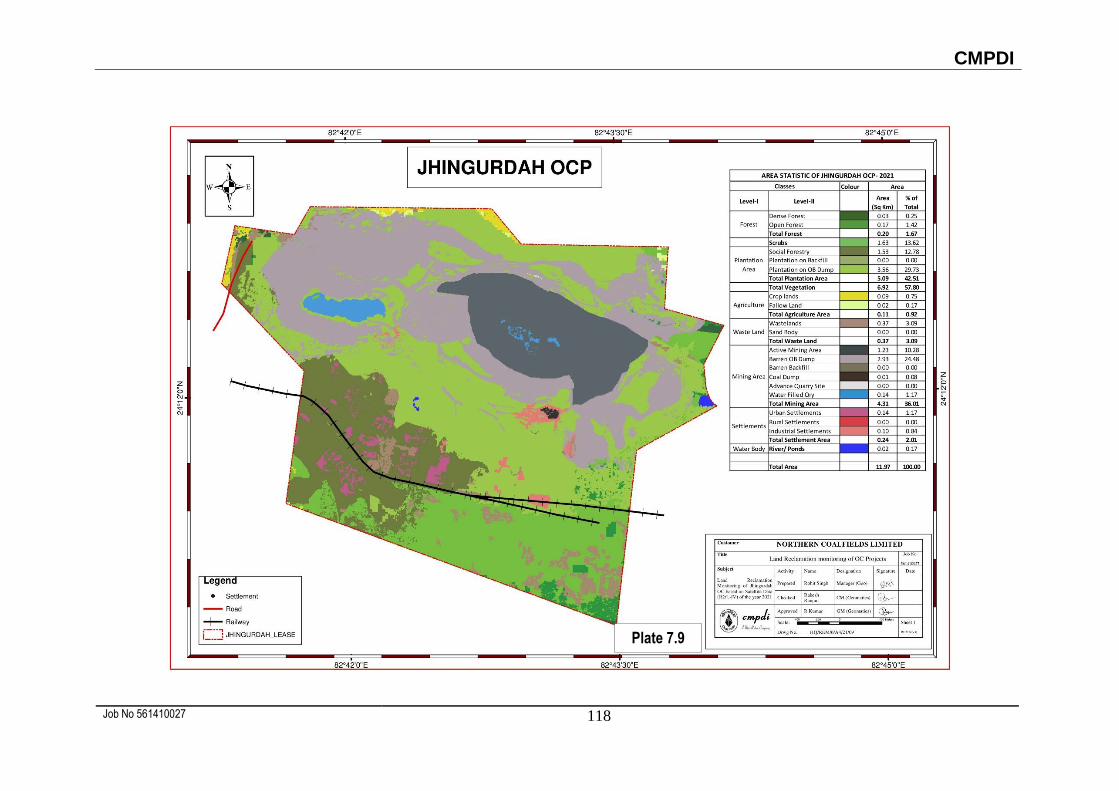
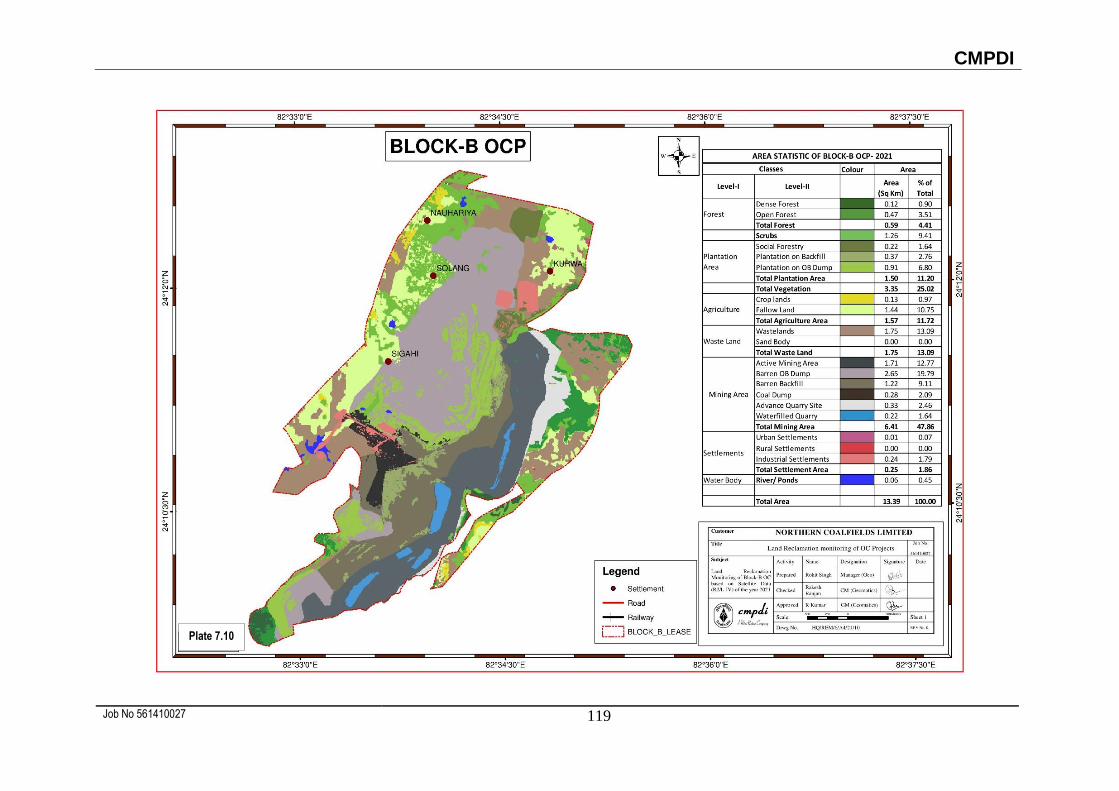
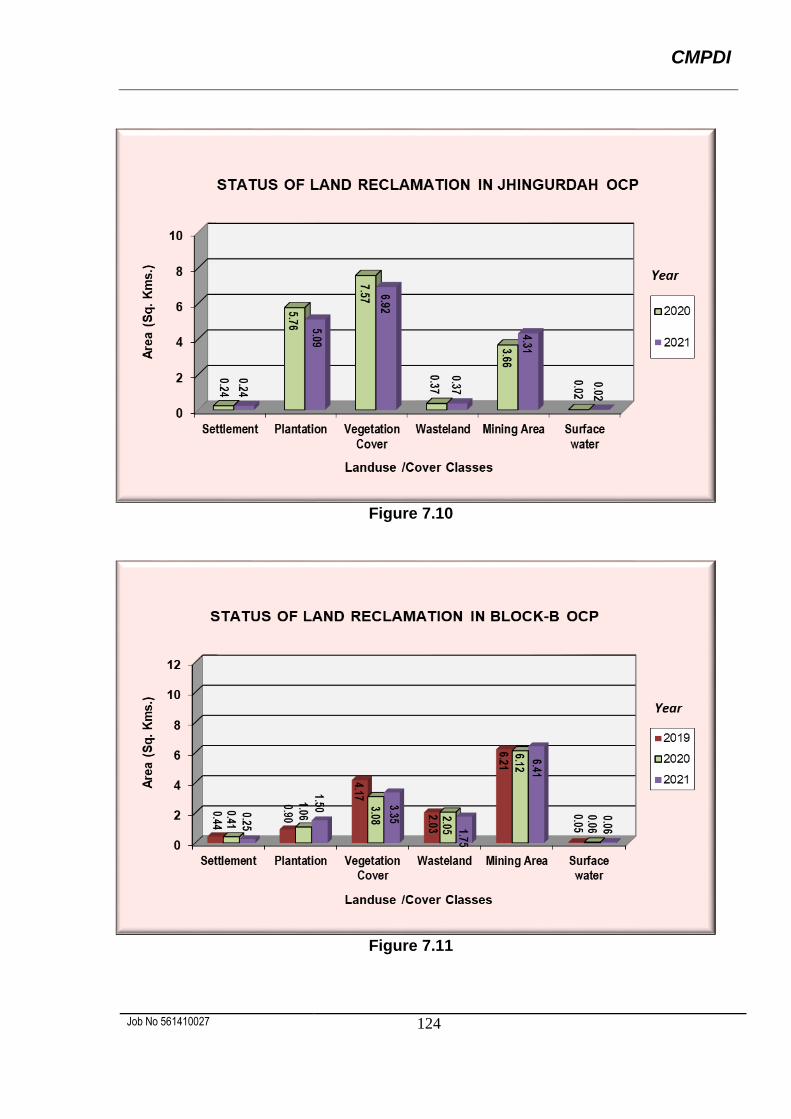
7.6 It was also observed that total area under plantation (Green Cover) has decreased from
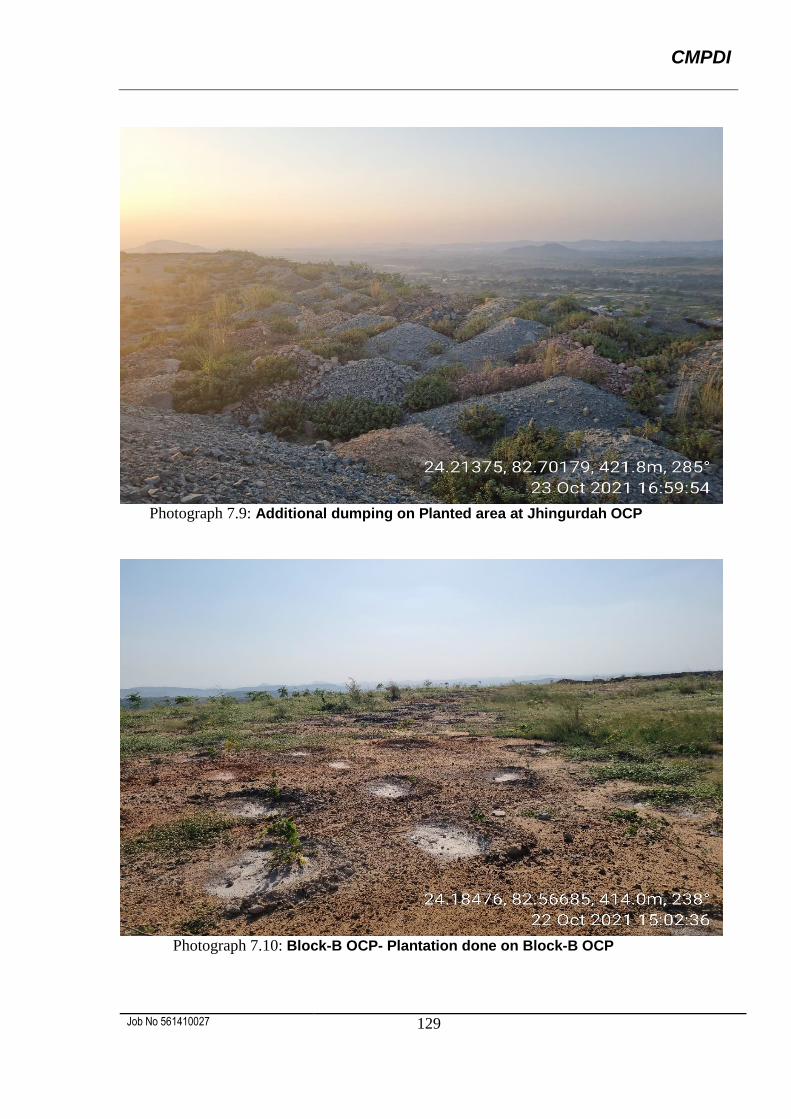
49.88 km2 in 2020 to 49.85 km2 in 2021 due to additional dumping in on vegetated areas
in Jhingurdah project. In the projects of NCL selected for monitoring Amlohri, Nigahi,
Dudhichua and Block – B OCPs are showing an increasing trend in Green Cover in their
leasehold (Refer Table-7.1), whereas Jayant, Krishnashila, Bina, Kakri, Jhingurdah are
showing a decreasing trend due to natural degradation.
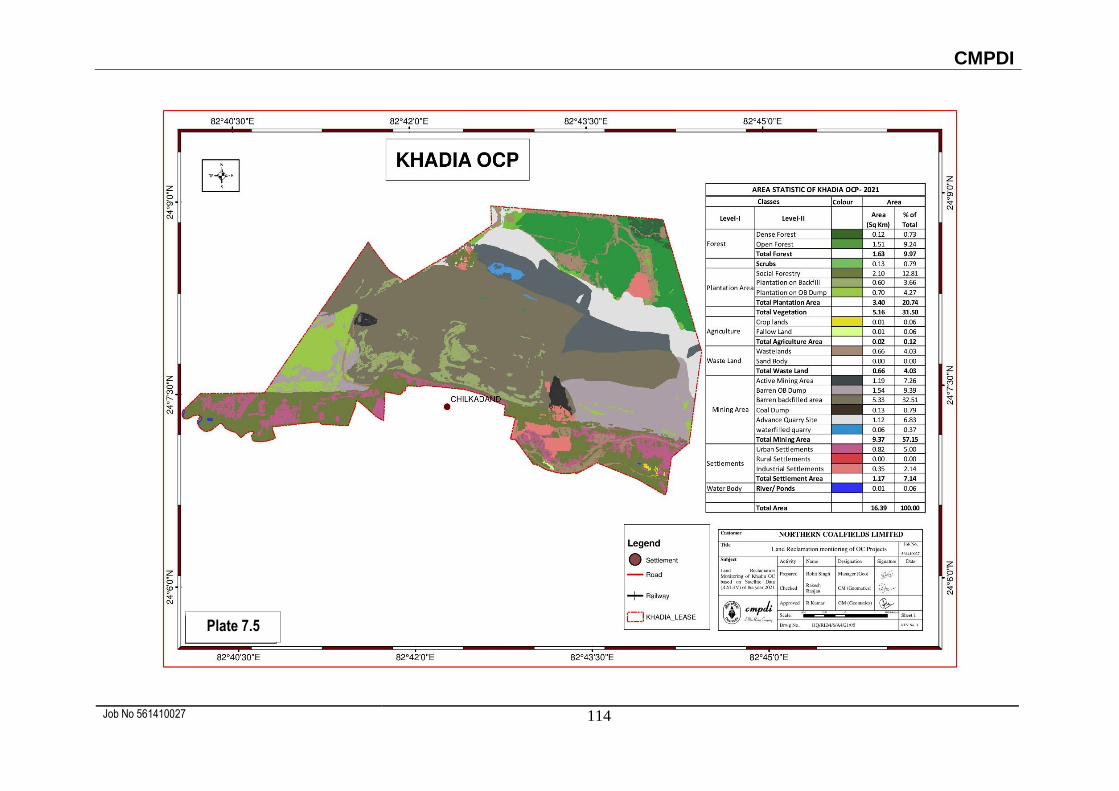
7.7 Out of 10 projects of NCL, maximum land reclamation has been carried out in Khadia
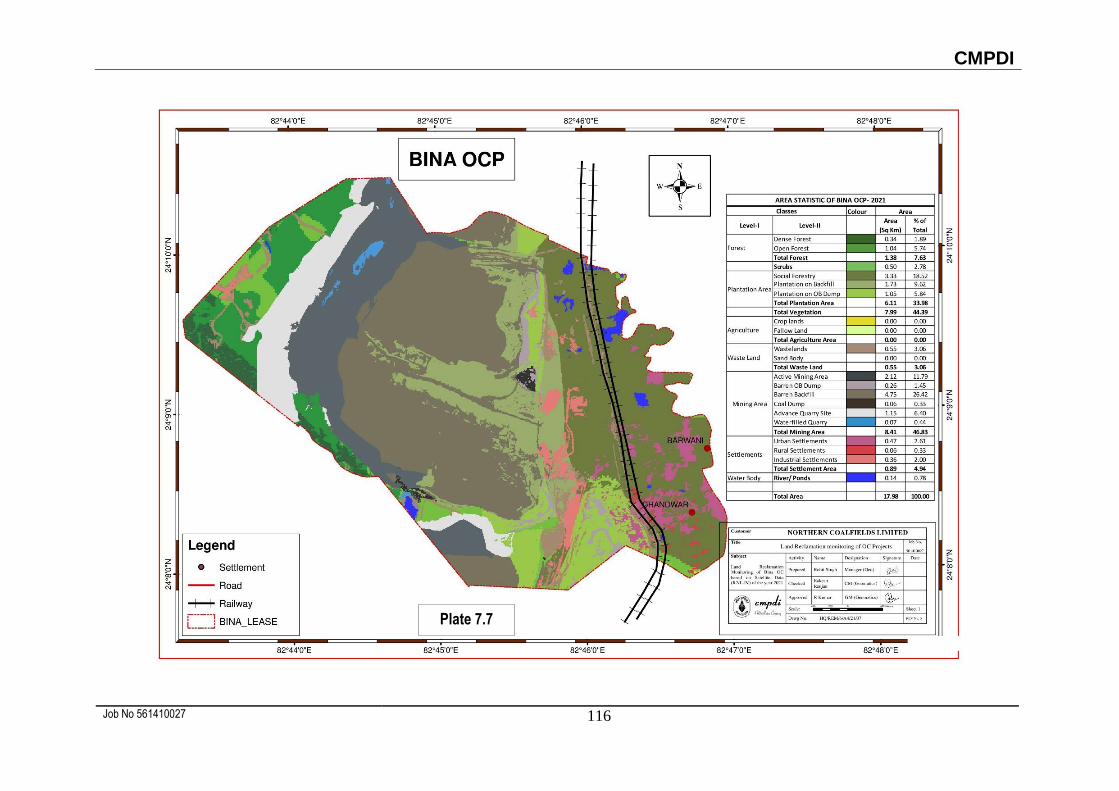
(70.34%) followed by Bina (65.59%) and Jayant (63.20%). It may be noted that in view
of Jhingurdah OC Mine production from upper mineable seams are almost complete.
The data on Technical and Biological reclamation pertaining to Jhingurdah opencast
project has been reassessed keeping in view the information received from NCL. The
same has been updated from the year 2020 onwards in this report.
CMPDI
Job No 564607137 107
Summarized Land Reclamation Status in Opencast Projects of NCL based on Satellite Data of the year 2021
Note: In reference of the above Table, different parameters are classified as follows: 1. Area under Biological Reclamation includes Areas under Plantation done on Backfilled Area Only. 2. Area under Technical Reclamation includes Area under Barren Backfilling only 3. Area under Active Mining Includes Coal Quarry, Advance Quarry Site, Quarry filled with water etc.. 4. Social Forestry and Plantation on External OB Dumps are not included in Biological Reclamation and are put under separate categories as shown in the Table above.. 5. (%) calculated in the above Table is in respect to Total Excavated Area except for “Total Area under Plantation”’ where % is in terms of “Leasehold Area”. 6. The data on technical & biological reclamation pertaining to Jhingurdah OC has been reassessed keeping in view the information received from NCL. The same has been updated from the year 2020 onwards in this report.
1 2
2020 2021 2020 2021 2020 2021 2020 2021 2020 2021 2020 2021 2020 2021 2020 2021
1 Amlohri 21.75 21.75 3.77 4.05 0.80 0.73 0.94 1.04 3.79 3.77 3.51 4.23 8.08 9.01 5.53 5.54 4.57 4.78
43.52% 44.95% 10.11% 8.10% 46.37% 46.95% 30.64% 25.47% 56.56% 53.05%
2 Nigahi 30.11 30.11 5.55 5.38 1.64 1.95 2.99 3.01 3.65 3.64 3.85 4.78 11.04 12.11 8.28 8.60 7.19 7.33
46.33% 44.43% 20.09% 16.10% 33.58% 39.47% 31.13% 28.56% 65.13% 60.53%
3 Jayant 27.04 27.04 6.16 6.06 3.41 3.49 3.59 3.48 3.83 3.83 5.22 5.56 14.79 15.11 10.83 10.80 9.57 9.55
37.52% 40.11% 32.34% 23.10% 30.15% 36.80% 36.89% 39.94% 64.71% 63.20%
4 Dudhichua 23.62 23.62 5.60 5.74 1.29 1.31 1.77 1.78 0.42 0.42 4.56 4.71 11.45 11.76 3.48 3.51 6.89 7.05
46.33% 48.81% 13.73% 11.14% 39.94% 40.05% 18.64% 14.86% 60.17% 59.95%
5 Khadia 16.39 16.39 4.00 5.33 0.60 0.60 0.70 0.70 2.10 2.10 3.48 2.50 8.08 8.43 3.40 3.40 4.60 5.93
48.99% 63.23% 8.12% 7.12% 42.90% 29.66% 21.66% 20.74% 56.93% 70.34%
6 Krishnashila 8.51 8.51 2.01 2.12 0.52 0.51 1.30 1.30 0.06 0.06 1.81 1.78 4.34 4.41 1.88 1.87 2.53 2.63
41.79% 48.07% 7.46% 11.56% 50.75% 40.36% 25.76% 21.97% 58.29% 59.64%
7 Bina 17.98 17.98 4.77 4.75 1.74 1.73 1.05 1.05 3.42 3.33 2.93 3.40 9.44 9.88 6.21 6.11 6.51 6.48
47.37% 48.08% 19.58% 17.51% 33.04% 34.41% 35.54% 33.98% 68.96% 65.59%
8 Kakri 8.27 8.27 1.35 1.35 0.54 0.54 1.34 1.34 1.57 1.55 1.56 1.56 3.45 3.45 3.45 3.43 1.89 1.89
45.73% 39.13% 24.52% 15.65% 29.75% 45.22% 35.37% 41.48% 54.78% 54.78%
9 Jhingurdah 11.97 11.97 0.00 0.00 0.00 0.00 4.15 3.56 1.61 1.53 1.22 1.38 1.22 1.38 5.76 5.09 0.00 0.00
0.00% 0.00% 0.00% 0.00% 100.00% 100.00% 48.12% 42.52% 0.00% 0.00%
10 Block-B 13.39 13.39 1.49 1.22 0.49 0.37 0.35 0.91 0.22 0.22 1.99 2.54 3.97 4.13 1.06 1.50 1.98 1.59
35.47% 29.54% 12.07% 8.96% 52.46% 61.50% 6.15% 11.20% 49.87% 38.50%
TOTAL 179.03 179.03 34.70 36.00 11.03 11.23 18.18 18.17 20.67 20.45 30.13 32.44 75.86 79.67 49.88 49.85 45.73 47.23
45.74% 45.19% 14.54% 14.10% 39.72% 40.72% 42.37% 44.50% 27.86% 27.84% 60.28% 59.28%
(% is calculated with respected to Excavated Area as applicable)
Technical
Reclamation
Area under
Backfilling
Biological Plantation on
Excavated / Backfilled
Area
5
Total Area
under
Reclamation
Total Area under
Plantation
(% Green Cover
Generated in
Leasehold)
4
Other PlantationsTotal
Excavated
Area
Area under
Active Mining
Sl.
No.
(Projects producing more than 5 mcm of Coal+OB annaully)
(Area in Sq. Kms.)
Total
Leasehold
Area(2021)
3
Status of Land Reclamation in Northern Coalfields Limited based on Satellite Data for the Year 2021
TABLE-1
Plantation
Social Forestry,
Avanue
Plantation Etc.
Plantation on
External Over
Burden Dumps
11(=4+5)10 (=5+6+7)9 (=4+5+8)876
Project
Total
Leasehold
Area(2020)
Table 7.1
CMPDI
Job No 564607137 108
Fig.7.1: Land reclamation status in Opencast Projects of NCL in the Year 2021
CMPDI
Job No 564607137 109
Table 7.2
Project wise Area Statistics of Land Use / Cover in OC Mines (> 5 mcu.m.) of NCL based on Satellite data of the Year 2021
Area % Area % Area % Area % Area % Area % Area % Area % Area % Area % Area %
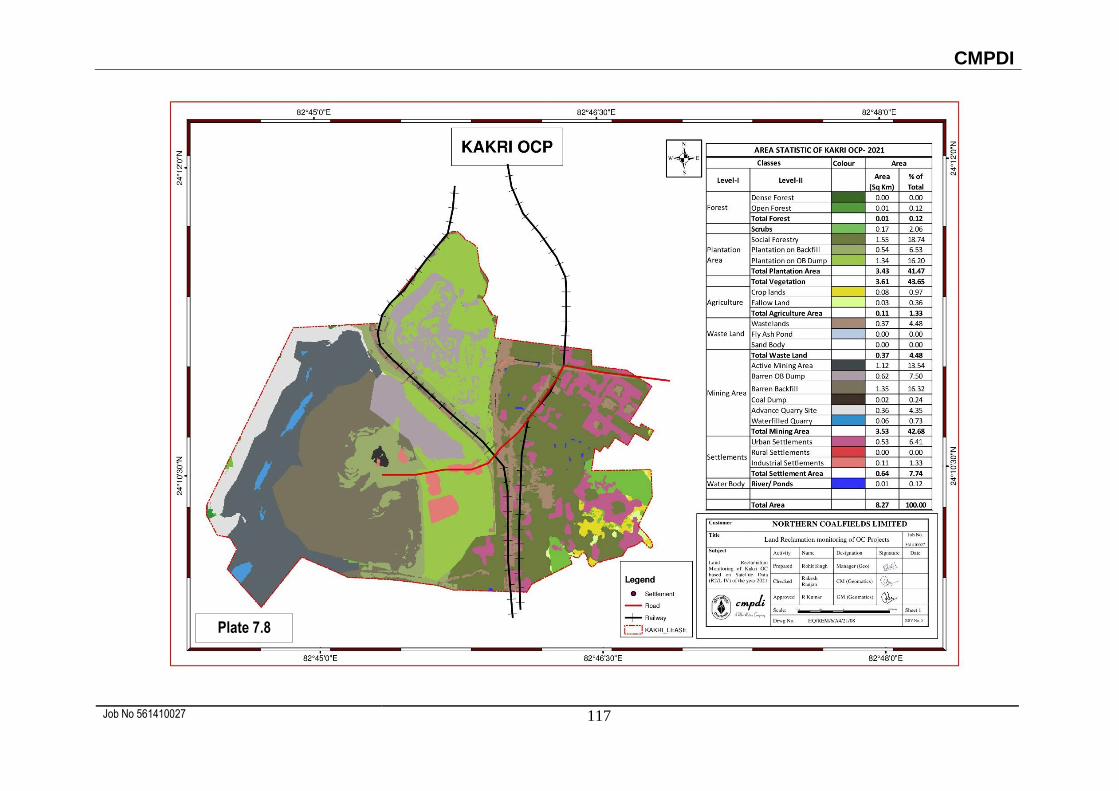
Dense Forest 0.59 2.71 0.16 0.53 0.00 0.00 1.61 6.81 0.12 0.73 0.21 2.47 0.34 1.89 0.00 0.00 0.03 0.25 0.12 0.90 3.18 1.78
Open Forest 0.13 0.60 2.88 9.57 0.02 0.07 2.56 10.84 1.51 9.24 0.83 9.68 1.04 5.74 0.01 0.12 0.17 1.42 0.47 3.51 9.62 5.37
Total Forest 0.72 3.31 3.04 10.10 0.02 0.07 4.17 17.65 1.63 9.97 1.04 12.15 1.38 7.63 0.01 0.12 0.20 1.67 0.59 4.41 12.80 7.15
Scrubs 0.28 1.29 0.59 1.96 0.42 1.55 2.26 9.57 0.13 0.79 0.33 3.91 0.50 2.78 0.17 2.06 1.63 13.62 1.26 9.41 7.57 4.23
Social Forestry 3.77 17.33 3.64 12.09 3.83 14.16 0.42 1.78 2.10 12.81 0.06 0.71 3.33 18.52 1.55 18.74 1.53 12.78 0.22 1.64 20.45 11.42
Plantation on External OB Dump 1.04 4.78 3.01 10.00 3.48 12.87 1.78 7.54 0.70 4.27 1.30 15.28 1.05 5.84 1.34 16.20 3.56 29.73 0.91 6.80 18.17 10.15
Plantation on Backfill / Excavated Area 0.73 3.36 1.95 6.48 3.49 12.91 1.31 5.55 0.60 3.66 0.51 5.99 1.73 9.62 0.54 6.53 0.00 0.00 0.37 2.76 11.23 6.27
(Biological Reclamation)
Total Area under Plantation (Green Cover) 5.54 25.47 8.60 28.57 10.80 39.94 3.51 14.87 3.40 20.74 1.87 21.98 6.11 33.98 3.43 41.47 5.09 42.51 1.50 11.20 49.85 27.84
Total Vegetation 6.54 30.07 12.23 40.63 11.24 41.56 9.94 42.09 5.16 31.50 3.24 38.04 7.99 44.39 3.61 43.65 6.92 57.80 3.35 25.02 70.22 39.22
Coal Quarry 2.04 9.38 2.51 8.34 4.86 17.97 3.63 15.37 1.19 7.26 0.99 11.63 2.12 11.79 1.12 13.54 1.23 10.28 1.71 12.77 21.40 11.95
Coal Dump 0.06 0.28 0.16 0.53 0.34 1.26 0.01 0.04 0.13 0.79 0.02 0.24 0.06 0.33 0.02 0.24 0.01 0.08 0.28 2.09 1.09 0.61
Advance Quarry Site 2.08 9.56 1.97 6.54 0.28 1.04 1.02 4.32 1.12 6.83 0.75 8.81 1.15 6.40 0.36 4.35 0.00 0.00 0.33 2.46 9.06 5.06
Quarry Filled With Water 0.05 0.23 0.14 0.46 0.08 0.30 0.05 0.21 0.06 0.37 0.02 0.24 0.07 0.44 0.06 0.73 0.14 1.17 0.22 1.64 0.89 0.50
Total Area under Active Mining 4.23 19.45 4.78 15.87 5.56 20.57 4.71 19.94 2.50 15.25 1.78 20.92 3.40 18.96 1.56 18.86 1.38 11.53 2.54 18.96 32.44 18.12
Barren OB Dump 3.93 18.07 2.62 8.70 0.69 2.55 1.48 6.27 1.54 9.39 0.78 9.17 0.26 1.45 0.62 7.50 2.93 24.48 2.65 19.79 17.50 9.77
Area under Barren Backfilling 4.05 18.62 5.38 17.87 6.06 22.41 5.74 24.30 5.33 32.51 2.12 24.91 4.75 26.42 1.35 16.32 0.00 0.00 1.22 9.11 36.00 20.11(Technical Reclamation)
Total Area under Technical Reclamation 4.05 18.62 5.38 17.87 6.06 22.41 5.74 24.30 5.33 32.51 2.12 24.91 4.75 26.42 1.35 16.32 0.00 0.00 1.22 9.11 36.00 20.11
Total Area under Mining Operations 12.21 56.14 12.78 42.44 12.31 45.53 11.93 50.51 9.37 57.15 4.68 55.00 8.41 46.83 3.53 42.68 4.31 36.01 6.41 47.86 85.94 48.00
Waste Lands 0.51 2.34 1.30 4.32 0.86 3.17 1.00 4.23 0.66 4.03 0.32 3.78 0.55 3.06 0.37 4.48 0.37 3.09 1.75 13.09 7.69 4.30
Fly Ash Pond / Sand Body 0.00 0.00 0.00 0.00 0.00 0.00 0.00 0.00 0.00 0.00 0.00 0.00 0.00 0.00 0.00 0.00 0.00 0.00 0.00 0.00 0.00 0.00
Total Wasteland 0.51 2.34 1.30 4.32 0.86 3.17 1.00 4.23 0.66 4.03 0.32 3.78 0.55 3.06 0.37 4.48 0.37 3.09 1.75 13.09 7.69 4.30
Reservoir, nallah, ponds 0.18 0.83 0.13 0.43 0.46 1.71 0.06 0.25 0.01 0.06 0.06 0.71 0.14 0.78 0.01 0.12 0.02 0.17 0.06 0.45 1.13 0.63
Total Waterbodies 0.18 0.83 0.13 0.43 0.46 1.71 0.06 0.25 0.01 0.06 0.06 0.71 0.14 0.78 0.01 0.12 0.02 0.17 0.06 0.45 1.13 0.63
Crop Lands 1.15 5.30 0.07 0.23 0.04 0.15 0.14 0.59 0.01 0.06 0.00 0.00 0.00 0.00 0.08 0.97 0.09 0.75 0.13 0.97 1.71 0.96
Fallow Lands 0.41 1.88 0.15 0.50 0.01 0.04 0.25 1.06 0.01 0.06 0.00 0.00 0.00 0.00 0.03 0.36 0.02 0.17 1.44 10.75 2.32 1.30
Total Agriculture 1.56 7.18 0.22 0.73 0.05 0.19 0.39 1.65 0.02 0.12 0.00 0.00 0.00 0.00 0.11 1.33 0.11 0.92 1.57 11.72 4.03 2.25
Urban Settlement 0.39 1.79 3.03 10.06 1.76 6.51 0.03 0.13 0.82 5.00 0.04 0.47 0.47 2.61 0.53 6.41 0.14 1.17 0.01 0.07 7.22 4.03
Rural Settlement 0.19 0.87 0.00 0.00 0.05 0.18 0.00 0.00 0.00 0.00 0.00 0.00 0.06 0.33 0.00 0.00 0.00 0.00 0.00 0.00 0.30 0.17
Industrial Settlement 0.17 0.78 0.42 1.39 0.31 1.15 0.27 1.14 0.35 2.14 0.17 2.00 0.36 2.00 0.11 1.33 0.10 0.84 0.24 1.79 2.50 1.40
Total Settlement 0.75 5.80 3.45 11.45 2.12 7.84 0.30 1.27 1.17 7.14 0.21 2.47 0.89 4.94 0.64 7.74 0.24 2.01 0.25 1.86 10.02 5.60
Grand Total 21.75 100.00 30.11 100.00 27.04 100.00 23.62 100.00 16.39 100.00 8.51 100.00 17.98 100.00 8.27 100.00 11.97 100.00 13.39 100.00 179.03 100.00
SC
R
UB
S
TABLE -2
Status of Land Use / Reclamation in OC Mines producing more than 5 mcm (Coal+OB) annually of Northern Coalfields Ltd. based on Satellite data of the Year 2021(Area in Sq Km)
AMLOHRI NIGAHI JAYANT DUDHICHUA KHADIA KRISHNASHILA BINA KAKRI JHINGURDAH BLOCK-B TOTAL
FO
RE
ST
SA
GR
ICU
LT
UR
ES
ET
TLE
ME
NT
SS
FP
LA
NT
AT
ION
AR
EA
UN
DE
R A
CT
IVE
MIN
ING
TE
CH
N.
RE
CLA
IMA
TIO
NW
AS
TE
LA
ND
SW
AT
ER
BO
DI
ES
CMPDI
Job No 561410027 110
Plate 7.1
CMPDI
Job No 561410027 111
Plate 7.2
CMPDI
Job No 561410027 112
Plate 7.3
CMPDI
Job No 561410027 113
Plate 7.4
CMPDI
Job No 561410027 114
Plate 7.5
CMPDI
Job No 561410027 115
Plate 7.6
CMPDI
Job No 561410027 116
Plate 7.7
CMPDI
Job No 561410027 117
Plate 7.8
CMPDI
Job No 561410027 118
Plate 7.9
CMPDI
Job No 561410027 119
Plate 7.10
CMPDI
Job No 561410027 120
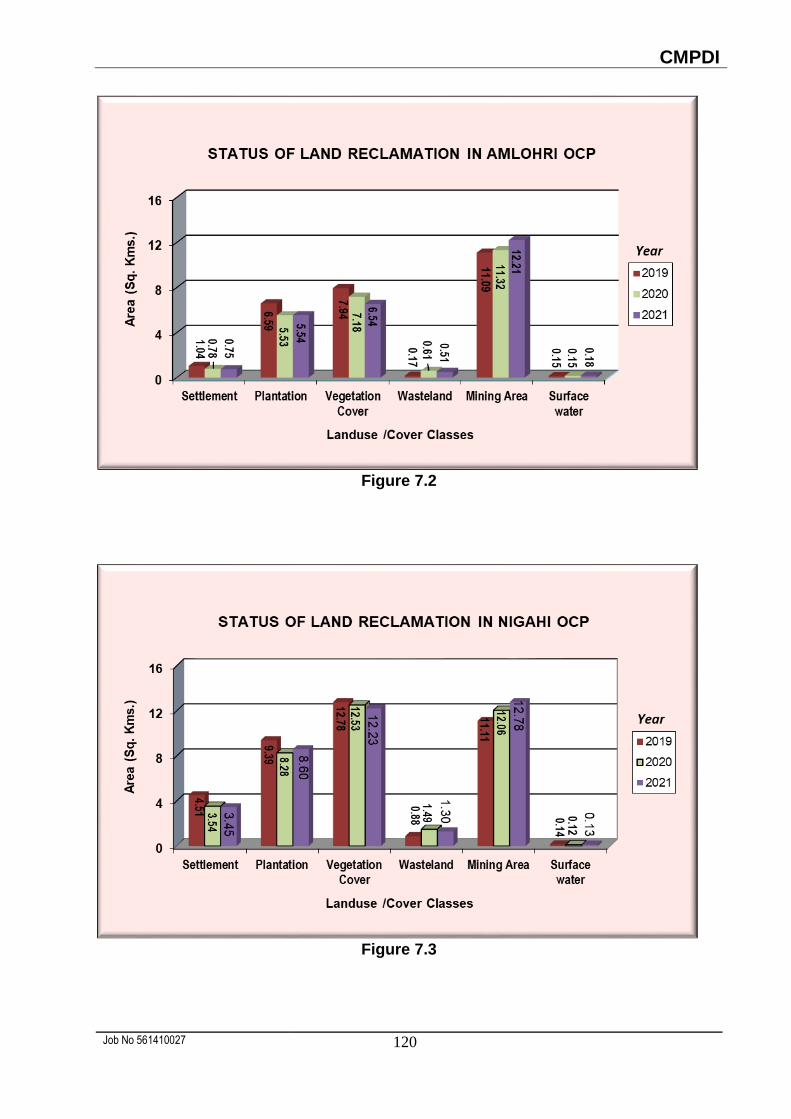
Figure 7.2
Figure 7.3
CMPDI
Job No 561410027 121
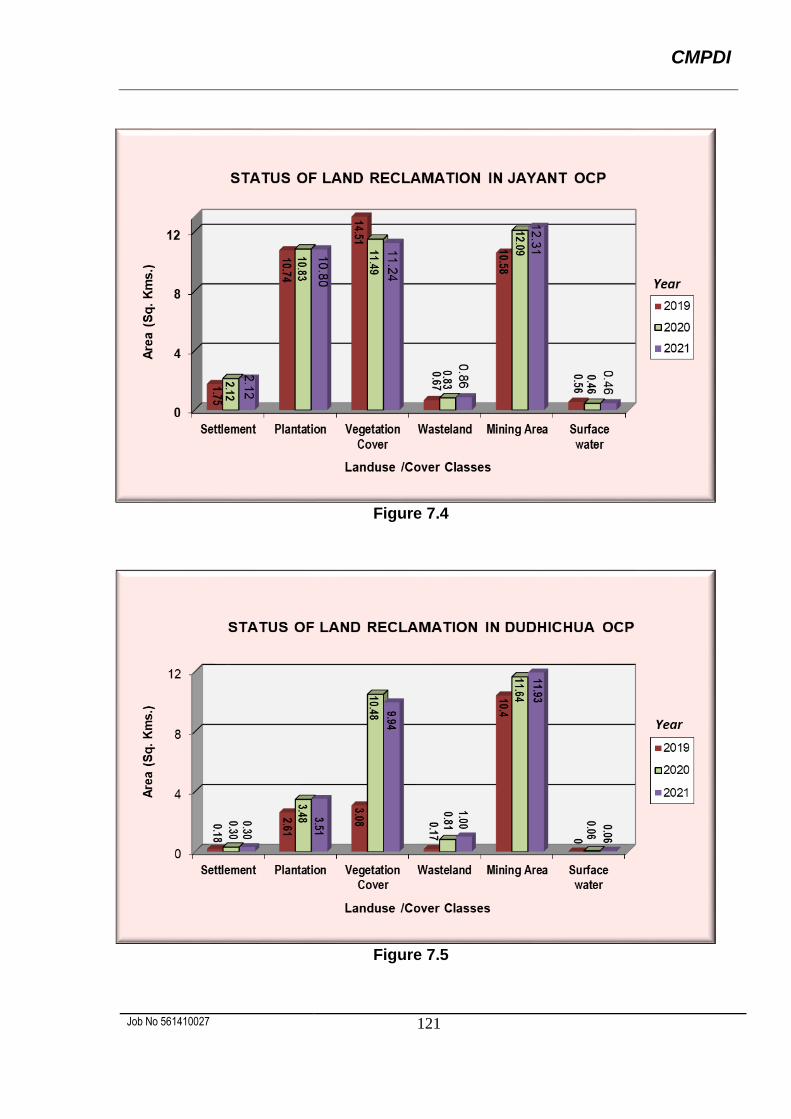
Figure 7.4
Figure 7.5
CMPDI
Job No 561410027 122
Figure 7.6
Figure 7.7

CMPDI
Job No 561410027 123
Figure 7.8
Figure 7.9
CMPDI
Job No 561410027 124
Figure 7.10
Figure 7.11
CMPDI
Job No 561410027 125
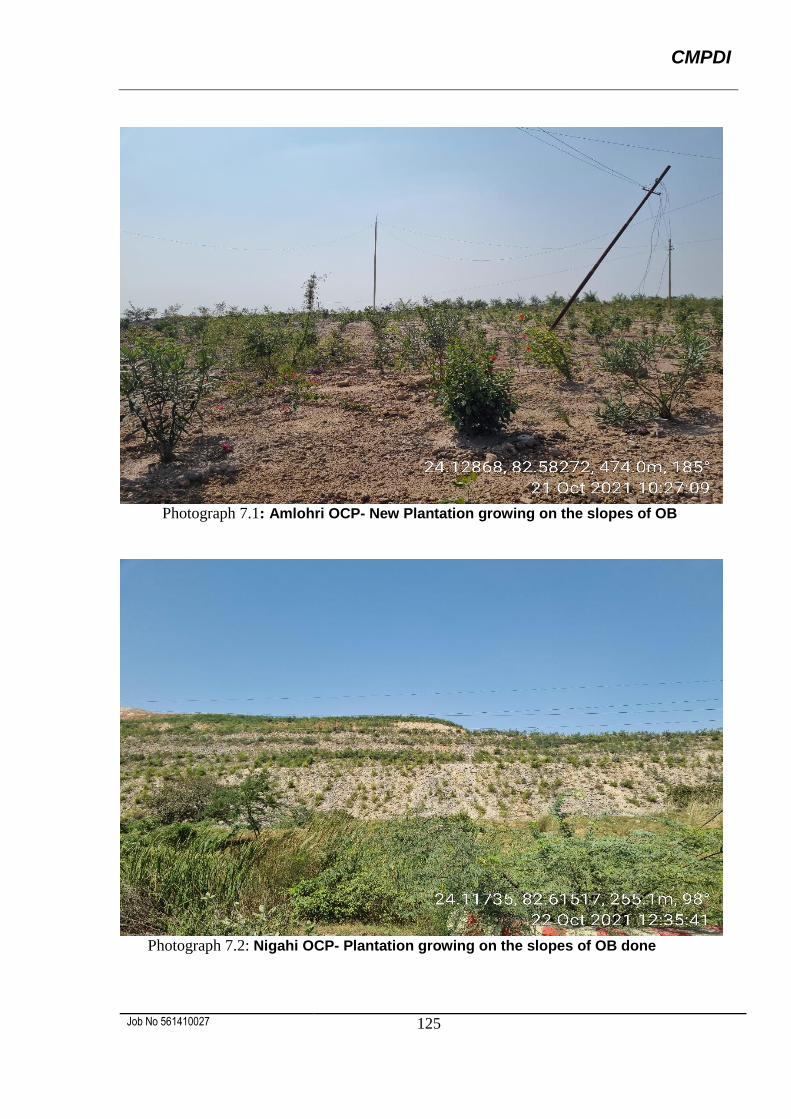
Photograph 7.1: Amlohri OCP- New Plantation growing on the slopes of OB
Photograph 7.2: Nigahi OCP- Plantation growing on the slopes of OB done
CMPDI
Job No 561410027 126
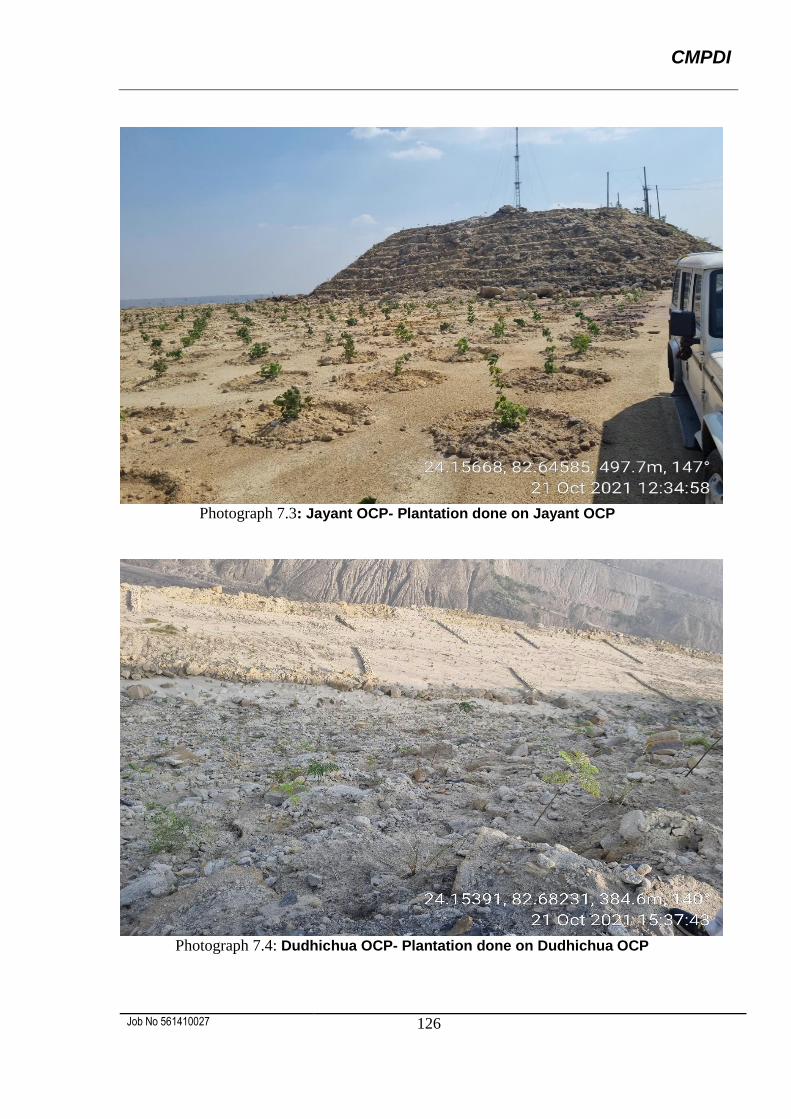
Photograph 7.3: Jayant OCP- Plantation done on Jayant OCP
Photograph 7.4: Dudhichua OCP- Plantation done on Dudhichua OCP
CMPDI
Job No 561410027 127
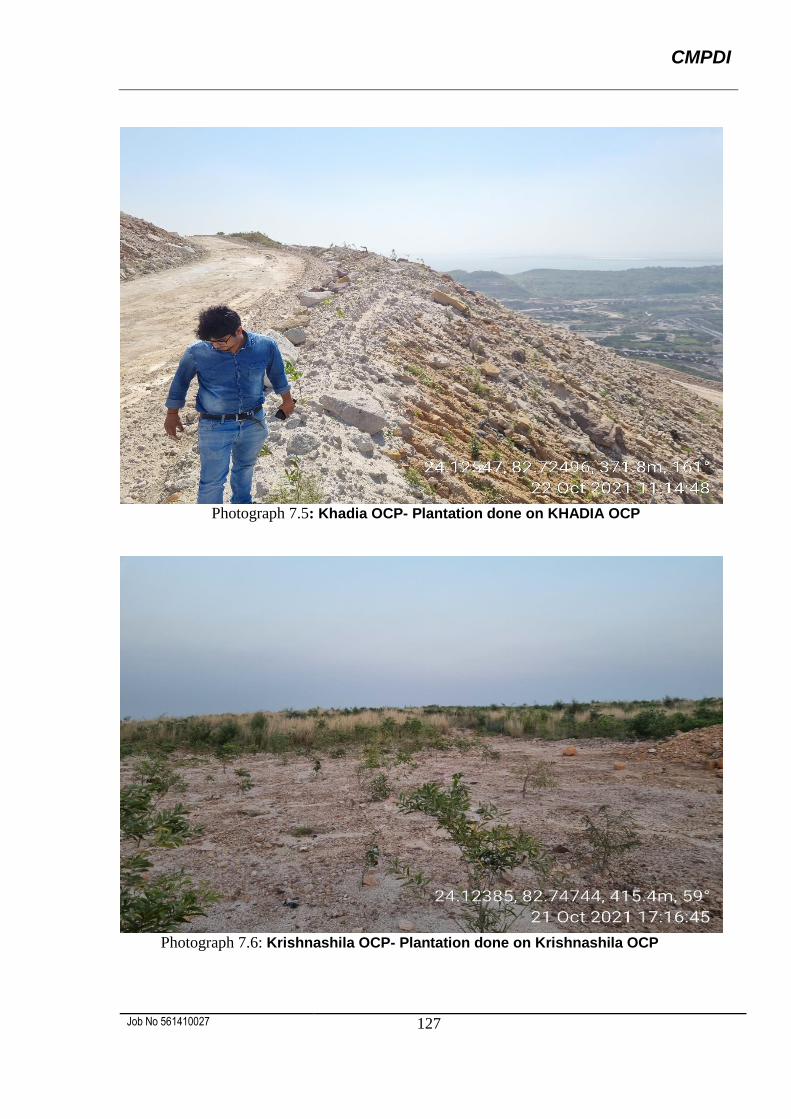
Photograph 7.5: Khadia OCP- Plantation done on KHADIA OCP
Photograph 7.6: Krishnashila OCP- Plantation done on Krishnashila OCP
CMPDI
Job No 561410027 128
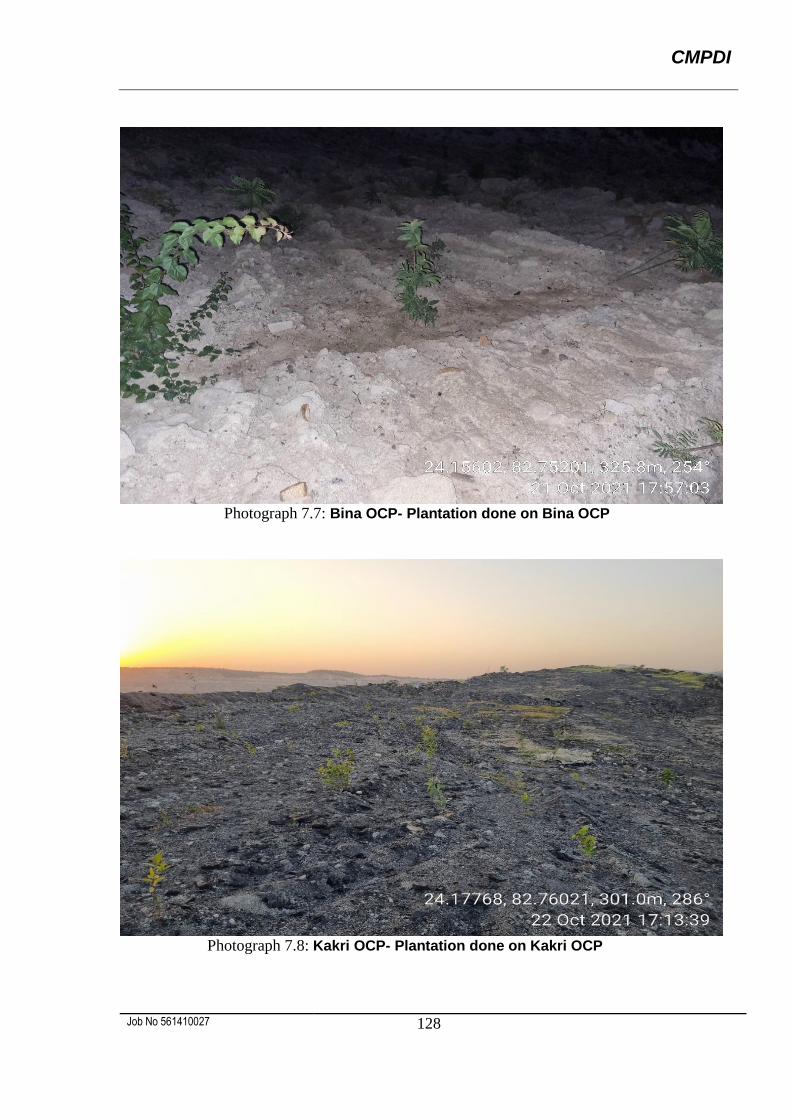
Photograph 7.7: Bina OCP- Plantation done on Bina OCP
Photograph 7.8: Kakri OCP- Plantation done on Kakri OCP
CMPDI
Job No 561410027 129
Photograph 7.9: Additional dumping on Planted area at Jhingurdah OCP
Photograph 7.10: Block-B OCP- Plantation done on Block-B OCP
MAHANADI COALFIELDS LIMITED
CMPDI
Job No 561410027/(MCL) 131
8.0 Land Reclamation Status in Mahanadi Coalfields Limited
8.1 Following Sixteen (16) opencast projects of MCL producing more than 5 million cubic
meter and more (Coal + OB) were taken up for land reclamation monitoring based on
satellite data of the year 2021.
Ananta
Balram
Lingaraj
Bharatpur
Bhubaneswari
Jagannath
Hingula
Kaniha
Belpahar
Lakhanpur
Samleswari
Lajkura
Siarmal
Basundhara West Extension
Garjanbahal
Kulda
8.2 Project wise Land Reclamation status in MCL for the year 2021 is given in Table 8.1
and also shown graphically in Fig 8.1A and 8.1B. Area statistics of different land use
/ cover classes present in the mine leasehold of the above projects for the year 2021-
22 are shown in the Table -8.2 (in two parts). Land use maps derived from satellite
data are shown in Plate 8.1 – 8.16. Year wise changes in the different land use
classes based on satellite data are depicted in Bar Charts in Fig. 8.2–8.17 for the last
three years only.
CMPDI
Job No 561410027/(MCL) 132
8.3 From the year 2021-2022 Kulda and Kaniha OCP have been considered in more than
5mcm (Coal+OB) category and will be monitored each year. Previously they were in
less than 5 mcm (Coal+OB) category and were monitored in an interval of 3 years.
The leasehold boundaries of Lingaraj and Kaniha projects have been modified as
provided by respective projects (Refer Table 8.1).
8.4 Study reveals that out of total 59.02 Km2 excavated area; 35.53 Km2 area (60.20%)
is under reclamation. Out of which 8.24 Km2 (13.96%) area has been re-vegetated
and 27.29 Km2 (46.24%) area is under backfilling. (under Technical Reclamation).
8.5 Total Area under active mining has increased from 20.39 (Yr. 2020) to 23.49 (Yr.
2021). Though in Belpahar project it has reduced due to increase in area under
backfilling. Area under backfilling in Balram project has been reduced marginally due
to increase in mine water.
8.6 Analysis of satellite data indicates that plantation on backfill has reduced in Balram,
Bharatpur, Hingula, Belpahar and Samleswari because of fresh backfilling activities.
8.7 Plantation on External OB dump has marginally reduced in Belpahar and Samleswari
OCP due to construction of silo and road. Area of Social forestry has reduced
marginally in some projects due to mine advancement.
8.8 Study also reveals that area under barren backfilling (Technical Reclamation) has
increased from 25.26 Km2 in 2020 to 27.29 Km2 in 2021.
8.9 It was also observed that overall total area under plantation (Green Cover) has
increased from 15.55 Km2 in 2020 to 15.61 Km2 in 2021 (Refer all Total in Table 8.1).
Green Cover has reduced in some projects of MCL due to change in mine boundary
and reduction in plantation and social forestry in the leasehold areas resulted from
mining activities.
CMPDI
Job No 561410027/(MCL) 133
8.10 On comparing the status of land reclamation for the year 2021 with respect to the
year 2020 in different projects, it is evident that area of land reclamation has
increased from 33.63 Km2 (Yr. 2020) to 35.53 Km2 (Yr.2021).
8.11 In Kulda OCP and Bharatpur OCP plantation has been done on internal OB dump but
because of low height of the plants its signature is not available/visible in satellite image
of 2021.
8.12 Out of 16 projects of MCL, Jagannath OC ranks on top for land reclamation (74.07%)
followed by Samleswari OC (73.99%) and Balram OC (73.18%).
8.13 The Kaniha and Kulda OC projects were previously monitored under Less than 5mcm
(Coal+OB) per annum category at an interval of three years. The previous cycle of land
reclamation monitoring of Kaniha OCP was done in 2018-19 and for Kulda OCP the
previous cycle of monitoring was 2020-21.
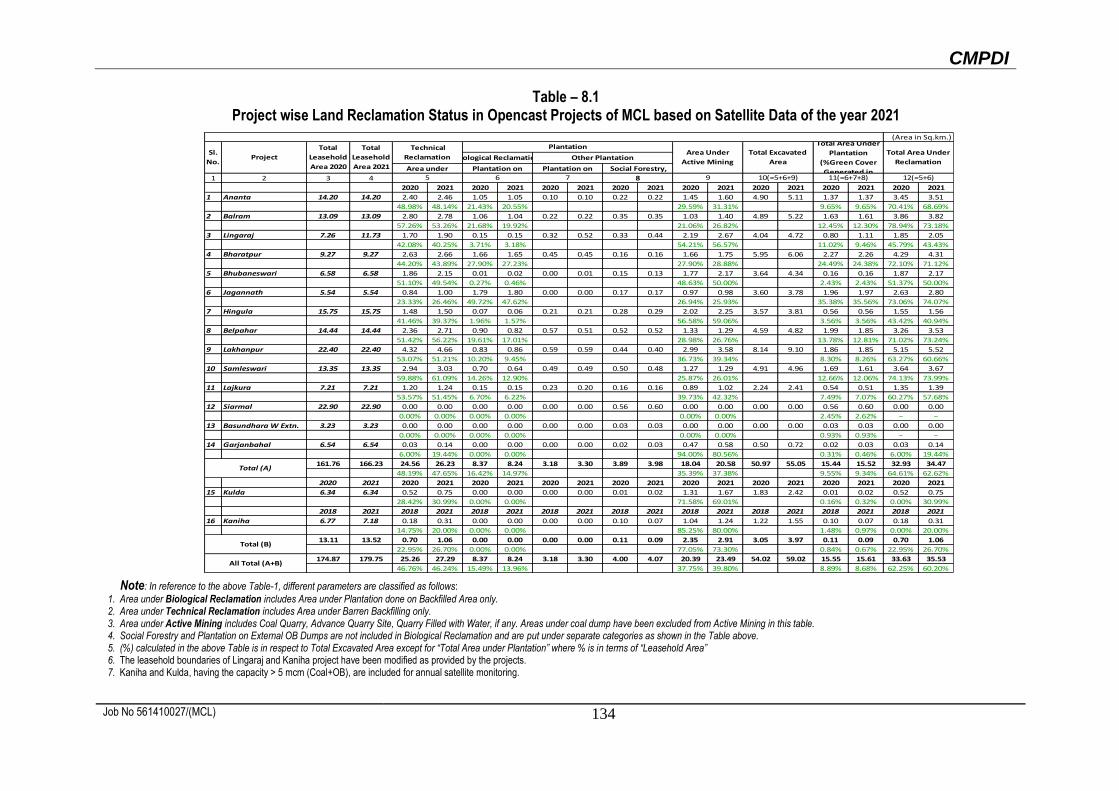
CMPDI
Job No 561410027/(MCL) 134
Table – 8.1 Project wise Land Reclamation Status in Opencast Projects of MCL based on Satellite Data of the year 2021
Note: In reference to the above Table-1, different parameters are classified as follows:
1. Area under Biological Reclamation includes Area under Plantation done on Backfilled Area only. 2. Area under Technical Reclamation includes Area under Barren Backfilling only. 3. Area under Active Mining includes Coal Quarry, Advance Quarry Site, Quarry Filled with Water, if any. Areas under coal dump have been excluded from Active Mining in this table. 4. Social Forestry and Plantation on External OB Dumps are not included in Biological Reclamation and are put under separate categories as shown in the Table above. 5. (%) calculated in the above Table is in respect to Total Excavated Area except for “Total Area under Plantation” where % is in terms of “Leasehold Area” 6. The leasehold boundaries of Lingaraj and Kaniha project have been modified as provided by the projects. 7. Kaniha and Kulda, having the capacity > 5 mcm (Coal+OB), are included for annual satellite monitoring.
1 2 3 4
2020 2021 2020 2021 2020 2021 2020 2021 2020 2021 2020 2021 2020 2021 2020 2021
1 Ananta 14.20 14.20 2.40 2.46 1.05 1.05 0.10 0.10 0.22 0.22 1.45 1.60 4.90 5.11 1.37 1.37 3.45 3.51
48.98% 48.14% 21.43% 20.55% 29.59% 31.31% 9.65% 9.65% 70.41% 68.69%
2 Balram 13.09 13.09 2.80 2.78 1.06 1.04 0.22 0.22 0.35 0.35 1.03 1.40 4.89 5.22 1.63 1.61 3.86 3.82
57.26% 53.26% 21.68% 19.92% 21.06% 26.82% 12.45% 12.30% 78.94% 73.18%
3 Lingaraj 7.26 11.73 1.70 1.90 0.15 0.15 0.32 0.52 0.33 0.44 2.19 2.67 4.04 4.72 0.80 1.11 1.85 2.05
42.08% 40.25% 3.71% 3.18% 54.21% 56.57% 11.02% 9.46% 45.79% 43.43%
4 Bharatpur 9.27 9.27 2.63 2.66 1.66 1.65 0.45 0.45 0.16 0.16 1.66 1.75 5.95 6.06 2.27 2.26 4.29 4.31
44.20% 43.89% 27.90% 27.23% 27.90% 28.88% 24.49% 24.38% 72.10% 71.12%
5 Bhubaneswari 6.58 6.58 1.86 2.15 0.01 0.02 0.00 0.01 0.15 0.13 1.77 2.17 3.64 4.34 0.16 0.16 1.87 2.17
51.10% 49.54% 0.27% 0.46% 48.63% 50.00% 2.43% 2.43% 51.37% 50.00%
6 Jagannath 5.54 5.54 0.84 1.00 1.79 1.80 0.00 0.00 0.17 0.17 0.97 0.98 3.60 3.78 1.96 1.97 2.63 2.80
23.33% 26.46% 49.72% 47.62% 26.94% 25.93% 35.38% 35.56% 73.06% 74.07%
7 Hingula 15.75 15.75 1.48 1.50 0.07 0.06 0.21 0.21 0.28 0.29 2.02 2.25 3.57 3.81 0.56 0.56 1.55 1.56
41.46% 39.37% 1.96% 1.57% 56.58% 59.06% 3.56% 3.56% 43.42% 40.94%
8 Belpahar 14.44 14.44 2.36 2.71 0.90 0.82 0.57 0.51 0.52 0.52 1.33 1.29 4.59 4.82 1.99 1.85 3.26 3.53
51.42% 56.22% 19.61% 17.01% 28.98% 26.76% 13.78% 12.81% 71.02% 73.24%
9 Lakhanpur 22.40 22.40 4.32 4.66 0.83 0.86 0.59 0.59 0.44 0.40 2.99 3.58 8.14 9.10 1.86 1.85 5.15 5.52
53.07% 51.21% 10.20% 9.45% 36.73% 39.34% 8.30% 8.26% 63.27% 60.66%
10 Samleswari 13.35 13.35 2.94 3.03 0.70 0.64 0.49 0.49 0.50 0.48 1.27 1.29 4.91 4.96 1.69 1.61 3.64 3.67
59.88% 61.09% 14.26% 12.90% 25.87% 26.01% 12.66% 12.06% 74.13% 73.99%
11 Lajkura 7.21 7.21 1.20 1.24 0.15 0.15 0.23 0.20 0.16 0.16 0.89 1.02 2.24 2.41 0.54 0.51 1.35 1.39
53.57% 51.45% 6.70% 6.22% 39.73% 42.32% 7.49% 7.07% 60.27% 57.68%
12 Siarmal 22.90 22.90 0.00 0.00 0.00 0.00 0.00 0.00 0.56 0.60 0.00 0.00 0.00 0.00 0.56 0.60 0.00 0.00
0.00% 0.00% 0.00% 0.00% 0.00% 0.00% 2.45% 2.62% − −
13 Basundhara W Extn. 3.23 3.23 0.00 0.00 0.00 0.00 0.00 0.00 0.03 0.03 0.00 0.00 0.00 0.00 0.03 0.03 0.00 0.00
0.00% 0.00% 0.00% 0.00% 0.00% 0.00% 0.93% 0.93% − −
14 Garjanbahal 6.54 6.54 0.03 0.14 0.00 0.00 0.00 0.00 0.02 0.03 0.47 0.58 0.50 0.72 0.02 0.03 0.03 0.14
6.00% 19.44% 0.00% 0.00% 94.00% 80.56% 0.31% 0.46% 6.00% 19.44%
161.76 166.23 24.56 26.23 8.37 8.24 3.18 3.30 3.89 3.98 18.04 20.58 50.97 55.05 15.44 15.52 32.93 34.47
48.19% 47.65% 16.42% 14.97% 35.39% 37.38% 9.55% 9.34% 64.61% 62.62%
2020 2021 2020 2021 2020 2021 2020 2021 2020 2021 2020 2021 2020 2021 2020 2021 2020 2021
15 Kulda 6.34 6.34 0.52 0.75 0.00 0.00 0.00 0.00 0.01 0.02 1.31 1.67 1.83 2.42 0.01 0.02 0.52 0.75
28.42% 30.99% 0.00% 0.00% 71.58% 69.01% 0.16% 0.32% 0.00% 30.99%
2018 2021 2018 2021 2018 2021 2018 2021 2018 2021 2018 2021 2018 2021 2018 2021 2018 2021
16 Kaniha 6.77 7.18 0.18 0.31 0.00 0.00 0.00 0.00 0.10 0.07 1.04 1.24 1.22 1.55 0.10 0.07 0.18 0.31
14.75% 20.00% 0.00% 0.00% 85.25% 80.00% 1.48% 0.97% 0.00% 20.00%
13.11 13.52 0.70 1.06 0.00 0.00 0.00 0.00 0.11 0.09 2.35 2.91 3.05 3.97 0.11 0.09 0.70 1.06
22.95% 26.70% 0.00% 0.00% 77.05% 73.30% 0.84% 0.67% 22.95% 26.70%
174.87 179.75 25.26 27.29 8.37 8.24 3.18 3.30 4.00 4.07 20.39 23.49 54.02 59.02 15.55 15.61 33.63 35.53
46.76% 46.24% 15.49% 13.96% 37.75% 39.80% 8.89% 8.68% 62.25% 60.20%
11(=6+7+8) 12(=5+6)5 6 7 8 9 10(=5+6+9)
Plantation on Social Forestry,
Total (B)
All Total (A+B)
Total (A)
Total Area Under
Plantation
(%Green Cover
Generated in
Total Area Under
Reclamation
(Area in Sq.km.)
Sl.
No.Project
Total
Leasehold
Area 2020
Total
Leasehold
Area 2021
Technical
Reclamation
PlantationArea Under
Active Mining
Total Excavated
Area Biological Reclamation Other Plantation
Area under Plantation on
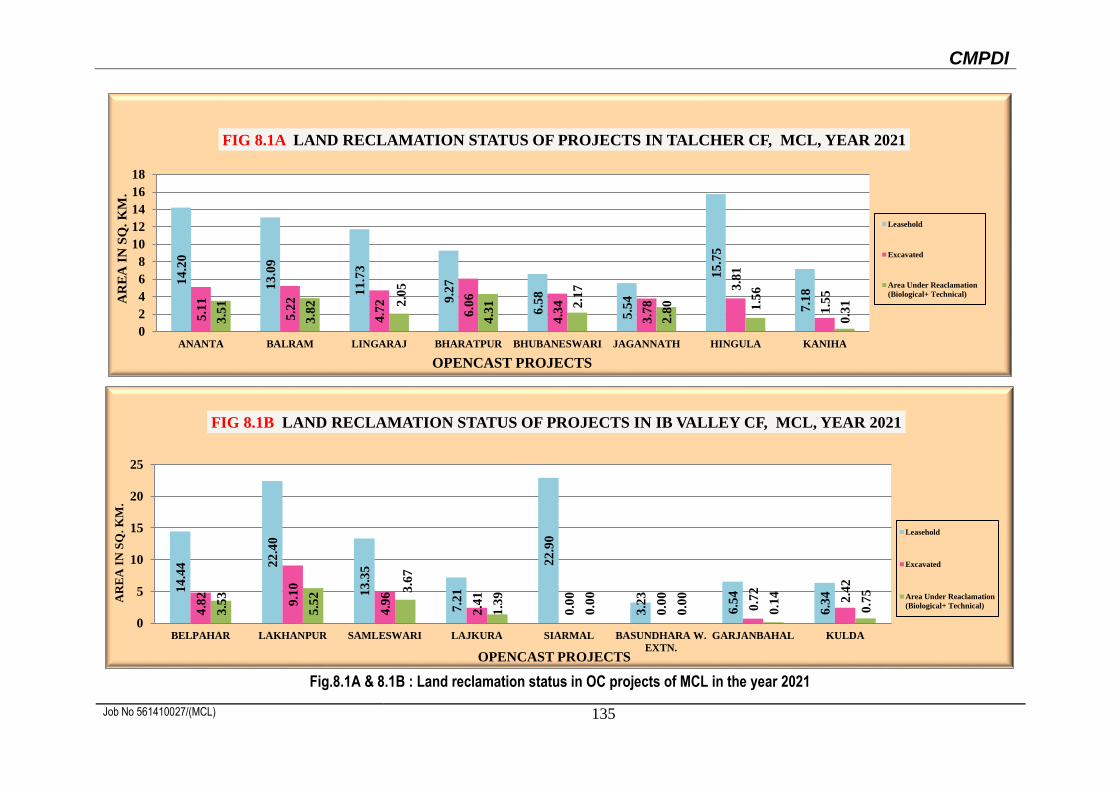
CMPDI
Job No 561410027/(MCL) 135
Fig.8.1A & 8.1B : Land reclamation status in OC projects of MCL in the year 2021
14
.20
13
.09
11
.73
9.2
7
6.5
8
5.5
4
15
.75
7.1
8
5.1
1
5.2
2
4.7
2
6.0
6
4.3
4
3.7
8
3.8
1
1.5
5
3.5
1
3.8
2 2.0
5
4.3
1 2.1
7
2.8
0 1.5
6
0.3
1
0
2
4
6
8
10
12
14
16
18
ANANTA BALRAM LINGARAJ BHARATPUR BHUBANESWARI JAGANNATH HINGULA KANIHA
AR
EA
IN
SQ
. K
M.
OPENCAST PROJECTS
FIG 8.1A LAND RECLAMATION STATUS OF PROJECTS IN TALCHER CF, MCL, YEAR 2021
Leasehold
Excavated
Area Under Reaclamation
(Biological+ Technical)
14
.44 2
2.4
0
13
.35
7.2
1
22
.90
3.2
3
6.5
4
6.3
4
4.8
2
9.1
0
4.9
6
2.4
1
0.0
0
0.0
0
0.7
2
2.4
2
3.5
3
5.5
2 3.6
7
1.3
9
0.0
0
0.0
0
0.1
4
0.7
5
0
5
10
15
20
25
BELPAHAR LAKHANPUR SAMLESWARI LAJKURA SIARMAL BASUNDHARA W.
EXTN.
GARJANBAHAL KULDA
AR
EA
IN
SQ
. K
M.
OPENCAST PROJECTS
FIG 8.1B LAND RECLAMATION STATUS OF PROJECTS IN IB VALLEY CF, MCL, YEAR 2021
Leasehold
Excavated
Area Under Reaclamation
(Biological+ Technical)
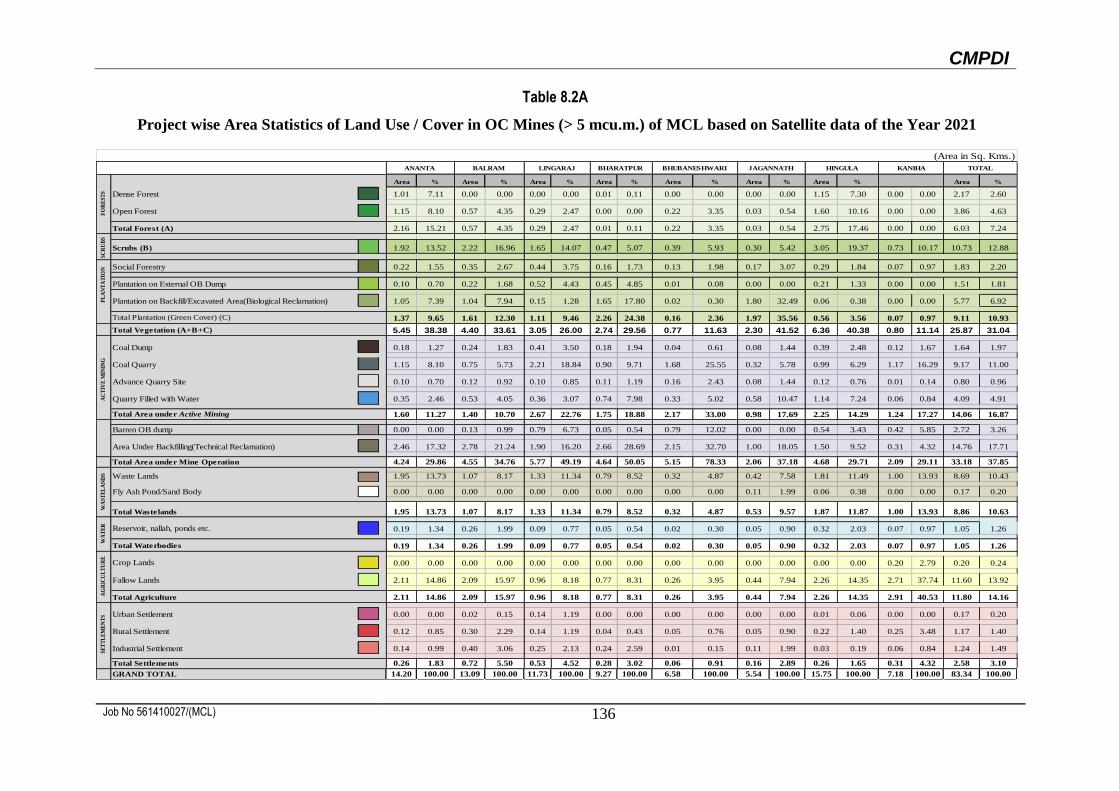
CMPDI
Job No 561410027/(MCL) 136
Table 8.2A
Project wise Area Statistics of Land Use / Cover in OC Mines (> 5 mcu.m.) of MCL based on Satellite data of the Year 2021
Area % Area % Area % Area % Area % Area % Area % Area %
Dense Forest 1.01 7.11 0.00 0.00 0.00 0.00 0.01 0.11 0.00 0.00 0.00 0.00 1.15 7.30 0.00 0.00 2.17 2.60
Open Forest 1.15 8.10 0.57 4.35 0.29 2.47 0.00 0.00 0.22 3.35 0.03 0.54 1.60 10.16 0.00 0.00 3.86 4.63
Total Forest (A) 2.16 15.21 0.57 4.35 0.29 2.47 0.01 0.11 0.22 3.35 0.03 0.54 2.75 17.46 0.00 0.00 6.03 7.24
Scrubs (B) 1.92 13.52 2.22 16.96 1.65 14.07 0.47 5.07 0.39 5.93 0.30 5.42 3.05 19.37 0.73 10.17 10.73 12.88
Social Forestry 0.22 1.55 0.35 2.67 0.44 3.75 0.16 1.73 0.13 1.98 0.17 3.07 0.29 1.84 0.07 0.97 1.83 2.20
Plantation on External OB Dump 0.10 0.70 0.22 1.68 0.52 4.43 0.45 4.85 0.01 0.08 0.00 0.00 0.21 1.33 0.00 0.00 1.51 1.81
Plantation on Backfill/Excavated Area(Biological Reclamation) 1.05 7.39 1.04 7.94 0.15 1.28 1.65 17.80 0.02 0.30 1.80 32.49 0.06 0.38 0.00 0.00 5.77 6.92
Total Plantation (Green Cover) (C) 1.37 9.65 1.61 12.30 1.11 9.46 2.26 24.38 0.16 2.36 1.97 35.56 0.56 3.56 0.07 0.97 9.11 10.93
Total Vegetation (A+B+C) 5.45 38.38 4.40 33.61 3.05 26.00 2.74 29.56 0.77 11.63 2.30 41.52 6.36 40.38 0.80 11.14 25.87 31.04
Coal Dump 0.18 1.27 0.24 1.83 0.41 3.50 0.18 1.94 0.04 0.61 0.08 1.44 0.39 2.48 0.12 1.67 1.64 1.97
Coal Quarry 1.15 8.10 0.75 5.73 2.21 18.84 0.90 9.71 1.68 25.55 0.32 5.78 0.99 6.29 1.17 16.29 9.17 11.00
Advance Quarry Site 0.10 0.70 0.12 0.92 0.10 0.85 0.11 1.19 0.16 2.43 0.08 1.44 0.12 0.76 0.01 0.14 0.80 0.96
Quarry Filled with Water 0.35 2.46 0.53 4.05 0.36 3.07 0.74 7.98 0.33 5.02 0.58 10.47 1.14 7.24 0.06 0.84 4.09 4.91
Total Area under Active Mining 1.60 11.27 1.40 10.70 2.67 22.76 1.75 18.88 2.17 33.00 0.98 17.69 2.25 14.29 1.24 17.27 14.06 16.87
Barren OB dump 0.00 0.00 0.13 0.99 0.79 6.73 0.05 0.54 0.79 12.02 0.00 0.00 0.54 3.43 0.42 5.85 2.72 3.26
Area Under Backfilling(Technical Reclamation) 2.46 17.32 2.78 21.24 1.90 16.20 2.66 28.69 2.15 32.70 1.00 18.05 1.50 9.52 0.31 4.32 14.76 17.71
Total Area under Mine Operation 4.24 29.86 4.55 34.76 5.77 49.19 4.64 50.05 5.15 78.33 2.06 37.18 4.68 29.71 2.09 29.11 33.18 37.85
Waste Lands 1.95 13.73 1.07 8.17 1.33 11.34 0.79 8.52 0.32 4.87 0.42 7.58 1.81 11.49 1.00 13.93 8.69 10.43
Fly Ash Pond/Sand Body 0.00 0.00 0.00 0.00 0.00 0.00 0.00 0.00 0.00 0.00 0.11 1.99 0.06 0.38 0.00 0.00 0.17 0.20
Total Wastelands 1.95 13.73 1.07 8.17 1.33 11.34 0.79 8.52 0.32 4.87 0.53 9.57 1.87 11.87 1.00 13.93 8.86 10.63
Reservoir, nallah, ponds etc. 0.19 1.34 0.26 1.99 0.09 0.77 0.05 0.54 0.02 0.30 0.05 0.90 0.32 2.03 0.07 0.97 1.05 1.26
Total Waterbodies 0.19 1.34 0.26 1.99 0.09 0.77 0.05 0.54 0.02 0.30 0.05 0.90 0.32 2.03 0.07 0.97 1.05 1.26
Crop Lands 0.00 0.00 0.00 0.00 0.00 0.00 0.00 0.00 0.00 0.00 0.00 0.00 0.00 0.00 0.20 2.79 0.20 0.24
Fallow Lands 2.11 14.86 2.09 15.97 0.96 8.18 0.77 8.31 0.26 3.95 0.44 7.94 2.26 14.35 2.71 37.74 11.60 13.92
Total Agriculture 2.11 14.86 2.09 15.97 0.96 8.18 0.77 8.31 0.26 3.95 0.44 7.94 2.26 14.35 2.91 40.53 11.80 14.16
Urban Settlement 0.00 0.00 0.02 0.15 0.14 1.19 0.00 0.00 0.00 0.00 0.00 0.00 0.01 0.06 0.00 0.00 0.17 0.20
Rural Settlement 0.12 0.85 0.30 2.29 0.14 1.19 0.04 0.43 0.05 0.76 0.05 0.90 0.22 1.40 0.25 3.48 1.17 1.40
Industrial Settlement 0.14 0.99 0.40 3.06 0.25 2.13 0.24 2.59 0.01 0.15 0.11 1.99 0.03 0.19 0.06 0.84 1.24 1.49
Total Settlements 0.26 1.83 0.72 5.50 0.53 4.52 0.28 3.02 0.06 0.91 0.16 2.89 0.26 1.65 0.31 4.32 2.58 3.10
GRAND TOTAL 14.20 100.00 13.09 100.00 11.73 100.00 9.27 100.00 6.58 100.00 5.54 100.00 15.75 100.00 7.18 100.00 83.34 100.00
TOTAL
(Area in Sq. Kms.)
ANANTA BALRAM LINGARAJ BHARATPUR BHUBANESHWARI JAGANNATH HINGULA KANIHA
WA
TE
RA
GR
ICU
LT
UR
ES
ET
TL
EM
EN
TS
FO
RE
ST
SS
CR
UB
SP
LA
NT
AT
ION
AC
TIV
E M
ININ
GW
AS
TE
LA
ND
S
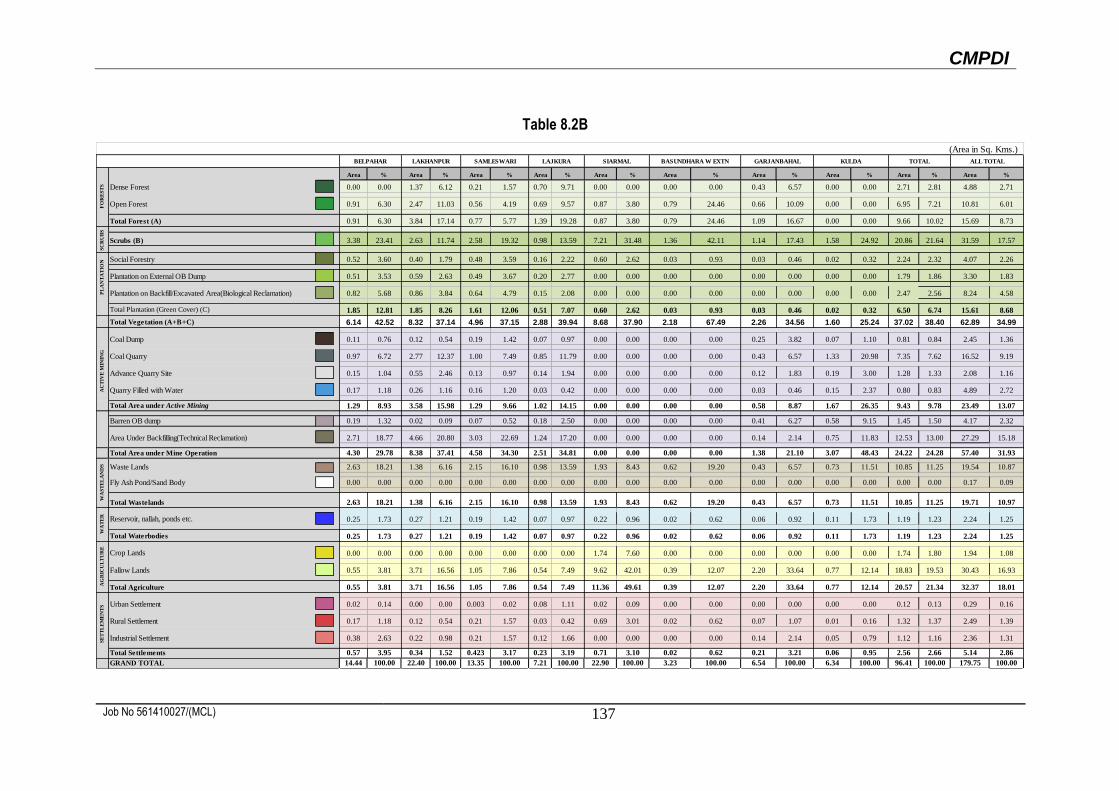
CMPDI
Job No 561410027/(MCL) 137
Table 8.2B
Area % Area % Area % Area % Area % Area % Area % Area % Area % Area %
Dense Forest 0.00 0.00 1.37 6.12 0.21 1.57 0.70 9.71 0.00 0.00 0.00 0.00 0.43 6.57 0.00 0.00 2.71 2.81 4.88 2.71
Open Forest 0.91 6.30 2.47 11.03 0.56 4.19 0.69 9.57 0.87 3.80 0.79 24.46 0.66 10.09 0.00 0.00 6.95 7.21 10.81 6.01
Total Forest (A) 0.91 6.30 3.84 17.14 0.77 5.77 1.39 19.28 0.87 3.80 0.79 24.46 1.09 16.67 0.00 0.00 9.66 10.02 15.69 8.73
Scrubs (B) 3.38 23.41 2.63 11.74 2.58 19.32 0.98 13.59 7.21 31.48 1.36 42.11 1.14 17.43 1.58 24.92 20.86 21.64 31.59 17.57
Social Forestry 0.52 3.60 0.40 1.79 0.48 3.59 0.16 2.22 0.60 2.62 0.03 0.93 0.03 0.46 0.02 0.32 2.24 2.32 4.07 2.26
Plantation on External OB Dump 0.51 3.53 0.59 2.63 0.49 3.67 0.20 2.77 0.00 0.00 0.00 0.00 0.00 0.00 0.00 0.00 1.79 1.86 3.30 1.83
Plantation on Backfill/Excavated Area(Biological Reclamation) 0.82 5.68 0.86 3.84 0.64 4.79 0.15 2.08 0.00 0.00 0.00 0.00 0.00 0.00 0.00 0.00 2.47 2.56 8.24 4.58
Total Plantation (Green Cover) (C) 1.85 12.81 1.85 8.26 1.61 12.06 0.51 7.07 0.60 2.62 0.03 0.93 0.03 0.46 0.02 0.32 6.50 6.74 15.61 8.68
Total Vegetation (A+B+C) 6.14 42.52 8.32 37.14 4.96 37.15 2.88 39.94 8.68 37.90 2.18 67.49 2.26 34.56 1.60 25.24 37.02 38.40 62.89 34.99
Coal Dump 0.11 0.76 0.12 0.54 0.19 1.42 0.07 0.97 0.00 0.00 0.00 0.00 0.25 3.82 0.07 1.10 0.81 0.84 2.45 1.36
Coal Quarry 0.97 6.72 2.77 12.37 1.00 7.49 0.85 11.79 0.00 0.00 0.00 0.00 0.43 6.57 1.33 20.98 7.35 7.62 16.52 9.19
Advance Quarry Site 0.15 1.04 0.55 2.46 0.13 0.97 0.14 1.94 0.00 0.00 0.00 0.00 0.12 1.83 0.19 3.00 1.28 1.33 2.08 1.16
Quarry Filled with Water 0.17 1.18 0.26 1.16 0.16 1.20 0.03 0.42 0.00 0.00 0.00 0.00 0.03 0.46 0.15 2.37 0.80 0.83 4.89 2.72
Total Area under Active Mining 1.29 8.93 3.58 15.98 1.29 9.66 1.02 14.15 0.00 0.00 0.00 0.00 0.58 8.87 1.67 26.35 9.43 9.78 23.49 13.07
Barren OB dump 0.19 1.32 0.02 0.09 0.07 0.52 0.18 2.50 0.00 0.00 0.00 0.00 0.41 6.27 0.58 9.15 1.45 1.50 4.17 2.32
Area Under Backfilling(Technical Reclamation) 2.71 18.77 4.66 20.80 3.03 22.69 1.24 17.20 0.00 0.00 0.00 0.00 0.14 2.14 0.75 11.83 12.53 13.00 27.29 15.18
Total Area under Mine Operation 4.30 29.78 8.38 37.41 4.58 34.30 2.51 34.81 0.00 0.00 0.00 0.00 1.38 21.10 3.07 48.43 24.22 24.28 57.40 31.93
Waste Lands 2.63 18.21 1.38 6.16 2.15 16.10 0.98 13.59 1.93 8.43 0.62 19.20 0.43 6.57 0.73 11.51 10.85 11.25 19.54 10.87
Fly Ash Pond/Sand Body 0.00 0.00 0.00 0.00 0.00 0.00 0.00 0.00 0.00 0.00 0.00 0.00 0.00 0.00 0.00 0.00 0.00 0.00 0.17 0.09
Total Wastelands 2.63 18.21 1.38 6.16 2.15 16.10 0.98 13.59 1.93 8.43 0.62 19.20 0.43 6.57 0.73 11.51 10.85 11.25 19.71 10.97
Reservoir, nallah, ponds etc. 0.25 1.73 0.27 1.21 0.19 1.42 0.07 0.97 0.22 0.96 0.02 0.62 0.06 0.92 0.11 1.73 1.19 1.23 2.24 1.25
Total Waterbodies 0.25 1.73 0.27 1.21 0.19 1.42 0.07 0.97 0.22 0.96 0.02 0.62 0.06 0.92 0.11 1.73 1.19 1.23 2.24 1.25
Crop Lands 0.00 0.00 0.00 0.00 0.00 0.00 0.00 0.00 1.74 7.60 0.00 0.00 0.00 0.00 0.00 0.00 1.74 1.80 1.94 1.08
Fallow Lands 0.55 3.81 3.71 16.56 1.05 7.86 0.54 7.49 9.62 42.01 0.39 12.07 2.20 33.64 0.77 12.14 18.83 19.53 30.43 16.93
Total Agriculture 0.55 3.81 3.71 16.56 1.05 7.86 0.54 7.49 11.36 49.61 0.39 12.07 2.20 33.64 0.77 12.14 20.57 21.34 32.37 18.01
Urban Settlement 0.02 0.14 0.00 0.00 0.003 0.02 0.08 1.11 0.02 0.09 0.00 0.00 0.00 0.00 0.00 0.00 0.12 0.13 0.29 0.16
Rural Settlement 0.17 1.18 0.12 0.54 0.21 1.57 0.03 0.42 0.69 3.01 0.02 0.62 0.07 1.07 0.01 0.16 1.32 1.37 2.49 1.39
Industrial Settlement 0.38 2.63 0.22 0.98 0.21 1.57 0.12 1.66 0.00 0.00 0.00 0.00 0.14 2.14 0.05 0.79 1.12 1.16 2.36 1.31
Total Settlements 0.57 3.95 0.34 1.52 0.423 3.17 0.23 3.19 0.71 3.10 0.02 0.62 0.21 3.21 0.06 0.95 2.56 2.66 5.14 2.86
GRAND TOTAL 14.44 100.00 22.40 100.00 13.35 100.00 7.21 100.00 22.90 100.00 3.23 100.00 6.54 100.00 6.34 100.00 96.41 100.00 179.75 100.00
WA
ST
EL
AN
DS
WA
TE
RA
GR
ICU
LT
UR
ES
ET
TL
EM
EN
TS
AC
TIV
E M
ININ
G
GARJANBAHALBELPAHAR LAKHANPUR SAMLESWARI LAJKURA SIARMAL BASUNDHARA W EXTN
FO
RE
ST
SS
CR
UB
S
(Area in Sq. Kms.)
PL
AN
TA
TIO
N
ALL TOTALTOTALKULDA
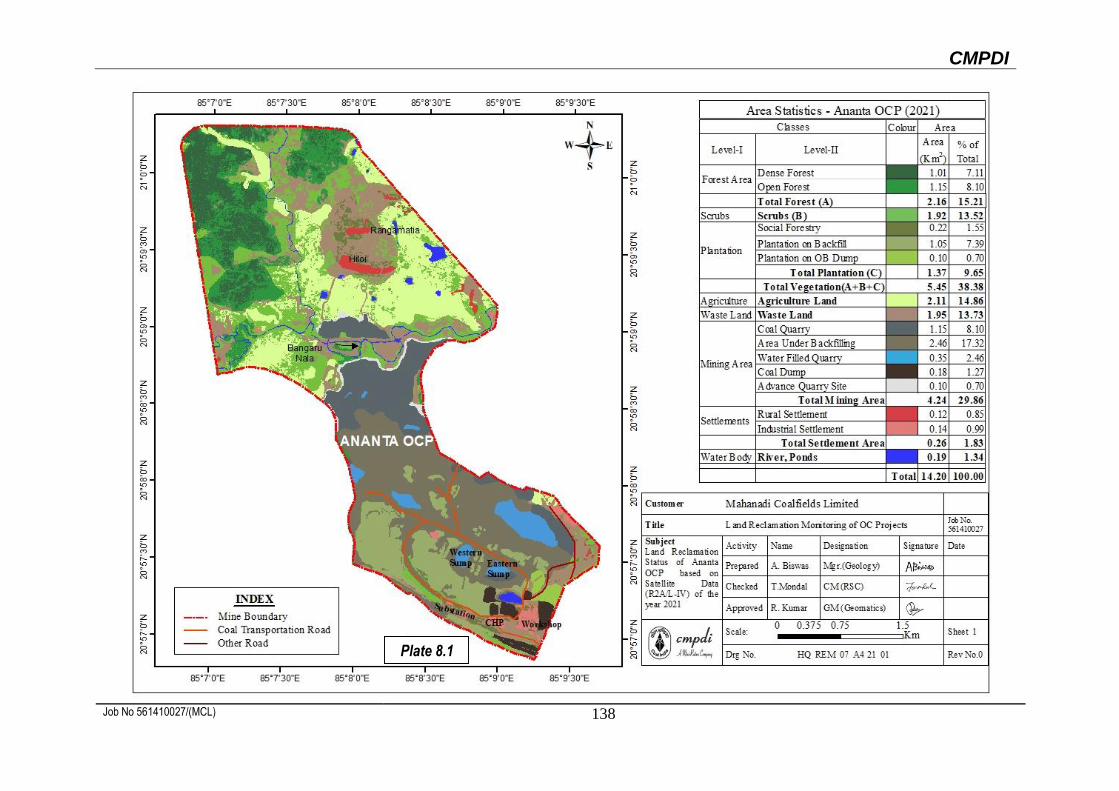
CMPDI
Job No 561410027/(MCL) 138
Plate 8.1
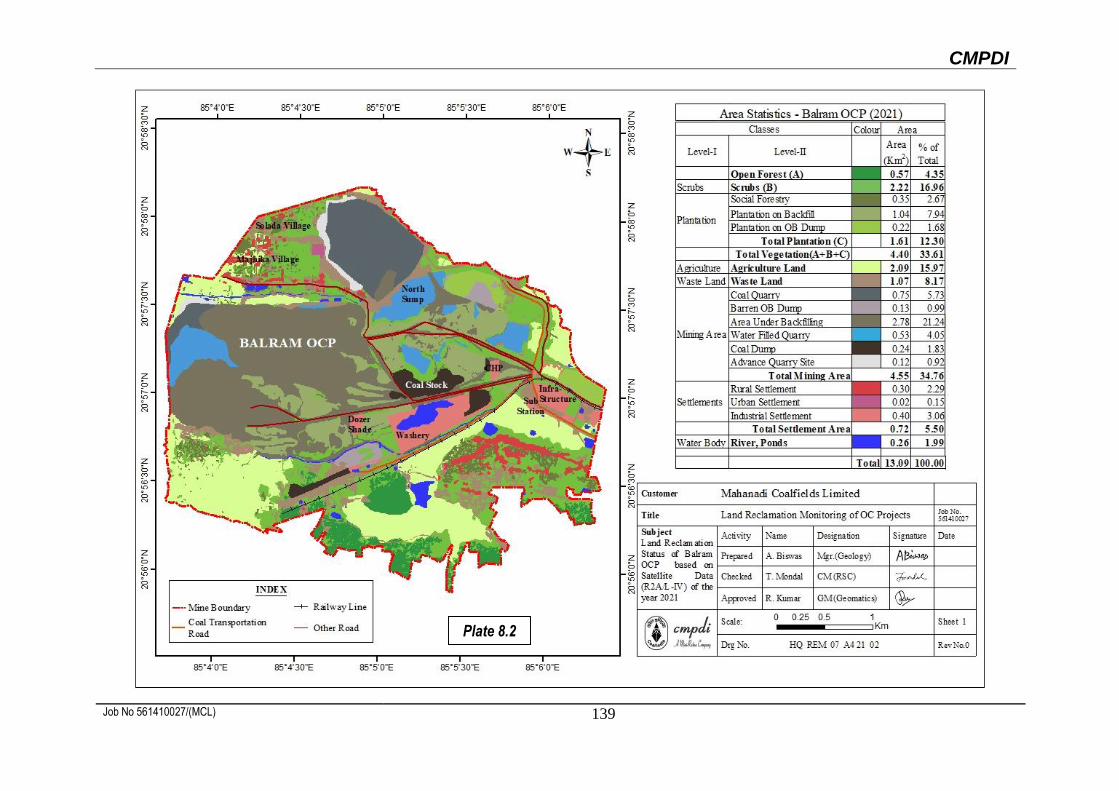
CMPDI
Job No 561410027/(MCL) 139
Plate 8.2
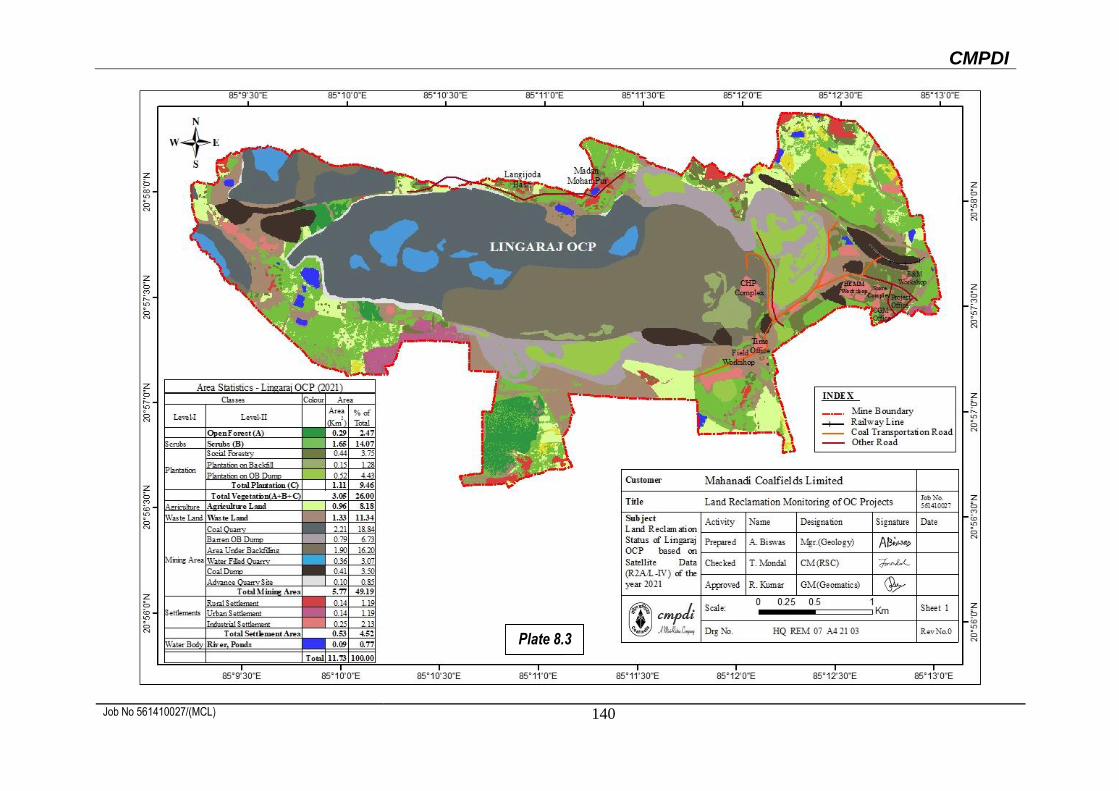
CMPDI
Job No 561410027/(MCL) 140
Plate 8.3
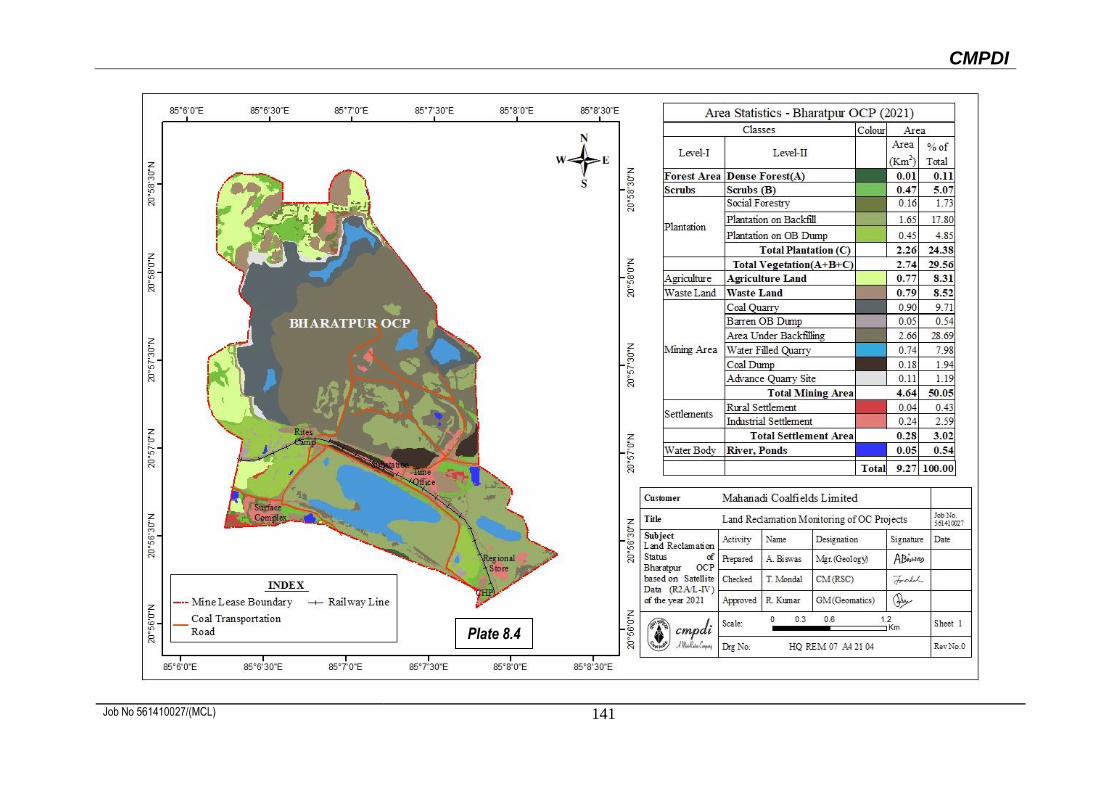
CMPDI
Job No 561410027/(MCL) 141
Plate 8.4
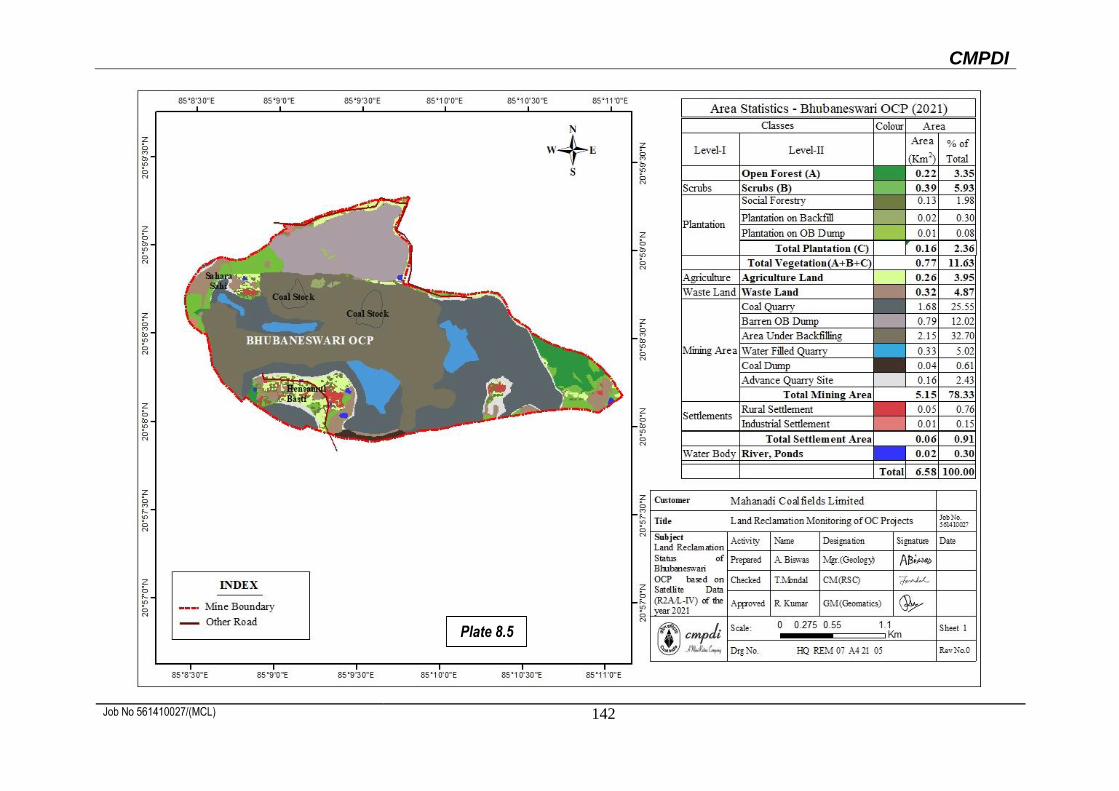
CMPDI
Job No 561410027/(MCL) 142
Plate 8.5
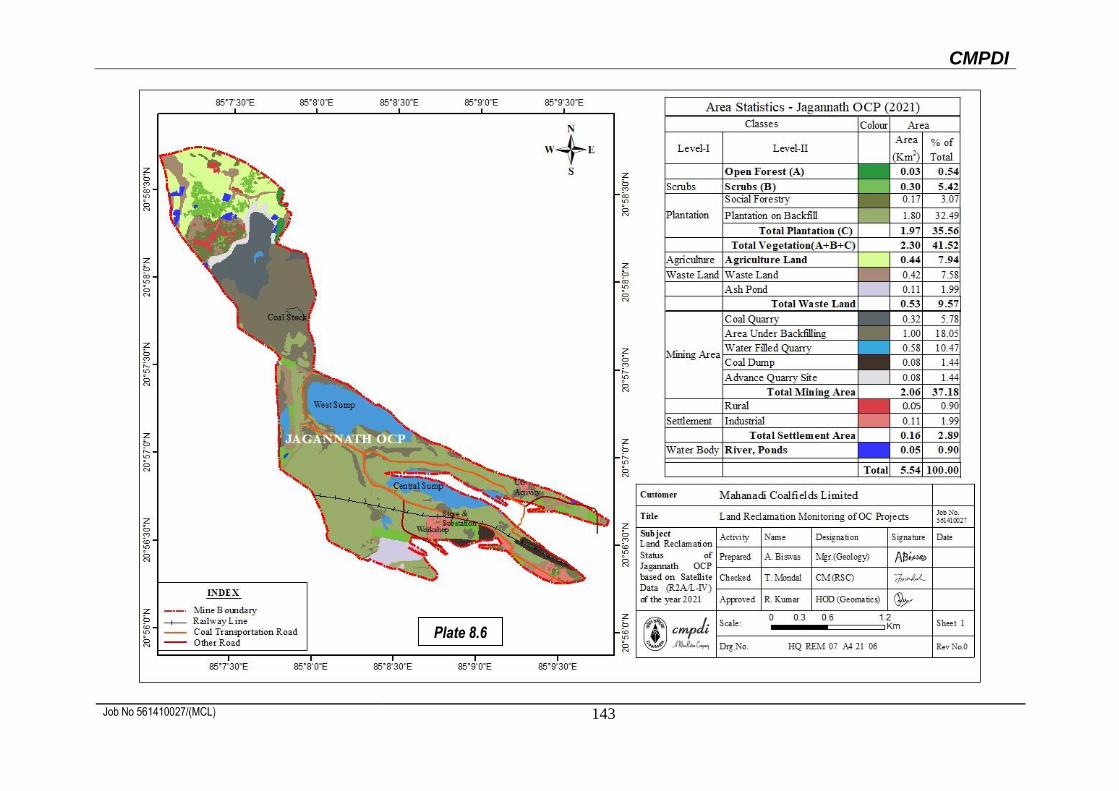
CMPDI
Job No 561410027/(MCL) 143
Plate 8.6
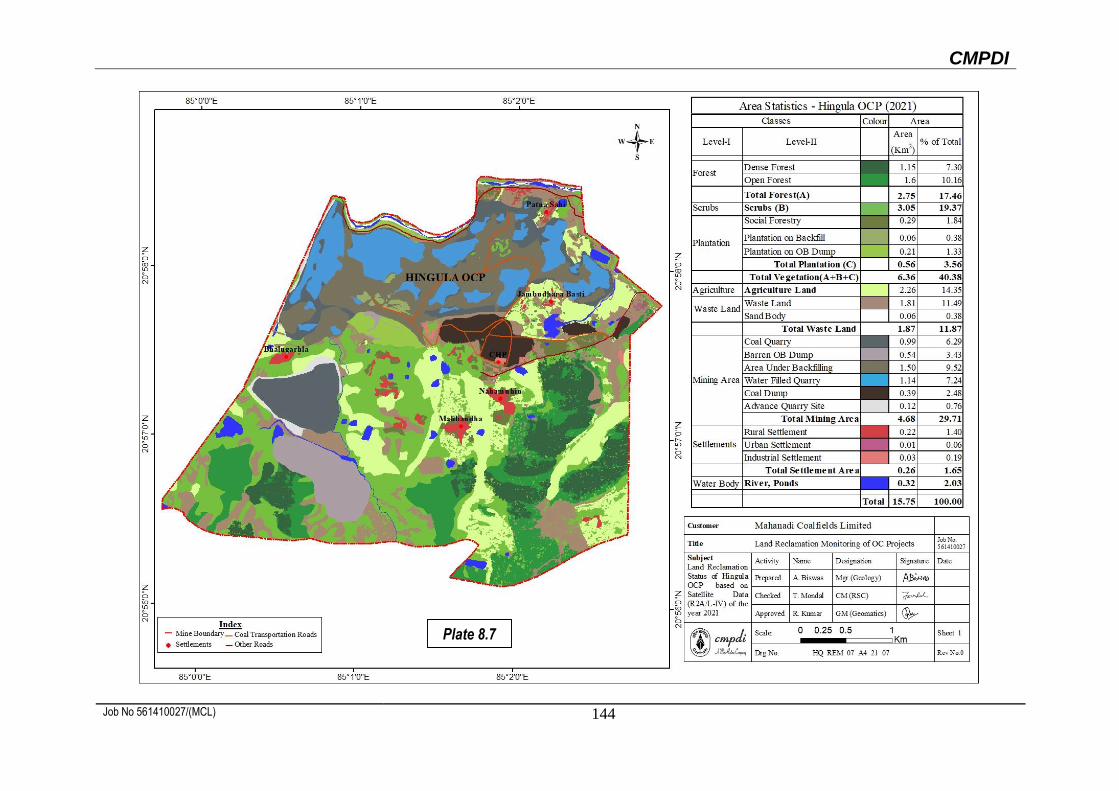
CMPDI
Job No 561410027/(MCL) 144
Plate 8.7
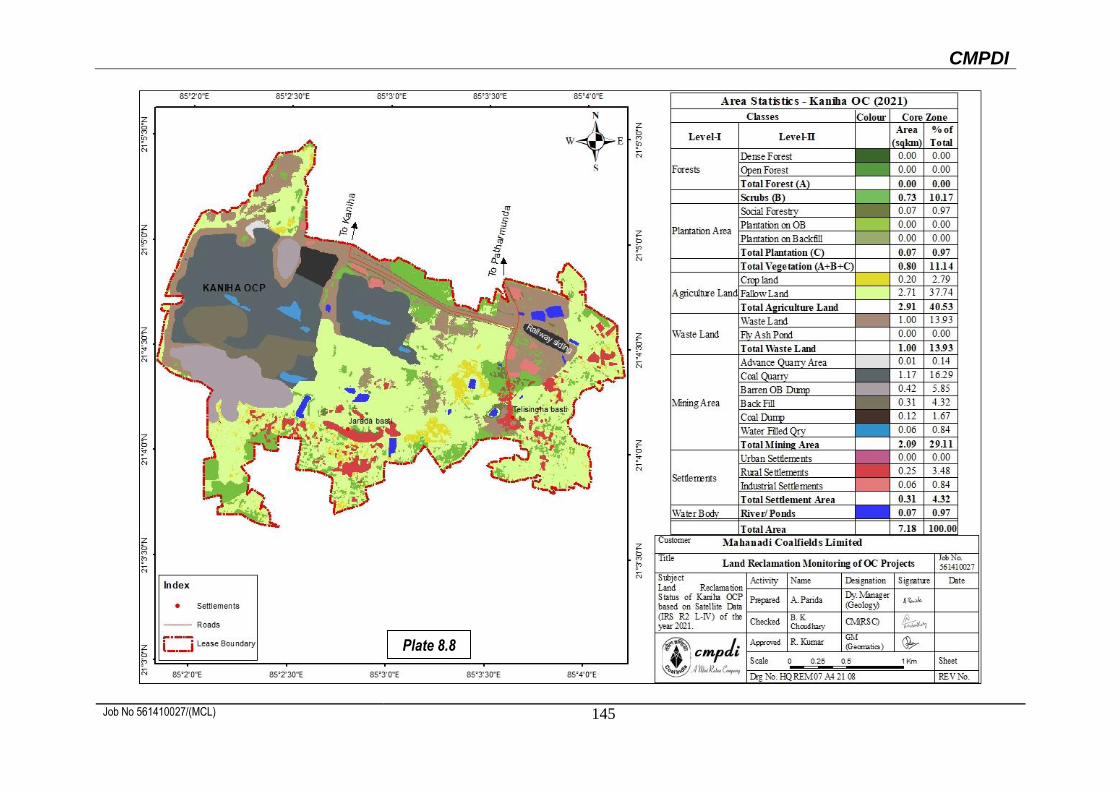
CMPDI
Job No 561410027/(MCL) 145
Plate 8.8
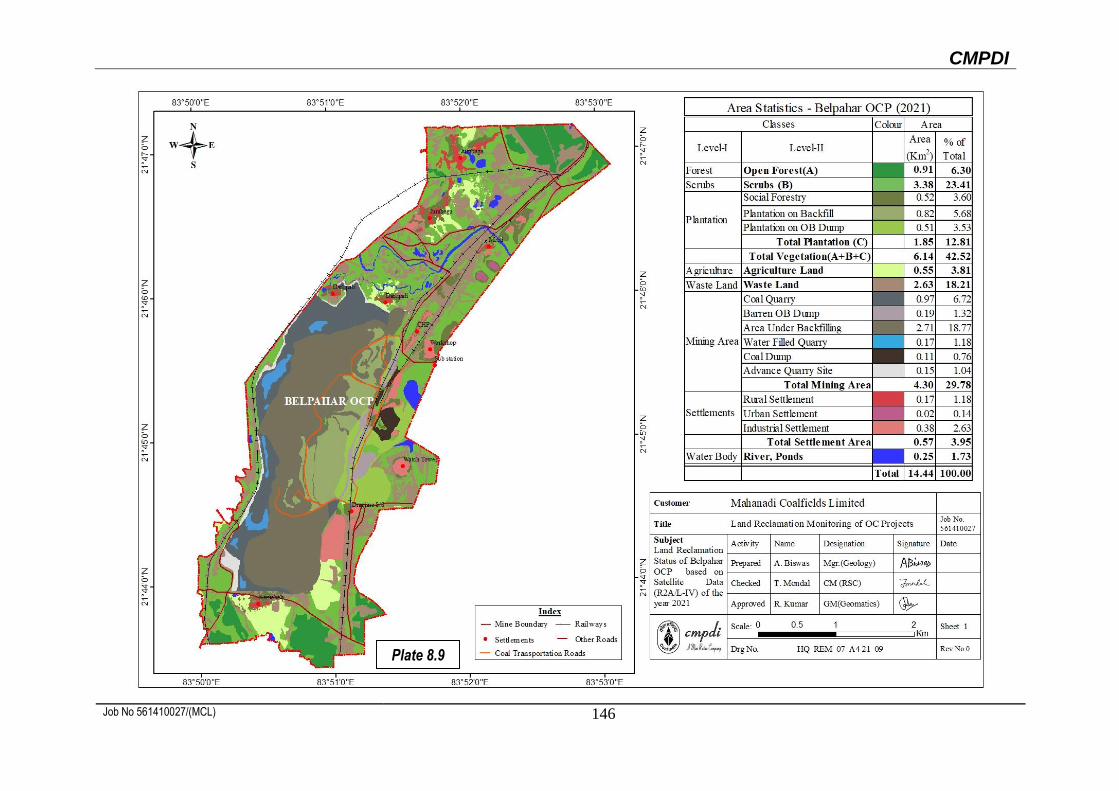
CMPDI
Job No 561410027/(MCL) 146
Plate 8.9
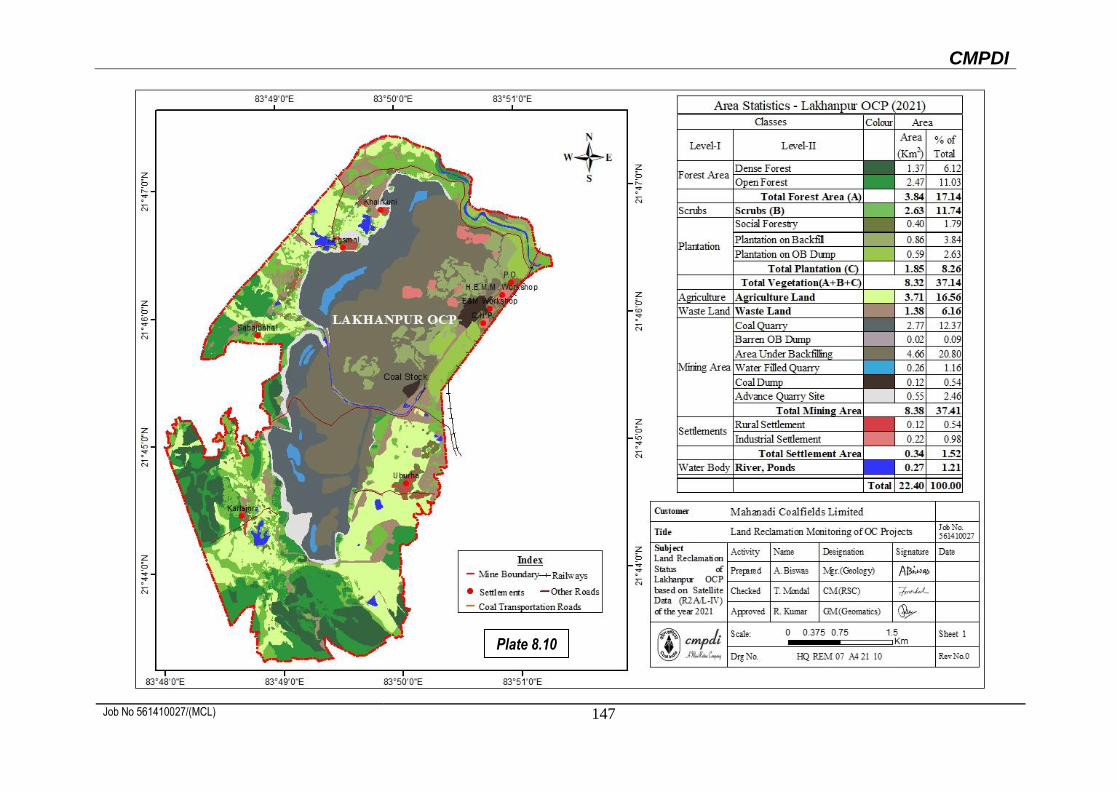
CMPDI
Job No 561410027/(MCL) 147
Plate 8.10
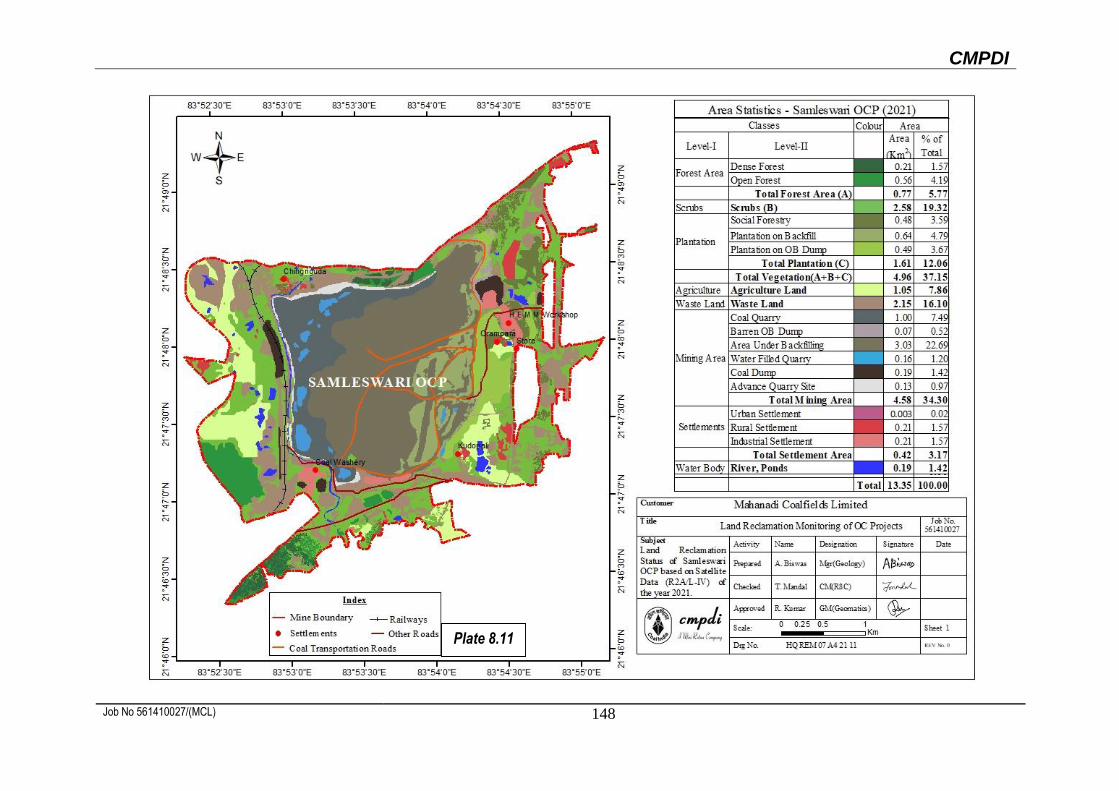
CMPDI
Job No 561410027/(MCL) 148
Plate 8.11
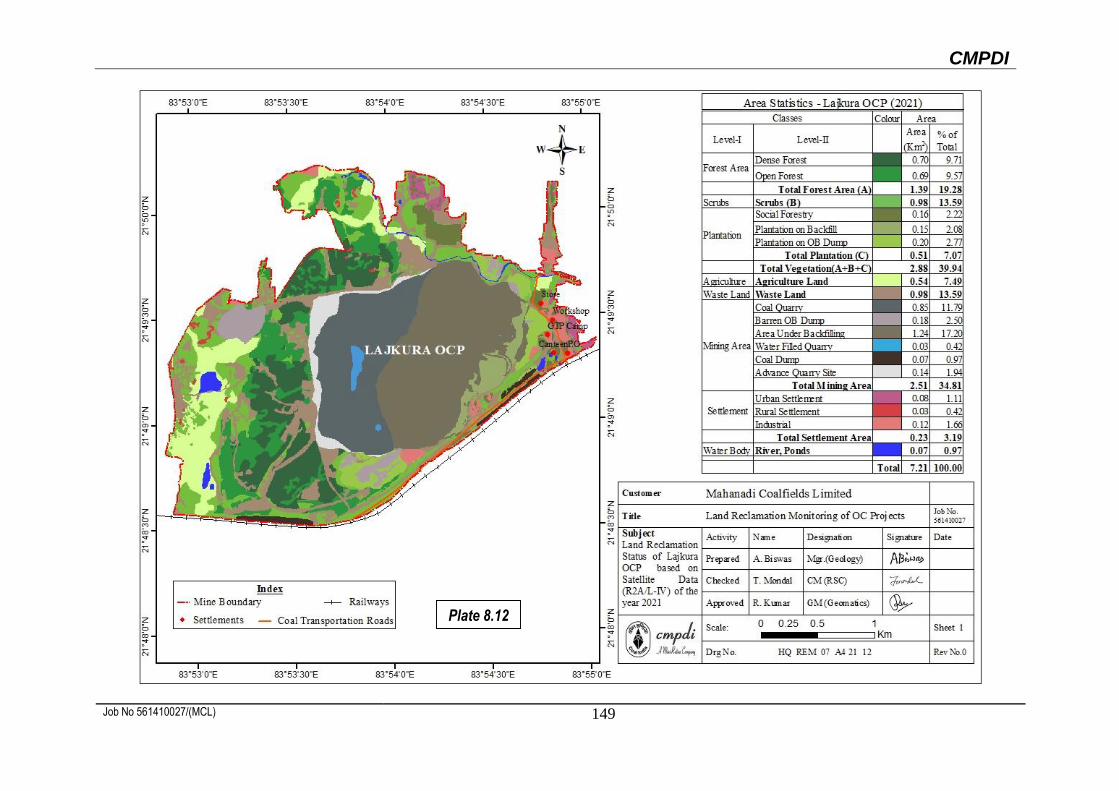
CMPDI
Job No 561410027/(MCL) 149
Plate 8.12
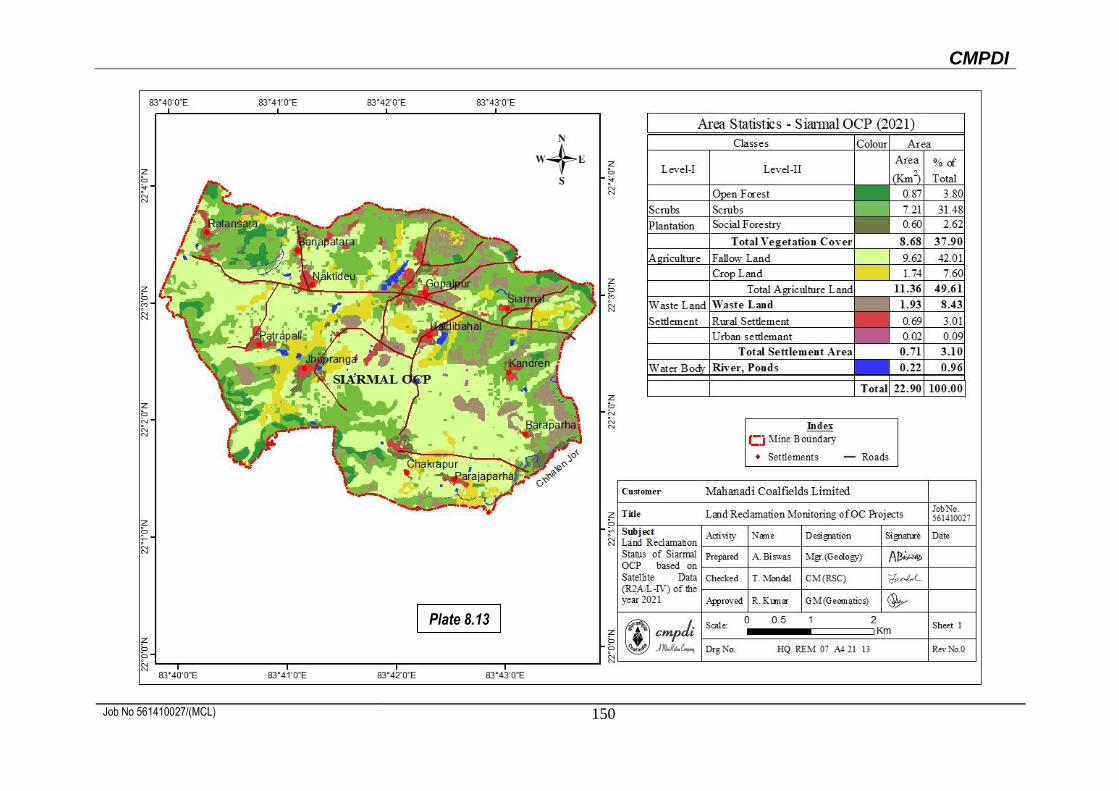
CMPDI
Job No 561410027/(MCL) 150
Plate 8.13
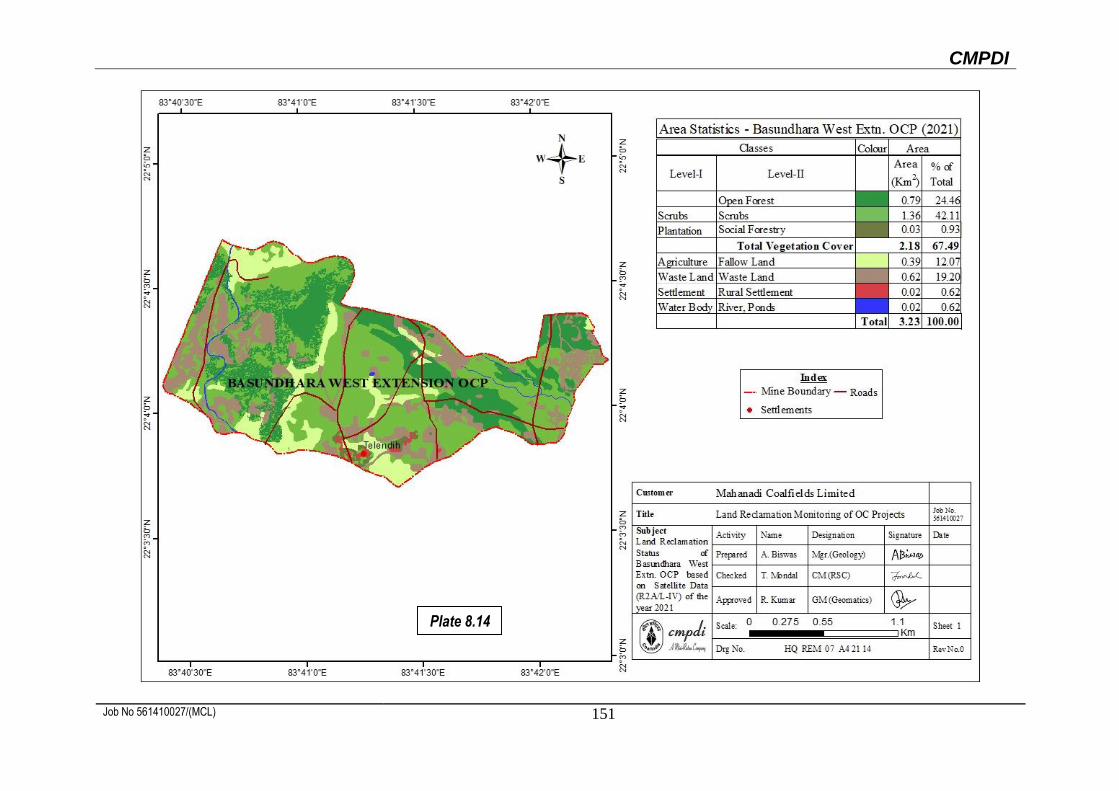
CMPDI
Job No 561410027/(MCL) 151
Plate 8.14
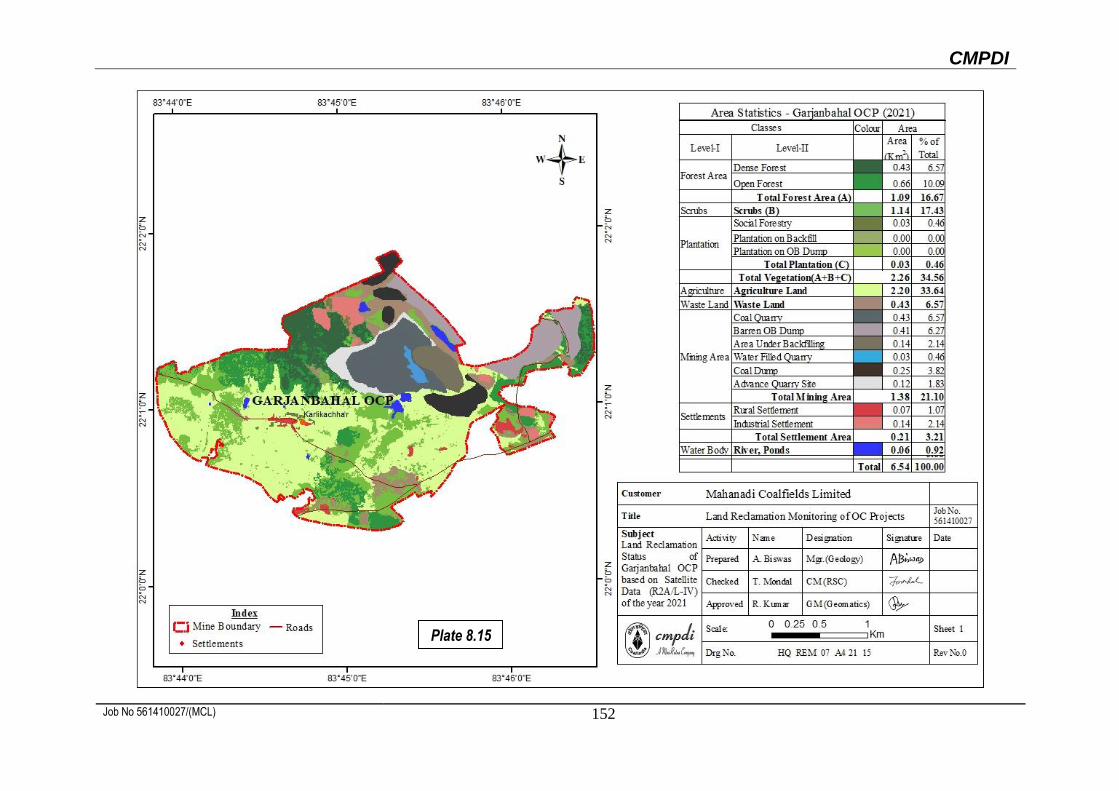
CMPDI
Job No 561410027/(MCL) 152
Plate 8.15
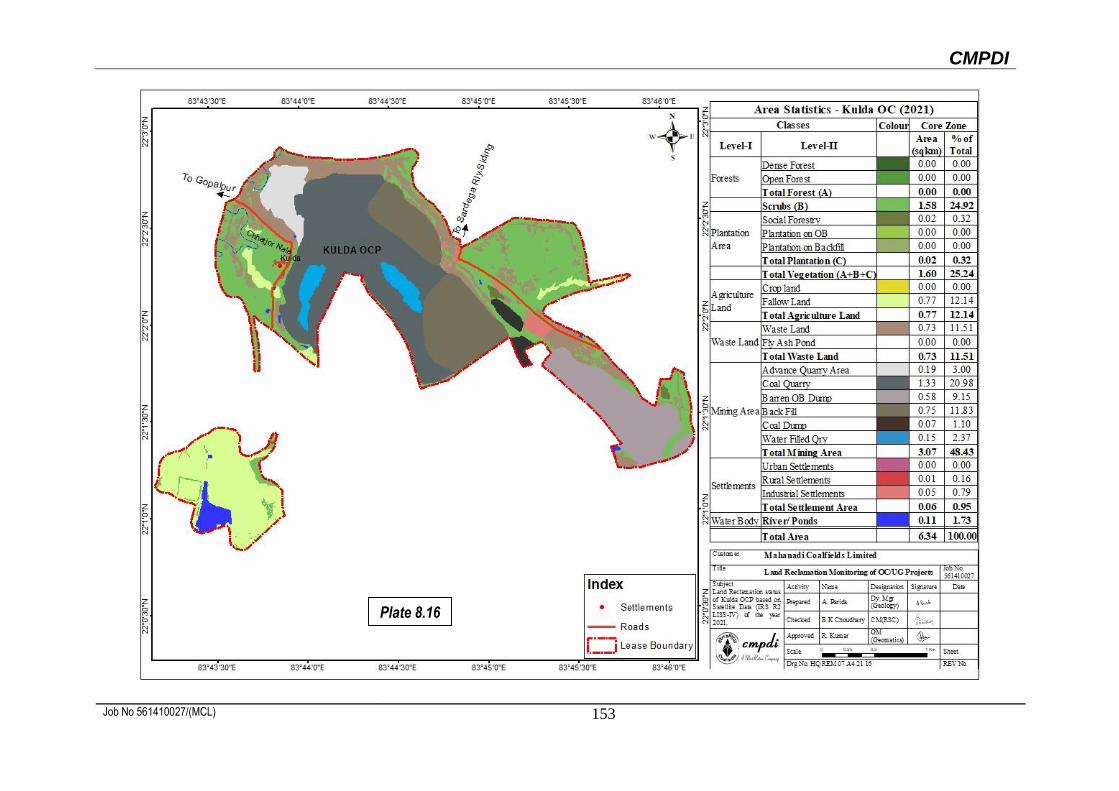
CMPDI
Job No 561410027/(MCL) 153
Plate 8.16
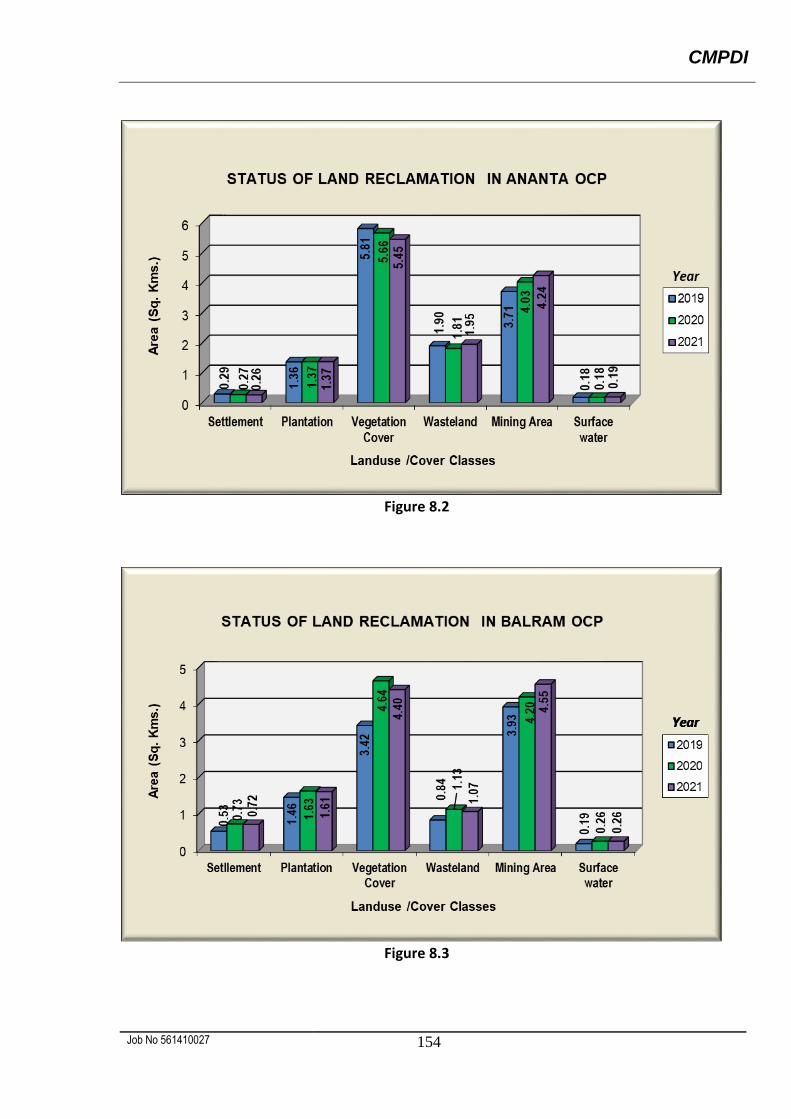
CMPDI
Job No 561410027 154
Figure 8.2
Figure 8.3
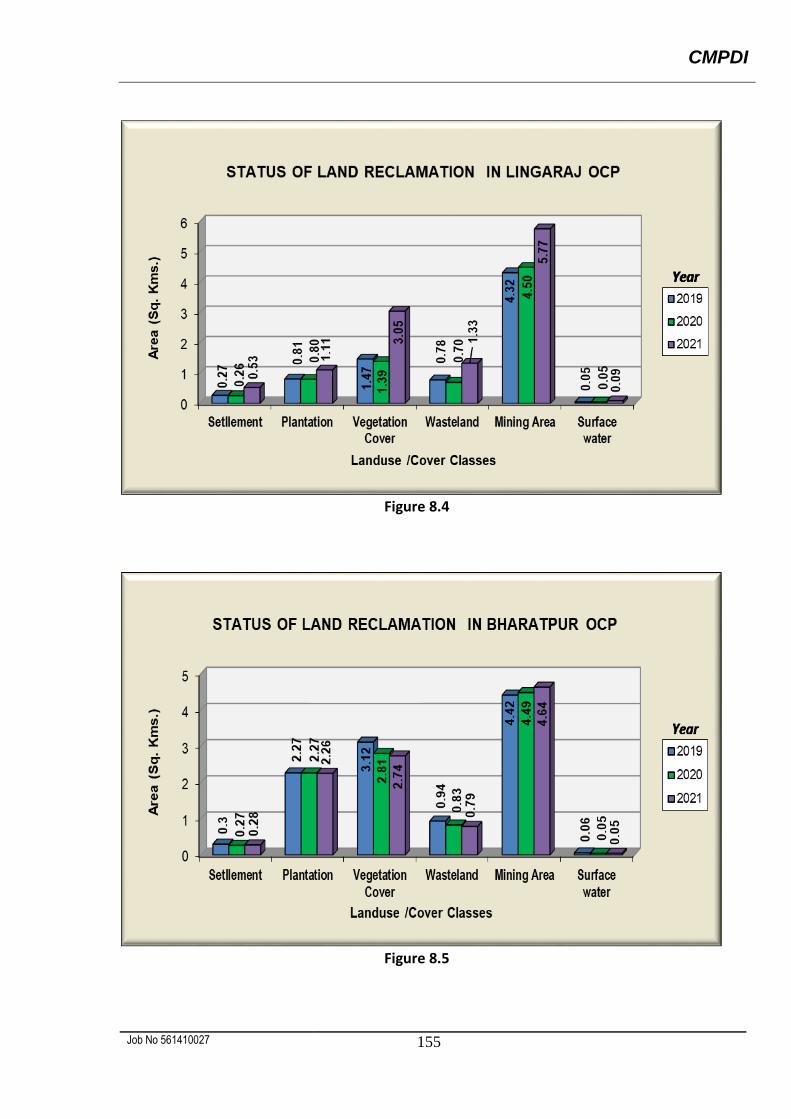
CMPDI
Job No 561410027 155
Figure 8.4
Figure 8.5
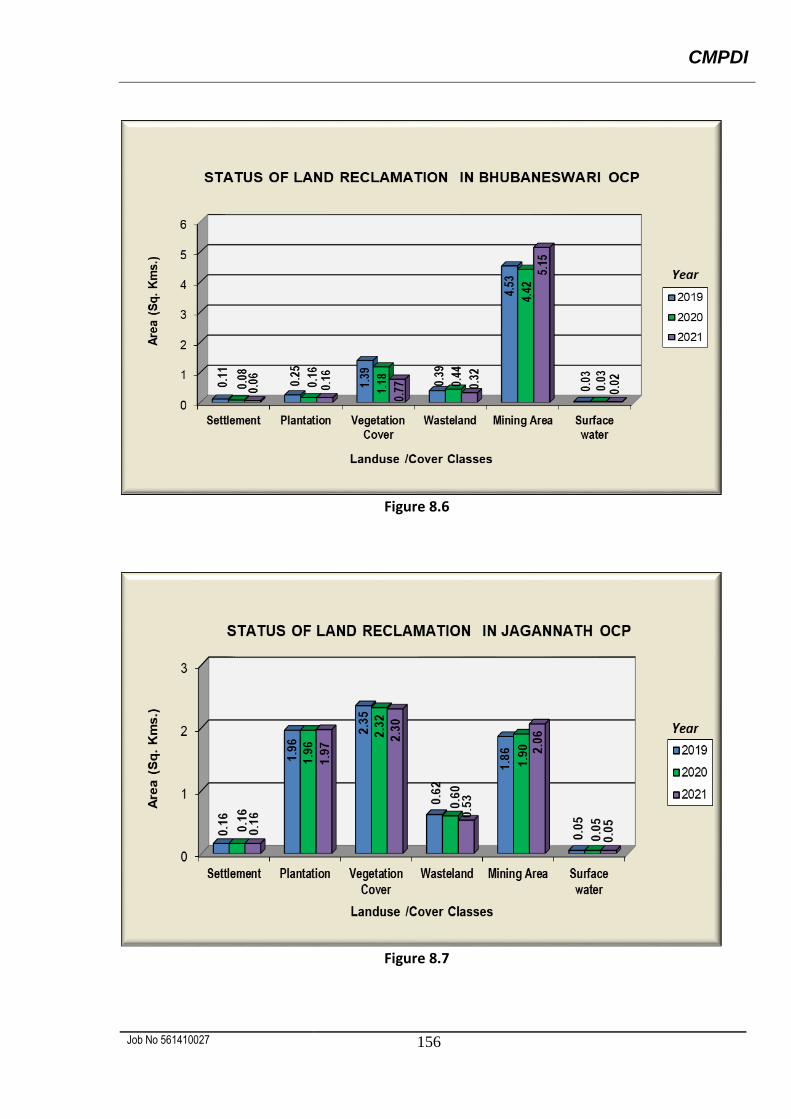
CMPDI
Job No 561410027 156
Figure 8.6
Figure 8.7
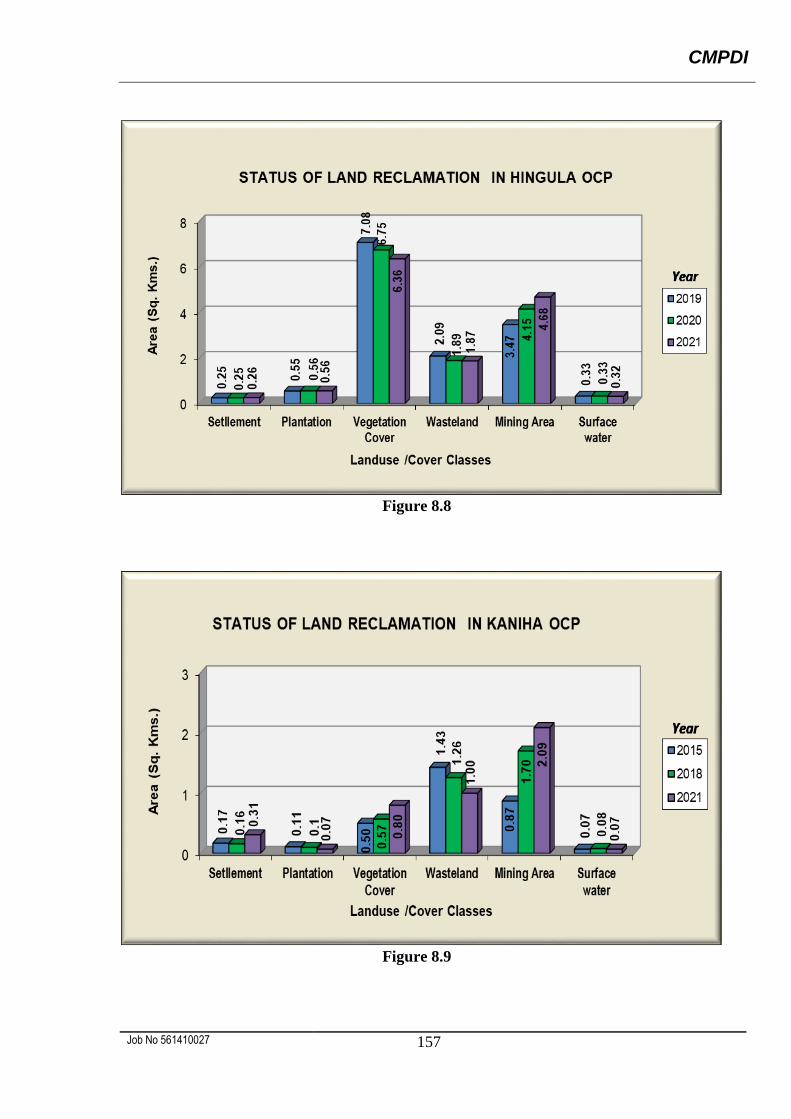
CMPDI
Job No 561410027 157
Figure 8.8
Figure 8.9
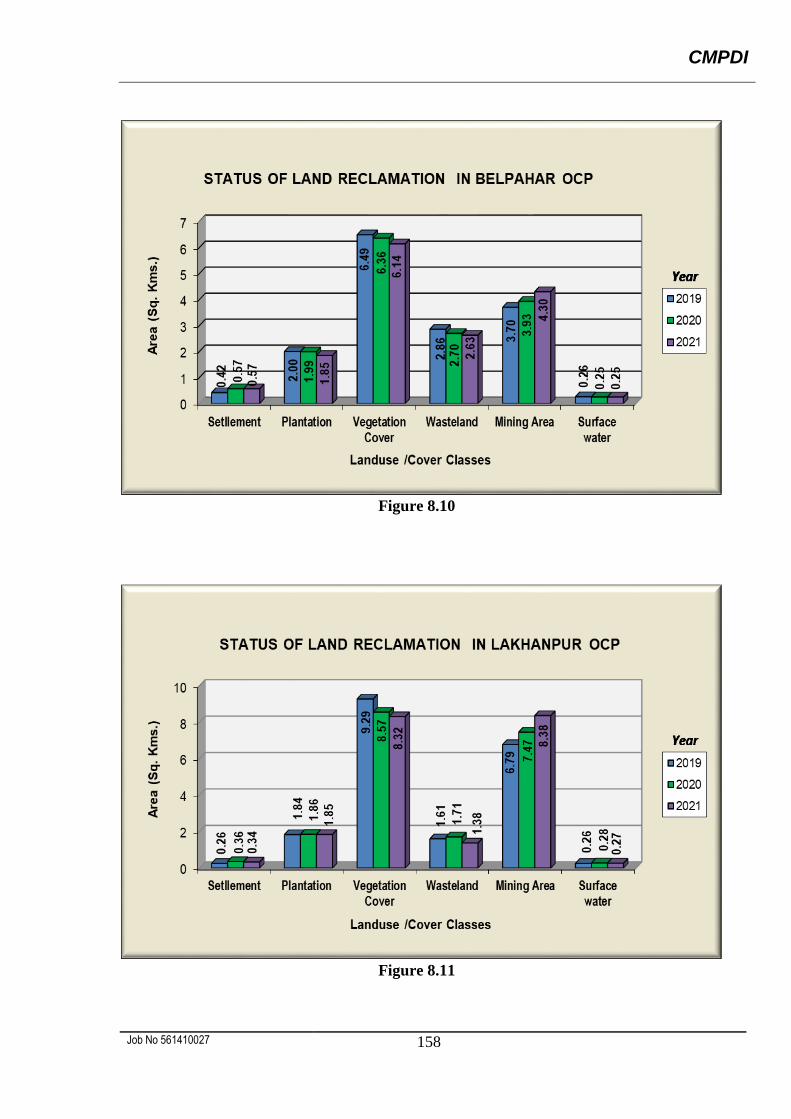
CMPDI
Job No 561410027 158
Figure 8.10
Figure 8.11
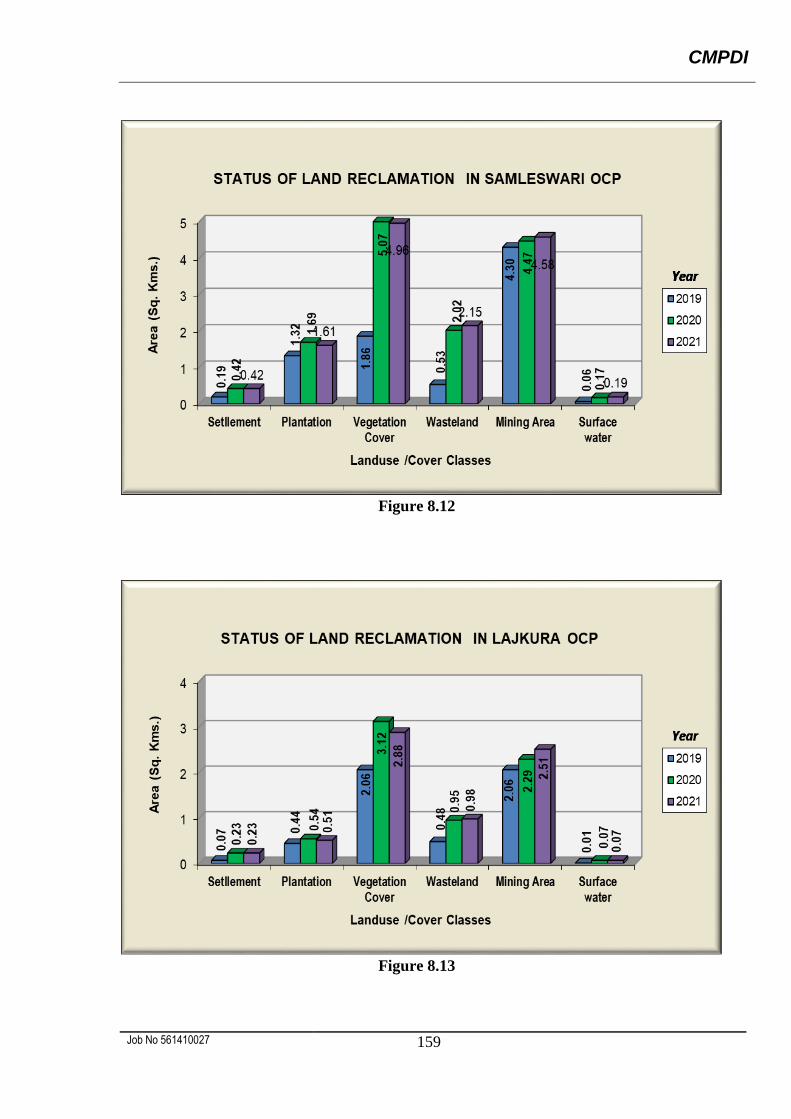
CMPDI
Job No 561410027 159
Figure 8.12
Figure 8.13
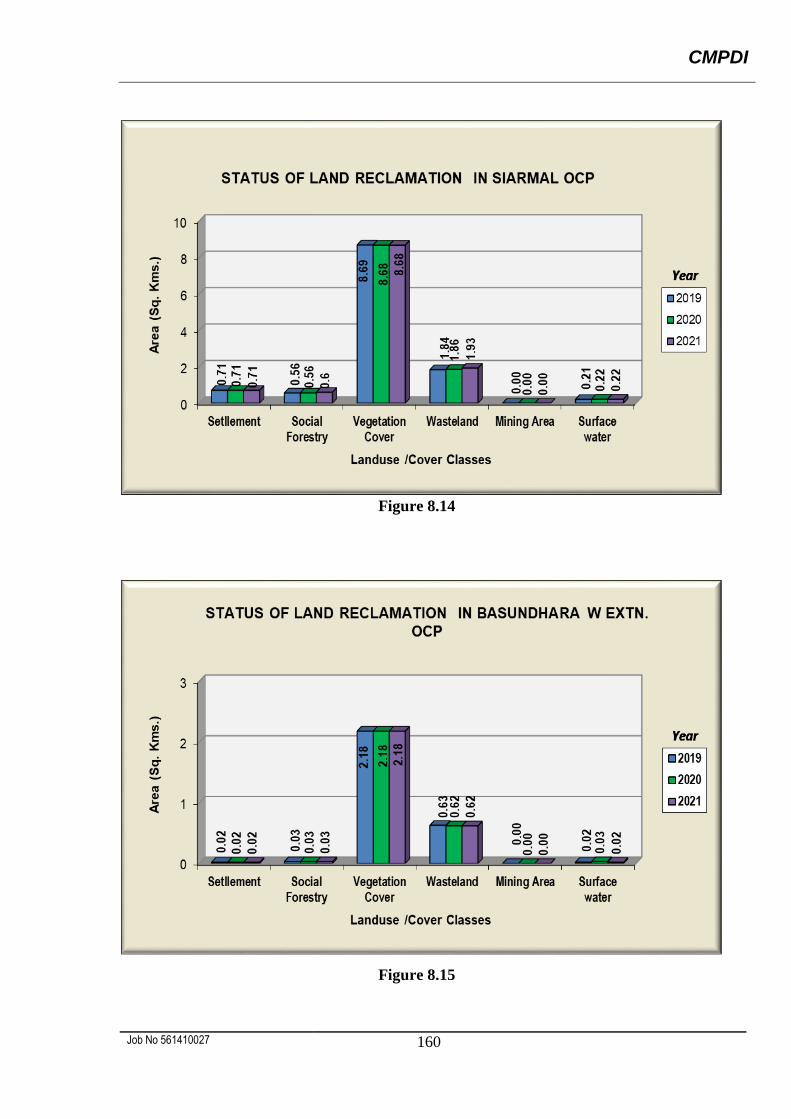
CMPDI
Job No 561410027 160
Figure 8.14
Figure 8.15
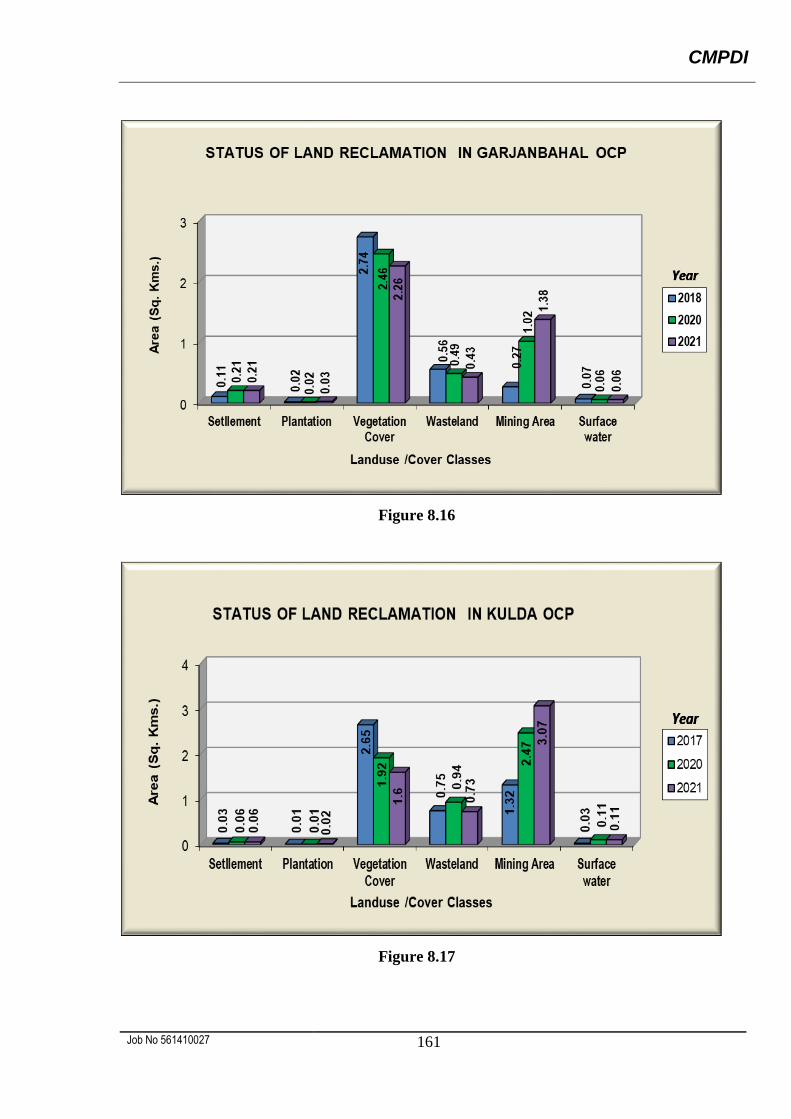
CMPDI
Job No 561410027 161
Figure 8.16
Figure 8.17
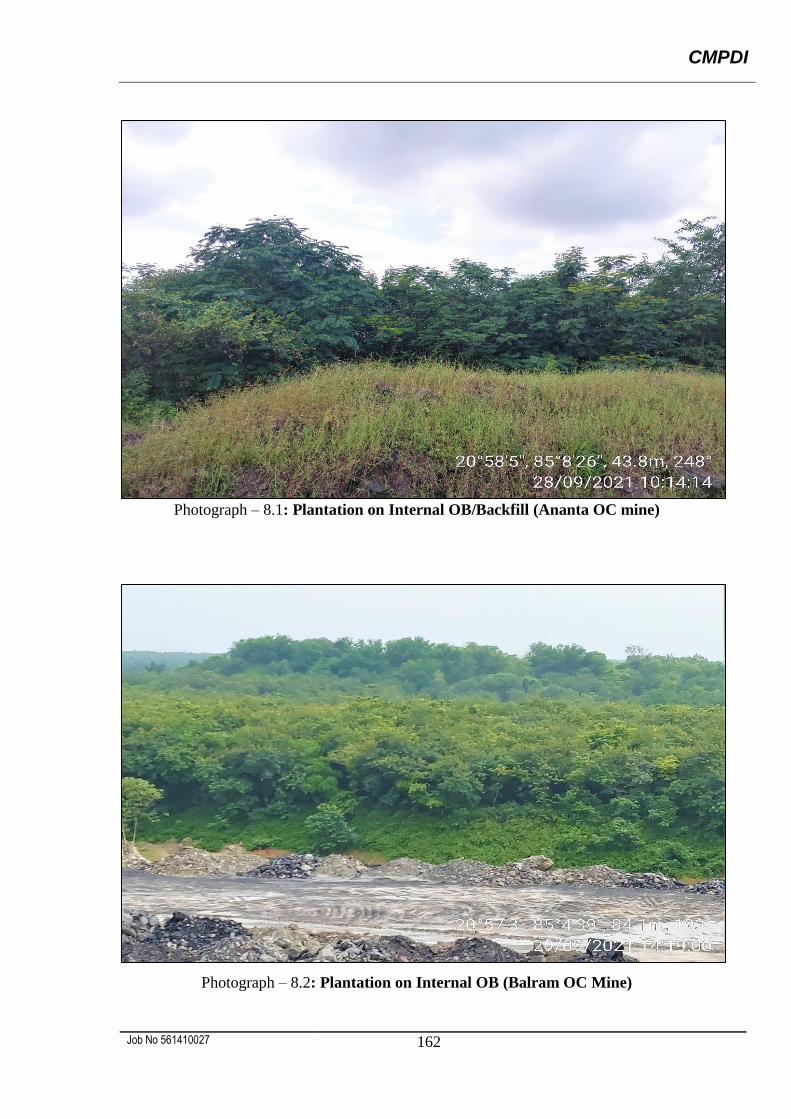
CMPDI
Job No 561410027 162
Photograph – 8.1: Plantation on Internal OB/Backfill (Ananta OC mine)
Photograph – 8.2: Plantation on Internal OB (Balram OC Mine)
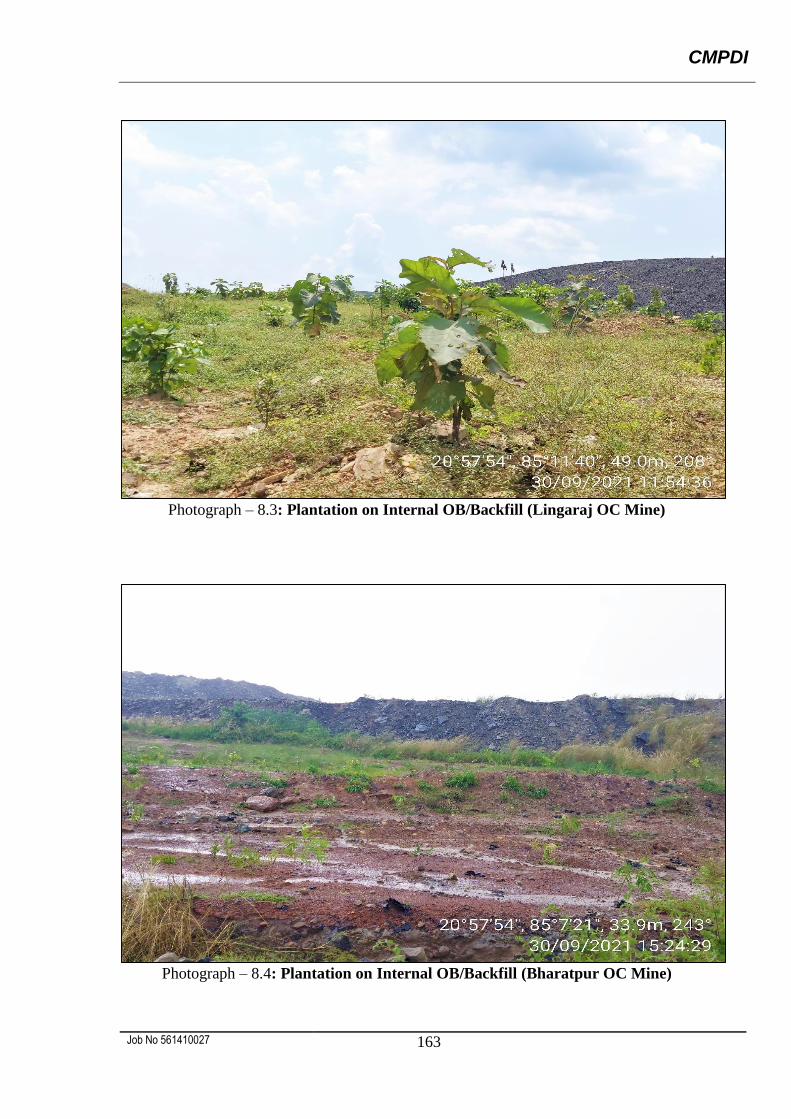
CMPDI
Job No 561410027 163
Photograph – 8.3: Plantation on Internal OB/Backfill (Lingaraj OC Mine)
Photograph – 8.4: Plantation on Internal OB/Backfill (Bharatpur OC Mine)
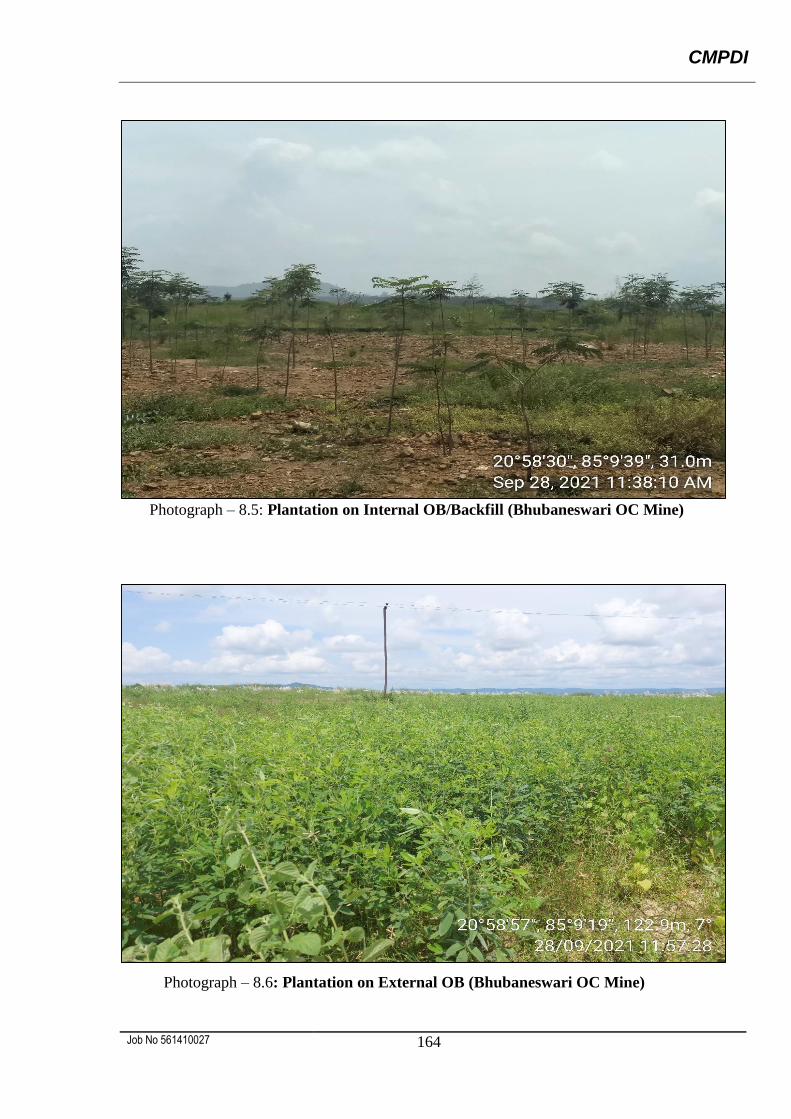
CMPDI
Job No 561410027 164
Photograph – 8.5: Plantation on Internal OB/Backfill (Bhubaneswari OC Mine)
Photograph – 8.6: Plantation on External OB (Bhubaneswari OC Mine)
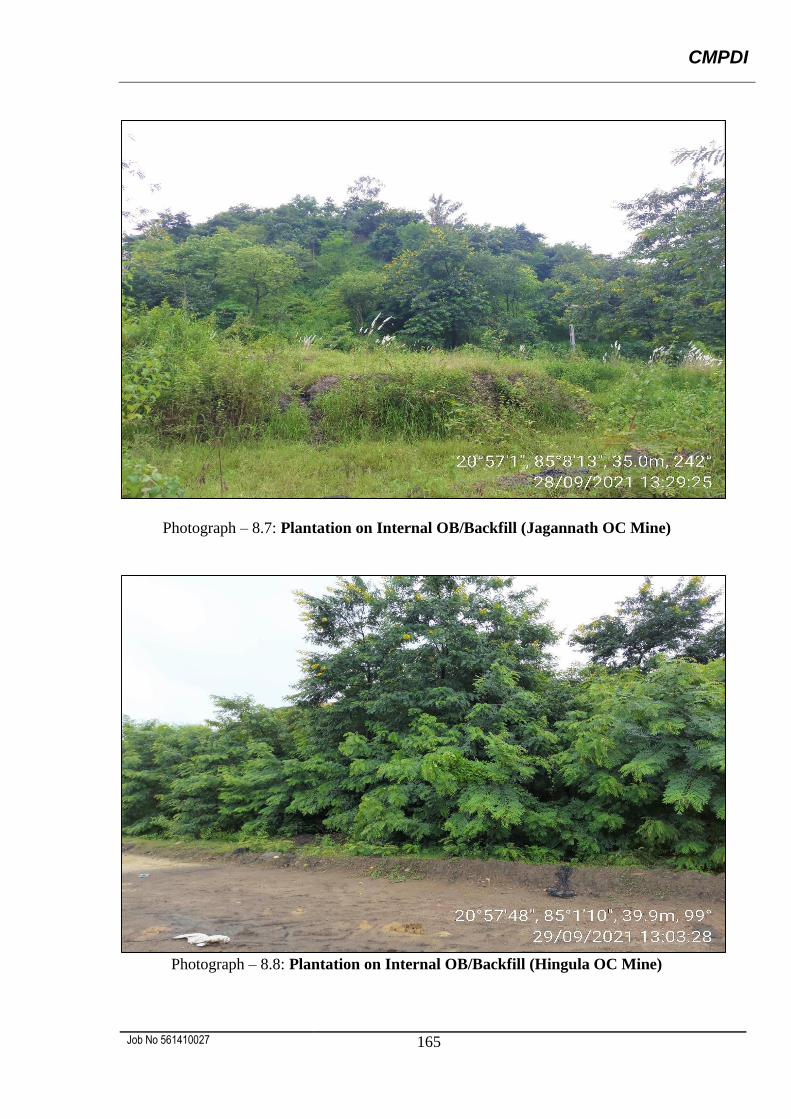
CMPDI
Job No 561410027 165
Photograph – 8.7: Plantation on Internal OB/Backfill (Jagannath OC Mine)
Photograph – 8.8: Plantation on Internal OB/Backfill (Hingula OC Mine)
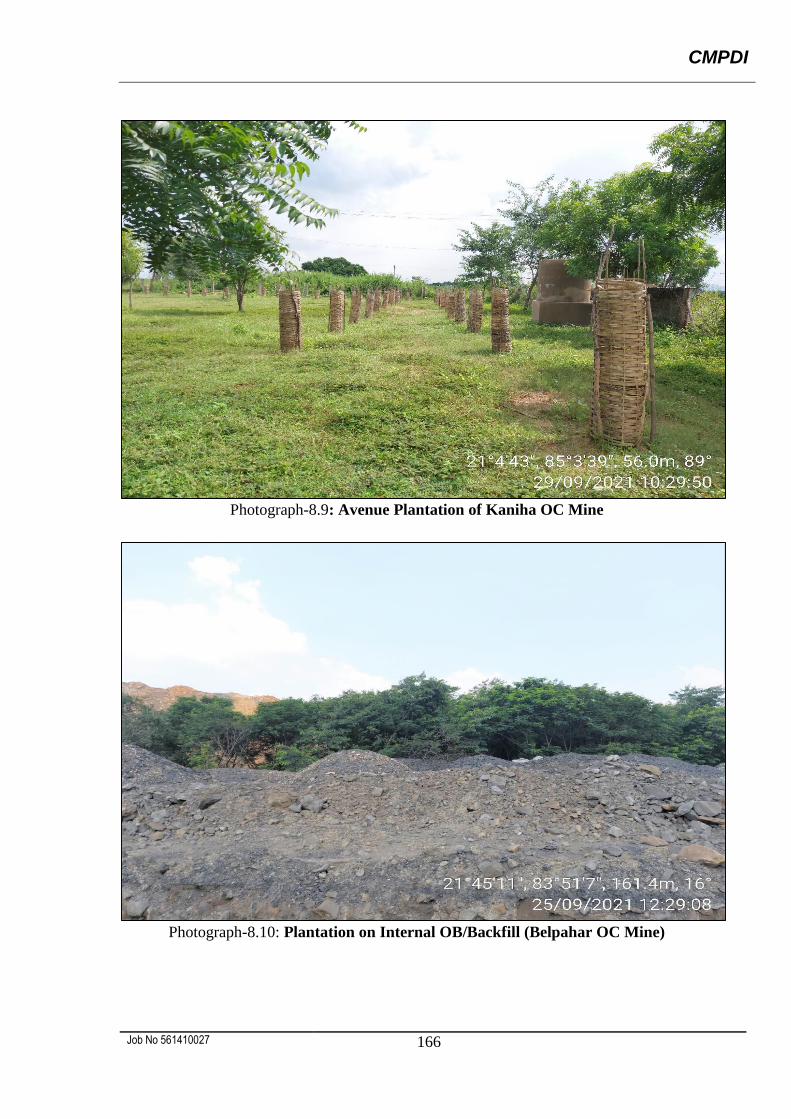
CMPDI
Job No 561410027 166
Photograph-8.9: Avenue Plantation of Kaniha OC Mine
Photograph-8.10: Plantation on Internal OB/Backfill (Belpahar OC Mine)
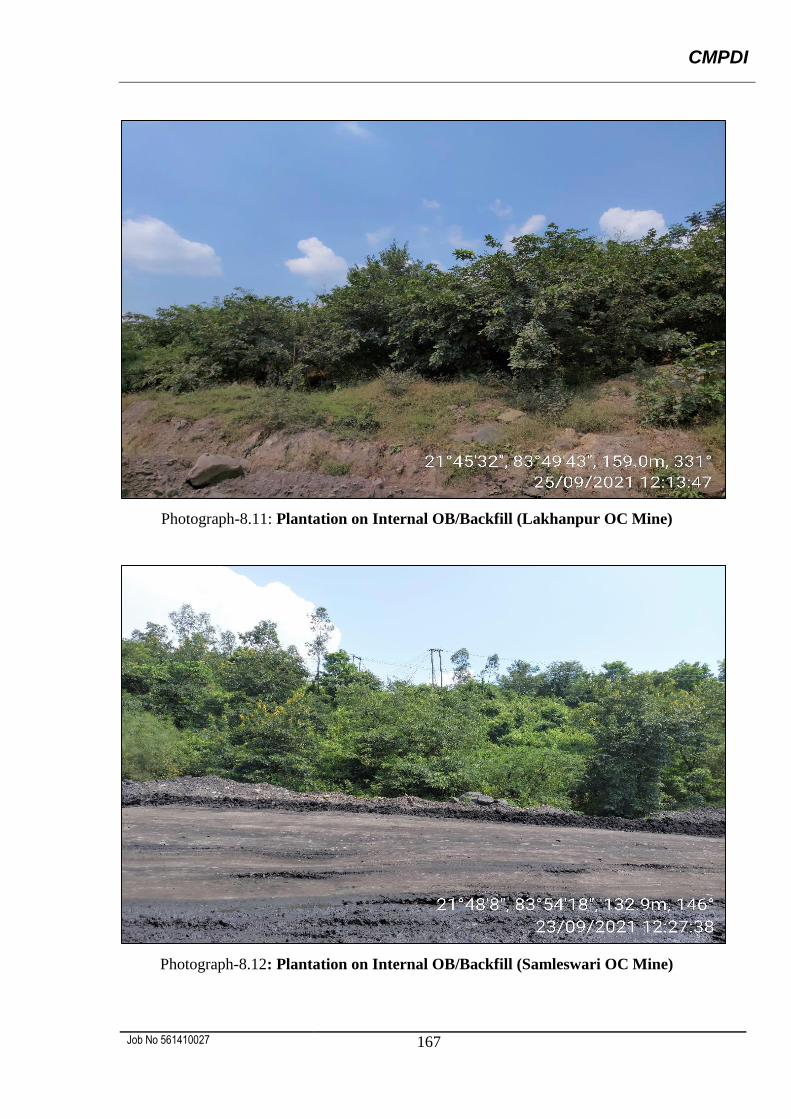
CMPDI
Job No 561410027 167
Photograph-8.11: Plantation on Internal OB/Backfill (Lakhanpur OC Mine)
Photograph-8.12: Plantation on Internal OB/Backfill (Samleswari OC Mine)
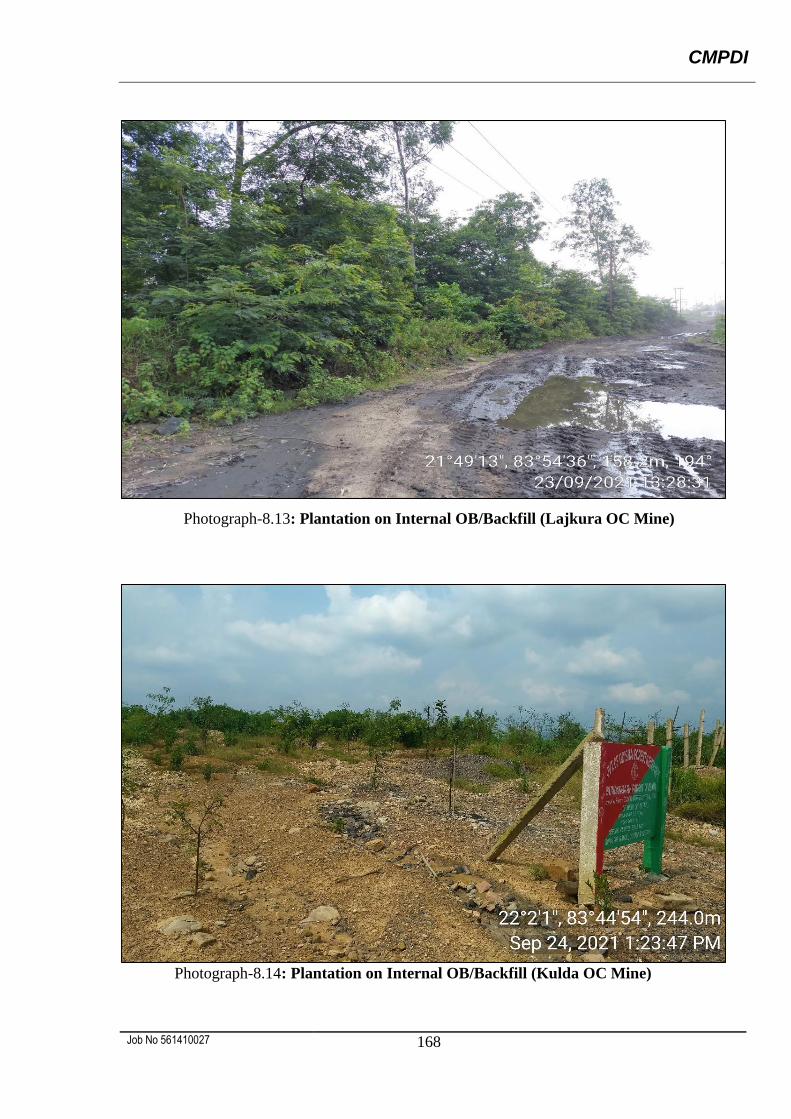
CMPDI
Job No 561410027 168
Photograph-8.13: Plantation on Internal OB/Backfill (Lajkura OC Mine)
Photograph-8.14: Plantation on Internal OB/Backfill (Kulda OC Mine)
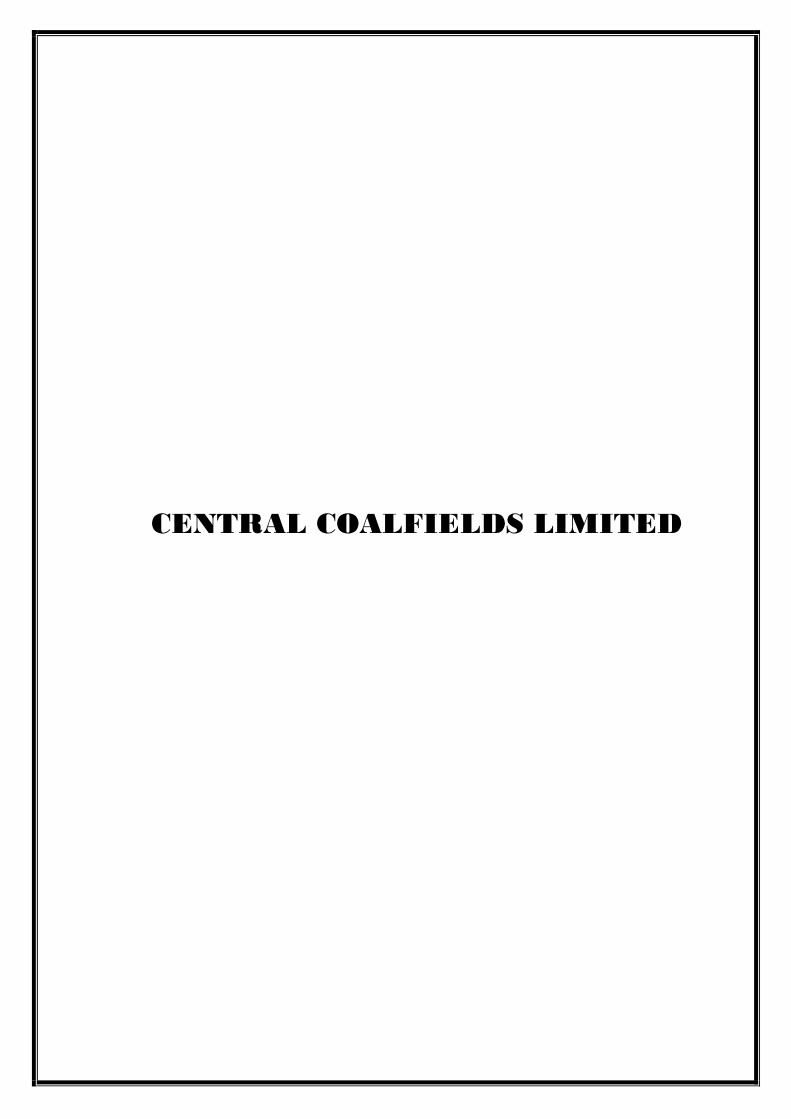
CENTRAL COALFIELDS LIMITED
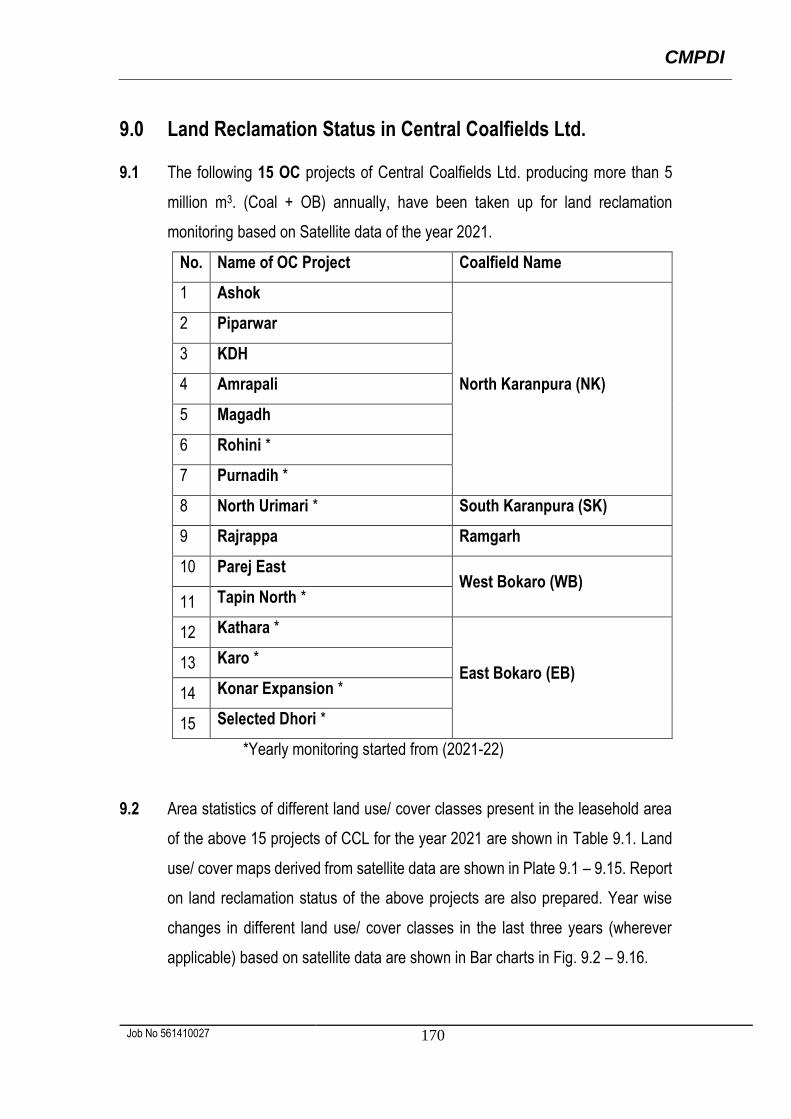
CMPDI
Job No 561410027 170
9.0 Land Reclamation Status in Central Coalfields Ltd.
9.1 The following 15 OC projects of Central Coalfields Ltd. producing more than 5
million m3. (Coal + OB) annually, have been taken up for land reclamation
monitoring based on Satellite data of the year 2021.
No. Name of OC Project Coalfield Name
1 Ashok
North Karanpura (NK)
2 Piparwar
3 KDH
4 Amrapali
5 Magadh
6 Rohini *
7 Purnadih *
8 North Urimari * South Karanpura (SK)
9 Rajrappa Ramgarh
10 Parej East West Bokaro (WB)
11 Tapin North *
12 Kathara *
East Bokaro (EB) 13 Karo *
14 Konar Expansion *
15 Selected Dhori *
*Yearly monitoring started from (2021-22)
9.2 Area statistics of different land use/ cover classes present in the leasehold area
of the above 15 projects of CCL for the year 2021 are shown in Table 9.1. Land
use/ cover maps derived from satellite data are shown in Plate 9.1 – 9.15. Report
on land reclamation status of the above projects are also prepared. Year wise
changes in different land use/ cover classes in the last three years (wherever
applicable) based on satellite data are shown in Bar charts in Fig. 9.2 – 9.16.
CMPDI
Job No 561410027 171
9.3 Study based on Satellite data of the year 2021 reveals that, out of total excavated area
of 36.49 km2 , 25.99 km2 (71.22%) has come under reclamation in the above 15 OC
projects of CCL, out of which 18.01 km2 (49.36%) area is under backfilling (Technical
Reclamation) and 7.98 km2 (21.87%) area is under plantation (Biological Reclamation).
9.4 Study also reveals that the area under backfilling (Technical Reclamation) has increased
from 15.20 km2 in 2020 to 18.01 km2 in 2021.
9.5 Analysis of satellite data also indicates that the area under plantation (Biological
Reclamation) has increased from 7.00 km2 (Yr. 2020) to 7.98 km2 (Yr. 2021). This
increase in Biological Reclamation reflects continuous efforts on part of CCL in
continueing reclamation activities for environmental protection.
9.6 The total area under reclamation has increased from 22.20 km2 (69.05%) in 2020 to 25.99
km2 (71.22%) in 2021, out of the total excavated area.
9.7 It is also seen that the total area under plantation (Green Cover) which includes
plantation carried out on backfilled area, OB dumps as well as plantation done on social
forestry in all the 15 mines taken together of CCL has increased from 17.32 km2 in the
year 2020, to 17.71 km2 in the year 2021
9.8 Piparwar area of CCL has developed and maintained an eco-restoration park called
“Kayakalp Vatika” at Piparwar OCP, over the reclaimed (backfilled) land. Nearby, a new
eco park named ‘Chandra Shekhar Azad Vatika ‘ is also being developed from 2020.
9.10 Out of 15 projects of CCL taken for land reclamation monitoring in 2021-22, Parej East
OC ranks on top for land reclamation (86.98%) followed by KDH (85.60%), Piparwar OC
(82.73%), Ashok OC (82.14%), and Rajrappa OC (79.61%).
9.11 Eight (8) OC projects namely, Purnadih, Rohini, North Urimari, Tapin North, Kathara,
Karo, Konar Expansion and Seleceted Dhori were added to the list of yearly reclamation
CMPDI
Job No 561410027 172
monitoring from the year 2021-22. Earlier these projects were monitored in every three
year basis.
9.12 Amrapali OCP has successfully carried out plantation on OB dumps, and slopes of OB
dump through seed ball throwing.
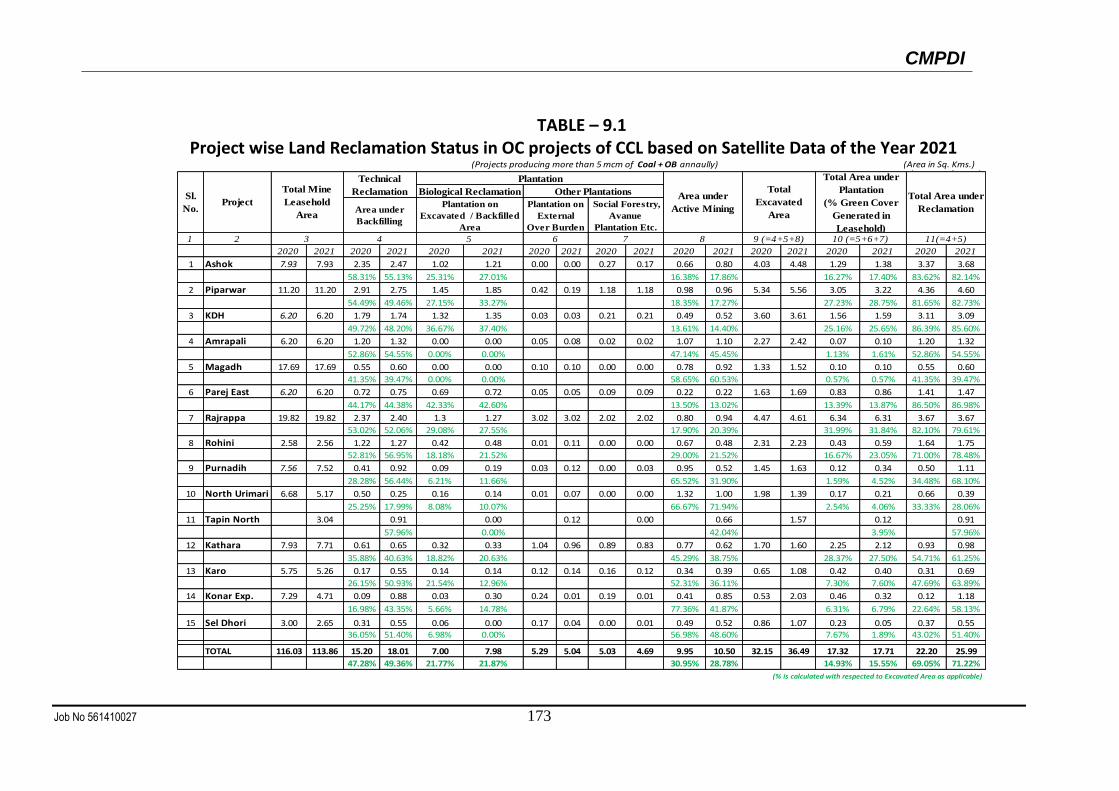
CMPDI
Job No 561410027 173
TABLE – 9.1 Project wise Land Reclamation Status in OC projects of CCL based on Satellite Data of the Year 2021
1 2
2020 2021 2020 2021 2020 2021 2020 2021 2020 2021 2020 2021 2020 2021 2020 2021 2020 2021
1 Ashok 7.93 7.93 2.35 2.47 1.02 1.21 0.00 0.00 0.27 0.17 0.66 0.80 4.03 4.48 1.29 1.38 3.37 3.68
58.31% 55.13% 25.31% 27.01% 16.38% 17.86% 16.27% 17.40% 83.62% 82.14%
2 Piparwar 11.20 11.20 2.91 2.75 1.45 1.85 0.42 0.19 1.18 1.18 0.98 0.96 5.34 5.56 3.05 3.22 4.36 4.60
54.49% 49.46% 27.15% 33.27% 18.35% 17.27% 27.23% 28.75% 81.65% 82.73%
3 KDH 6.20 6.20 1.79 1.74 1.32 1.35 0.03 0.03 0.21 0.21 0.49 0.52 3.60 3.61 1.56 1.59 3.11 3.09
49.72% 48.20% 36.67% 37.40% 13.61% 14.40% 25.16% 25.65% 86.39% 85.60%
4 Amrapali 6.20 6.20 1.20 1.32 0.00 0.00 0.05 0.08 0.02 0.02 1.07 1.10 2.27 2.42 0.07 0.10 1.20 1.32
52.86% 54.55% 0.00% 0.00% 47.14% 45.45% 1.13% 1.61% 52.86% 54.55%
5 Magadh 17.69 17.69 0.55 0.60 0.00 0.00 0.10 0.10 0.00 0.00 0.78 0.92 1.33 1.52 0.10 0.10 0.55 0.60
41.35% 39.47% 0.00% 0.00% 58.65% 60.53% 0.57% 0.57% 41.35% 39.47%
6 Parej East 6.20 6.20 0.72 0.75 0.69 0.72 0.05 0.05 0.09 0.09 0.22 0.22 1.63 1.69 0.83 0.86 1.41 1.47
44.17% 44.38% 42.33% 42.60% 13.50% 13.02% 13.39% 13.87% 86.50% 86.98%
7 Rajrappa 19.82 19.82 2.37 2.40 1.3 1.27 3.02 3.02 2.02 2.02 0.80 0.94 4.47 4.61 6.34 6.31 3.67 3.67
53.02% 52.06% 29.08% 27.55% 17.90% 20.39% 31.99% 31.84% 82.10% 79.61%
8 Rohini 2.58 2.56 1.22 1.27 0.42 0.48 0.01 0.11 0.00 0.00 0.67 0.48 2.31 2.23 0.43 0.59 1.64 1.75
52.81% 56.95% 18.18% 21.52% 29.00% 21.52% 16.67% 23.05% 71.00% 78.48%
9 Purnadih 7.56 7.52 0.41 0.92 0.09 0.19 0.03 0.12 0.00 0.03 0.95 0.52 1.45 1.63 0.12 0.34 0.50 1.11
28.28% 56.44% 6.21% 11.66% 65.52% 31.90% 1.59% 4.52% 34.48% 68.10%
10 North Urimari 6.68 5.17 0.50 0.25 0.16 0.14 0.01 0.07 0.00 0.00 1.32 1.00 1.98 1.39 0.17 0.21 0.66 0.39
25.25% 17.99% 8.08% 10.07% 66.67% 71.94% 2.54% 4.06% 33.33% 28.06%
11 Tapin North 3.04 0.91 0.00 0.12 0.00 0.66 1.57 0.12 0.91
57.96% 0.00% 42.04% 3.95% 57.96%
12 Kathara 7.93 7.71 0.61 0.65 0.32 0.33 1.04 0.96 0.89 0.83 0.77 0.62 1.70 1.60 2.25 2.12 0.93 0.98
35.88% 40.63% 18.82% 20.63% 45.29% 38.75% 28.37% 27.50% 54.71% 61.25%
13 Karo 5.75 5.26 0.17 0.55 0.14 0.14 0.12 0.14 0.16 0.12 0.34 0.39 0.65 1.08 0.42 0.40 0.31 0.69
26.15% 50.93% 21.54% 12.96% 52.31% 36.11% 7.30% 7.60% 47.69% 63.89%
14 Konar Exp. 7.29 4.71 0.09 0.88 0.03 0.30 0.24 0.01 0.19 0.01 0.41 0.85 0.53 2.03 0.46 0.32 0.12 1.18
16.98% 43.35% 5.66% 14.78% 77.36% 41.87% 6.31% 6.79% 22.64% 58.13%
15 Sel Dhori 3.00 2.65 0.31 0.55 0.06 0.00 0.17 0.04 0.00 0.01 0.49 0.52 0.86 1.07 0.23 0.05 0.37 0.55
36.05% 51.40% 6.98% 0.00% 56.98% 48.60% 7.67% 1.89% 43.02% 51.40%
TOTAL 116.03 113.86 15.20 18.01 7.00 7.98 5.29 5.04 5.03 4.69 9.95 10.50 32.15 36.49 17.32 17.71 22.20 25.99
47.28% 49.36% 21.77% 21.87% 30.95% 28.78% 14.93% 15.55% 69.05% 71.22%
3
Area under
Backfilling
Social Forestry,
Avanue
Plantation Etc.
Plantation on
Excavated / Backfilled
Area
Other Plantations Total
Excavated
Area
PlantationTechnical
Reclamation
Plantation on
External
Over Burden
Biological Reclamation
11(=4+5)4 5
Table -1 Project wise Land Reclamation Status in Fifteen OC Projects of CCL based on Satellite Data of the Year 2021 (Projects producing more than 5 mcm of Coal + OB annaully) (Area in Sq. Kms.)(Area in Sq. Kms.)
Sl.
No.Project
6
Total Mine
Leasehold
Area
7 8
Area under
Active Mining
9 (=4+5+8)
(% is calculated with respected to Excavated Area as applicable)
10 (=5+6+7)
Total Area under
Reclamation
Total Area under
Plantation
(% Green Cover
Generated in
Leasehold)
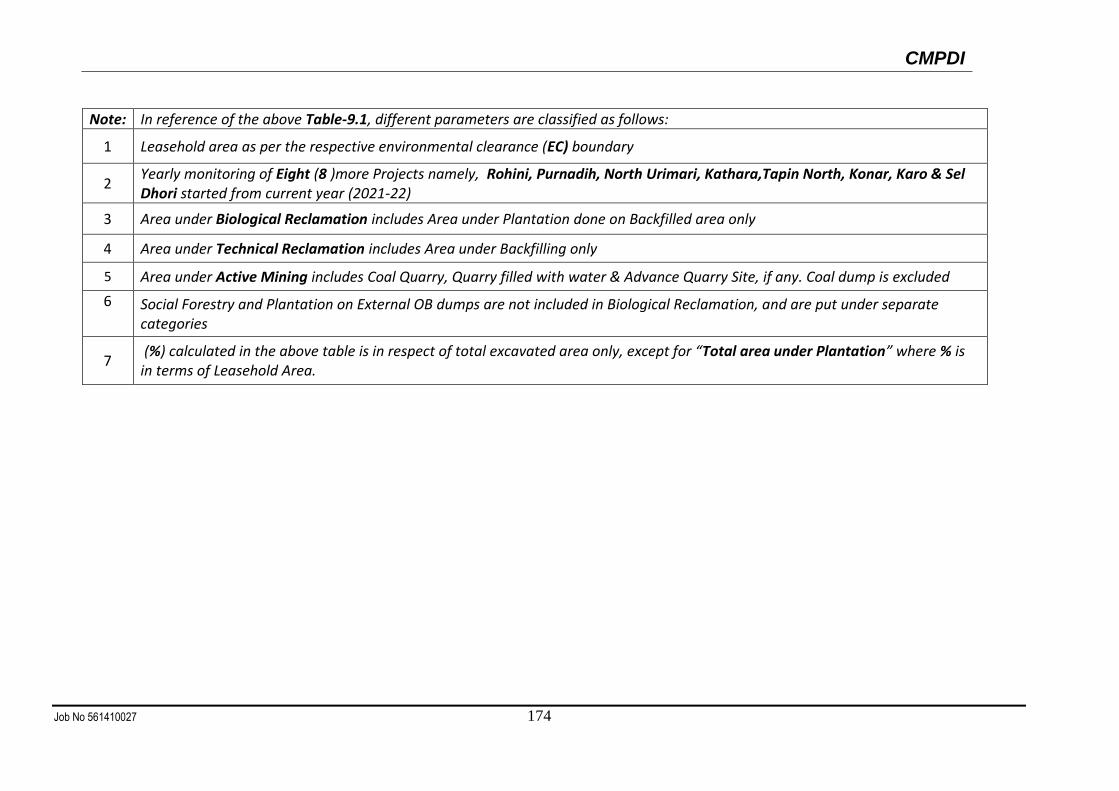
CMPDI
Job No 561410027 174
Note: In reference of the above Table-9.1, different parameters are classified as follows:
1 Leasehold area as per the respective environmental clearance (EC) boundary
2 Yearly monitoring of Eight (8 )more Projects namely, Rohini, Purnadih, North Urimari, Kathara,Tapin North, Konar, Karo & Sel Dhori started from current year (2021-22)
3 Area under Biological Reclamation includes Area under Plantation done on Backfilled area only
4 Area under Technical Reclamation includes Area under Backfilling only
5 Area under Active Mining includes Coal Quarry, Quarry filled with water & Advance Quarry Site, if any. Coal dump is excluded
6 Social Forestry and Plantation on External OB dumps are not included in Biological Reclamation, and are put under separate categories
7 (%) calculated in the above table is in respect of total excavated area only, except for “Total area under Plantation” where % is in terms of Leasehold Area.
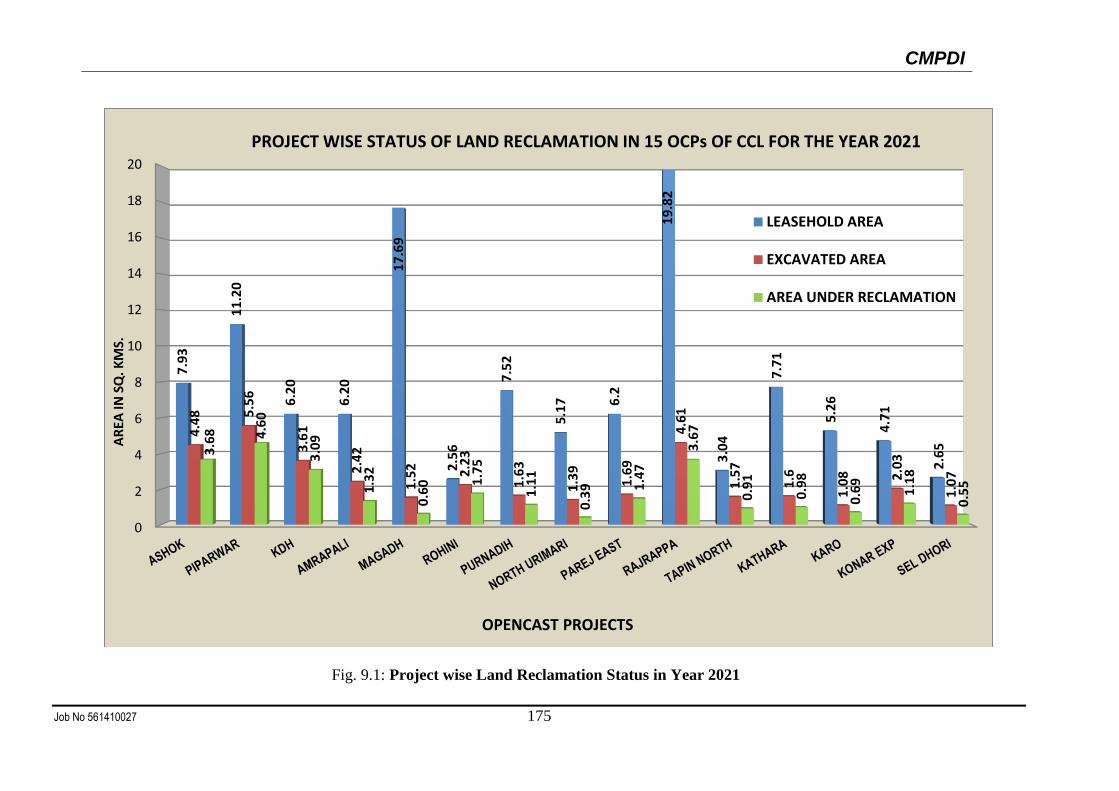
CMPDI
Job No 561410027 175
Fig. 9.1: Project wise Land Reclamation Status in Year 2021
0
2
4
6
8
10
12
14
16
18
207
.93
11
.20
6.2
0
6.2
0
17
.69
2.5
6
7.5
2
5.1
7 6.2
19
.82
3.0
4
7.7
1
5.2
6
4.7
1
2.6
5
4.4
8 5.5
6
3.6
1
2.4
2
1.5
2 2.2
3
1.6
3
1.3
9
1.6
9
4.6
1
1.5
7
1.6
1.0
8 2.0
3
1.0
7
3.6
8 4.6
0
3.0
9
1.3
2
0.6
0 1.7
5
1.1
1
0.3
9 1.4
7
3.6
7
0.9
1
0.9
8
0.6
9
1.1
8
0.5
5
LEASEHOLD AREA
EXCAVATED AREA
AREA UNDER RECLAMATION
OPENCAST PROJECTS
AR
EA IN
SQ
. KM
S.
PROJECT WISE STATUS OF LAND RECLAMATION IN 15 OCPs OF CCL FOR THE YEAR 2021
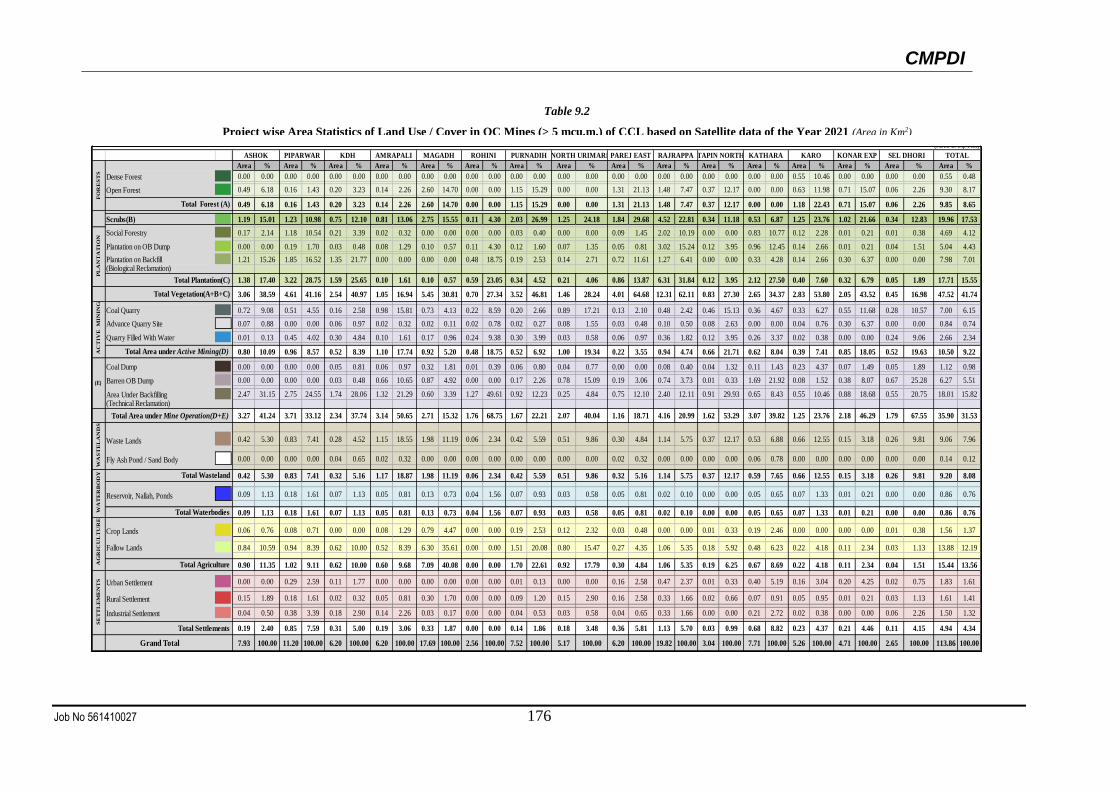
CMPDI
Job No 561410027 176
Area % Area % Area % Area % Area % Area % Area % Area % Area % Area % Area % Area % Area % Area % Area % Area %
Dense Forest 0.00 0.00 0.00 0.00 0.00 0.00 0.00 0.00 0.00 0.00 0.00 0.00 0.00 0.00 0.00 0.00 0.00 0.00 0.00 0.00 0.00 0.00 0.00 0.00 0.55 10.46 0.00 0.00 0.00 0.00 0.55 0.48
Open Forest 0.49 6.18 0.16 1.43 0.20 3.23 0.14 2.26 2.60 14.70 0.00 0.00 1.15 15.29 0.00 0.00 1.31 21.13 1.48 7.47 0.37 12.17 0.00 0.00 0.63 11.98 0.71 15.07 0.06 2.26 9.30 8.17
0.49 6.18 0.16 1.43 0.20 3.23 0.14 2.26 2.60 14.70 0.00 0.00 1.15 15.29 0.00 0.00 1.31 21.13 1.48 7.47 0.37 12.17 0.00 0.00 1.18 22.43 0.71 15.07 0.06 2.26 9.85 8.65
Scrubs(B) 1.19 15.01 1.23 10.98 0.75 12.10 0.81 13.06 2.75 15.55 0.11 4.30 2.03 26.99 1.25 24.18 1.84 29.68 4.52 22.81 0.34 11.18 0.53 6.87 1.25 23.76 1.02 21.66 0.34 12.83 19.96 17.53
Social Forestry 0.17 2.14 1.18 10.54 0.21 3.39 0.02 0.32 0.00 0.00 0.00 0.00 0.03 0.40 0.00 0.00 0.09 1.45 2.02 10.19 0.00 0.00 0.83 10.77 0.12 2.28 0.01 0.21 0.01 0.38 4.69 4.12
Plantation on OB Dump 0.00 0.00 0.19 1.70 0.03 0.48 0.08 1.29 0.10 0.57 0.11 4.30 0.12 1.60 0.07 1.35 0.05 0.81 3.02 15.24 0.12 3.95 0.96 12.45 0.14 2.66 0.01 0.21 0.04 1.51 5.04 4.43
Plantation on Backfill 1.21 15.26 1.85 16.52 1.35 21.77 0.00 0.00 0.00 0.00 0.48 18.75 0.19 2.53 0.14 2.71 0.72 11.61 1.27 6.41 0.00 0.00 0.33 4.28 0.14 2.66 0.30 6.37 0.00 0.00 7.98 7.01(Biological Reclamation)
1.38 17.40 3.22 28.75 1.59 25.65 0.10 1.61 0.10 0.57 0.59 23.05 0.34 4.52 0.21 4.06 0.86 13.87 6.31 31.84 0.12 3.95 2.12 27.50 0.40 7.60 0.32 6.79 0.05 1.89 17.71 15.55
3.06 38.59 4.61 41.16 2.54 40.97 1.05 16.94 5.45 30.81 0.70 27.34 3.52 46.81 1.46 28.24 4.01 64.68 12.31 62.11 0.83 27.30 2.65 34.37 2.83 53.80 2.05 43.52 0.45 16.98 47.52 41.74
Coal Quarry 0.72 9.08 0.51 4.55 0.16 2.58 0.98 15.81 0.73 4.13 0.22 8.59 0.20 2.66 0.89 17.21 0.13 2.10 0.48 2.42 0.46 15.13 0.36 4.67 0.33 6.27 0.55 11.68 0.28 10.57 7.00 6.15
Advance Quarry Site 0.07 0.88 0.00 0.00 0.06 0.97 0.02 0.32 0.02 0.11 0.02 0.78 0.02 0.27 0.08 1.55 0.03 0.48 0.10 0.50 0.08 2.63 0.00 0.00 0.04 0.76 0.30 6.37 0.00 0.00 0.84 0.74
Quarry Filled With Water 0.01 0.13 0.45 4.02 0.30 4.84 0.10 1.61 0.17 0.96 0.24 9.38 0.30 3.99 0.03 0.58 0.06 0.97 0.36 1.82 0.12 3.95 0.26 3.37 0.02 0.38 0.00 0.00 0.24 9.06 2.66 2.34
0.80 10.09 0.96 8.57 0.52 8.39 1.10 17.74 0.92 5.20 0.48 18.75 0.52 6.92 1.00 19.34 0.22 3.55 0.94 4.74 0.66 21.71 0.62 8.04 0.39 7.41 0.85 18.05 0.52 19.63 10.50 9.22
Coal Dump 0.00 0.00 0.00 0.00 0.05 0.81 0.06 0.97 0.32 1.81 0.01 0.39 0.06 0.80 0.04 0.77 0.00 0.00 0.08 0.40 0.04 1.32 0.11 1.43 0.23 4.37 0.07 1.49 0.05 1.89 1.12 0.98
Barren OB Dump 0.00 0.00 0.00 0.00 0.03 0.48 0.66 10.65 0.87 4.92 0.00 0.00 0.17 2.26 0.78 15.09 0.19 3.06 0.74 3.73 0.01 0.33 1.69 21.92 0.08 1.52 0.38 8.07 0.67 25.28 6.27 5.51
Area Under Backfilling 2.47 31.15 2.75 24.55 1.74 28.06 1.32 21.29 0.60 3.39 1.27 49.61 0.92 12.23 0.25 4.84 0.75 12.10 2.40 12.11 0.91 29.93 0.65 8.43 0.55 10.46 0.88 18.68 0.55 20.75 18.01 15.82(Technical Reclamation)
3.27 41.24 3.71 33.12 2.34 37.74 3.14 50.65 2.71 15.32 1.76 68.75 1.67 22.21 2.07 40.04 1.16 18.71 4.16 20.99 1.62 53.29 3.07 39.82 1.25 23.76 2.18 46.29 1.79 67.55 35.90 31.53
Waste Lands 0.42 5.30 0.83 7.41 0.28 4.52 1.15 18.55 1.98 11.19 0.06 2.34 0.42 5.59 0.51 9.86 0.30 4.84 1.14 5.75 0.37 12.17 0.53 6.88 0.66 12.55 0.15 3.18 0.26 9.81 9.06 7.96
Fly Ash Pond / Sand Body 0.00 0.00 0.00 0.00 0.04 0.65 0.02 0.32 0.00 0.00 0.00 0.00 0.00 0.00 0.00 0.00 0.02 0.32 0.00 0.00 0.00 0.00 0.06 0.78 0.00 0.00 0.00 0.00 0.00 0.00 0.14 0.12
0.42 5.30 0.83 7.41 0.32 5.16 1.17 18.87 1.98 11.19 0.06 2.34 0.42 5.59 0.51 9.86 0.32 5.16 1.14 5.75 0.37 12.17 0.59 7.65 0.66 12.55 0.15 3.18 0.26 9.81 9.20 8.08
Reservoir, Nallah, Ponds 0.09 1.13 0.18 1.61 0.07 1.13 0.05 0.81 0.13 0.73 0.04 1.56 0.07 0.93 0.03 0.58 0.05 0.81 0.02 0.10 0.00 0.00 0.05 0.65 0.07 1.33 0.01 0.21 0.00 0.00 0.86 0.76
0.09 1.13 0.18 1.61 0.07 1.13 0.05 0.81 0.13 0.73 0.04 1.56 0.07 0.93 0.03 0.58 0.05 0.81 0.02 0.10 0.00 0.00 0.05 0.65 0.07 1.33 0.01 0.21 0.00 0.00 0.86 0.76
Crop Lands 0.06 0.76 0.08 0.71 0.00 0.00 0.08 1.29 0.79 4.47 0.00 0.00 0.19 2.53 0.12 2.32 0.03 0.48 0.00 0.00 0.01 0.33 0.19 2.46 0.00 0.00 0.00 0.00 0.01 0.38 1.56 1.37
Fallow Lands 0.84 10.59 0.94 8.39 0.62 10.00 0.52 8.39 6.30 35.61 0.00 0.00 1.51 20.08 0.80 15.47 0.27 4.35 1.06 5.35 0.18 5.92 0.48 6.23 0.22 4.18 0.11 2.34 0.03 1.13 13.88 12.19
0.90 11.35 1.02 9.11 0.62 10.00 0.60 9.68 7.09 40.08 0.00 0.00 1.70 22.61 0.92 17.79 0.30 4.84 1.06 5.35 0.19 6.25 0.67 8.69 0.22 4.18 0.11 2.34 0.04 1.51 15.44 13.56
Urban Settlement 0.00 0.00 0.29 2.59 0.11 1.77 0.00 0.00 0.00 0.00 0.00 0.00 0.01 0.13 0.00 0.00 0.16 2.58 0.47 2.37 0.01 0.33 0.40 5.19 0.16 3.04 0.20 4.25 0.02 0.75 1.83 1.61
Rural Settlement 0.15 1.89 0.18 1.61 0.02 0.32 0.05 0.81 0.30 1.70 0.00 0.00 0.09 1.20 0.15 2.90 0.16 2.58 0.33 1.66 0.02 0.66 0.07 0.91 0.05 0.95 0.01 0.21 0.03 1.13 1.61 1.41
Industrial Settlement 0.04 0.50 0.38 3.39 0.18 2.90 0.14 2.26 0.03 0.17 0.00 0.00 0.04 0.53 0.03 0.58 0.04 0.65 0.33 1.66 0.00 0.00 0.21 2.72 0.02 0.38 0.00 0.00 0.06 2.26 1.50 1.32
0.19 2.40 0.85 7.59 0.31 5.00 0.19 3.06 0.33 1.87 0.00 0.00 0.14 1.86 0.18 3.48 0.36 5.81 1.13 5.70 0.03 0.99 0.68 8.82 0.23 4.37 0.21 4.46 0.11 4.15 4.94 4.34
Grand Total 7.93 100.00 11.20 100.00 6.20 100.00 6.20 100.00 17.69 100.00 2.56 100.00 7.52 100.00 5.17 100.00 6.20 100.00 19.82 100.00 3.04 100.00 7.71 100.00 5.26 100.00 4.71 100.00 2.65 100.00 113.86 100.00
TABLE - 2
Project wise Area Statistics of Land Use/ Cover Classes in OC Mines(> 5 m.cu.m) of CCL based on Satellite data of the Year 2021 (Area in Sq. Km)
ASHOK PIPARWAR KDH AMRAPALI MAGADH ROHINI PURNADIH
(E)
KONAR EXP SEL DHORI TOTAL
FO
RE
ST
S
Total Forest (A)
NORTH URIMARI PAREJ EAST RAJRAPPA TAPIN NORTH KATHARA KARO
PL
AN
TA
TIO
N
Total Plantation(C)
Total Vegetation(A+B+C)
AC
TIV
E
MIN
IN
G
Total Area under Active Mining(D)
SE
TT
LE
ME
NT
S
Total Settlements
Total Area under Mine Operation(D+E)
WA
ST
EL
AN
DS
WA
TE
RB
OD
Y Total Wasteland
Total Waterbodies
AG
RIC
UL
TU
RE
Total Agriculture
Table 9.2
Project wise Area Statistics of Land Use / Cover in OC Mines (> 5 mcu.m.) of CCL based on Satellite data of the Year 2021 (Area in Km2)
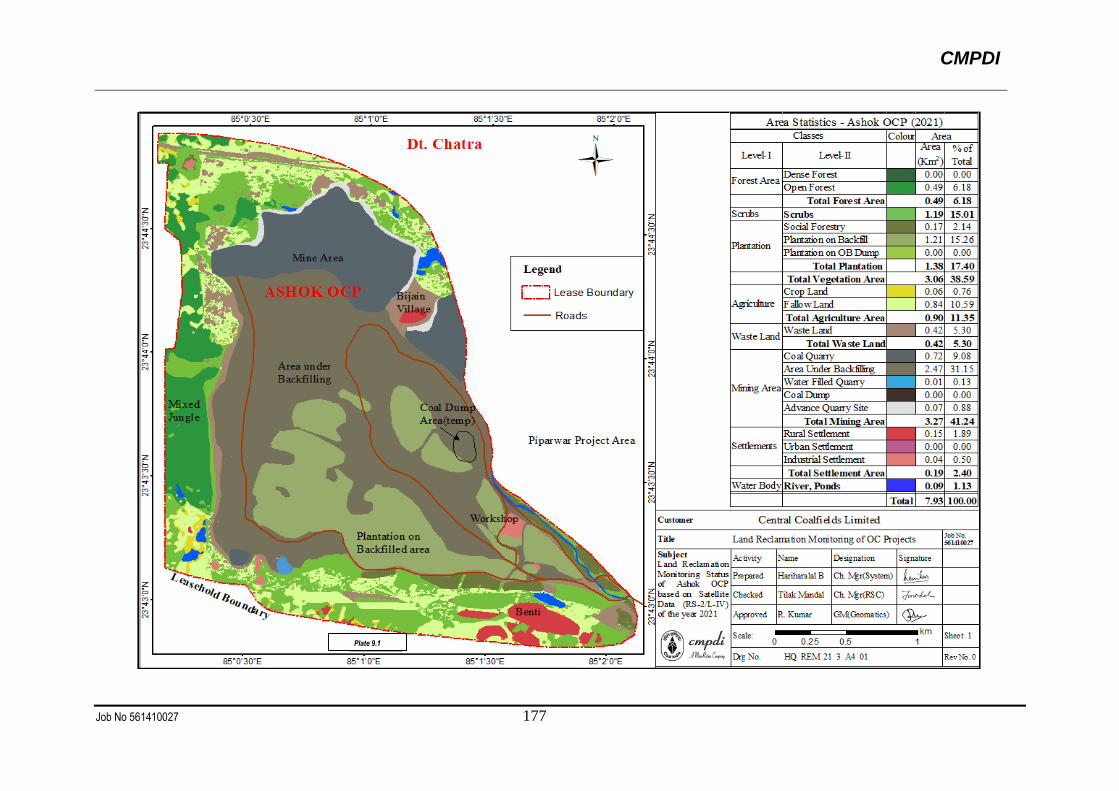
CMPDI
Job No 561410027 177
Plate 9.1
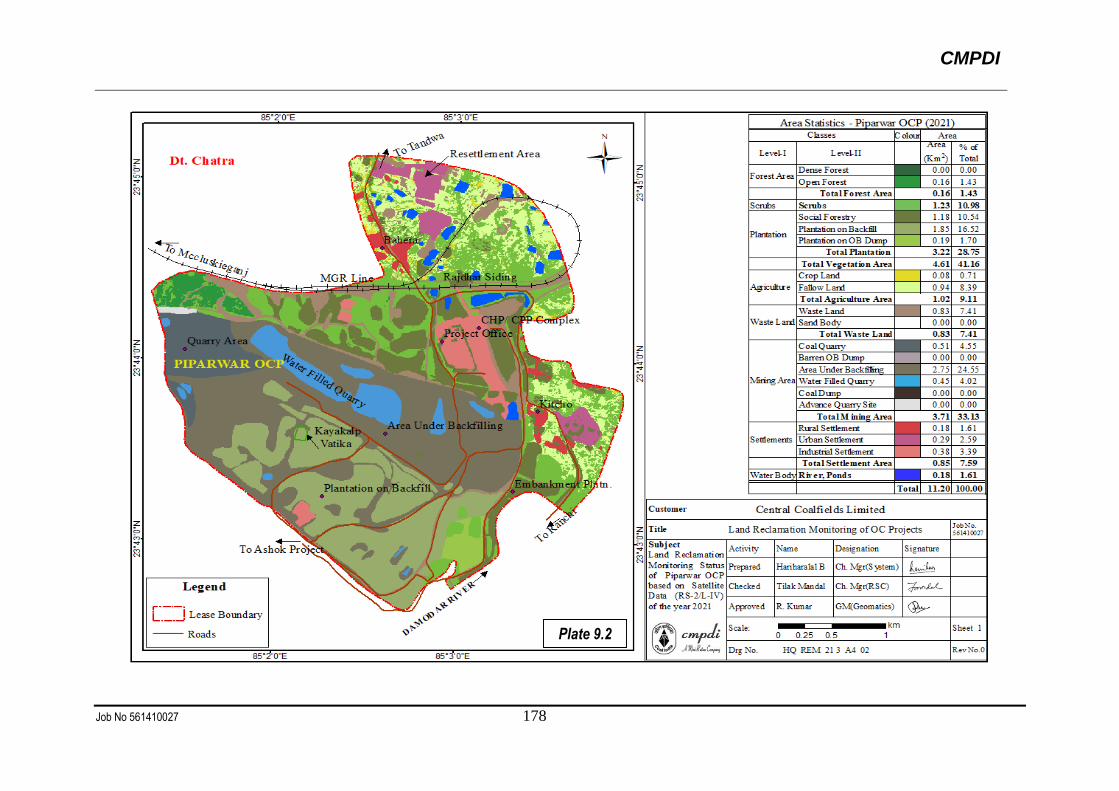
CMPDI
Job No 561410027 178
Plate 9.2
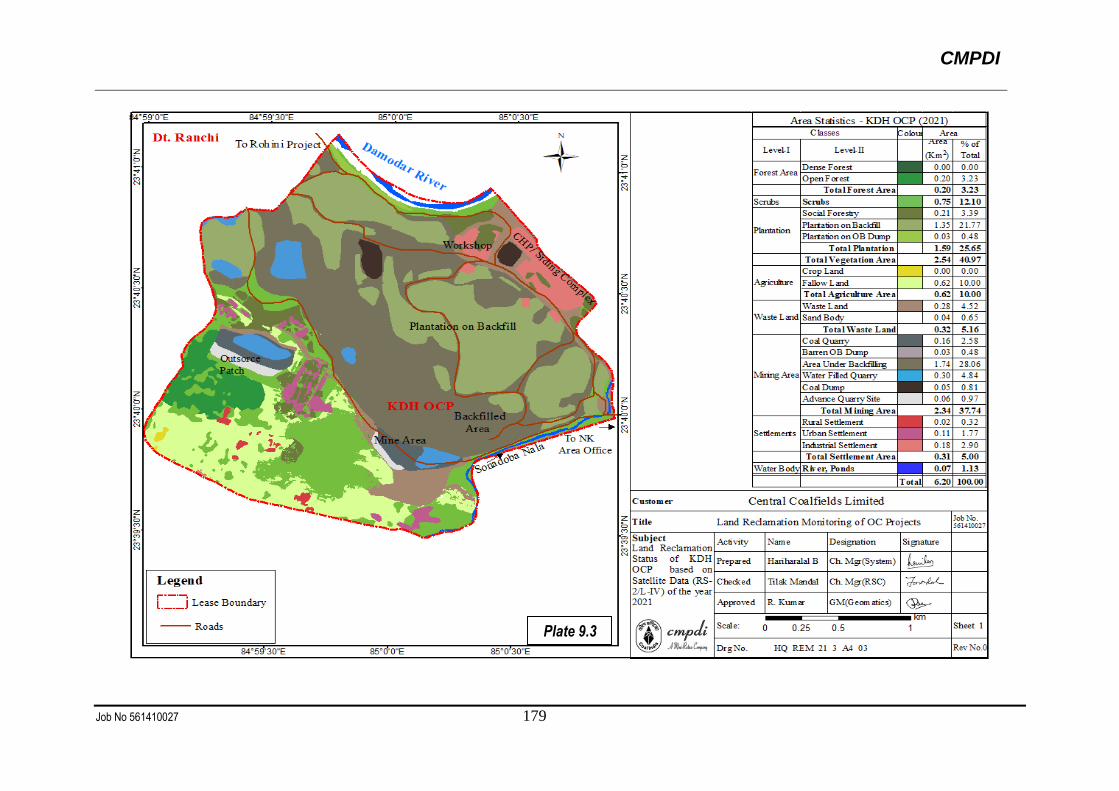
CMPDI
Job No 561410027 179
Plate 9.3
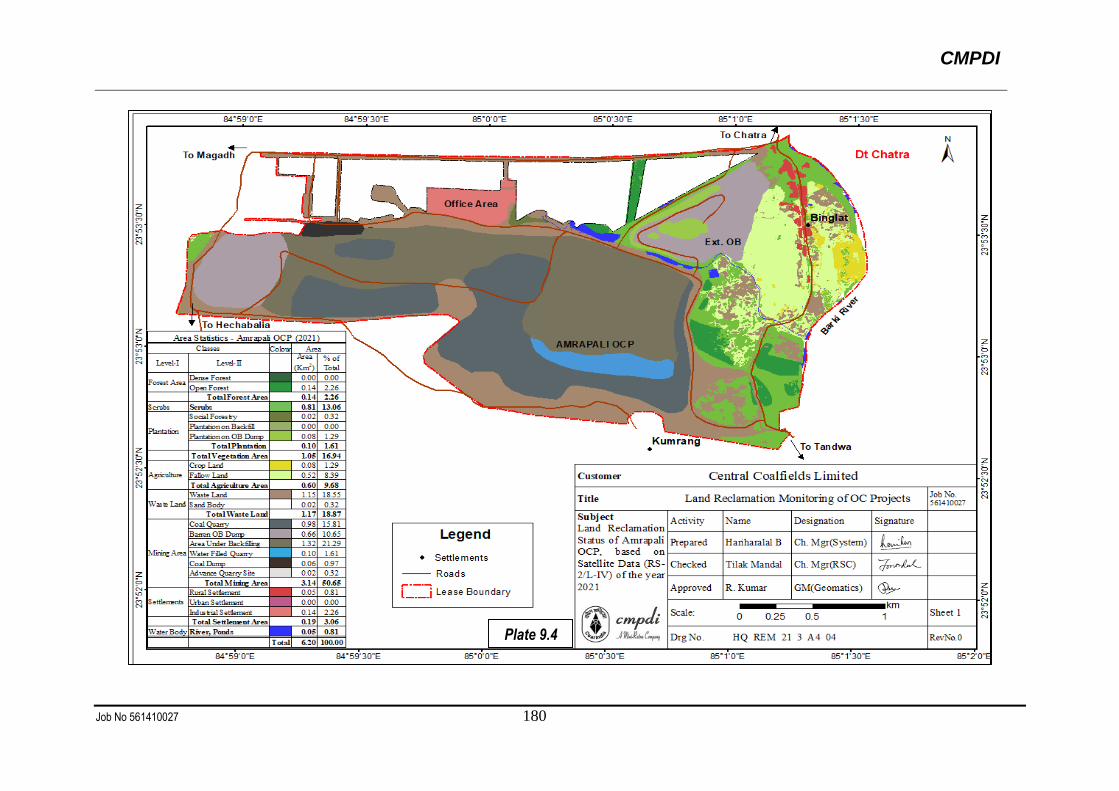
CMPDI
Job No 561410027 180
Plate 9.4
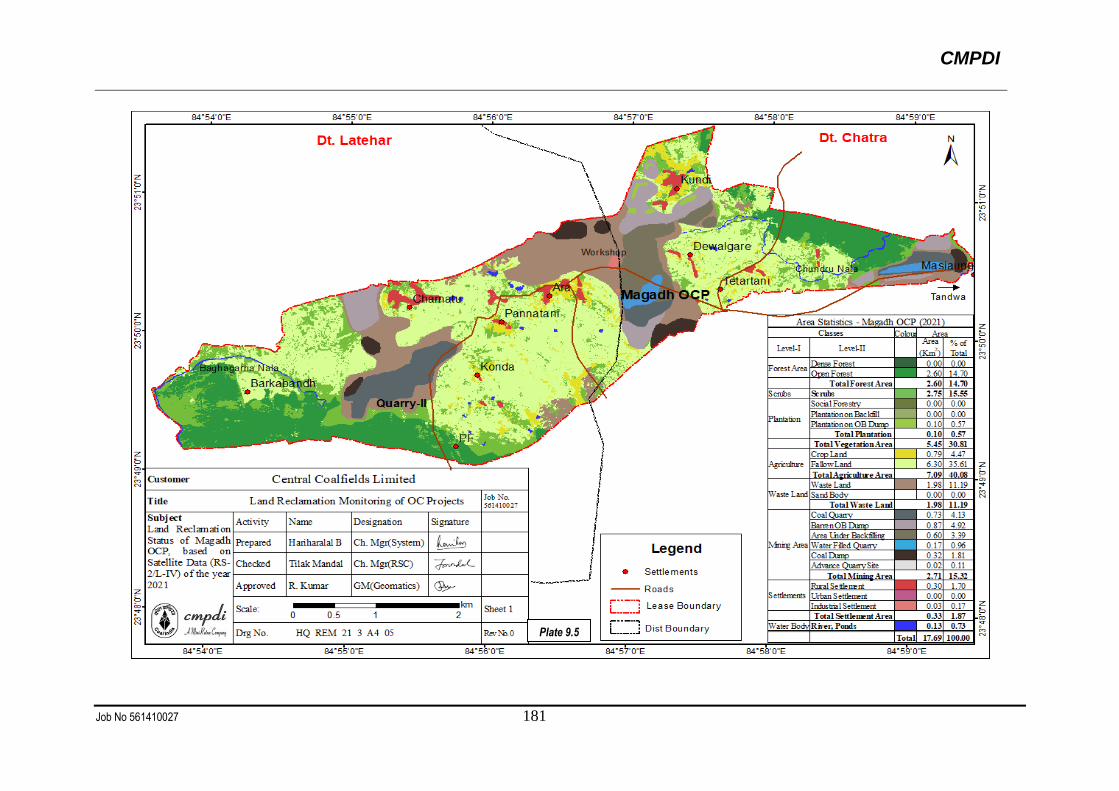
CMPDI
Job No 561410027 181
Plate 9.5
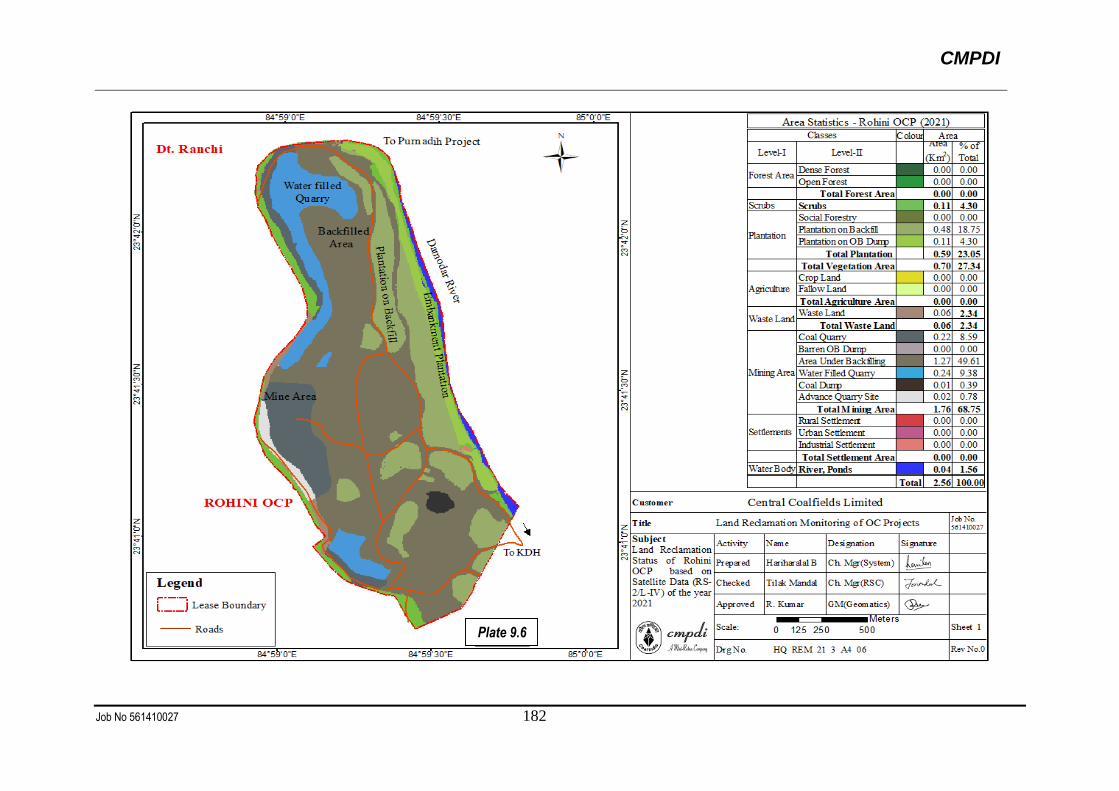
CMPDI
Job No 561410027 182
Plate 9.6
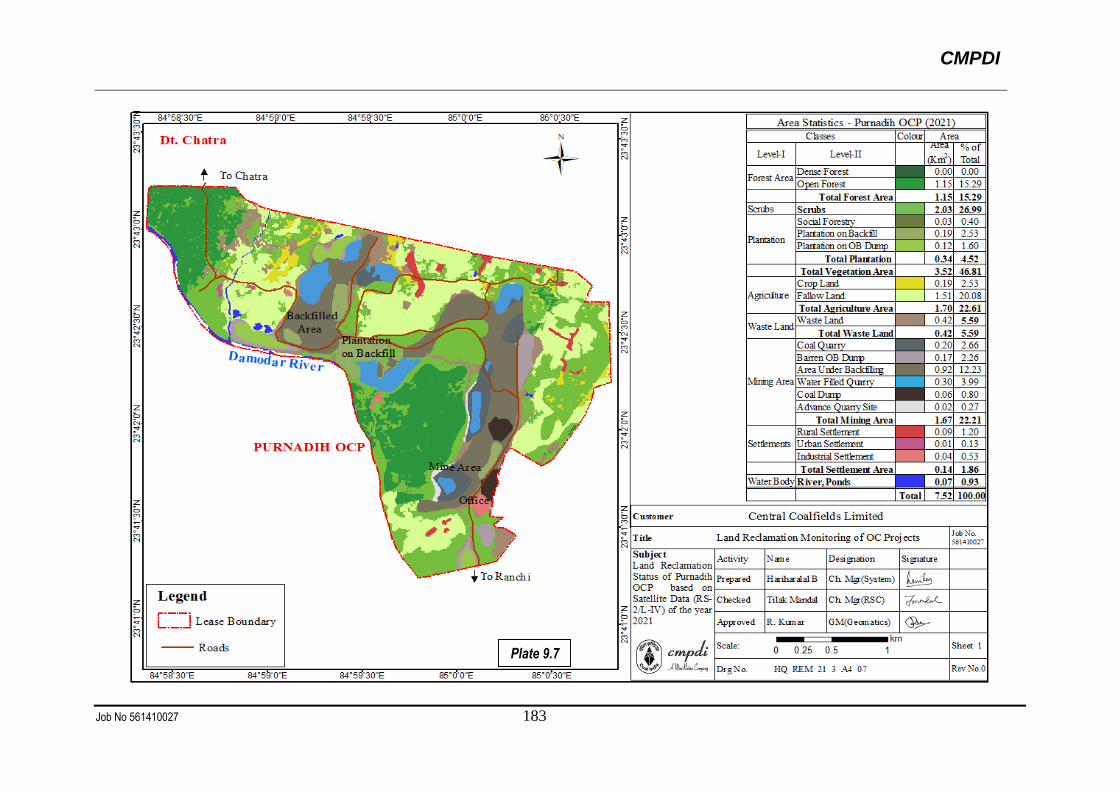
CMPDI
Job No 561410027 183
Plate 9.7
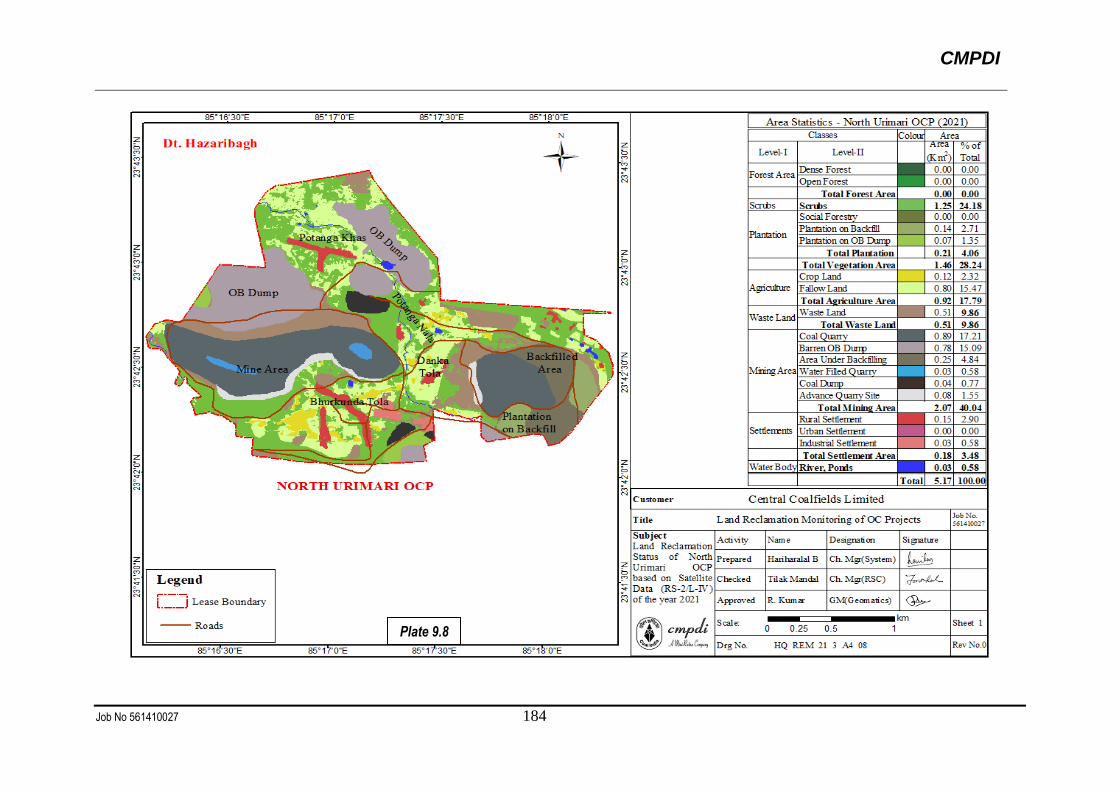
CMPDI
Job No 561410027 184
Plate 9.8
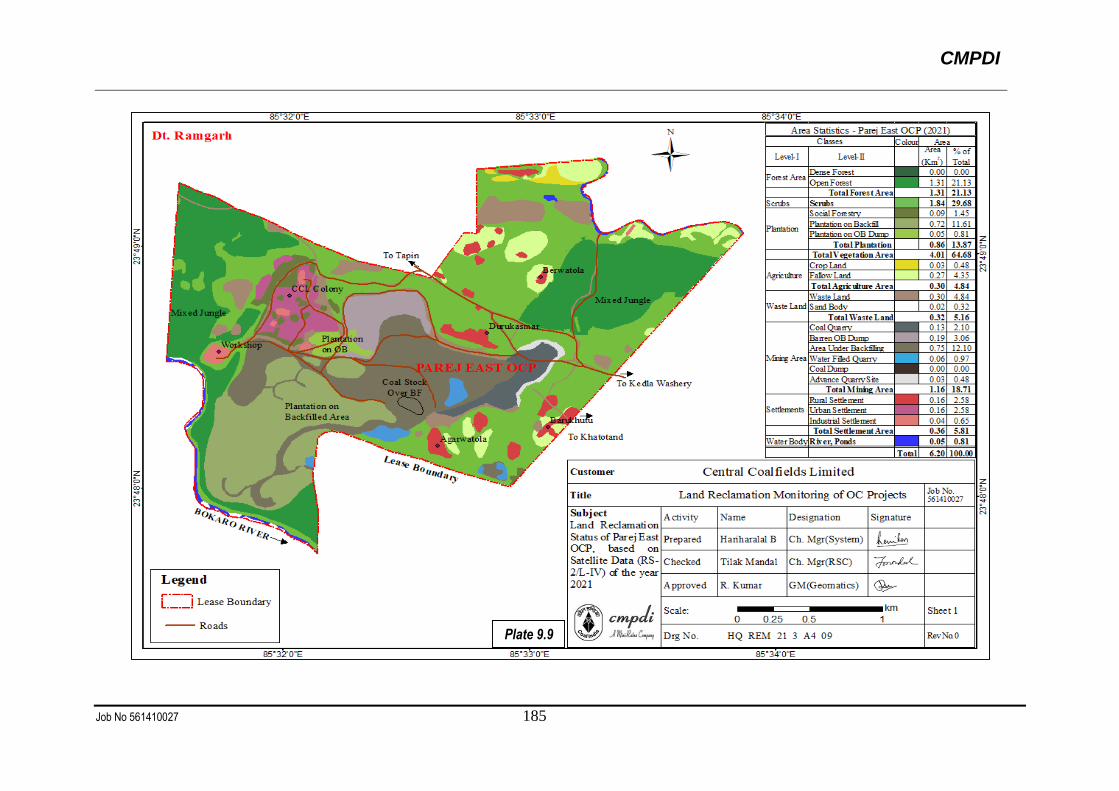
CMPDI
Job No 561410027 185
Plate 9.9
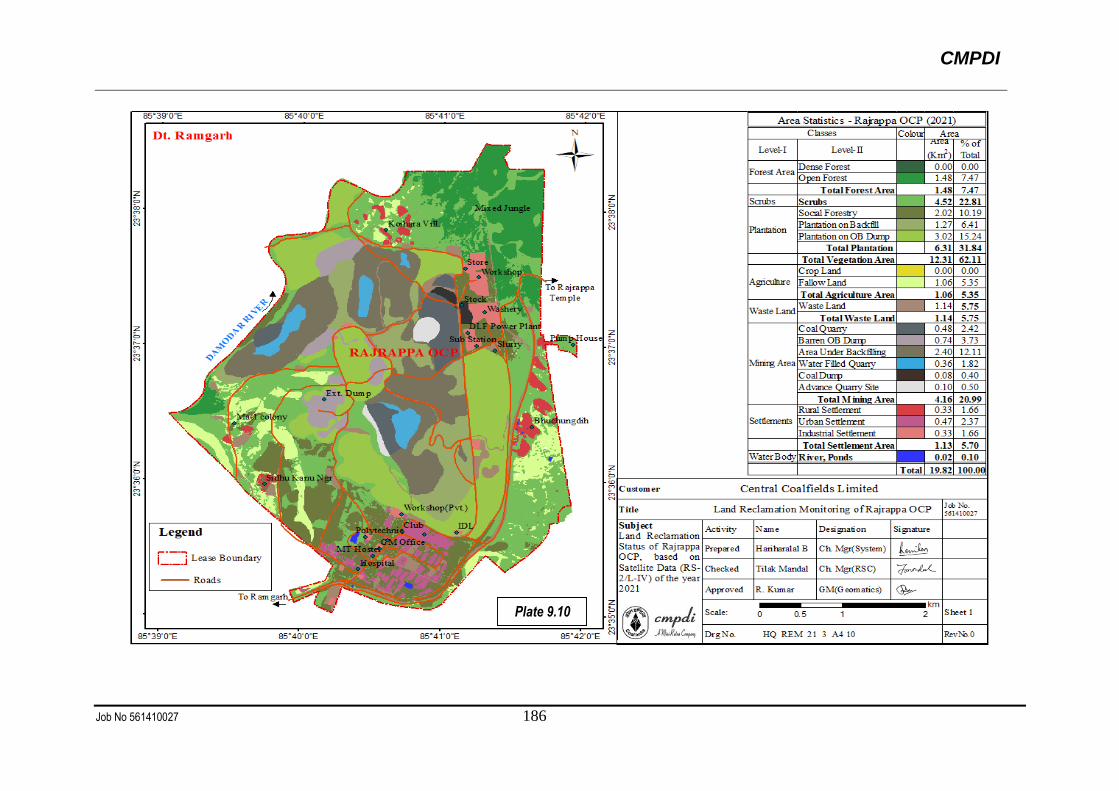
CMPDI
Job No 561410027 186
Plate 9.10
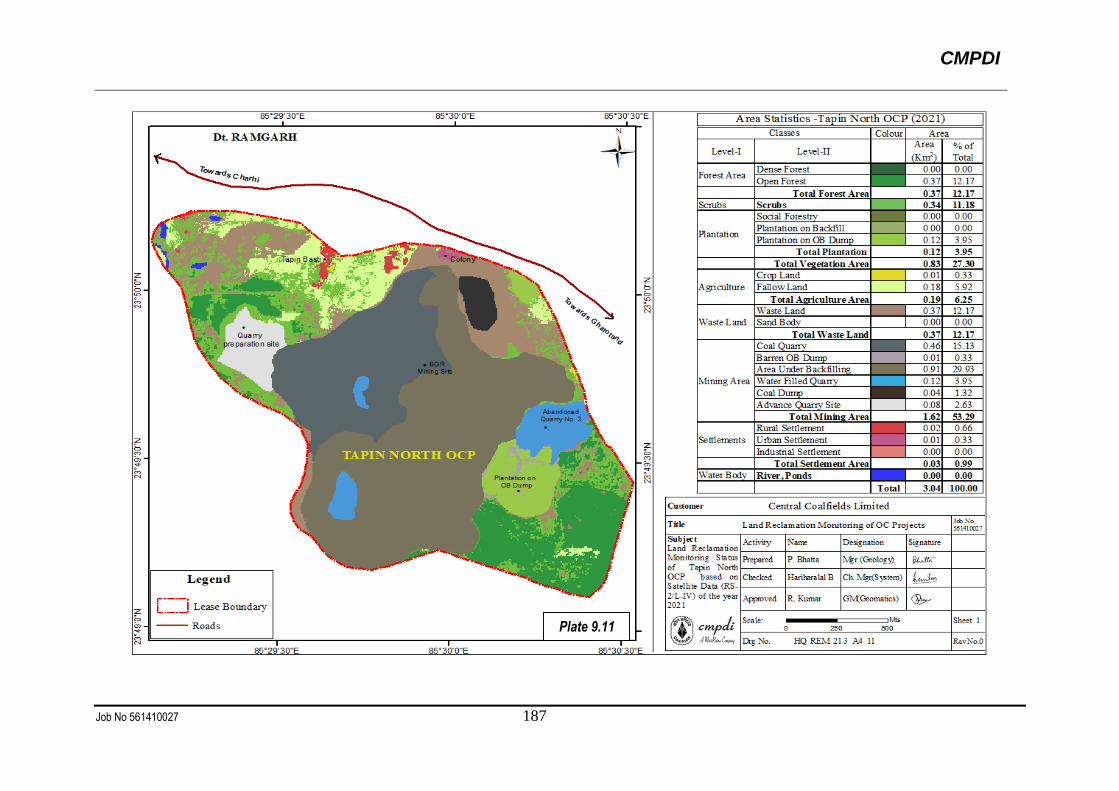
CMPDI
Job No 561410027 187
Plate 9.11
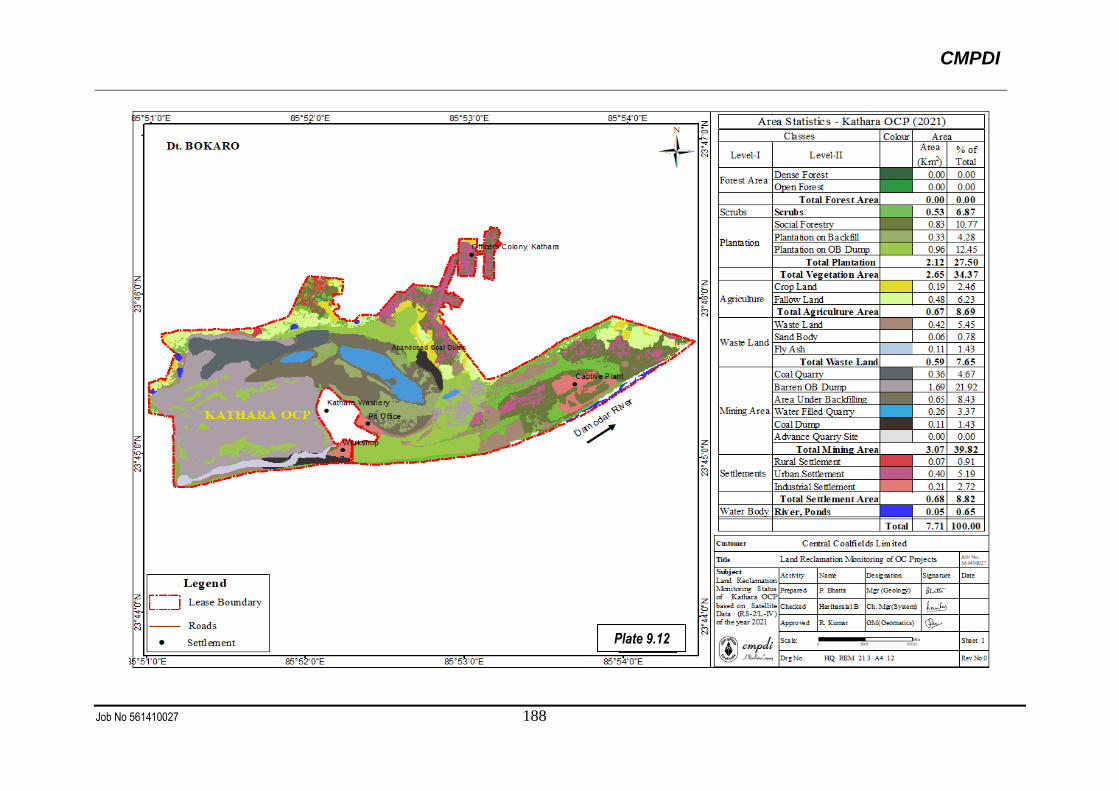
CMPDI
Job No 561410027 188
Plate 9.12
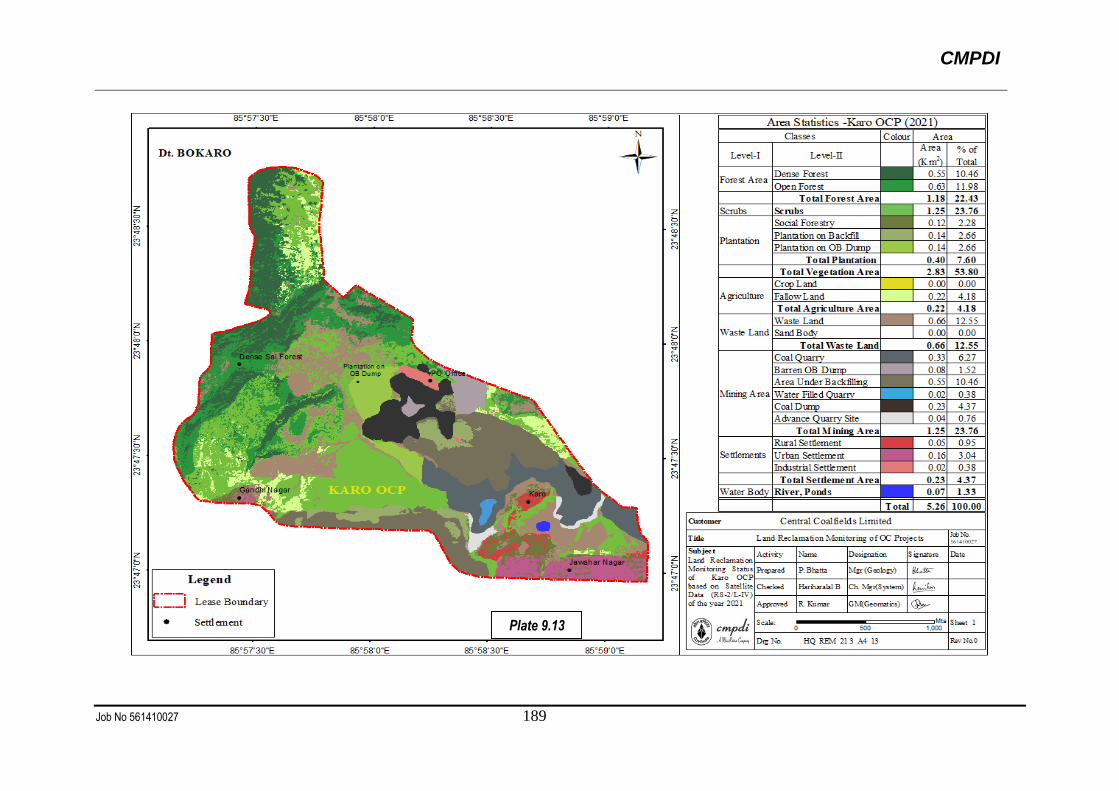
CMPDI
Job No 561410027 189
Plate 9.13
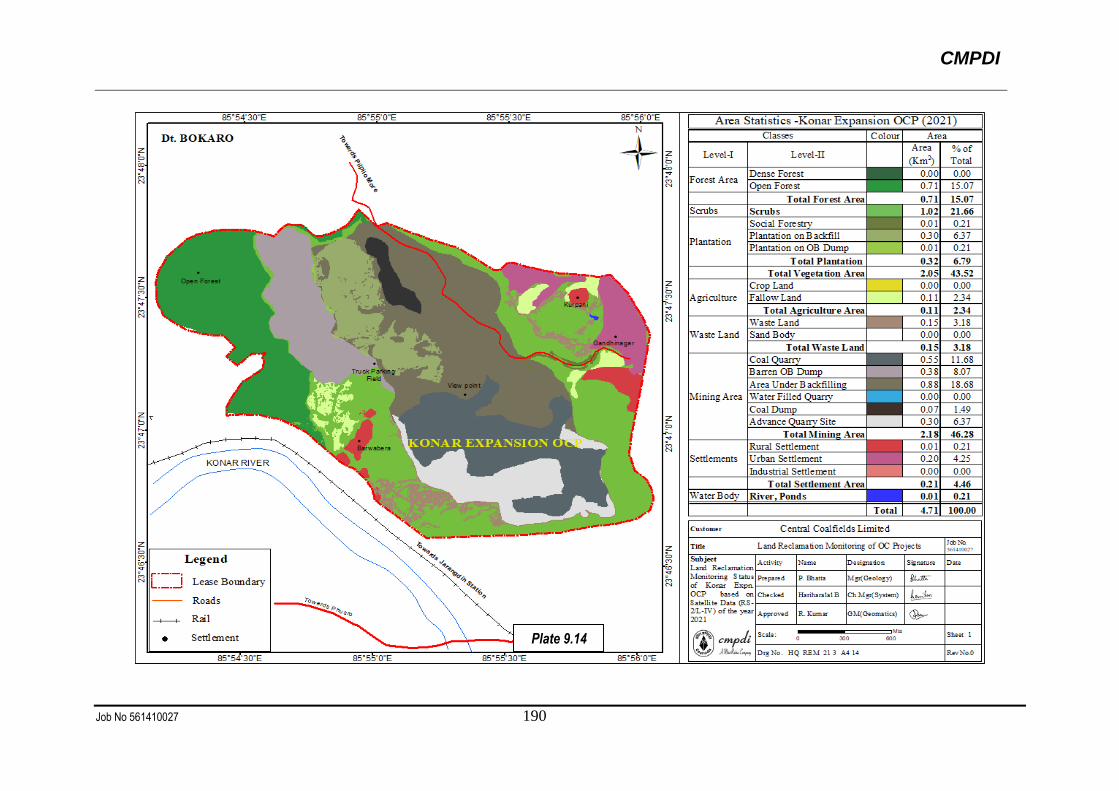
CMPDI
Job No 561410027 190
Plate 9.14
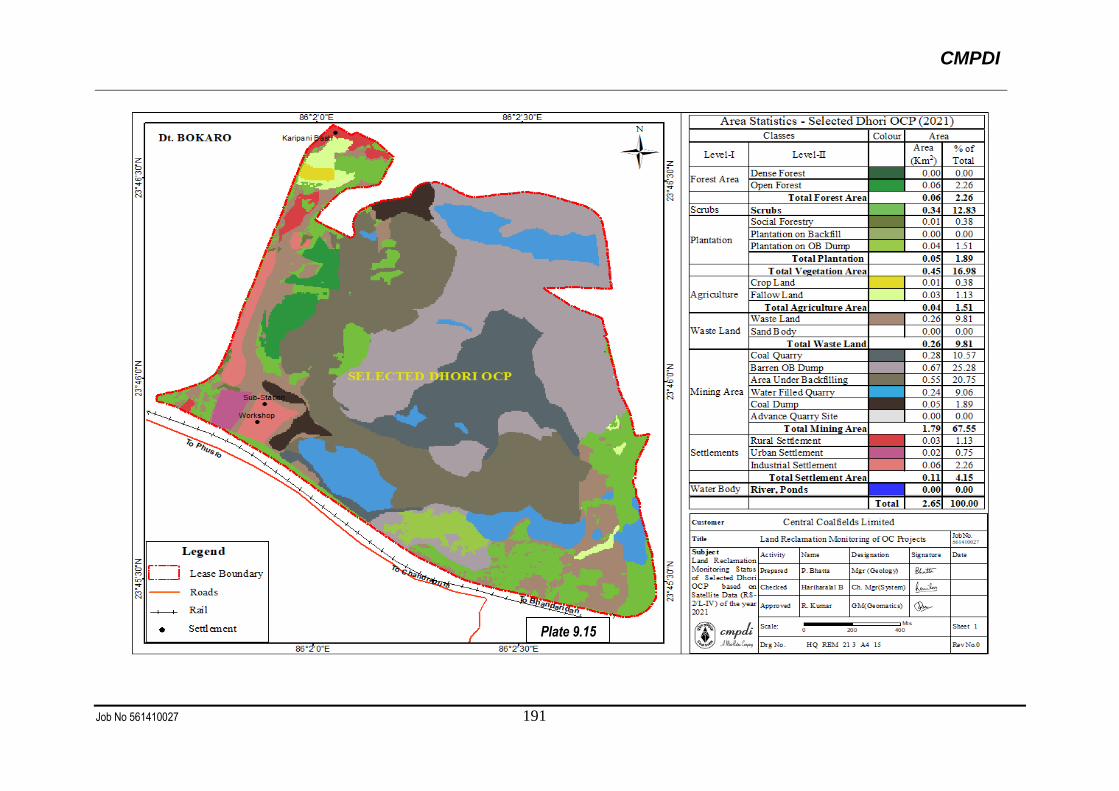
CMPDI
Job No 561410027 191
Plate 9.15
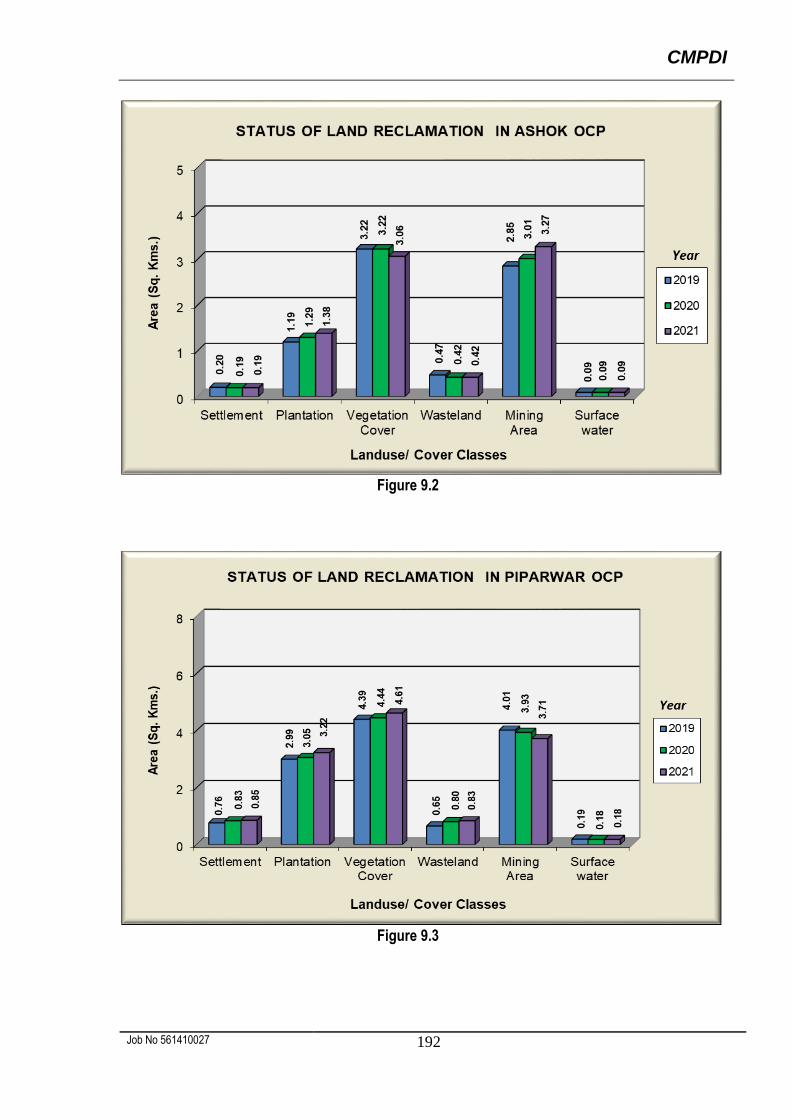
CMPDI
Job No 561410027 192
Figure 9.2
Figure 9.3
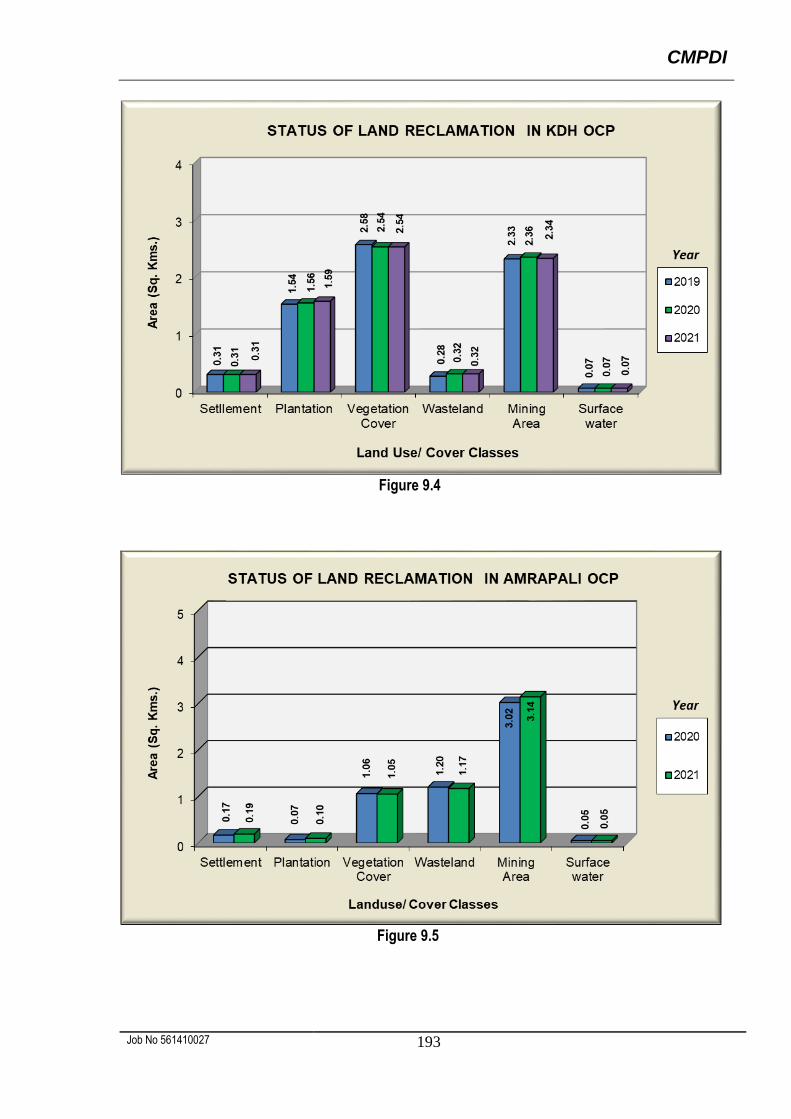
CMPDI
Job No 561410027 193
Figure 9.4
Figure 9.5
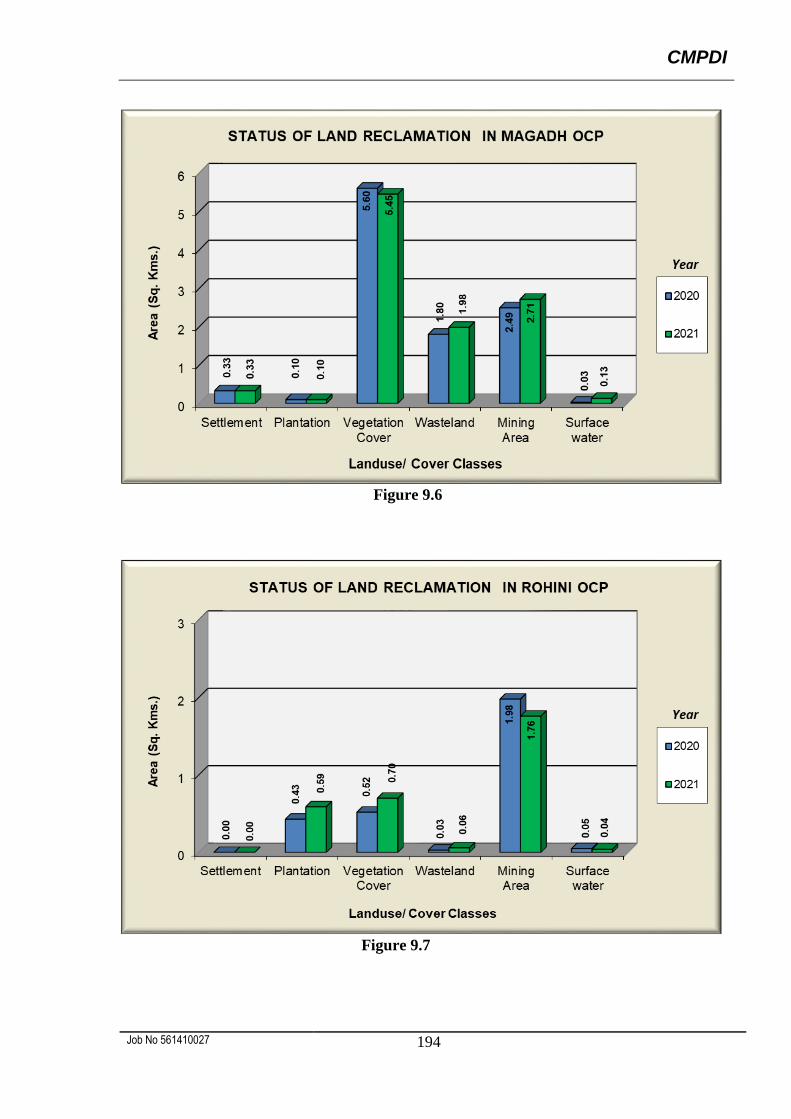
CMPDI
Job No 561410027 194
Figure 9.6
Figure 9.7
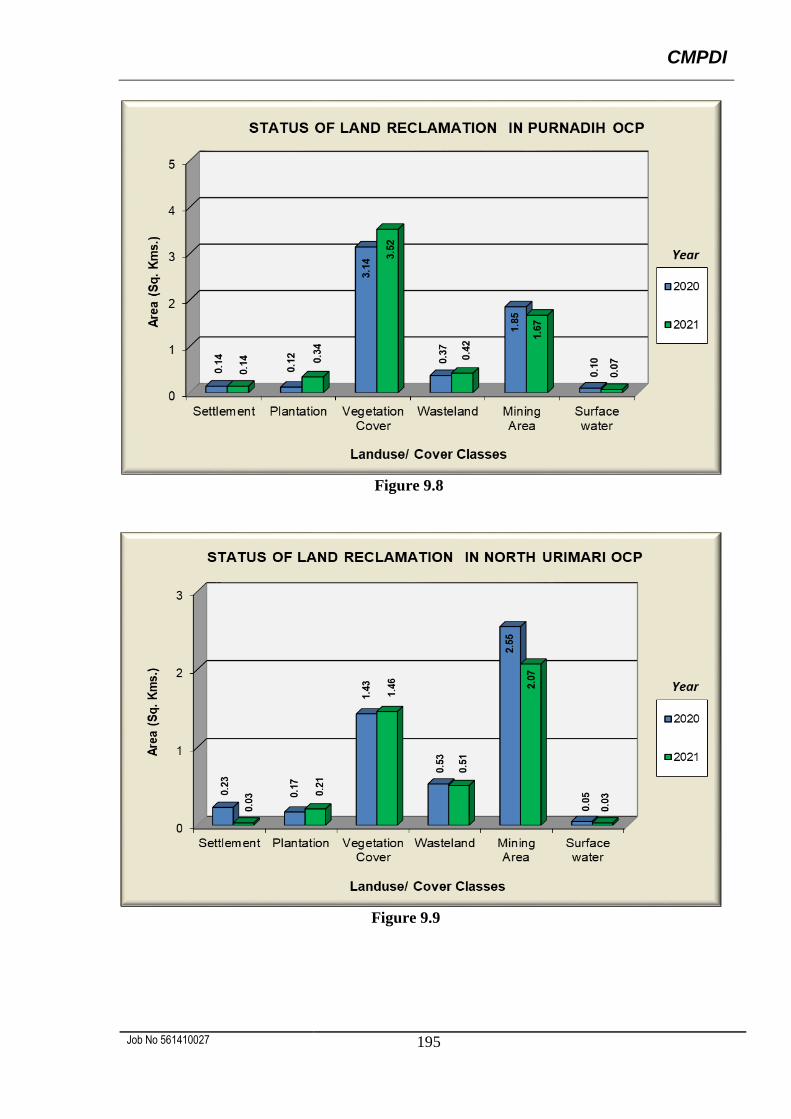
CMPDI
Job No 561410027 195
Figure 9.8
Figure 9.9
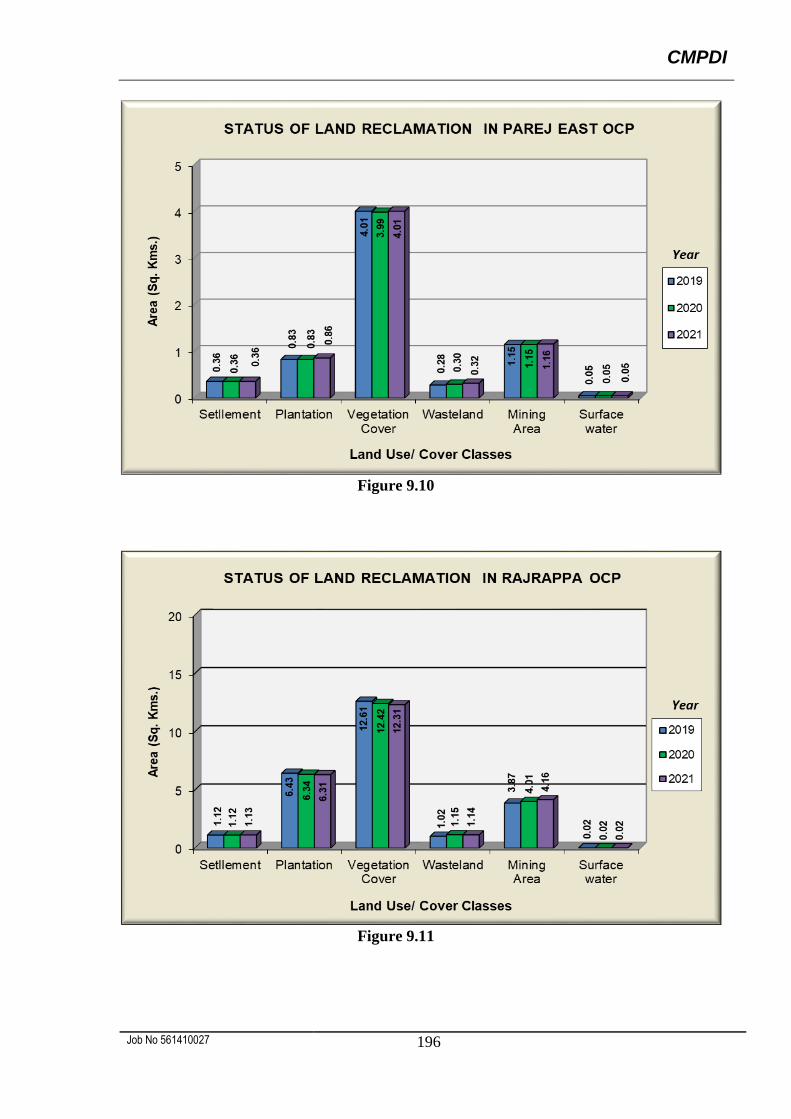
CMPDI
Job No 561410027 196
Figure 9.10
Figure 9.11
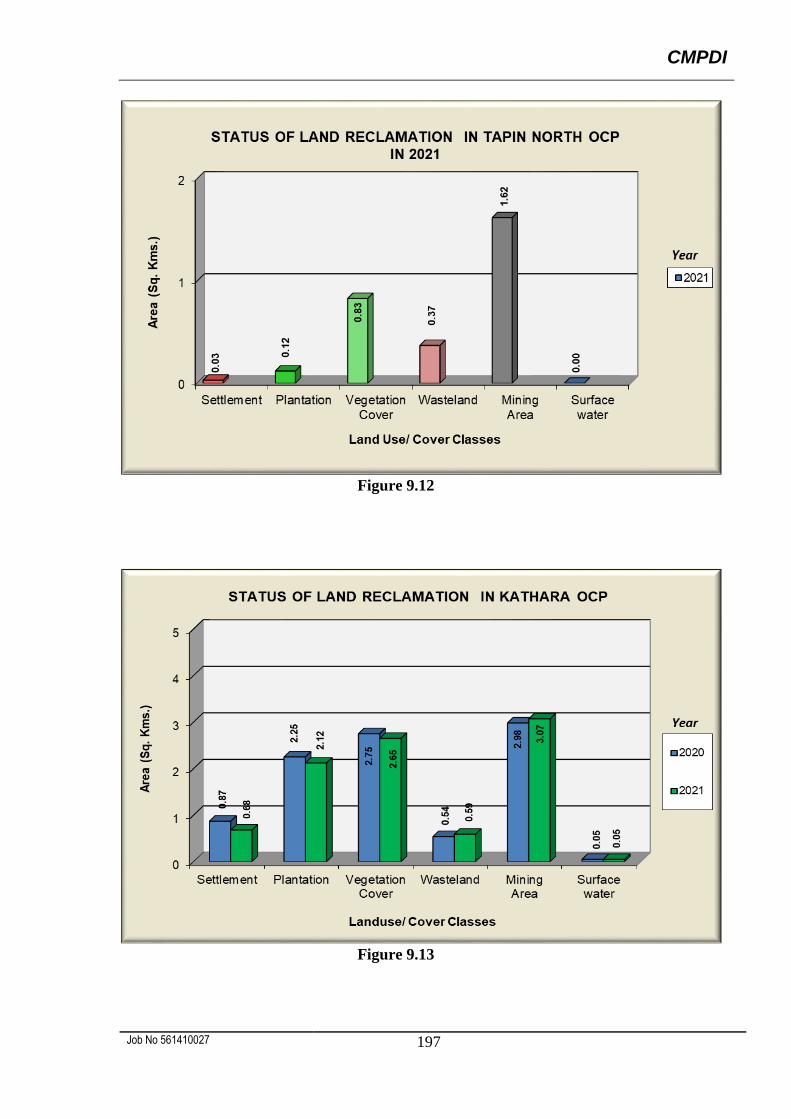
CMPDI
Job No 561410027 197
Figure 9.12
Figure 9.13
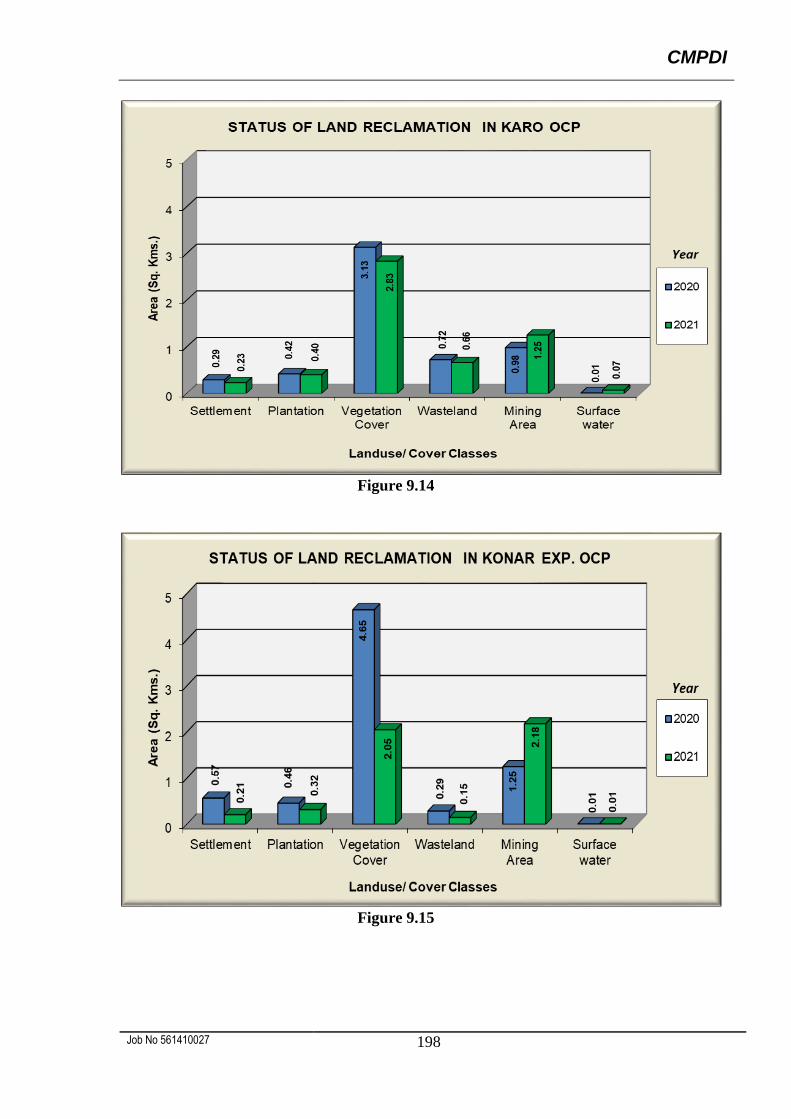
CMPDI
Job No 561410027 198
Figure 9.14
Figure 9.15
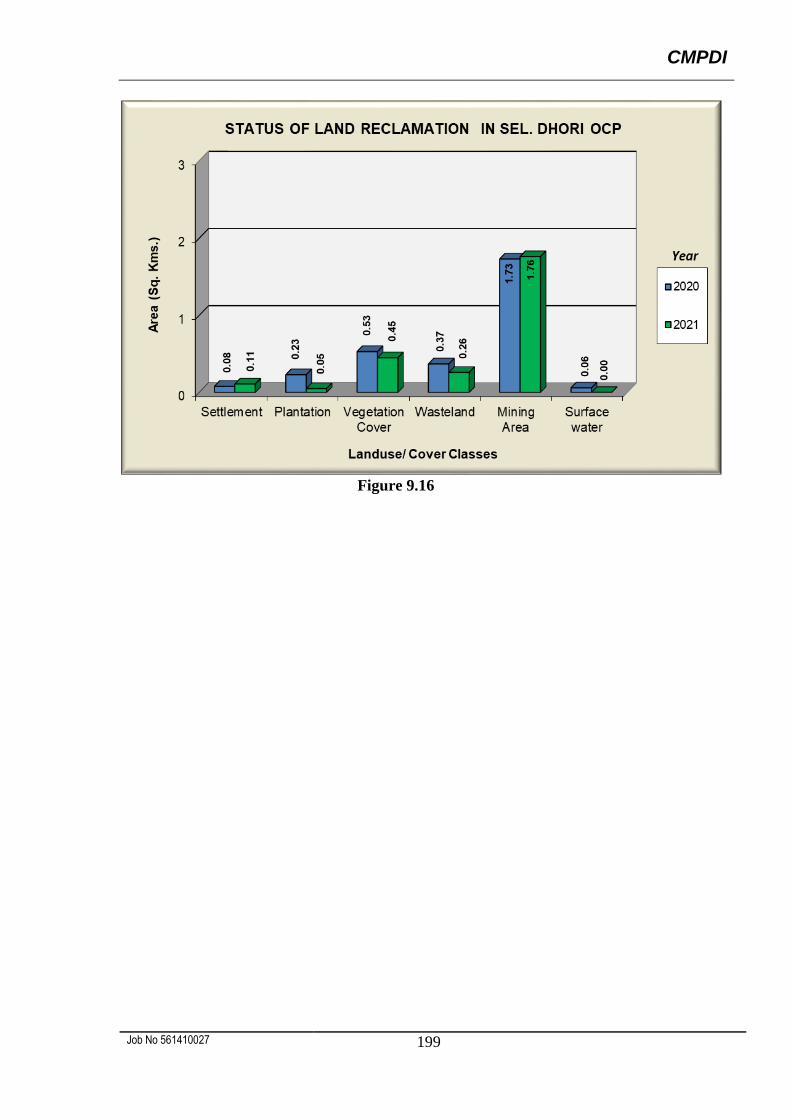
CMPDI
Job No 561410027 199
Figure 9.16
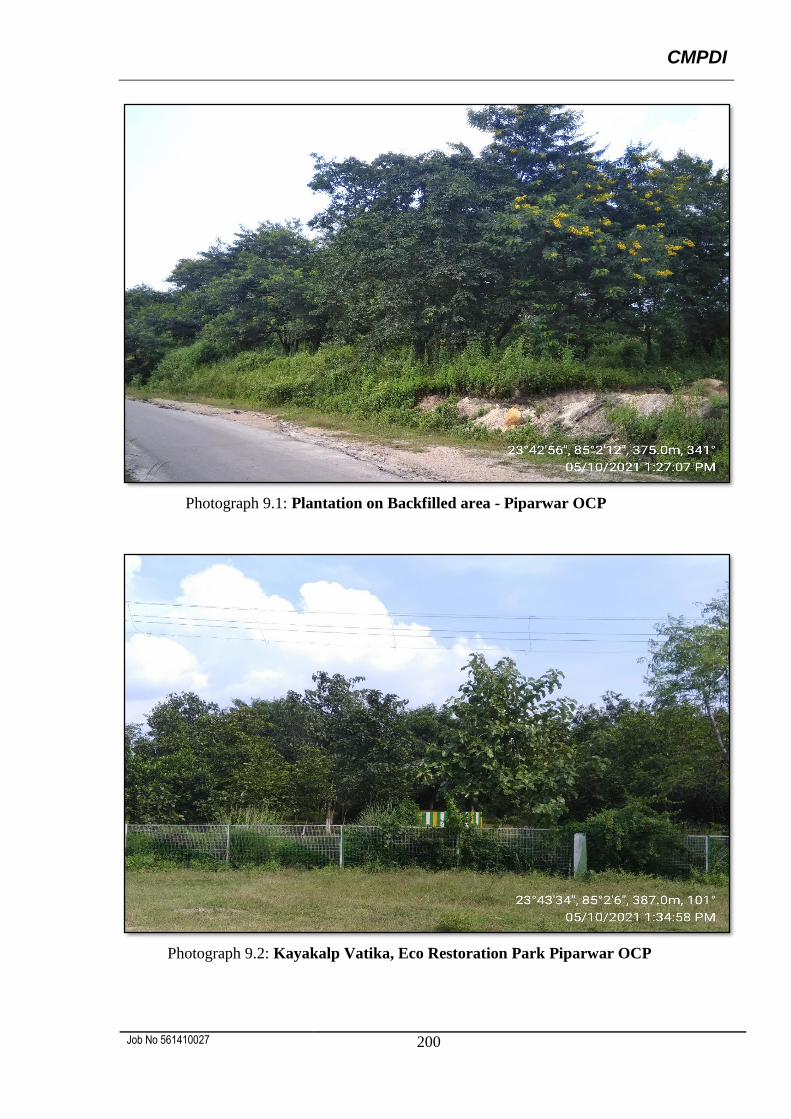
CMPDI
Job No 561410027 200
Photograph 9.1: Plantation on Backfilled area - Piparwar OCP
Photograph 9.2: Kayakalp Vatika, Eco Restoration Park Piparwar OCP
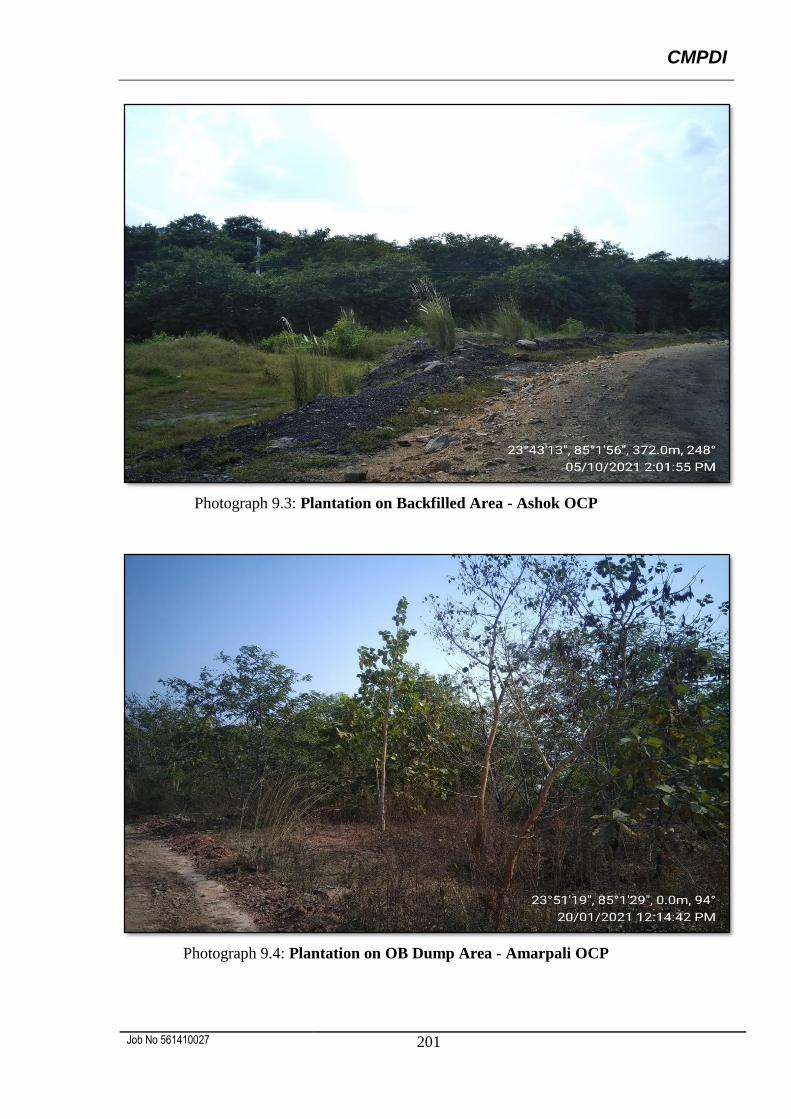
CMPDI
Job No 561410027 201
Photograph 9.3: Plantation on Backfilled Area - Ashok OCP
Photograph 9.4: Plantation on OB Dump Area - Amarpali OCP
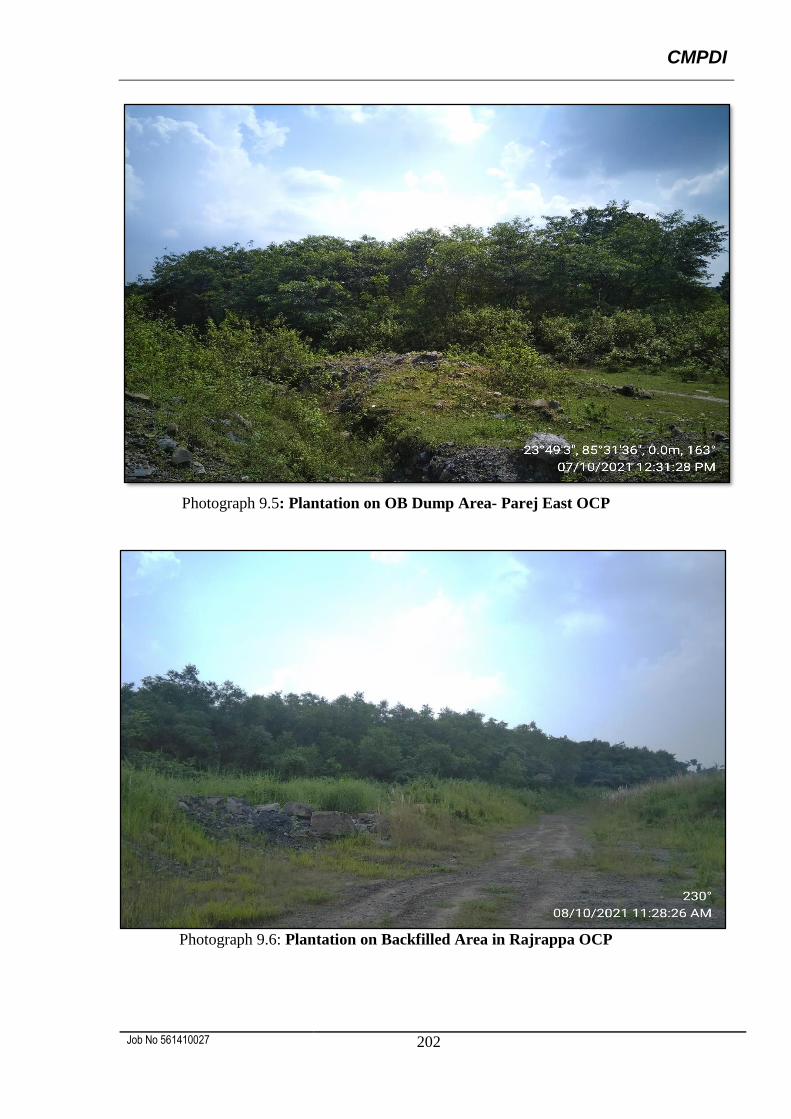
CMPDI
Job No 561410027 202
Photograph 9.5: Plantation on OB Dump Area- Parej East OCP
Photograph 9.6: Plantation on Backfilled Area in Rajrappa OCP
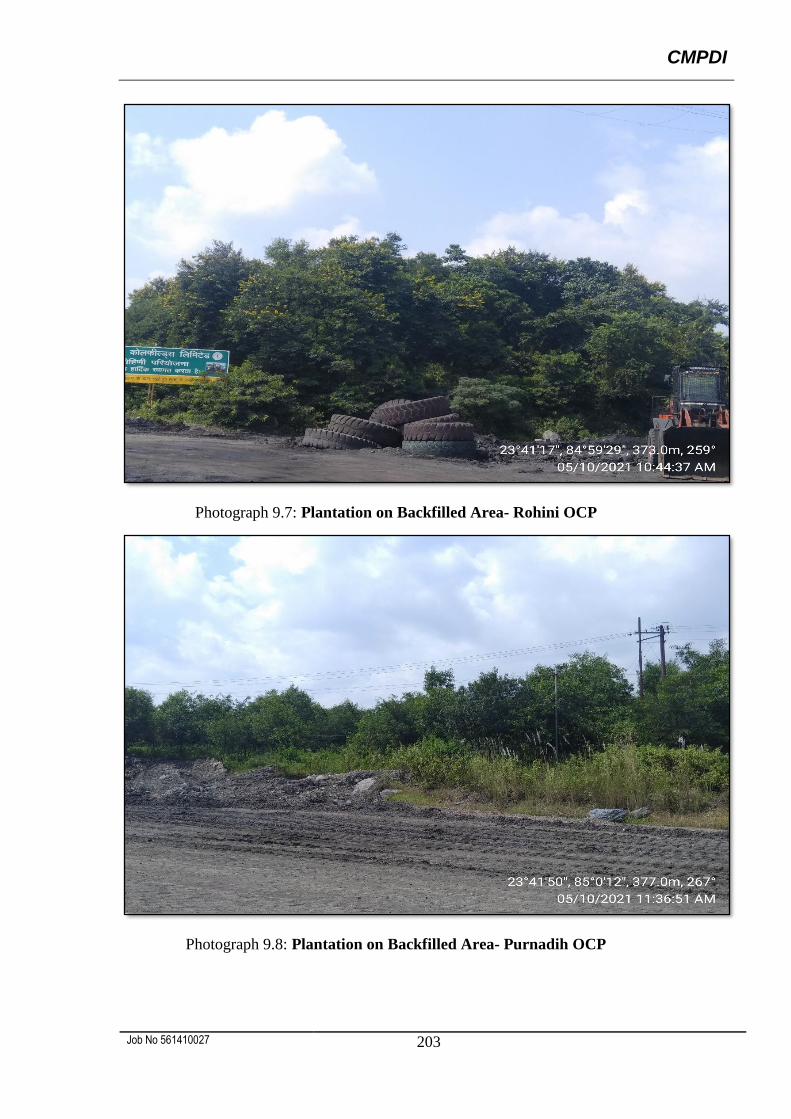
CMPDI
Job No 561410027 203
Photograph 9.7: Plantation on Backfilled Area- Rohini OCP
Photograph 9.8: Plantation on Backfilled Area- Purnadih OCP
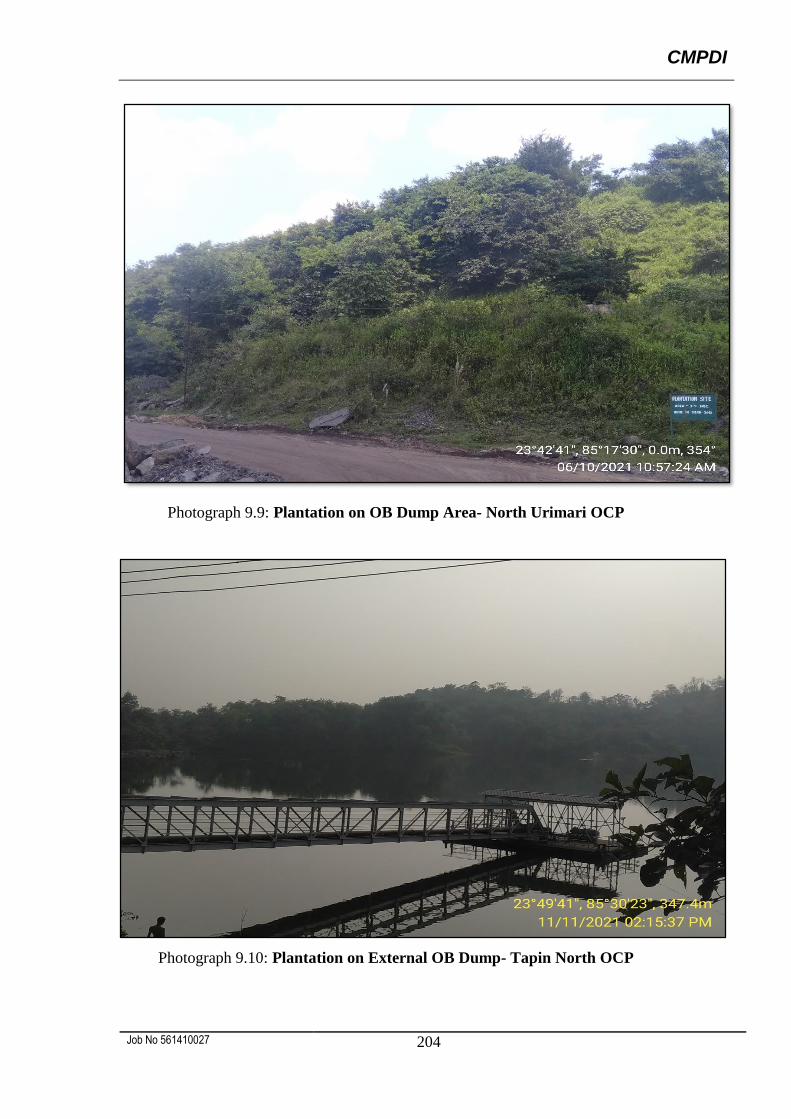
CMPDI
Job No 561410027 204
Photograph 9.9: Plantation on OB Dump Area- North Urimari OCP
Photograph 9.10: Plantation on External OB Dump- Tapin North OCP
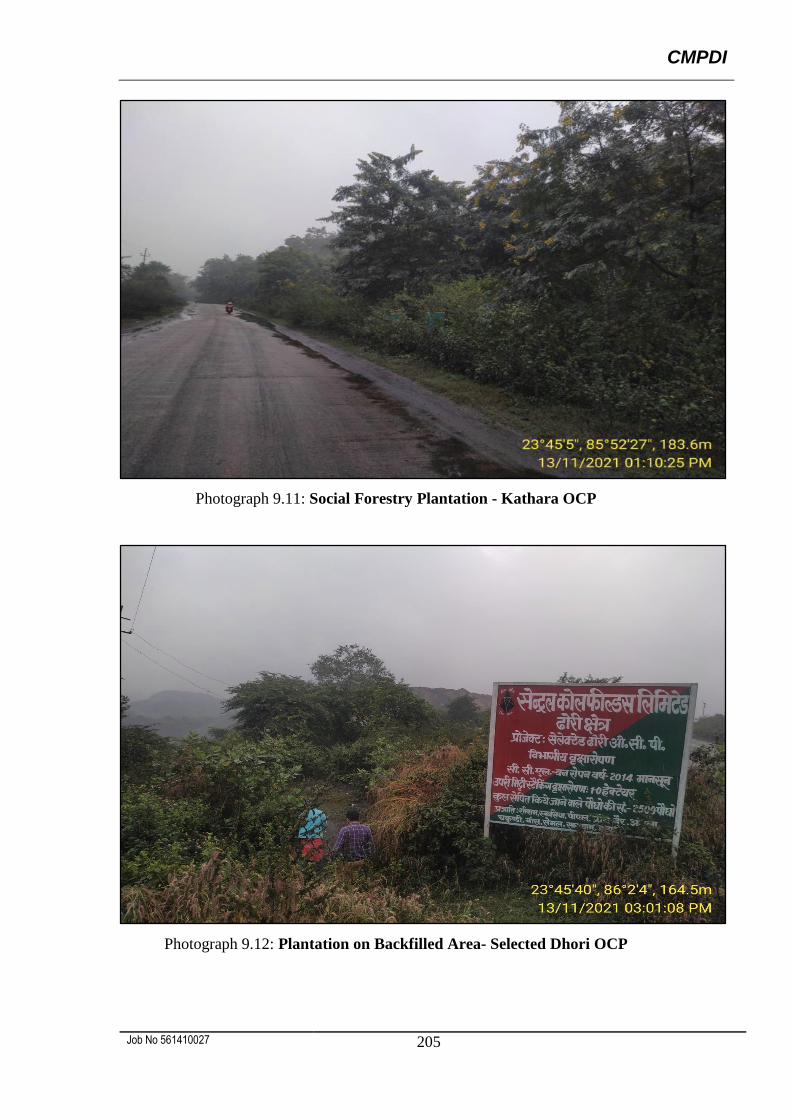
CMPDI
Job No 561410027 205
Photograph 9.11: Social Forestry Plantation - Kathara OCP
Photograph 9.12: Plantation on Backfilled Area- Selected Dhori OCP
EASTERN COALFIELDS LIMITED
CMPDI
Job No 561410027 207
10.0 Land Reclamation Status in Eastern Coalfields Ltd.
10.1 Following two OC projects producing 5 million cubic m. or more (Coal + OB)
annually of Eastern Coalfields Ltd. have been taken up for land reclamation based
on Satellite Data of the year 2021.
Rajmahal OCP
Sonepur Bazari OCP
10.2 Both the projects were monitored earlier during the period of 2020 also, on annual
basis for assessing the progress of land reclamation.
10.3 Project wise Land Reclamation status in ECL for the year 2021 is given in Table-
1 and shown graphically in Fig 11.1 Area statistics of different land classes
present in OC projects for the year 2021 is given in Table 10.2. Land use/ cover
maps derived using the satellite data are given in Plate no. 10.1 & 10.2. Changes
in land use status are shown in Fig. 10.2 & 10.3.
10.4 Study based on Satellite data reveals that 12.20 km2 (71.43%) of excavated area
has come under reclamation in ECL, out of which 9.30 km2 (54.45%) area is under
backfilling (Technical Reclamation) and 2.90 Km2 (16.98%) area is under
plantation (Biological Reclamation).
10.5 On comparing the status of land reclamation for the year 2021 with respect to the
year 2020, it is seen from the analysis that the total area of land reclamation has
increased from 11.50 km2 (Yr. 2020) to 12.20 km2 (Yr. 2021).
10.6 After analyzing the data of the year 2021, it is seen that the total area under
plantation (Green Cover) which includes plantation carried out on backfilled area,
OB dumps and plantation under social forestry/ avenue plantation in the leasehold
area of two mines of ECL has increased from 4.65 km2 (Yr. 2020) to 5.01 km2 (Yr.
2021).
CMPDI
Job No 561410027 208
10.7 Of the two projects in ECL, Rajmahal OCP tops with 82.62% reclamation followed
by Sonepur Bazari OCP with 61.17 % reclamation.
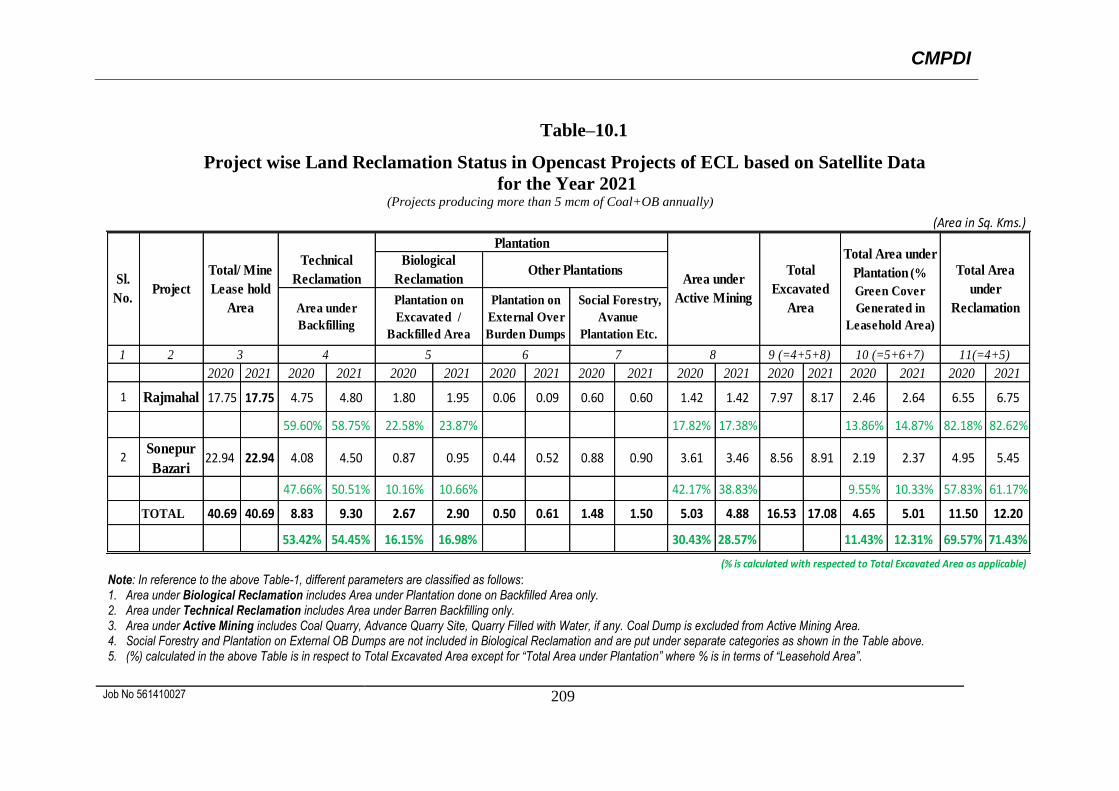
CMPDI
Job No 561410027 209
Table–10.1
Project wise Land Reclamation Status in Opencast Projects of ECL based on Satellite Data
for the Year 2021 (Projects producing more than 5 mcm of Coal+OB annually)
Note: In reference to the above Table-1, different parameters are classified as follows: 1. Area under Biological Reclamation includes Area under Plantation done on Backfilled Area only. 2. Area under Technical Reclamation includes Area under Barren Backfilling only. 3. Area under Active Mining includes Coal Quarry, Advance Quarry Site, Quarry Filled with Water, if any. Coal Dump is excluded from Active Mining Area. 4. Social Forestry and Plantation on External OB Dumps are not included in Biological Reclamation and are put under separate categories as shown in the Table above. 5. (%) calculated in the above Table is in respect to Total Excavated Area except for “Total Area under Plantation” where % is in terms of “Leasehold Area”.
1 2
2020 2021 2020 2021 2020 2021 2020 2021 2020 2021 2020 2021 2020 2021 2020 2021 2020 2021
1 Rajmahal 17.75 17.75 4.75 4.80 1.80 1.95 0.06 0.09 0.60 0.60 1.42 1.42 7.97 8.17 2.46 2.64 6.55 6.75
59.60% 58.75% 22.58% 23.87% 17.82% 17.38% 13.86% 14.87% 82.18% 82.62%
2Sonepur
Bazari22.94 22.94 4.08 4.50 0.87 0.95 0.44 0.52 0.88 0.90 3.61 3.46 8.56 8.91 2.19 2.37 4.95 5.45
47.66% 50.51% 10.16% 10.66% 42.17% 38.83% 9.55% 10.33% 57.83% 61.17%
TOTAL 40.69 40.69 8.83 9.30 2.67 2.90 0.50 0.61 1.48 1.50 5.03 4.88 16.53 17.08 4.65 5.01 11.50 12.20
53.42% 54.45% 16.15% 16.98% 30.43% 28.57% 11.43% 12.31% 69.57% 71.43%
9 (=4+5+8) 10 (=5+6+7)
Area under
Backfilling
Plantation on
Excavated /
Backfilled Area
7 8
Total Area under
Plantation (%
Green Cover
Generated in
Leasehold Area)
(% is calculated with respected to Total Excavated Area as applicable)
Total Area
under
Reclamation
Biological
ReclamationOther Plantations
Plantation on
External Over
Burden Dumps
Social Forestry,
Avanue
Plantation Etc.
11(=4+5)3 4 5 6
Project wise Land Reclamation Status in two OC Projects of ECL based on Satellite Data of the Year 2021(Projects producing more than 5 mcm of Coal + OB annaully)
(Area in Sq. Kms.)
Sl.
No.Project
Total/ Mine
Lease hold
Area
Technical
Reclamation
Plantation
Area under
Active Mining
Total
Excavated
Area
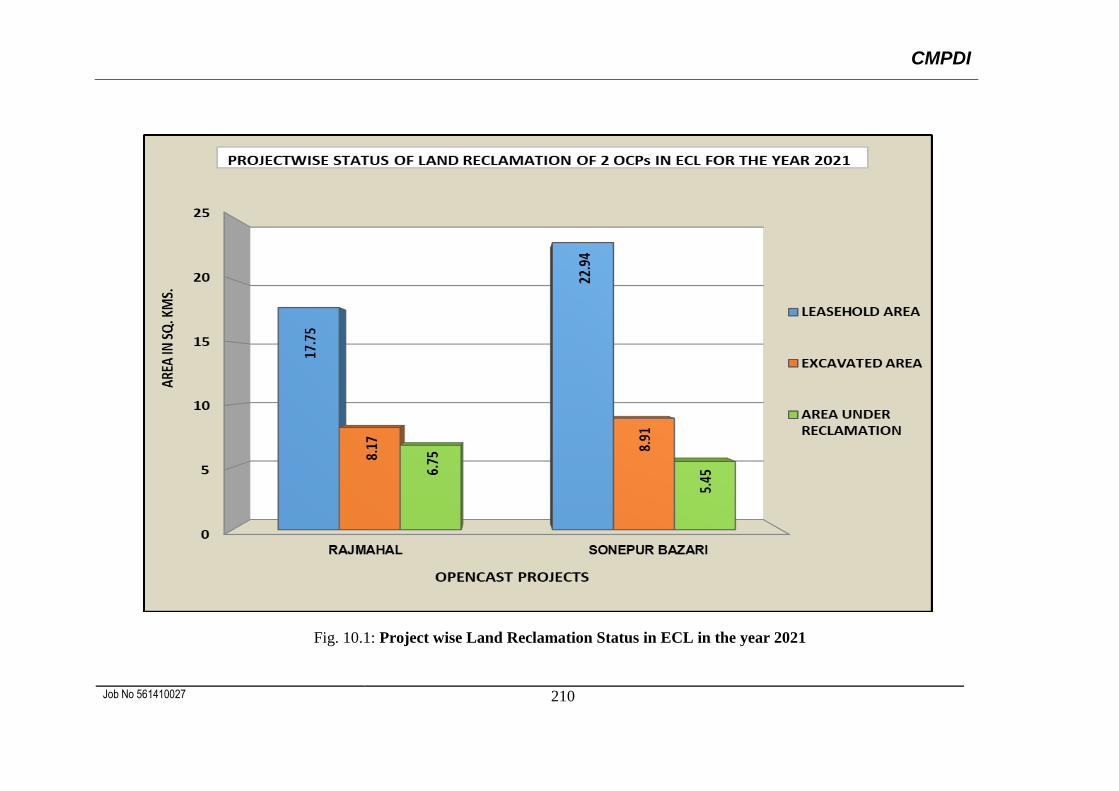
CMPDI
Job No 561410027 210
Fig. 10.1: Project wise Land Reclamation Status in ECL in the year 2021
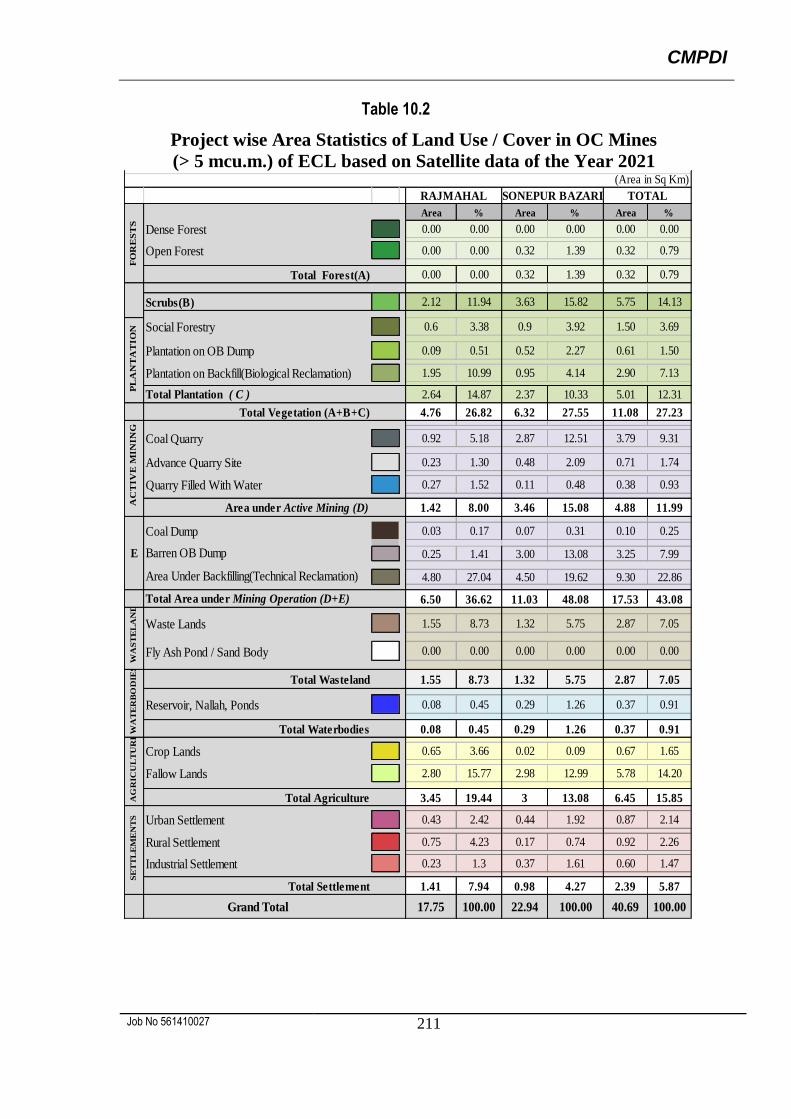
CMPDI
Job No 561410027 211
Table 10.2
Project wise Area Statistics of Land Use / Cover in OC Mines
(> 5 mcu.m.) of ECL based on Satellite data of the Year 2021
Area % Area % Area %
Dense Forest 0.00 0.00 0.00 0.00 0.00 0.00
Open Forest 0.00 0.00 0.32 1.39 0.32 0.79
Total Forest(A) 0.00 0.00 0.32 1.39 0.32 0.79
Scrubs(B) 2.12 11.94 3.63 15.82 5.75 14.13
Social Forestry 0.6 3.38 0.9 3.92 1.50 3.69
Plantation on OB Dump 0.09 0.51 0.52 2.27 0.61 1.50
Plantation on Backfill(Biological Reclamation) 1.95 10.99 0.95 4.14 2.90 7.13
Total Plantation ( C ) 2.64 14.87 2.37 10.33 5.01 12.31
Total Vegetation (A+B+C) 4.76 26.82 6.32 27.55 11.08 27.23
Coal Quarry 0.92 5.18 2.87 12.51 3.79 9.31
Advance Quarry Site 0.23 1.30 0.48 2.09 0.71 1.74
Quarry Filled With Water 0.27 1.52 0.11 0.48 0.38 0.93
Area under Active Mining (D) 1.42 8.00 3.46 15.08 4.88 11.99
Coal Dump 0.03 0.17 0.07 0.31 0.10 0.25
Barren OB Dump 0.25 1.41 3.00 13.08 3.25 7.99
Area Under Backfilling(Technical Reclamation) 4.80 27.04 4.50 19.62 9.30 22.86
Total Area under Mining Operation (D+E) 6.50 36.62 11.03 48.08 17.53 43.08
Waste Lands 1.55 8.73 1.32 5.75 2.87 7.05
Fly Ash Pond / Sand Body 0.00 0.00 0.00 0.00 0.00 0.00
Total Wasteland 1.55 8.73 1.32 5.75 2.87 7.05
Reservoir, Nallah, Ponds 0.08 0.45 0.29 1.26 0.37 0.91
Total Waterbodies 0.08 0.45 0.29 1.26 0.37 0.91
Crop Lands 0.65 3.66 0.02 0.09 0.67 1.65
Fallow Lands 2.80 15.77 2.98 12.99 5.78 14.20
Total Agriculture 3.45 19.44 3 13.08 6.45 15.85
Urban Settlement 0.43 2.42 0.44 1.92 0.87 2.14
Rural Settlement 0.75 4.23 0.17 0.74 0.92 2.26
Industrial Settlement 0.23 1.3 0.37 1.61 0.60 1.47
Total Settlement 1.41 7.94 0.98 4.27 2.39 5.87
Grand Total 17.75 100.00 22.94 100.00 40.69 100.00
WA
TE
RB
OD
IES
AG
RIC
UL
TU
RE
SE
TT
LE
ME
NT
SF
OR
ES
TS
PL
AN
TA
TIO
N
E
WA
ST
EL
AN
DS
AC
TIV
E M
IN
IN
GTABLE - 2
Project wise Area Statistics of Land Use/ Cover Classes in OC Mines (>5m.cu.m) of ECL
based on Satellite data of the Year 2021(Area in Sq Km)
RAJMAHAL SONEPUR BAZARI TOTAL
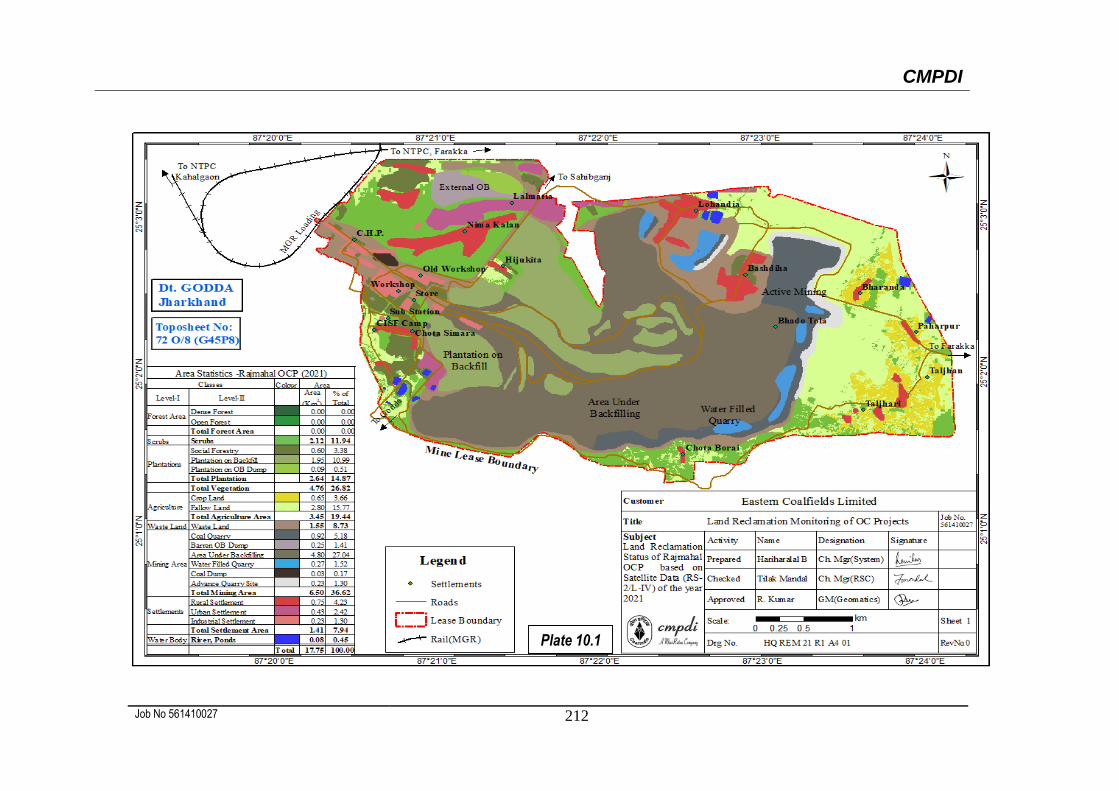
CMPDI
Job No 561410027 212
Plate 10.1
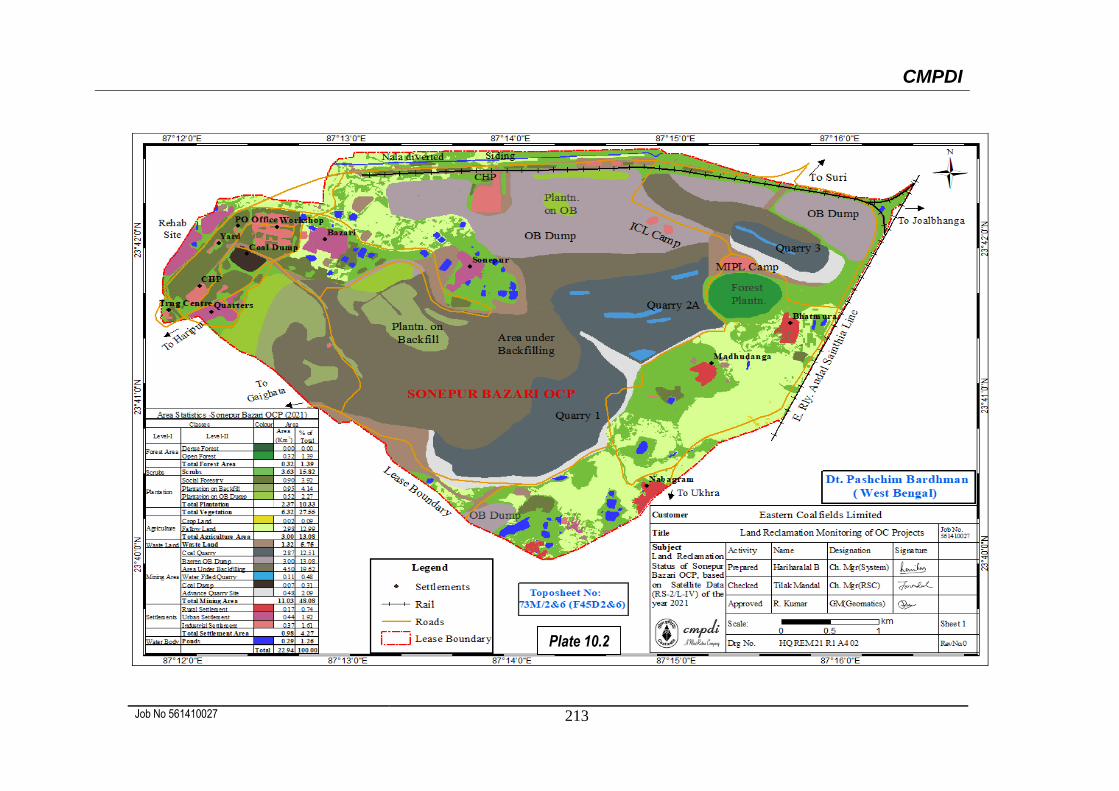
CMPDI
Job No 561410027 213
Plate 10.2
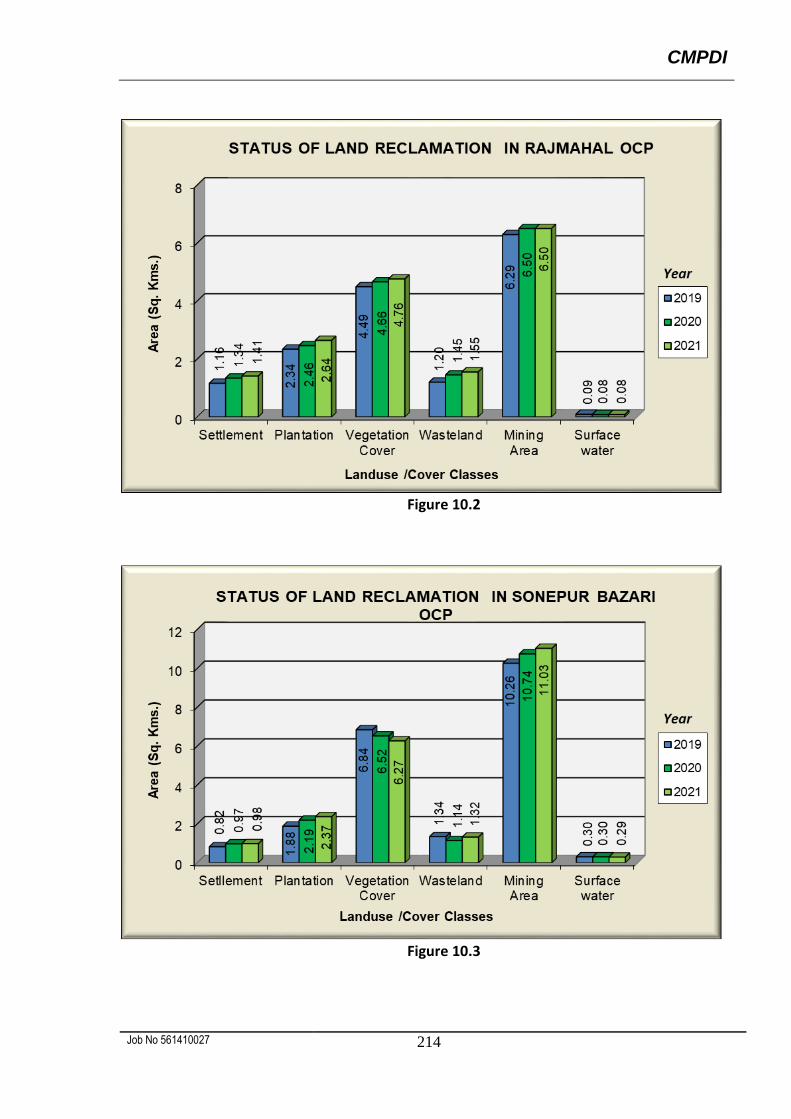
CMPDI
Job No 561410027 214
Figure 10.2
Figure 10.3
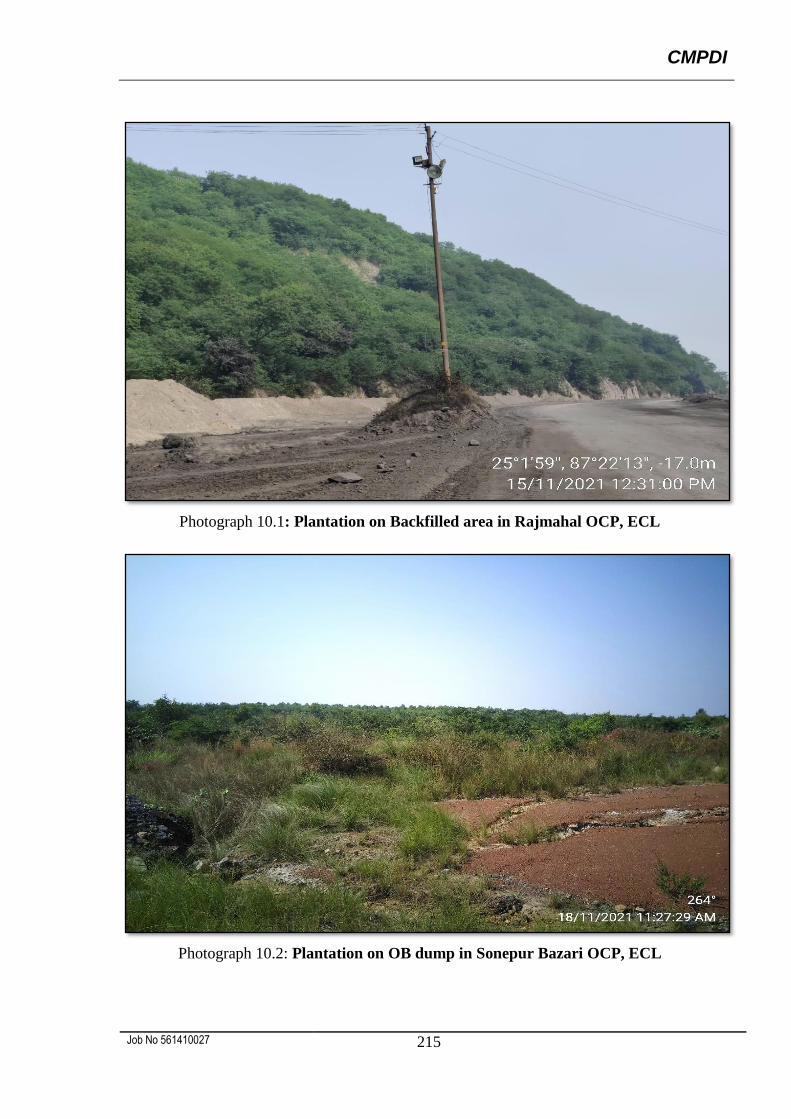
CMPDI
Job No 561410027 215
Photograph 10.1: Plantation on Backfilled area in Rajmahal OCP, ECL
Photograph 10.2: Plantation on OB dump in Sonepur Bazari OCP, ECL

Central Mine Planning & Design Institute Ltd. (A Subsidiary of Coal India Ltd.)
Gondwana Place, Kanke Road, Ranchi 834031, Jharkhand
Phone : (+91) 651 2230001, 2230002, 2230483, FAX (+91) 651 2231447, 2231851
Wesite : www.cmpdi.co.in, Email : [email protected]
Recommended


