
I N V E S T M E N T M A N A G E M E N T A S S O C I AT I O N
REPORT & ACCOUNTSJ U LY 2 0 0 6
ASSET MANAGEMENT SURVEY

1 KEY FINDINGS 4
2 OVERVIEW OF THE UK ASSET MANAGEMENT INDUSTRY 6
3 INSTITUTIONAL MANDATES 12
4 RETAIL AND UK FUNDS MARKET 17
5 OPERATIONAL ISSUES 21
6 APPENDICES
Appendix One: Questionnaire Respondents 27
Appendix Two: Structure of Survey 28
Appendix Three: Top Twenty Global Managers 30
CONTENTS
1
The IMA would like to thank all participants for their contributions.
Prepared by Jonathan LipkinInvestment Management Association, 2006
2
CHARTS
Chart 1: Assets Managed in the UK, 2002-2005 6
Chart 2: Proportion of Survey Respondents Managing Different Asset Classes/Product Types 7
Chart 3: Firms Ranked by Assets Managed in the UK (June 2005) 7
Chart 4: Assets Managed in the UK - Ten Largest Firms (December 2005) 7
Chart 5: Assets Managed in the UK - Ownership of Firms 9
Chart 6: Assets Managed in the UK - Client Type 10
Chart 7: Assets Managed in the UK - Asset Allocation 10
Chart 8: Assets Managed in the UK - Equity Allocation by Region 11
Chart 9: Investment in UK Equities by Client Type 11
Chart 10: Institutional Assets Managed in the UK - Client Type 12
Chart 11: Institutional Assets Managed in the UK - Client Type by Parent Type 12
Chart 12: Institutional Assets Managed in the UK - Parent Type by Client Type 12
Chart 13: Use of Specialist and Multi-Asset Mandates (Institutional Clients) 13
Chart 14: Investment Objectives of Institutional Assets under Management 13
Chart 15: Pension Fund Investment Objectives 14
Chart 16: Asset Allocation by Institutional Client Type 14
Chart 17: Property, Private Equity and Hedge Funds (% total institutional AUM) 15
Chart 18: Client Composition of Segregated and Pooled Third Party Institutional Business 15
Chart 19: Fund Launches in Ireland, Luxembourg and the UK (2000-2005) 17
Chart 20: Retail Assets Managed in the UK - Asset Allocation 17
Chart 21: Top Ten UK Unit Trust and OEIC Managers (December 2005) 18
Chart 22: Funds under Management (1996-2005) 18
Chart 23: Net Retail Sales (1996-2005) 18
Chart 24: Funds under Management by Product (1996-2005) 18
Chart 25: Quarterly Net Retail Sales and ISA/PEP Net Sales vs FTSE 100 (1996-2005) 19
Chart 26: Funds under Management by Asset Type 19
Chart 27: Net Retail Sales by Asset Category (1996-2005) 19
Chart 28: Funds under Management for Funds of Funds (1996-2005) 20
INDEX OF TABLES AND CHARTS
3
Chart 29: Tracker and Ethical Funds under Management (% total FUM, 1996-2005) 20
Chart 30: Tax Year Gross ISA Sales by Distribution Channel (1999-2005) 20
Chart 31: Revenue by Firm as a Proportion of Assets Managed in the UK - Split by Client Type 21
Chart 32: Costs by Activity (% of Total by Respondent Firm) 22
Chart 33: Distribution of Staff by Activity 22
TABLES
Table 1: Assets Managed in the UK by Firm Size (June 2005) 7
Table 2: Largest UK Firms - Parent Type 8
Table 3: Overseas Domicile 9
Table 4: Returns on Selected Indices, June 2004 - December 2005 10
Table 5: Distribution of Third Party Segregated and Pooled Mandates 15
Table 6: Use of Performance-Related Fees 21
Table 7: Costs by Activity (Range and Median) 21
Table 8: Sub-Division of Employment in Main Activities 23
Table 9: Proportion of Business Directed on an Execution Only Basis 24
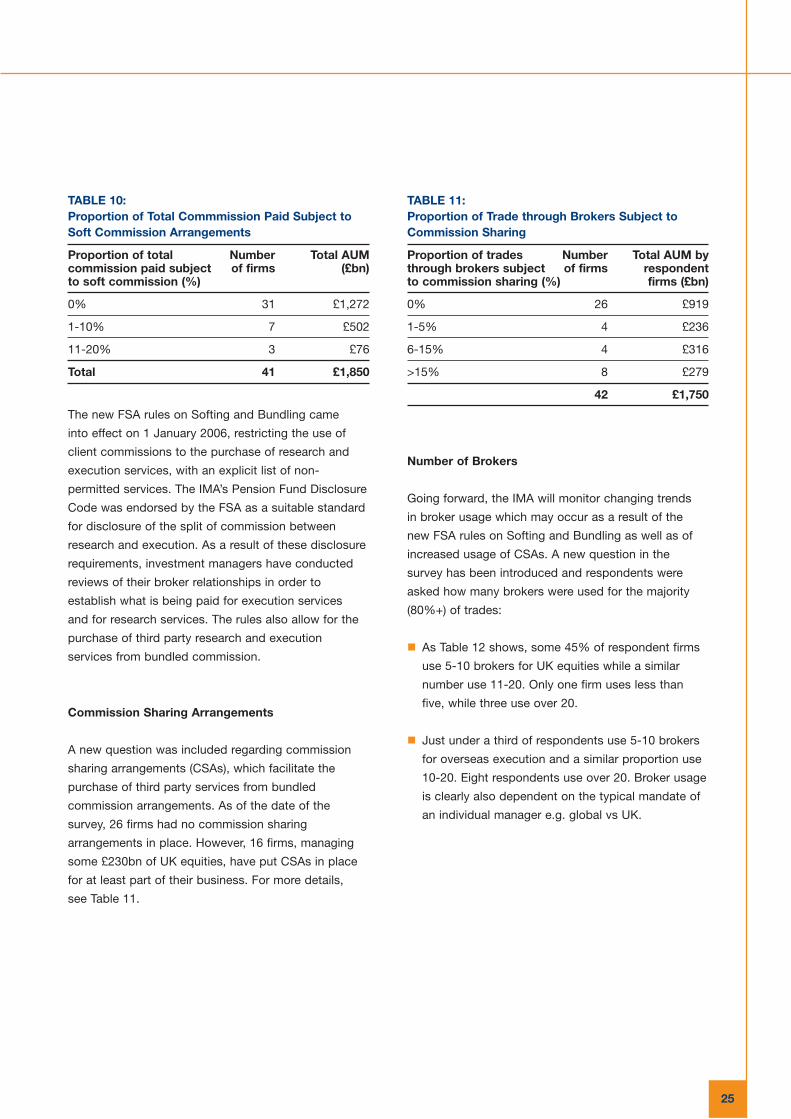
Table 10: Proportion of Total Commission Paid Subject to Soft Commission Arrangements 25
Table 11: Proportion of Trade through Brokers Subject to Commission Sharing 25
Table 12: Number of Brokers Used for the Majority of Trades 26
Table 13: Proportion of Clients Requiring Transaction Costs Analysis 26
Table 14: Top 20 Global Managers (as at December 2004) 30
4
This is the fourth annual IMA survey undertaken of
member firms. The survey presents a snapshot of the
UK asset management industry, across both the
institutional and retail landscapes. Direct questionnaire
responses were obtained from 53 firms, managing
between them just over £2.2trn (80% of total assets
managed by IMA members), and internal IMA data has
also been included this year to provide analysis of
trends in UK authorised funds.
The key findings are presented below, and are explored
in more detail in the main body of the survey.
OVERVIEW OF THE UK ASSET MANAGEMENT
INDUSTRY
� Assets managed by IMA members in the UK totalled
an estimated £2.8trn as at December 2005.
� Assets managed in the UK on behalf of overseas
clients represent some 20% of the total. However,
given that many firms have a global footprint and will
be servicing client accounts and managing assets in
multiple locations, this figure understates the total
importance of overseas business to the UK industry.
� Some 19% of total assets under management in the
UK are domiciled overseas. These range from hedge
funds to retail funds.
� The market share of the five largest firms has
increased, standing at 31% (from 28% a year earlier).
The share of the ten largest rose to 48% (from 46% a
year earlier). This is due to the increasing share of
two leading indexing firms, although the market as a
whole remains relatively unconcentrated.
KEY FINDINGS1
� Some 80% of assets managed in the UK are invested
on behalf of institutional investors (primarily corporate
pension funds and insurance companies). The retail
market accounts for just under 20% of total assets.
� While headline figures show a sharp increase in the
position of equities as a proportion of total assets
under management, matched samples suggest that
the overall trend away from equities and into bonds
is continuing.
INSTITUTIONAL BUSINESS
� Within the institutional market, corporate pension
funds and insurance companies account for some
75% of total business, with 80% of insurance
mandates coming from parent companies to their
asset management subsidiaries.
� Excluding in-house managed occupational pension
scheme (OPS) firms, two thirds of assets managed
by survey respondents are in specialist/single-asset
mandates, reflecting the gradual move away from
balanced/multi-asset mandates.
� A matched sample on pension fund asset allocation
confirms an ongoing movement towards bonds. Data
in this year's survey on corporate pension funds also
supports findings elsewhere that the move has been
more pronounced in this part of the market than in
the local authority sector.
� With respect to investment objective, index
benchmarks remain predominant. Peer group
objectives are used for some 9.5% of institutional
assets under management.
� Liability-led strategies currently account for a modest
share of the institutional market (5% according to
respondent data), although a quarter of firms expect
liability-led investment to be the first or second
fastest growing product area in three years’ time.
� The trend in recent years towards differentiation of
alpha (value added by active selection) and beta
(market return) has seen the emergence of a small
number of market leaders in passive management,
which operate at considerable scale. While 12 of 37
respondents to a question on passive mandates
identified some assets managed in this way, just
three firms run 90% of the total.
RETAIL AND UK FUNDS MARKET
� Retail assets identified in the survey account for
19% of total assets - some £530bn. These include
UK-managed unit trusts, OEICs, investment trusts
and other retail products. We estimate that some
£200bn of this total is domiciled in Luxembourg,
Dublin and other overseas locations.
� As at December 2005, UK-authorised funds under
management totalled £347bn, with the top ten firms
accounting for 50% of the total. The £300bn mark
was breached for the first time in July 2005.
� During 2005 as a whole, net retail sales of UK-
authorised funds rose to levels not seen since 2001.
However, although ISA funds under management
grew strongly year-on-year, net sales in this area
remained sluggish.
� The dominant channel in the gross sale of retail
funds in 2005 was the intermediary channel. In
the ISA data, where fund supermarket sales are
disaggregated, the growing dominance of
supermarkets is apparent, equalling the sales
force/tied agent channel for the first time.
OPERATIONAL ISSUES
� Data from the survey suggests that weighted
average revenue as a proportion of total assets
under management was 28 basis points, equating
to some £8bn.
� Total direct employment is some 22,000-25,000,
but with numerous activities outsourced to third-
party providers, the overall level of employment
associated with the asset management industry
is considerably higher.
� In terms of off-shoring, the survey findings supported
the OXERA study last year, which concluded that
while some middle and back office functions
appeared prone to relocation outside the UK, core
asset management activities appeared fairly securely
located for the time being.1
� With respect to broker relationships, the proportion
of commission subject to softing continues to fall,
in line with recent trends. Looking at commission
sharing arrangements (CSAs), 16 firms (out of 42
respondents to this question) have put CSAs in place
for at least part of their business.
5
1 See ‘The Competitive Position of London as a Global Financial Centre’ (OXERA report for IMA/City of London), 2005.
6
The survey covers a representative sample of 137 IMA
member firms. A total of 53 firms provided detailed
questionnaire data, managing between them some
£2.2trn in the UK on behalf of a range of UK and overseas
clients.2A list of respondents and the structure of the survey
are provided in Appendices One and Two respectively.
Broadly speaking, respondents fall into five
general categories:
� Asset management firms with a sizeable global
footprint, which undertake a wide range of asset
management activities across the institutional and
retail market space.
� Large and medium-size firms whose business is
primarily UK/European-focused, which offer a
diverse product range.
� Smaller asset management firms, which may be
specialist boutiques or focused on the private
client market.
� Occupational Pension Scheme (OPS) managers,
running in-house asset management operations.
� Mutual fund companies or firms whose business is
primarily based on mutual funds, and who manage
assets in-house (as opposed to the IMA firms which
are fund operators and outsource their asset
management functions).
INDUSTRY SIZE
In December 2005, assets managed in the UK by IMA
members totalled an estimated £2.8trn.3
Chart 1 shows
the progression since 2002, with some correlation to
OVERVIEW OF THE UK ASSET MANAGEMENT INDUSTRY2
market movements. Data from the survey suggests that
about 20% of the total is managed on behalf of overseas
clients. It is important to note though that many firms
operate internationally, but will be servicing client
accounts and managing assets in multiple locations.
This figure therefore understates the total importance
of overseas business to the UK-based industry.
Chart 1Assets Managed in the UK, 2002-2005
In terms of overall investment industry size, IMA
member firms operate across both the mainstream and
alternative asset management spectrum. Chart 2 gives
a profile of survey respondents in this respect. Almost
all respondents manage equities, bonds and cash, with
half having property within portfolios and some 20%
running private equity and hedge funds. However, the
survey is likely to under-estimate total assets under
management in the UK. Including hedge funds4 and
other alternative investments5 not managed by IMA
members and not covered in this survey, we believe
that the total figure for assets under management in
the UK exceeds £3trn.
Assets under management FTSE All-share
0
500
1,000
1,500
2,000
2,500
3,000
3,500
4,000
4,500
5,000
0
500
1,000
1,500
2,000
2,500
3,000
Dec 2005June 2005June 2004June 2003June 2002
AUM£bn
FTSEAll-share
2 Unless otherwise specified, all reference to assets under management in the UK in this survey concerns December 2005 data provided byrespondent firms.
3 This figure is calculated using a complete internal IMA data set for assets under management as at June 2005 and adjusting it based on surveyquestionnaire responses for December 2005.
4 While some IMA members run hedge funds, some 80% of hedge fund assets managed in the United Kingdom are thought to be managed byfirms (typically boutiques), which are outside the scope of this survey. A HedgeFund Intelligence survey, published in March 2006, found thatsome $255.5bn (£140bn) of assets are managed by UK-based hedge fund managers (including IMA members).
5 IMA represents a number of firms whose activities include property funds and private equity operations, but not the totality of these markets.
Chart 2
Proportion of Survey Respondents Managing
Different Asset Classes/Product Types
CONCENTRATION
Industry concentration (as measured by an internal IMA
data set from June 2005) is illustrated in Chart 3. As in
previous years, the chart shows a steep curve
downwards from a comparatively small number of very
large firms, and a long tail. While 17 IMA member firms
each managed in excess of £50bn (see Table 1), 68
managed less than £16bn, about a third of whom
managed less than £1bn.
Chart 3Firms Ranked by Assets Managed in the UK (June 2005)6
TABLE 1:Assets Managed in the UK by Firm Size (June 2005)
Assets under Number Survey management of firms respondents
>£100bn 6 6
£51-100bn 11 10
£26-50bn 11 6
£16-25bn 11 6
£1-15bn 47 17
<£1bn 21 8
TOTAL 107 53
In terms of the position of the largest firms:
� The five top UK firms accounted for some 31% of
assets managed in the UK by IMA members in June
2005, an increase over both 2004 (28%) and the
preceding two years (28-29% in 2002-03). This was
due to the expanding market share of the largest two
firms, who are leading players in the indexing market.
� For the same reason, the market share of the ten
largest firms had also risen modestly, to 48% in
June 2005 (from 46% a year earlier), a level last
seen in 2002.
Chart 4Assets Managed in the UK - Ten Largest Firms(December 2005)7
7
Proportion of respondentsmanaging assetclass/product
Proportion of respondentsmanaging more than £5bn(>£500mn for private equityand hedge funds)
0
20
40
60
80
100
90
70
50
30
10
HedgeFunds
PrivateEquity
PropertyCash/MoneyMarket
BondsEquities
% o
f su
rvey
res
po
nden
ts
£mn
0
20,000
40,000
60,000
80,000
100,000
120,000
140,000
160,000
180,000
200,000
6 Internal IMA data is used for this analysis and is not available for December 2005.
7 A chart giving a ranking of the largest managers of retail funds can be found on p.18.
Fidelity International
Insight Investment Management
Scottish Widows Investment Partnership
Standard Life Investments
JP Morgan Asset Management
State Street Global Advisers
Morley Fund Management
M&G Securities
Legal & General Investment Management
Barclays Global Investors
£mn
208,848
204,328
145,869
139,810
138,145
109,918
105,700
94,741
88,743
87,418
208,848
208,848
208,848
By December 2005, the top two firms had each
moved above £200bn under management (see Chart
4), although this has had little overall further effect on
industry concentration.
The increasingly global nature of the asset management
industry means that some firms that are the largest in
international terms will not rank highly in the UK due to
national skews in their business. For cross reference,
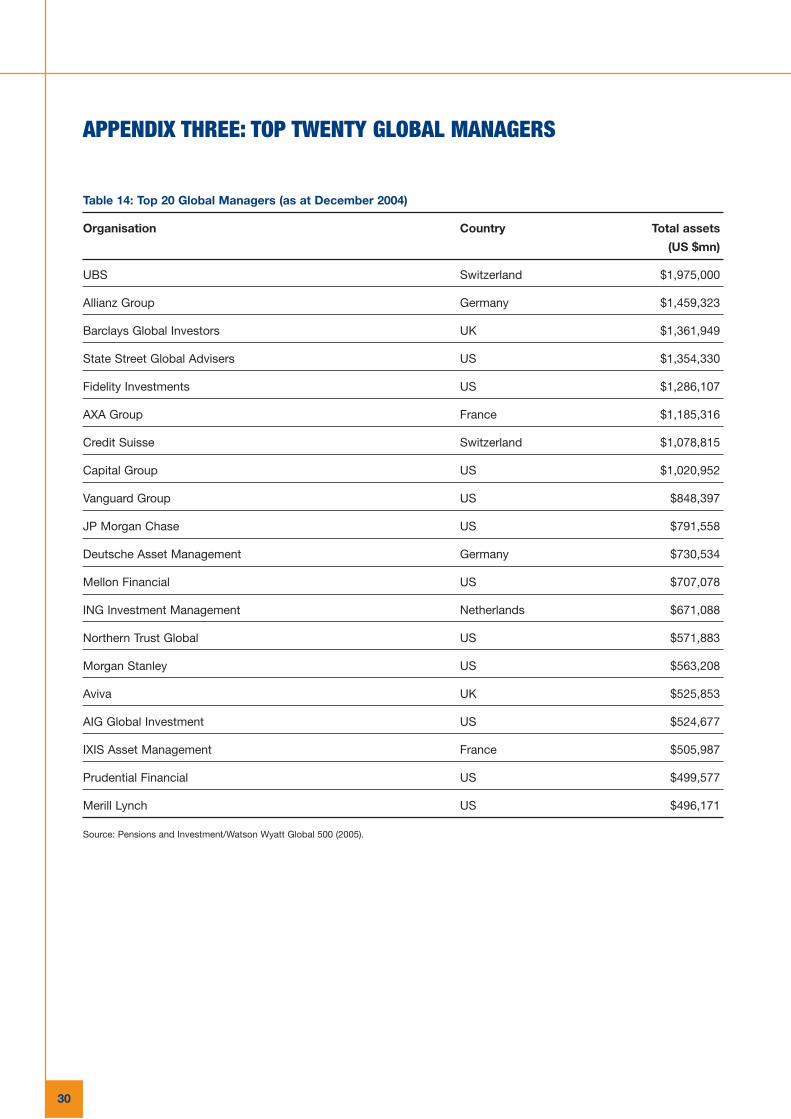
Appendix Three (Table 14) shows data on the largest
global asset managers, which includes a number of the
firms listed here.
OWNERSHIP
Internationally, there has been some consolidation within
the asset management industry, with a number of deals
taking place over the last two years. Looking at those
with an impact on the UK:
� F&C Asset Management was created after the merger
of F&C Management and ISIS Asset Management.
� Aberdeen Asset Management purchased a number
of investment businesses from Deutsche Asset
Management.
� MassMutual bought Baring Asset Management
from ING.
� AXA Investment Managers acquired Framlington.
� Legg Mason acquired Citigroup’s asset
management business.
� Britannic Asset Management has become Resolution
Asset Management as a result of the merger of
Resolution Life Group and Britannic Group.
� Black Rock and Merill Lynch Investment Managers
have agreed a merger.
This activity has had little impact on the top ten asset
managers. Among this group, firms owned by UK
insurance companies and retail banks continue to
dominate. For more detail, see Table 2.
TABLE 2:Largest UK Firms - Parent Type
Companies Parent Parent Group Type
Barclays Global Barclays PLC Retail BankInvestors Ltd
Legal and General Legal and Insurance Investment General CompanyManagement Ltd Group PLC
Morley Fund Aviva PLC InsuranceManagement Ltd Company
M&G Securities Ltd Prudential PLC InsuranceCompany
State Street Global State Street Global Advisers Ltd Corporation Custodian/
Investment Services
JP Morgan Asset JPM Chase Investment Management Ltd & Co. Bank
Standard Life Standard Life InsuranceInvestments Ltd Assurance Company
Company
Scottish Widows Lloyds TSB Retail BankInvestment Partnership Group PLC
Insight Investment HBOS PLC Retail BankManagement Ltd
Fidelity International Ltd Fidelity Asset International Manager
With respect to the wider IMA membership base,
insurance-owned asset management companies are
the largest single group, with 32.1% of assets under
management in the UK. Retail banks account for 17.7%
and investment banks for 14.5%.8 See Chart 5 for more
detail. However, these relatively narrow categories
simplify a complex picture, as larger groups in particular
are increasingly engaged in a diverse range of domestic
and global financial services activities.
8
8 Private Banks are counted in the Investment Bank category.
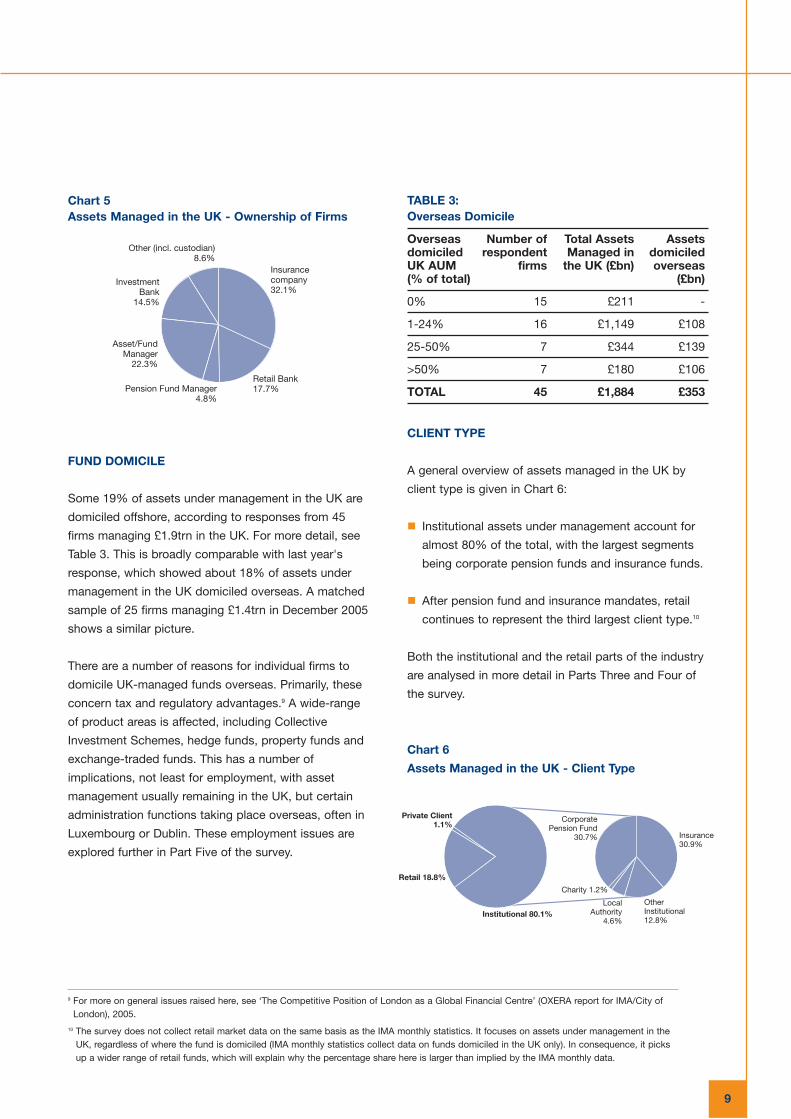
Chart 5Assets Managed in the UK - Ownership of Firms
FUND DOMICILE
Some 19% of assets under management in the UK are
domiciled offshore, according to responses from 45
firms managing £1.9trn in the UK. For more detail, see
Table 3. This is broadly comparable with last year's
response, which showed about 18% of assets under
management in the UK domiciled overseas. A matched
sample of 25 firms managing £1.4trn in December 2005
shows a similar picture.
There are a number of reasons for individual firms to
domicile UK-managed funds overseas. Primarily, these
concern tax and regulatory advantages.9 A wide-range
of product areas is affected, including Collective
Investment Schemes, hedge funds, property funds and
exchange-traded funds. This has a number of
implications, not least for employment, with asset
management usually remaining in the UK, but certain
administration functions taking place overseas, often in
Luxembourg or Dublin. These employment issues are
explored further in Part Five of the survey.
TABLE 3:Overseas Domicile
Overseas Number of Total Assets Assets domiciled respondent Managed in domiciled UK AUM firms the UK (£bn) overseas (% of total) (£bn)
0% 15 £211 -
1-24% 16 £1,149 £108
25-50% 7 £344 £139
>50% 7 £180 £106
TOTAL 45 £1,884 £353
CLIENT TYPE
A general overview of assets managed in the UK by
client type is given in Chart 6:
� Institutional assets under management account for
almost 80% of the total, with the largest segments
being corporate pension funds and insurance funds.
� After pension fund and insurance mandates, retail
continues to represent the third largest client type.10
Both the institutional and the retail parts of the industry
are analysed in more detail in Parts Three and Four of
the survey.
Chart 6
Assets Managed in the UK - Client Type
9
9 For more on general issues raised here, see ‘The Competitive Position of London as a Global Financial Centre’ (OXERA report for IMA/City ofLondon), 2005.
10 The survey does not collect retail market data on the same basis as the IMA monthly statistics. It focuses on assets under management in theUK, regardless of where the fund is domiciled (IMA monthly statistics collect data on funds domiciled in the UK only). In consequence, it picksup a wider range of retail funds, which will explain why the percentage share here is larger than implied by the IMA monthly data.
Insurancecompany32.1%
Retail Bank17.7%Pension Fund Manager
4.8%
Asset/FundManager
22.3%
InvestmentBank
14.5%
Other (incl. custodian)8.6%
Institutional 80.1%
Retail 18.8%
Private Client1.1%
Insurance30.9%
Other Institutional 12.8%
LocalAuthority
4.6%
Charity 1.2%
CorporatePension Fund
30.7%
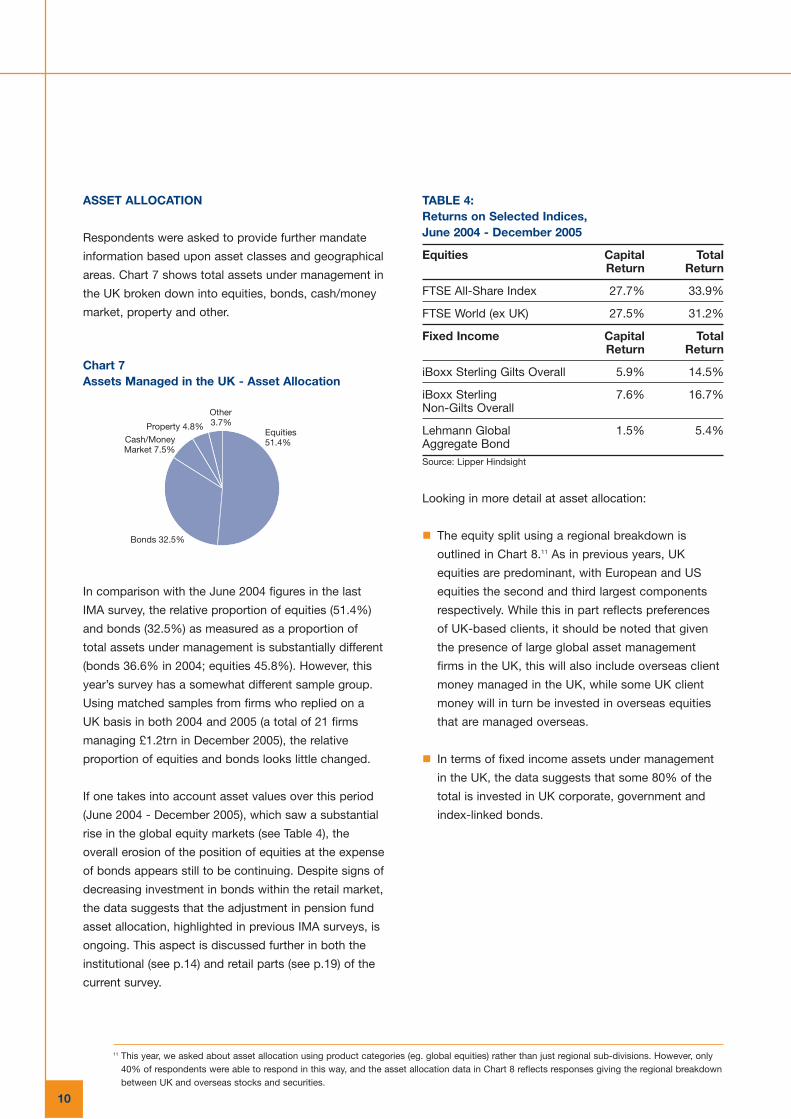
ASSET ALLOCATION
Respondents were asked to provide further mandate
information based upon asset classes and geographical
areas. Chart 7 shows total assets under management in
the UK broken down into equities, bonds, cash/money
market, property and other.
Chart 7Assets Managed in the UK - Asset Allocation
In comparison with the June 2004 figures in the last
IMA survey, the relative proportion of equities (51.4%)
and bonds (32.5%) as measured as a proportion of
total assets under management is substantially different
(bonds 36.6% in 2004; equities 45.8%). However, this
year’s survey has a somewhat different sample group.
Using matched samples from firms who replied on a
UK basis in both 2004 and 2005 (a total of 21 firms
managing £1.2trn in December 2005), the relative
proportion of equities and bonds looks little changed.
If one takes into account asset values over this period
(June 2004 - December 2005), which saw a substantial
rise in the global equity markets (see Table 4), the
overall erosion of the position of equities at the expense
of bonds appears still to be continuing. Despite signs of
decreasing investment in bonds within the retail market,
the data suggests that the adjustment in pension fund
asset allocation, highlighted in previous IMA surveys, is
ongoing. This aspect is discussed further in both the
institutional (see p.14) and retail parts (see p.19) of the
current survey.
TABLE 4:Returns on Selected Indices, June 2004 - December 2005
Equities Capital Total Return Return
FTSE All-Share Index 27.7% 33.9%
FTSE World (ex UK) 27.5% 31.2%
Fixed Income Capital Total Return Return
iBoxx Sterling Gilts Overall 5.9% 14.5%
iBoxx Sterling 7.6% 16.7%Non-Gilts Overall
Lehmann Global 1.5% 5.4%Aggregate BondSource: Lipper Hindsight
Looking in more detail at asset allocation:
� The equity split using a regional breakdown is
outlined in Chart 8.11 As in previous years, UK
equities are predominant, with European and US
equities the second and third largest components
respectively. While this in part reflects preferences
of UK-based clients, it should be noted that given
the presence of large global asset management
firms in the UK, this will also include overseas client
money managed in the UK, while some UK client
money will in turn be invested in overseas equities
that are managed overseas.
� In terms of fixed income assets under management
in the UK, the data suggests that some 80% of the
total is invested in UK corporate, government and
index-linked bonds.
10
Equities51.4%
Bonds 32.5%
Cash/MoneyMarket 7.5%
Property 4.8%
Other3.7%
11 This year, we asked about asset allocation using product categories (eg. global equities) rather than just regional sub-divisions. However, only40% of respondents were able to respond in this way, and the asset allocation data in Chart 8 reflects responses giving the regional breakdownbetween UK and overseas stocks and securities.

Chart 8Assets Managed in the UK - Equity Allocation by Region
With respect to UK equity holdings as a proportion of
total UK equity market capitalisation, we calculate that
IMA members manage just under half of the total. Chart
9 shows the split by client type. Between them,
corporate pension funds (18.0%) and insurance clients
(16.0%) account for about a third of total UK shares.
Including local authorities (2.5%, predominantly pension
fund assets), the pension fund component rises to
slightly over a fifth.
Chart 9Investment in UK Equities by Client Type (% UK Domestic Market Capitalisation, December 2005)
11
N. America12.5%
Pacific (incl.Japan)
7.9%
EmergingMarket
1.8%
Other0.8%
Europe15.2% UK
61.7%
0
5
10
15
20
25
30
35
40
45
50
% U
K D
om
esti
c M
arke
t C
apit
alis
atio
n
Cor
por
ate
Pen
sion
Fun
d
Tota
l IM
Am
emb
ers
Priv
ate
Clie
nt
Cha
rity
Oth
er In
stitu
tiona
l
Loca
l Aut
horit
y
Ret
ail
Insu
ranc
e
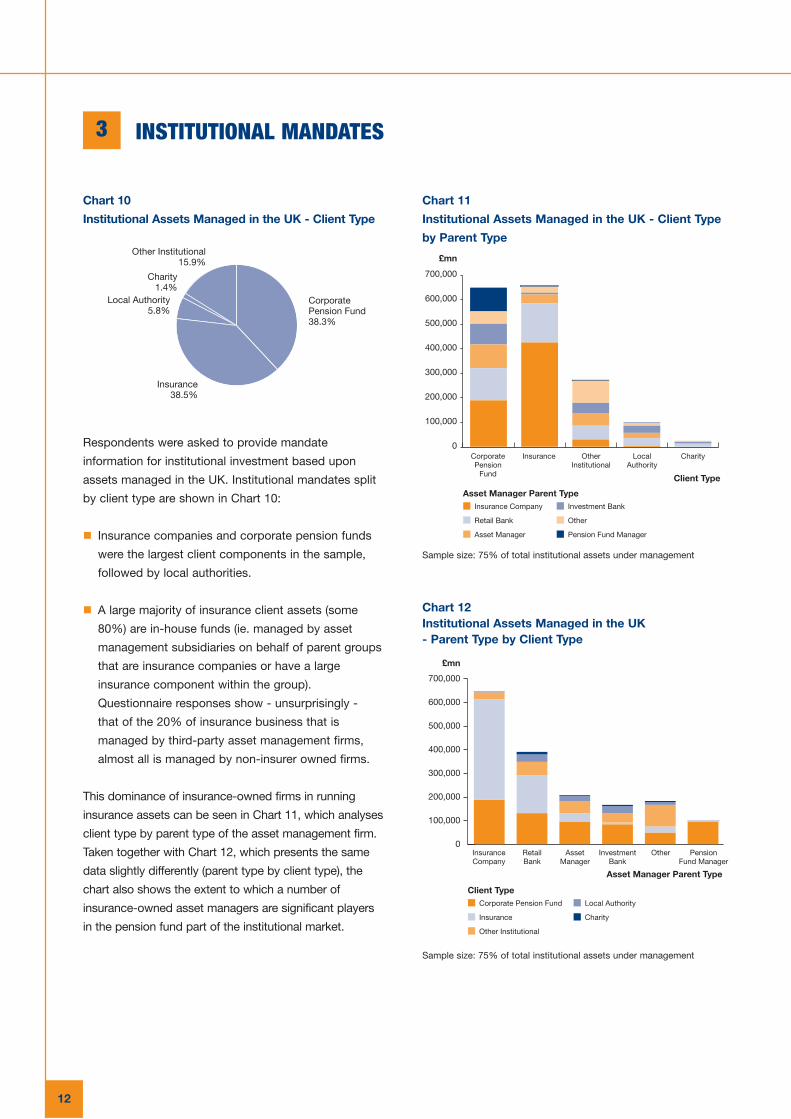
Chart 10
Institutional Assets Managed in the UK - Client Type
Respondents were asked to provide mandate
information for institutional investment based upon
assets managed in the UK. Institutional mandates split
by client type are shown in Chart 10:
� Insurance companies and corporate pension funds
were the largest client components in the sample,
followed by local authorities.
� A large majority of insurance client assets (some
80%) are in-house funds (ie. managed by asset
management subsidiaries on behalf of parent groups
that are insurance companies or have a large
insurance component within the group).
Questionnaire responses show - unsurprisingly -
that of the 20% of insurance business that is
managed by third-party asset management firms,
almost all is managed by non-insurer owned firms.
This dominance of insurance-owned firms in running
insurance assets can be seen in Chart 11, which analyses
client type by parent type of the asset management firm.
Taken together with Chart 12, which presents the same
data slightly differently (parent type by client type), the
chart also shows the extent to which a number of
insurance-owned asset managers are significant players
in the pension fund part of the institutional market.
12
Chart 11
Institutional Assets Managed in the UK - Client Type
by Parent Type
Sample size: 75% of total institutional assets under management
Chart 12Institutional Assets Managed in the UK - Parent Type by Client Type
Sample size: 75% of total institutional assets under management
INSTITUTIONAL MANDATES3
CorporatePension Fund38.3%
Insurance38.5%
Local Authority5.8%
Other Institutional15.9%
Charity1.4%
Client Type
CorporatePension
Fund
Insurance OtherInstitutional
LocalAuthority
Charity
Insurance Company
Retail Bank
Asset Manager
Investment Bank
Other
Pension Fund Manager
Asset Manager Parent Type
0
100,000
200,000
300,000
400,000
500,000
600,000
700,000
£mn
£mn
0
100,000
200,000
300,000
400,000
500,000
600,000
700,000
InsuranceCompany
RetailBank
AssetManager
InvestmentBank
Other PensionFund Manager
Corporate Pension Fund
Insurance
Other Institutional
Local Authority
Charity
Client Type
Asset Manager Parent Type

MULTI-ASSET VS SPECIALIST
While we have not in the past measured the balance
between specialist/single asset class and multi-
asset/balanced mandates, it is clear that there has
been a sustained and marked move away from
balanced mandates since the 1990s as pension funds
adjust their strategies. Within the overall institutional
space, survey responses indicate that specialist
mandates account for 59% of the total.
The responses are analysed across client type in Chart
13. This chart reflects the presence of a number of large
in-house OPS schemes in the sample (which by definition
will be multi-asset). Removing these from the sample
sees the proportion of assets under management for
corporate pension funds subject to specialist mandates
rise to 72%, more comparable with the higher levels seen
in the local authority figures (73%). It also increases the
overall share of specialist mandates from 59% to 64%.
Chart 13Use of Specialist and Multi-Asset Mandates(Institutional Clients)
OVERALL INVESTMENT OBJECTIVES
Chart 14Investment Objectives of Institutional Assets underManagement
This year’s survey splits investment objectives into peer
group, index benchmark (including customised
benchmark), absolute return, liability-led and other.
Chart 14 illustrates the overall balance within
institutional mandates. The index benchmark is the
predominant measure.
Given the rising prominence of liability-led investment
(LLI) products, we tried to measure the extent of usage
by institutional clients.12 As several leading providers
were able to give us data on LLI products, but not as
part of an overall distribution of institutional mandate
objectives, the 2.3% shown in Chart 14 is a considerable
understatement, with our estimate being some 5.3% of
total institutional assets under management.13
We also asked about LLI products within a ranking of
product areas currently growing fastest: 20% of
respondents to this question ranked LLI first or second
in terms of current importance. This figure rises to just
under a third for expectations in three years’ time.
13
% T
ota
l AU
M
Multi-AssetSpecialist
0
10
20
30
40
50
60
70
80
90
100
CorporatePension
Fund
LocalAuthority
Charity 3rdParty
Insurance
In-HouseInsurance
OtherInstitutional
TOTAL
Peer Group9.5%
Index Benchmark 88.0%
Absolute Return0.2%
Liability-Led2.3%
12 Defined as approaches where investment objectives and risks are calculated explicitly with respect to client liabilities. We would differentiatethese from absolute return funds in the sense that the latter are designed to generate positive returns regardless of market conditions, but maynot necessarily be specifically tailored to client liabilities.
13 To measure the true extent of LLI usage, it would also be necessary to survey investment banks, which provide competition for the assetmanagement industry in this area.
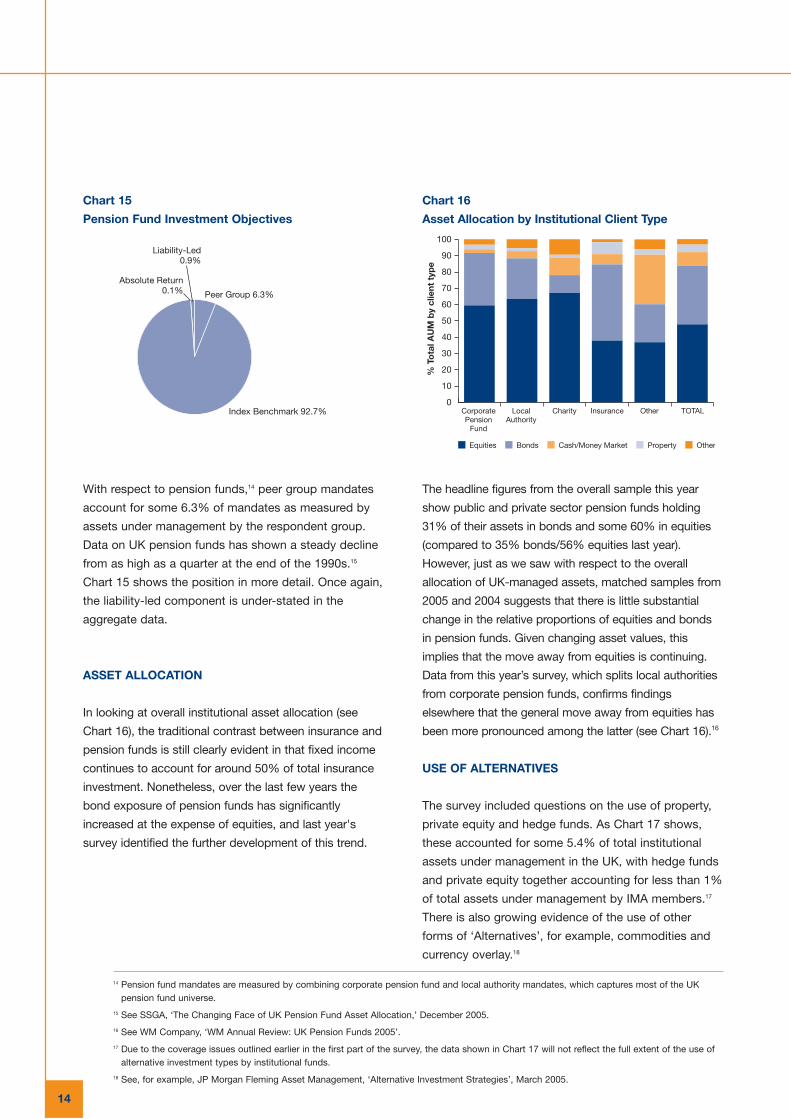
Chart 15
Pension Fund Investment Objectives
With respect to pension funds,14 peer group mandates
account for some 6.3% of mandates as measured by
assets under management by the respondent group.
Data on UK pension funds has shown a steady decline
from as high as a quarter at the end of the 1990s.15
Chart 15 shows the position in more detail. Once again,
the liability-led component is under-stated in the
aggregate data.
ASSET ALLOCATION
In looking at overall institutional asset allocation (see
Chart 16), the traditional contrast between insurance and
pension funds is still clearly evident in that fixed income
continues to account for around 50% of total insurance
investment. Nonetheless, over the last few years the
bond exposure of pension funds has significantly
increased at the expense of equities, and last year's
survey identified the further development of this trend.
14
Chart 16
Asset Allocation by Institutional Client Type
The headline figures from the overall sample this year
show public and private sector pension funds holding
31% of their assets in bonds and some 60% in equities
(compared to 35% bonds/56% equities last year).
However, just as we saw with respect to the overall
allocation of UK-managed assets, matched samples from
2005 and 2004 suggests that there is little substantial
change in the relative proportions of equities and bonds
in pension funds. Given changing asset values, this
implies that the move away from equities is continuing.
Data from this year’s survey, which splits local authorities
from corporate pension funds, confirms findings
elsewhere that the general move away from equities has
been more pronounced among the latter (see Chart 16).16
USE OF ALTERNATIVES
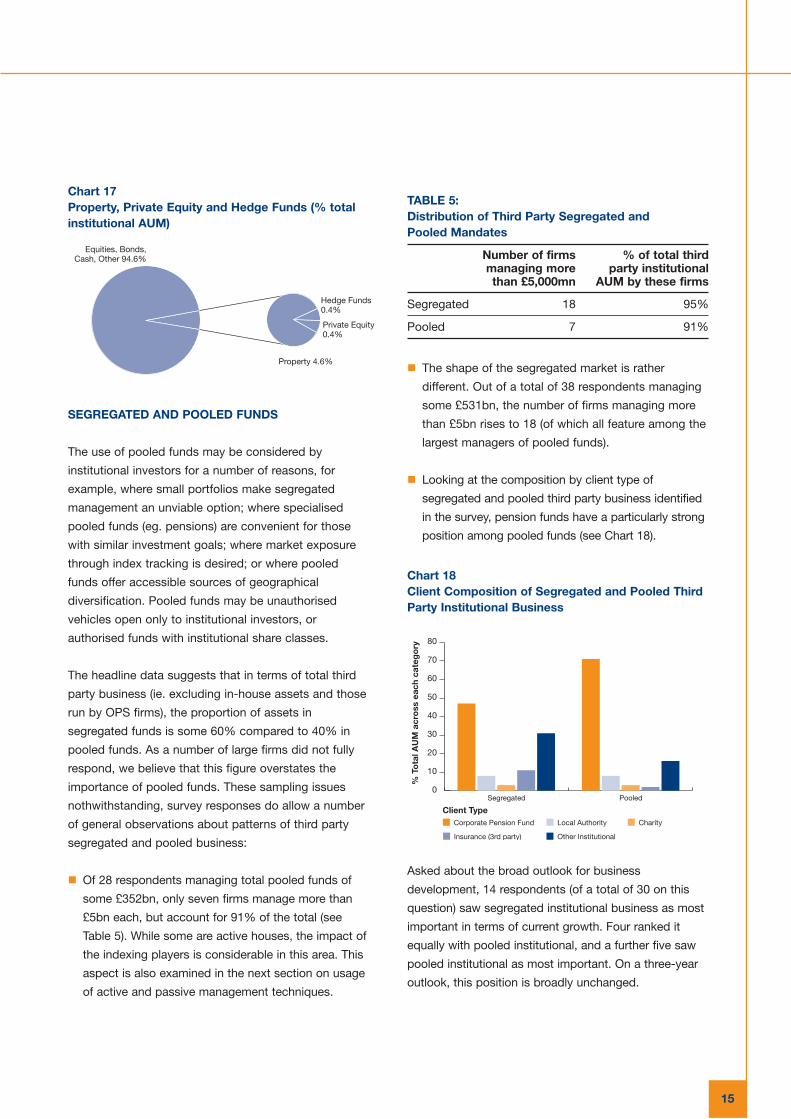
The survey included questions on the use of property,
private equity and hedge funds. As Chart 17 shows,
these accounted for some 5.4% of total institutional
assets under management in the UK, with hedge funds
and private equity together accounting for less than 1%
of total assets under management by IMA members.17
There is also growing evidence of the use of other
forms of ‘Alternatives’, for example, commodities and
currency overlay.18
Peer Group 6.3%
Index Benchmark 92.7%
Absolute Return0.1%
Liability-Led0.9%
% T
ota
l AU
M b
y cl
ient
typ
e
0
10
20
30
40
50
60
70
80
90
100
Equities Bonds Cash/Money Market Property Other
CorporatePension
Fund
LocalAuthority
Charity Insurance Other TOTAL
14 Pension fund mandates are measured by combining corporate pension fund and local authority mandates, which captures most of the UKpension fund universe.
15 See SSGA, ‘The Changing Face of UK Pension Fund Asset Allocation,’ December 2005.
16 See WM Company, ‘WM Annual Review: UK Pension Funds 2005’.
17 Due to the coverage issues outlined earlier in the first part of the survey, the data shown in Chart 17 will not reflect the full extent of the use ofalternative investment types by institutional funds.
18 See, for example, JP Morgan Fleming Asset Management, ‘Alternative Investment Strategies’, March 2005.
15
Chart 17Property, Private Equity and Hedge Funds (% totalinstitutional AUM)
SEGREGATED AND POOLED FUNDS
The use of pooled funds may be considered by
institutional investors for a number of reasons, for
example, where small portfolios make segregated
management an unviable option; where specialised
pooled funds (eg. pensions) are convenient for those
with similar investment goals; where market exposure
through index tracking is desired; or where pooled
funds offer accessible sources of geographical
diversification. Pooled funds may be unauthorised
vehicles open only to institutional investors, or
authorised funds with institutional share classes.
The headline data suggests that in terms of total third
party business (ie. excluding in-house assets and those
run by OPS firms), the proportion of assets in
segregated funds is some 60% compared to 40% in
pooled funds. As a number of large firms did not fully
respond, we believe that this figure overstates the
importance of pooled funds. These sampling issues
nothwithstanding, survey responses do allow a number
of general observations about patterns of third party
segregated and pooled business:
� Of 28 respondents managing total pooled funds of
some £352bn, only seven firms manage more than
£5bn each, but account for 91% of the total (see
Table 5). While some are active houses, the impact of
the indexing players is considerable in this area. This
aspect is also examined in the next section on usage
of active and passive management techniques.
TABLE 5:Distribution of Third Party Segregated and Pooled Mandates
Number of firms % of total third managing more party institutional than £5,000mn AUM by these firms
Segregated 18 95%
Pooled 7 91%
� The shape of the segregated market is rather
different. Out of a total of 38 respondents managing
some £531bn, the number of firms managing more
than £5bn rises to 18 (of which all feature among the
largest managers of pooled funds).
� Looking at the composition by client type of
segregated and pooled third party business identified
in the survey, pension funds have a particularly strong
position among pooled funds (see Chart 18).
Chart 18Client Composition of Segregated and Pooled ThirdParty Institutional Business
Asked about the broad outlook for business
development, 14 respondents (of a total of 30 on this
question) saw segregated institutional business as most
important in terms of current growth. Four ranked it
equally with pooled institutional, and a further five saw
pooled institutional as most important. On a three-year
outlook, this position is broadly unchanged.
% T
ota
l AU
M a
cro
ss e
ach
cate
go
ry
0
10
20
30
40
50
60
70
80
Corporate Pension Fund Local Authority Charity
Insurance (3rd party) Other Institutional
Client TypeSegregated Pooled
Equities, Bonds,Cash, Other 94.6%
Hedge Funds0.4%
Property 4.6%
Private Equity0.4%

ACTIVE VS PASSIVE MANAGEMENT
Indexing products have enjoyed increasing importance
over the past few years as investors make a clearer
differentiation between alpha (value-added by active
management) and beta (market return). There have
also been a number of innovations in this area, such
as exchange-traded funds and enhanced index
products (which attempt to bridge the gap between
active and passive).
We asked this year about the use of passive
management,19 across both segregated and pooled
mandates. Responses suggest that some 20-25% of
total institutional assets may be managed passively,20
and the data supports a number of further observations:
� The majority of passively-run third-party institutional
assets (60%) are in pooled funds, but this clearly
also leaves a sizeable proportion of assets run on a
segregated basis.
� The passive space continues to be dominated by a
small number of firms. While 12 respondent firms
(managing total assets of £1.1trn) had some
institutional assets under passive management, three
firms run over 90% of all the passive assets (by total
institutional assets under management) we have
been able to identify.
16
With respect to active strategies, some 24 firms (of a
total of 37 responding to this question), managing total
assets of £880bn, see active equity as the first or
second most important product area for their business
in terms of current growth, and almost all expect it to
remain so over the next three years. These 24 firms
vary considerably in size, from some of the largest
scale firms to smaller operators.
19 Defined as non-discretionary stock and securities selection (excluding enhanced index products).
20 As with the segregated/pooled split, we believe that partial responses to this question from some firms have resulted in a headline figure –35% of total institutional assets under management are in passive funds - that overstates the actual position. On the basis that responses were received from the largest passive management firms, we estimate the figure to be closer to 20-25%.

17
As we showed in Part One, retail clients account for
some 19% of total assets under management in the
UK, equating to some £530bn. This figure comprises a
range of retail investment vehicles, primarily:
� UK-managed authorised funds (unit trusts, OEICs);
� UK-managed funds domiciled outside the UK (eg.
UCITS, ETFs) marketed to retail investors in the UK
and elsewhere; and
� Investment trusts.
Looking more closely at non-UK domiciled funds, a
number of respondents have significant retail operations
elsewhere in Europe where the assets are largely
managed in the UK, but with domicile outside. We
estimate that some £200bn of UK-managed retail assets
were domiciled outside the UK as at December 2005.
One illustration of the general dynamism of other
European centres is the number of fund launches - Chart
19 shows the relative position of the UK, Luxembourg
and Ireland (see also earlier discussion on domicile, p.9).
Chart 19Fund Launches in Ireland, Luxembourg and the UK(2000-2005)
Source: FERI and IMA
In terms of asset allocation, a striking feature of the retail
market, in contrast to trends seen in the institutional
market in recent years, is the far higher apparent level of
exposure to equities (see Chart 20). However, retail fund
holdings are an imperfect illustration of individual
portfolios. Firstly, retail investors may directly own equities
and bonds. More importantly, they will often be directly
holding other assets, notably cash and property.
Chart 20Retail Assets Managed in the UK - Asset Allocation
UK-AUTHORISED UNIT TRUST AND OEIC MARKET
IMA also collects detailed monthly sales statistics on
the UK-authorised fund sector (unit trusts and OEICs),
referred to as ‘funds’ in this section. In contrast to the
retail numbers given in the previous section, this data
includes both retail and institutional investment in
collective investment schemes. We estimate that the
balance between these two sets of clients as at
December 2005 was some 90% (retail investors) to
10% (institutional investors). This section analyses
developments over the past year in this part of the
industry, with a focus on the retail side.
SIZE AND STRUCTURE
In December 2005, there were 118 companies
providing a total of 2,007 funds with £347bn under
management. The top ten firms, as measured by asset
management firm, accounted for £175bn or 50% of the
total (see Chart 21). The concentration of funds
managed by the top ten firms has been trending up
since 2000 as the number of firms has consolidated.
RETAIL AND UK FUNDS MARKET4
UKLuxembourg Ireland
2005200420032002200120000
200
400
600
800
1000
1200
1400
Fund
laun
ches
Equities72.9%
Bonds 17.7%
Cash/MoneyMarket 3.5%
Property 1.9%Other3.9%
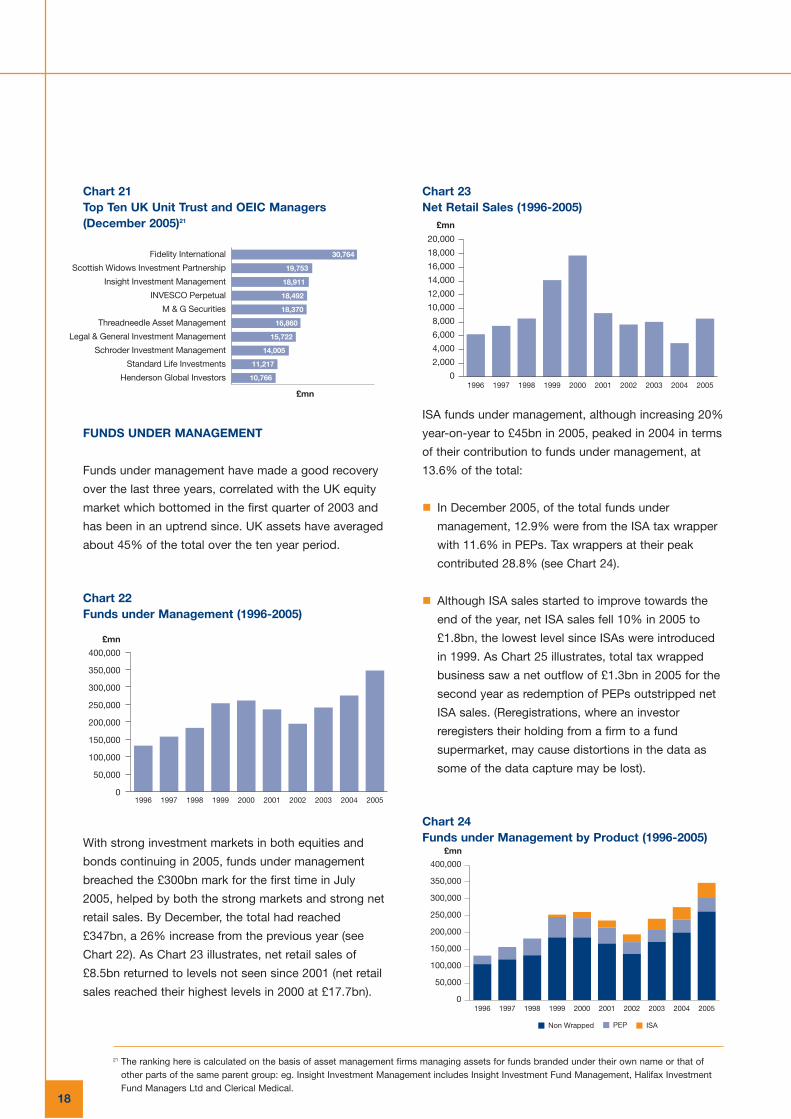
Chart 21Top Ten UK Unit Trust and OEIC Managers(December 2005)21
FUNDS UNDER MANAGEMENT
Funds under management have made a good recovery
over the last three years, correlated with the UK equity
market which bottomed in the first quarter of 2003 and
has been in an uptrend since. UK assets have averaged
about 45% of the total over the ten year period.
Chart 22Funds under Management (1996-2005)
With strong investment markets in both equities and
bonds continuing in 2005, funds under management
breached the £300bn mark for the first time in July
2005, helped by both the strong markets and strong net
retail sales. By December, the total had reached
£347bn, a 26% increase from the previous year (see
Chart 22). As Chart 23 illustrates, net retail sales of
£8.5bn returned to levels not seen since 2001 (net retail
sales reached their highest levels in 2000 at £17.7bn).
18
Chart 23Net Retail Sales (1996-2005)
ISA funds under management, although increasing 20%
year-on-year to £45bn in 2005, peaked in 2004 in terms
of their contribution to funds under management, at
13.6% of the total:
� In December 2005, of the total funds under
management, 12.9% were from the ISA tax wrapper
with 11.6% in PEPs. Tax wrappers at their peak
contributed 28.8% (see Chart 24).
� Although ISA sales started to improve towards the
end of the year, net ISA sales fell 10% in 2005 to
£1.8bn, the lowest level since ISAs were introduced
in 1999. As Chart 25 illustrates, total tax wrapped
business saw a net outflow of £1.3bn in 2005 for the
second year as redemption of PEPs outstripped net
ISA sales. (Reregistrations, where an investor
reregisters their holding from a firm to a fund
supermarket, may cause distortions in the data as
some of the data capture may be lost).
Chart 24Funds under Management by Product (1996-2005)
£mn
0
50,000
100,000
150,000
200,000
250,000
300,000
350,000
400,000
2005200420032002200120001999199819971996
0
2,000
4,000
6,000
8,000
10,000
12,000
14,000
16,000
18,000
20,000
2005200420032002200120001999199819971996
£mn
£mn
0
50,000
100,000
150,000
200,000
250,000
300,000
350,000
400,000
ISAPEPNon Wrapped
2005200420032002200120001999199819971996
£mn
30,764
19,753
18,911
18,492
18,370
16,860
15,722
14,005
11,217
10,766
Fidelity International
Scottish Widows Investment Partnership
Insight Investment Management
INVESCO Perpetual
M & G Securities
Threadneedle Asset Management
Legal & General Investment Management
Schroder Investment Management
Standard Life Investments
Henderson Global Investors
21 The ranking here is calculated on the basis of asset management firms managing assets for funds branded under their own name or that ofother parts of the same parent group: eg. Insight Investment Management includes Insight Investment Fund Management, Halifax InvestmentFund Managers Ltd and Clerical Medical.
19
Chart 25
Quarterly Net Retail Sales and ISA/PEP Net Sales vs
FTSE 100 (1996-2005)
The reason for sluggish sales of tax wrapped products
is unclear. Possible explanations are:
� Money flowing into cash ISAs and therefore not
captured in IMA data;
� Tax wrapped products becoming mature; a 7 year
holding period of funds is typical; and
� Abolition of the 10% tax credit on dividends from
equity investments.
ASSET ALLOCATION22
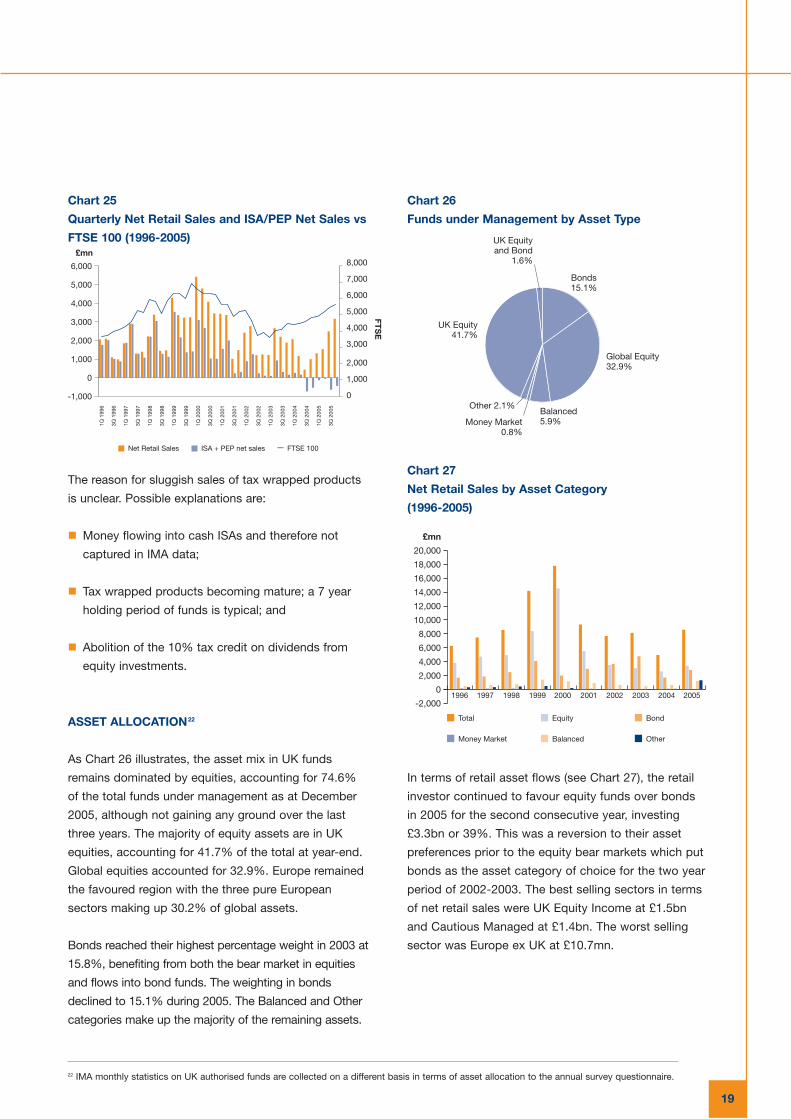
As Chart 26 illustrates, the asset mix in UK funds
remains dominated by equities, accounting for 74.6%
of the total funds under management as at December
2005, although not gaining any ground over the last
three years. The majority of equity assets are in UK
equities, accounting for 41.7% of the total at year-end.
Global equities accounted for 32.9%. Europe remained
the favoured region with the three pure European
sectors making up 30.2% of global assets.
Bonds reached their highest percentage weight in 2003 at
15.8%, benefiting from both the bear market in equities
and flows into bond funds. The weighting in bonds
declined to 15.1% during 2005. The Balanced and Other
categories make up the majority of the remaining assets.
Chart 26
Funds under Management by Asset Type
Chart 27
Net Retail Sales by Asset Category
(1996-2005)
In terms of retail asset flows (see Chart 27), the retail
investor continued to favour equity funds over bonds
in 2005 for the second consecutive year, investing
£3.3bn or 39%. This was a reversion to their asset
preferences prior to the equity bear markets which put
bonds as the asset category of choice for the two year
period of 2002-2003. The best selling sectors in terms
of net retail sales were UK Equity Income at £1.5bn
and Cautious Managed at £1.4bn. The worst selling
sector was Europe ex UK at £10.7mn.
£mn
FTS
E
0
1,000
2,000
3,000
4,000
5,000
6,000
7,000
8,000
-1,000
0
1,000
2,000
3,000
4,000
5,000
6,000
3Q 2
005
1Q 2
005
3Q 2
004
1Q 2
004
3Q 2
003
1Q 2
003
3Q 2
002
1Q 2
002
3Q 2
001
1Q 2
001
3Q 2
000
1Q 2
000
3Q 1
999
1Q 1
999
3Q 1
998
1Q 1
998
3Q 1
997
1Q 1
997
3Q 1
996
1Q 1
996
Net Retail Sales ISA + PEP net sales FTSE 100
Money Market0.8%
Balanced5.9%
UK Equityand Bond
1.6%
Other 2.1%
UK Equity41.7%
Global Equity32.9%
Bonds15.1%
-2,000
0
2,000
4,000
6,000
8,000
10,000
12,000
14,000
16,000
18,000
20,000
Total Equity Bond
Money Market Balanced Other
£mn
1996 1997 1998 1999 2000 2001 2002 2003 2004 2005
22 IMA monthly statistics on UK authorised funds are collected on a different basis in terms of asset allocation to the annual survey questionnaire.
FUNDS OF FUNDS
Chart 28Funds under Management for Funds of Funds(1996-2005)
Funds of funds asset growth also continued strongly in
2005 reaching £23bn, an increase of 56% year-on-year
(see Chart 28):
� Balanced managed funds accounted for the majority
of funds under management, representing 70% of
assets followed by equities at 18%. At December
2005, the split of funds between fettered and
unfettered fund of funds was 56% to 44%.
� Funds of funds net retail sales at £2.3bn increased
67% over the prior year with the second quarter
recording a record all time level of business at
£752mn. Their increasing popularity saw them deliver
about 27% of all retail fund sales, a major increase
from the 4% in 2003 and double their market share of
ten years ago. The Cautious Managed sector
accounted for £846mn of net retail business and was
the most popular sector, followed by Active Managed.
TRACKER AND ETHICAL FUNDS
Tracker and ethical funds remained in a fairly static trend
making up 6% and 1% of the total funds under
management in 2005. There were 67 tracker funds and 44
ethical funds at year-end. During the year, tracker funds
saw a net outflow of retail money of £91mn whilst ethical
received an almost equal inflow of £88mn.
20
Chart 29
Tracker and Ethical Funds under Management
(% total FUM, 1996-2005)
SALES CHANNELS
The dominant channel in the gross sale of retail funds in
2005 was the intermediary channel, taking 77% of the
total. Sales force/tied agents distributed 10.5 %, while
9% went direct. Recent years have seen the growing
influence of fund supermarkets, which are reported
within the intermediary channel above. In the ISA data,
where the fund supermarkets are disaggregated, their
growing dominance is more apparent. In the latest tax
year, the sales force/tied agent channel and the fund
supermarkets were responsible for equal amounts of
gross ISA sales for the first time (see Chart 30).
Chart 30Tax Year Gross ISA Sales by Distribution Channel(1999-2005)
0
5,000
10,000
15,000
20,000
25,000
OtherBalancedEquity
2005200420032002200120001999199819971996
£mn
% T
ota
l FU
M
0
1
2
3
4
5
6
7
Ethical Tracker
2005200420032002200120001999199819971996
0
500
1,000
1,500
2,000
2,500
3,000
3,500
4,000
4,500
£mn
Direct from Public Intermediary
Sales Force/Tied Agent Fund Supermarket Element
Apr 99-Mar 00
Apr 00-Mar 01
Apr 01-Mar 02
Apr 02-Mar 03
Apr 03-Mar 04
Apr 04-Mar 05
Apr 05-Mar 06
21
REVENUE AND FEE STRUCTURES
Twenty-six firms managing £1.6trn of assets in the UK
reported revenue as a proportion of UK assets under
management. Data from the survey suggests that
weighted average revenue as a proportion of total
assets under management was 28 basis points in
2005, equating to some £8bn.
Chart 31 shows revenue split by client type. The central
observation is that most of the higher revenue firms have
a large proportion of retail business. This is as would be
expected given the higher cost base associated with
retail activity (ie. administration overheads and extensive
use of intermediaries for distribution).
Chart 31Revenue by Firm as a Proportion of AssetsManaged in the UK - Split by Client Type
With charging structures within the industry continuing
to evolve, we also asked firms about the extent of the
use of performance-related fees, and also about current
trends in their usage:
� A total of 39 firms, managing £1.7trn, responded to the
question, with 30 saying that they did use performance-
related fees. At this point in time, usage seems more
prevalent in the institutional than the retail market.
� Among those respondents who do use performance
fees, the weighted average proportion of total assets
under management subject to performance-related fees
was 27%. All but five of these respondents indicated
that the use of performance-related fees was increasing.
� A more detailed distribution is shown in Table 6.
TABLE 6:Use of Performance-Related Fees
Proportion of assets Number Total AUM under management of firms by thesesubject to performance firms (£bn)fees (%)
0% 9 £25
1-25% 16 £1,053
26-50% 7 £204
51-75% 5 £359
76-100% 2 £53
TOTAL 39 £1,694
COST BASE
TABLE 7:Costs by Activity (Range and Median)
Range Median Medianlargest ten
Marketing, 0-54% 15.5% 21.0%distribution,client services
Asset Management 14-75% 33.9% 32.3%and research
Transaction process, 3-39% 16.5% 17.6%fund accountingand administration
Compliance, 1-8% 3.0% 3.0%Legal, Audit
Corporate Finance 2-15% 6.9% 13.4%and Admin
IT 2-27% 8.3% 12.5%
Premises 0-13% 6.0% 4.5%
Other 0-17% 2.0% 0.0%
OPERATIONAL ISSUES5
bp
Institutional Retail Private Client Other
0
20
40
60
80
100
120
Respondent 1-26
Respondents were asked to provide a breakdown
of their cost base, split by front, middle and back
office activities. Responses received from 32 firms,
with £1.6trn of assets under management, illustrate
very clearly the diversity of business models within
the industry:
� Looking firstly at asset management and research,
the proportion of the cost base devoted to these
activities varies considerably: from some 14% to
75%. See Chart 32. The largest single group above
the third quartile (>45%) is OPS firms, who by
definition will not have the kind of marketing,
distribution and administration costs seen in other
parts of the industry. As Table 7 shows, the median
for all 31 respondents is 34%, with 17 firms in the
range 25%-45%. For the largest ten firms
responding to this question (each with over
£60bn of assets under management in the UK),
the median is 32.3%.
� With respect to marketing and distribution costs,
where the median is 15.5%, there is a clear
connection, as would be expected, between retail
funds under management and a higher proportion
of cost in this area. For the largest ten firms ranked
by retail funds under management in the UK, the
median is 21%.
� Certain cost categories - for example, IT and
premises - can be affected by one-off changes
that will drop out over a longer time sequence.
However, once again, the proportion of the cost
occupied by IT and premises will in considerable
part be determined by the nature of the firm.
22
Chart 32
Costs by Activity (% of Total by Respondent Firm)
HEADCOUNT, OUTSOURCING AND OFF-SHORING
Staff numbers were gathered from 35 respondents
representing 58% of UK assets under management
or £1.6trn. These firms employ some 12,730 people.
Based on these returns and data from last year's
survey, we estimate direct employment numbers for
UK-based asset management activity at 22,000-25,000.
The overall distribution is summarised in Chart 33, with
more detail provided in Table 8.
Chart 33Distribution of Staff by Activity
0
10
20
30
40
50
60
70
80
90
100
Asset Management Corporate Finance and Admin
Marketing and Client Services IT
Transaction Process Premises
Compliance, Legal, Audit Other
Respondent 1-26
Co
st B
ase
%%
to
tal s
taff
0
5
10
15
20
25
30
Oth
er
IT S
yste
ms
Cor
por
ate
Fina
nce
and
Ad
min
istr
atio
n
Com
plia
nce,
Lega
l, A
udit
Fund
Acc
ount
ing,
adm
inis
trat
ion
Tran
sact
ion
pro
cess
ing
Ass
etm
anag
emen
t
Mar
ketin
g an
dcl
ient
ser
vice
s
23
The data shows core asset management activities (fund
management, research and dealing) accounting for just
over a quarter of total direct employment, with marketing
and client services representing the second largest
segment of employment (21%). Comparing this to the
cost base data, it is clear, as would be expected, that the
higher proportion of costs generally associated with asset
management functions reflects the importance of this
area of the business.
TABLE 8:Sub-Division of Employment in Main Activities
Marketing and Client Services 21%
Marketing, sales, business development 62%
Client services 38%
Asset Management 26%
Fund Management (strategic and operational) 76%
Research/Analysis * 16%
Dealing 7%
Transaction Processing 4%
Transaction processing, settlement 97%
Custody 3%
Fund Accounting and Administration 13%
Investment accounting, performance 51%measurement and reporting
Other fund administration 49%(including CIS administration)
Compliance, Legal and Audit 5%
Compliance 50%
Legal 38%
Audit 12%
Corporate Finance and 9%Corporate Administration
Corporate Finance 32%
HR and training 32%
Other Administration 36%
* In some firms, the fund management and research roles are combined.
However, the personnel structure of the industry is
increasingly complicated due to outsourcing of many
aspects within the asset management value chain.
These staff numbers therefore significantly understate
total employment generated by the sector in the UK:
� Many mutual fund firms outsource a substantial
amount of their activities, notably fund administration
and accounting. However, such outsourcing extends
to larger firms (particularly for the retail aspects of
their operations). Outsourced administration is often
undertaken by specialist third party administration
firms. It may also be undertaken by other asset
management firms, who offer such services (staff
numbers for the latter were excluded in this survey).
� In common with practices in other industries, other
activities - notably IT - are widely outsourced. Eight
of 35 firms who responded to the staff question
outsource at least 50% of their IT functions.
Total sector employment is also understated due to
employment overseas emanating from UK-based asset
management activity:
� With many IMA firms operating at a global level,
some assets are managed outside the UK on behalf
of UK-based clients, whose accounts are run from
the UK.
� With a number of firms domiciling funds outside the UK
and selling their products across Europe, middle and
back office employment is created in other centres.
Data provided by one leading firm showed that while
almost 90% of its European-based asset management
and research staff were in the UK, this figure fell to less
than a half for staff involved in the transaction process
and fund accounting/administration.
The extent to which actual off-shoring is taking place
(ie. existing UK-based jobs being relocated outside the
country for tax, regulatory, cost or service quality
reasons) has been a source of considerable discussion
over the past few years. A major study by OXERA,
commissioned by the IMA and the City of London,
examined the question in some detail.23 It concluded
that while some middle and back office functions
appeared prone to relocation outside the UK, core
asset management activities and marketing/distribution
appeared fairly securely located for the time being. Our
survey this year asked a number of questions about
off-shoring and will monitor the issue in coming years.
The findings broadly confirmed the OXERA study, with
only two respondents indicating that off-shoring was
likely to increase over the next three years.
BROKER RELATIONSHIPS
The survey includes a number of questions on broker
relationships, reflecting issues of ongoing regulatory
interest. This year, we cover four areas:
� Extent of execution-only trades.
� Extent of soft commission remaining and the
introduction of commission sharing arrangements.
� Number of brokers used to complete UK and
international trades.
� Transaction costs analysis.
Execution-Only Trades
Respondents were asked what proportion of trading
by value was completed on an execution-only basis
(including through execution-only brokers, crossing
networks and by direct market access (DMA)):
24
� Of 38 respondents, 11 managing £599bn (35% of total
assets under management in the sample) do 100% of
their business on an execution-only basis. See Table 9.
� In part this reflects the continuing major presence
of indexed funds, but also increasing usage by
active asset managers’ dealing desks of alternative
execution venues to access liquidity and preserve
anonymity. An emerging trend would appear to be
the recognition by some specialist active managers
who have in-house research analysts that brokerage
commission pays purely for access to liquidity.
TABLE 9:Proportion of Business Directed on an ExecutionOnly Basis
Proportion of trade Number Total AUM through brokers on of firms (£bn)execution only basis (%)
<1% 7 £151
1-25% 15 £831
26-50% 3 £141
51-75% 0
76-99% 3 £77
100% 11 £599
39 £1,799
Soft Commission
Respondents were also asked to provide the
proportion of commissions subject to soft commission
arrangements. The number of firms who do not have
soft commission arrangements represented some two
thirds of the sample by assets under management (see
Table 10). In a matched sample, a quarter of firms who
indicated last year that they did use soft commissions
have now ceased the practice. In line with recent
trends, the matched sample shows that the proportion
of commission subject to softing has fallen to 2.6% in
2005 from 4.4% in 2004 on an AUM-weighted basis.
23 See ‘The Competitive Position of London as a Global Financial Centre’ (OXERA report for IMA/City of London), 2005.
25
TABLE 10:Proportion of Total Commmission Paid Subject toSoft Commission Arrangements
Proportion of total Number Total AUM commission paid subject of firms (£bn)to soft commission (%)
0% 31 £1,272
1-10% 7 £502
11-20% 3 £76
Total 41 £1,850
The new FSA rules on Softing and Bundling came
into effect on 1 January 2006, restricting the use of
client commissions to the purchase of research and
execution services, with an explicit list of non-
permitted services. The IMA’s Pension Fund Disclosure
Code was endorsed by the FSA as a suitable standard
for disclosure of the split of commission between
research and execution. As a result of these disclosure
requirements, investment managers have conducted
reviews of their broker relationships in order to
establish what is being paid for execution services
and for research services. The rules also allow for the
purchase of third party research and execution
services from bundled commission.
Commission Sharing Arrangements
A new question was included regarding commission
sharing arrangements (CSAs), which facilitate the
purchase of third party services from bundled
commission arrangements. As of the date of the
survey, 26 firms had no commission sharing
arrangements in place. However, 16 firms, managing
some £230bn of UK equities, have put CSAs in place
for at least part of their business. For more details,
see Table 11.
TABLE 11:Proportion of Trade through Brokers Subject toCommission Sharing
Proportion of trades Number Total AUM by through brokers subject of firms respondentto commission sharing (%) firms (£bn)
0% 26 £919
1-5% 4 £236
6-15% 4 £316
>15% 8 £279
42 £1,750
Number of Brokers
Going forward, the IMA will monitor changing trends
in broker usage which may occur as a result of the
new FSA rules on Softing and Bundling as well as of
increased usage of CSAs. A new question in the
survey has been introduced and respondents were
asked how many brokers were used for the majority
(80%+) of trades:
� As Table 12 shows, some 45% of respondent firms
use 5-10 brokers for UK equities while a similar
number use 11-20. Only one firm uses less than
five, while three use over 20.
� Just under a third of respondents use 5-10 brokers
for overseas execution and a similar proportion use
10-20. Eight respondents use over 20. Broker usage
is clearly also dependent on the typical mandate of
an individual manager e.g. global vs UK.
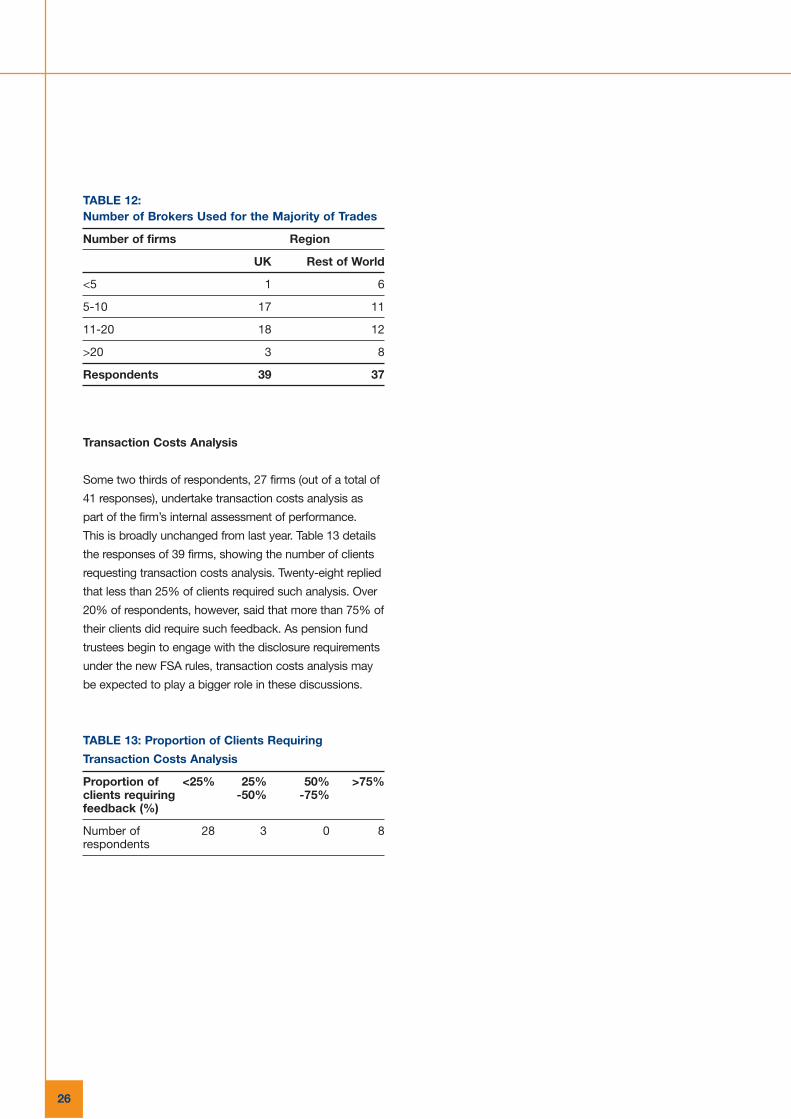
26
TABLE 12:Number of Brokers Used for the Majority of Trades
Number of firms Region
UK Rest of World
<5 1 6
5-10 17 11
11-20 18 12
>20 3 8
Respondents 39 37
Transaction Costs Analysis
Some two thirds of respondents, 27 firms (out of a total of
41 responses), undertake transaction costs analysis as
part of the firm’s internal assessment of performance.
This is broadly unchanged from last year. Table 13 details
the responses of 39 firms, showing the number of clients
requesting transaction costs analysis. Twenty-eight replied
that less than 25% of clients required such analysis. Over
20% of respondents, however, said that more than 75% of
their clients did require such feedback. As pension fund
trustees begin to engage with the disclosure requirements
under the new FSA rules, transaction costs analysis may
be expected to play a bigger role in these discussions.
TABLE 13: Proportion of Clients Requiring
Transaction Costs Analysis
Proportion of <25% 25% 50% >75%clients requiring -50% -75%feedback (%)
Number of 28 3 0 8respondents
27
Aberdeen Asset Management plc
Aberforth Partners LLP
ABN AMRO Asset Management Ltd
AEGON Asset Management Ltd
Aerion Fund Management Ltd
Artemis Investment Management Ltd
AXA Investment Managers Ltd
Baillie Gifford & Co. Ltd
Barclays Global Investors Ltd
Baring Asset Management Ltd
BP Investment Management Ltd
Britannic Asset Management Ltd
(now Resolution Asset Management)
British Airways Pension Investment Management Ltd
Canada Life Asset Management Ltd
Capital International Limited
Cazenove Capital Management Ltd
CCLA Investment Management Ltd
Fidelity International Ltd
First State Investments Ltd
Gartmore Investment Management plc
Henderson Global Investors Ltd
Hermes Pensions Management Ltd
Insight Investment Management Ltd
INVESCO Asset Management Ltd
Investec Asset Management Ltd
JP Morgan Asset Management Ltd
Jupiter Asset Management Ltd
Kvaerner Pensions Investment Management Ltd
Lazard Asset Management Ltd
Legal & General Investment Management Ltd
Liontrust Investment Funds Ltd
Liverpool Victoria Asset Management Ltd
M&G Securities Ltd
Majedie Asset Management Ltd
Marlborough Fund Managers Ltd
Mellon Fund Managers Ltd
Merrill Lynch Investment Managers Ltd
Morley Fund Management Ltd
Odey Asset Management LLP
Pimco Europe Ltd
Rathbone Unit Trust Management Ltd
Rio Tinto Pension Investments Ltd
Rothschild Private Fund Management Ltd
Royal London Asset Management Ltd
Schroder Investment Management Ltd
Scottish Friendly Asset Managers Ltd
Scottish Widows Investment Partnership
Standard Life Investments Ltd
State Street Global Advisers Ltd
Threadneedle Asset Management Ltd
UBS Global Asset Management Ltd
Virgin Money Unit Trust Managers Ltd
Wesleyan Unit Trust Managers Ltd
APPENDIX ONE: QUESTIONNAIRE RESPONDENTS6

28
APPENDIX TWO: STRUCTURE OF SURVEY
This year, the survey has been conducted in a two part
questionnaire: the first part asks a number of questions
about assets managed in the UK; the second looks at a
range of operational issues. We also use a range of
data available in-house within the IMA on industry size
and the structure of the retail funds market.
QUESTIONNAIRE PART ONE
The initial focus of the questionnaire was the value of
total assets managed within the UK regardless of fund
or client domicile.
In terms of the general structure of mandates and
funds, we asked firms to supply:
� Assets under management split by client type across
segregated and collective institutional portfolios.
� Assets under management split by active and passive
management (where passive management is defined
as non-discretionary stock and securities selection).
We next asked about Investment Objectives and Asset
Allocation. Investment Objectives were divided as follows:
� Peer Group
� Index Benchmark (including Customised Benchmark)
� Absolute Return
� Liability-Led
� Other
We also asked for asset allocation across a range of
mandate categories:
� Equities
� Bonds
� Cash/Money Market
� Main Alternatives (Property, Private Equity, Hedge Funds)
� Other
QUESTIONNAIRE PART TWO
Part Two of the questionnaire looks at a range of
operational areas, including:
Business structures
� A general division of the cost base, looking at front,
middle and back office functions.
� An overview of staffing levels based on front, middle
and back office functions.
� The extent of off-shoring and future expectations in
this regard.
Business development
� Geographical areas of business focus, and likely
changes over the next three years.
� Product areas of most importance, and likely
changes over the next three years.

29
Market interaction
� Extent of execution-only trades.
� Extent of soft commission remaining and
commission sharing arrangements.
� Number of brokers used to complete UK and
international trades.
GENERAL POINTS
A number of general points should be noted:
� Unless otherwise specified, all references to ‘Assets
under Management in the UK’ refer to assets under
management by IMA members as at December 2005.
� Not all respondents have been able to provide
information for all questions, and not all questions
have been answered on the same basis. Response
rates have therefore differed across questions.
As in the past, the survey has been designed with
comparability to the previous survey in mind. However,
even where firms replied in both years, some may have
responded to a question last year but not this year or
vice versa. Where meaningful comparisons are
possible, they have been made.
30
APPENDIX THREE: TOP TWENTY GLOBAL MANAGERS
Table 14: Top 20 Global Managers (as at December 2004)
Organisation Country Total assets
(US $mn)
UBS Switzerland $1,975,000
Allianz Group Germany $1,459,323
Barclays Global Investors UK $1,361,949
State Street Global Advisers US $1,354,330
Fidelity Investments US $1,286,107
AXA Group France $1,185,316
Credit Suisse Switzerland $1,078,815
Capital Group US $1,020,952
Vanguard Group US $848,397
JP Morgan Chase US $791,558
Deutsche Asset Management Germany $730,534
Mellon Financial US $707,078
ING Investment Management Netherlands $671,088
Northern Trust Global US $571,883
Morgan Stanley US $563,208
Aviva UK $525,853
AIG Global Investment US $524,677
IXIS Asset Management France $505,987
Prudential Financial US $499,577
Merill Lynch US $496,171
Source: Pensions and Investment/Watson Wyatt Global 500 (2005).

31

32


Investment Management Association
65 Kingsway London WC2B 6TD United Kingdom
Tel: +44 (0)20 7831 0898 Fax: +44 (0)20 7831 9975
www.investmentuk.org
July 2006
Recommended


