
HAL Id: hal-03046782https://hal.archives-ouvertes.fr/hal-03046782
Submitted on 8 Dec 2020
HAL is a multi-disciplinary open accessarchive for the deposit and dissemination of sci-entific research documents, whether they are pub-lished or not. The documents may come fromteaching and research institutions in France orabroad, or from public or private research centers.
L’archive ouverte pluridisciplinaire HAL, estdestinée au dépôt et à la diffusion de documentsscientifiques de niveau recherche, publiés ou non,émanant des établissements d’enseignement et derecherche français ou étrangers, des laboratoirespublics ou privés.
Distributed under a Creative Commons Attribution| 4.0 International License
Biomass burning fuel consumption rates: a fieldmeasurement database
T. T van Leeuwen, G. R van Der Werf, R. G Detmers, G. Rücker, N. H FFrench, S. Archibald, J A Carvalho Jr, G. D Cook, C. Hély, E. S Kasischke, et
al.
To cite this version:T. T van Leeuwen, G. R van Der Werf, R. G Detmers, G. Rücker, N. H F French, et al.. Biomassburning fuel consumption rates: a field measurement database. Biogeosciences, European GeosciencesUnion, 2014, 11 (24), pp.7305-7329. �10.5194/bg-11-7305-2014�. �hal-03046782�

Biogeosciences, 11, 7305–7329, 2014
www.biogeosciences.net/11/7305/2014/
doi:10.5194/bg-11-7305-2014
© Author(s) 2014. CC Attribution 3.0 License.
Biomass burning fuel consumption rates: a field measurement
database
T. T. van Leeuwen1,3, G. R. van der Werf1, A. A. Hoffmann2, R. G. Detmers1,3, G. Rücker4, N. H. F. French5,
S. Archibald6,7, J. A. Carvalho Jr.8, G. D. Cook9, W. J. de Groot10, C. Hély11, E. S. Kasischke12, S. Kloster13,
J. L. McCarty5, M. L. Pettinari14, P. Savadogo15, E. C. Alvarado16, L. Boschetti17, S. Manuri18, C. P. Meyer19,
F. Siegert20, L. A. Trollope21, and W. S. W. Trollope21
1Faculty of Earth and Life Sciences, VU University Amsterdam, Amsterdam, the Netherlands2Independent Expert for Integrated Fire and Natural Resource Management, Sinsheim, Germany3SRON Netherlands Institute for Space Research, Utrecht, the Netherlands4ZEBRIS GbR, Munich, Germany5Michigan Tech Research Institute, Michigan Technological University, Ann Arbor, Michigan, USA6Natural Resources and the Environment, Council for Scientific and Industrial Research, Pretoria 0001, South Africa7School of Animal, Plant and Environmental Sciences, University of the Witwatersrand, Johannesburg 2050, South Africa8Faculty of Engineering, São Paulo State University, Campus of Guaratinguetá, Guaratinguetá, Brazil9CSIRO Land and Water, Darwin, Northern Territory, Australia10Natural Resources Canada-Canadian Forest Service, Sault Ste. Marie, Canada11Centre de Bio-Archéologie et d’Écologie (CBAE UMR 5059 CNRS/Université Montpellier 2/EPHE),
Paléoenvironnements et Chronoécologie, Institut de Botanique, 163 rue Auguste Broussonnet, 34090 Montpellier, France12Department of Geographical Sciences, University of Maryland, College Park, Maryland 20742, USA13Land in the Earth System, Max Planck Institute for Meteorology, Hamburg, Germany14Environmental Remote Sensing Research Group, Department of Geology, Geography and Environment,
Universidad de Alcalá, Alcalá de Henares, Spain15World Agroforestry Centre (ICRAF) c/o International Crop Research Institute for the Semi-Arid Tropics (ICRISAT),
West & Central Africa Region BP 12404, Niamey, Niger16School of Environmental and Forest Sciences, University of Washington, Seattle, Washington 98195, USA17College of Natural Resources, University of Idaho, Moscow, Idaho 83844, USA18Fenner School of Environment and Society, the Australian National University, Canberra, Australia19CSIRO Marine and Atmospheric Research, Aspendale, Victoria, Australia20Biology Department II, GeoBio Center, Ludwig Maximilian University, Großhadener Str. 2,
82152 Planegg-Martinsried, Germany21Research & Development, Working On Fire International, Nelspruit, South Africa
Correspondence to: T. T. van Leeuwen ([email protected])
Received: 2 May 2014 – Published in Biogeosciences Discuss.: 5 June 2014
Revised: 14 October 2014 – Accepted: 3 November 2014 – Published: 19 December 2014
Published by Copernicus Publications on behalf of the European Geosciences Union.
7306 T. T. van Leeuwen et al.: Biomass burning fuel consumption rates
Abstract. Landscape fires show large variability in the
amount of biomass or fuel consumed per unit area burned.
Fuel consumption (FC) depends on the biomass available to
burn and the fraction of the biomass that is actually com-
busted, and can be combined with estimates of area burned
to assess emissions. While burned area can be detected from
space and estimates are becoming more reliable due to im-
proved algorithms and sensors, FC is usually modeled or
taken selectively from the literature. We compiled the peer-
reviewed literature on FC for various biomes and fuel cate-
gories to understand FC and its variability better, and to pro-
vide a database that can be used to constrain biogeochemi-
cal models with fire modules. We compiled in total 77 stud-
ies covering 11 biomes including savanna (15 studies, aver-
age FC of 4.6 t DM (dry matter) ha−1 with a standard devi-
ation of 2.2), tropical forest (n= 19, FC= 126± 77), tem-
perate forest (n= 12, FC= 58± 72), boreal forest (n= 16,
FC= 35± 24), pasture (n= 4, FC= 28± 9.3), shifting culti-
vation (n= 2, FC= 23, with a range of 4.0–43), crop residue
(n= 4, FC= 6.5± 9.0), chaparral (n= 3, FC= 27± 19),
tropical peatland (n= 4, FC= 314± 196), boreal peatland
(n= 2, FC= 42 [42–43]), and tundra (n= 1, FC= 40).
Within biomes the regional variability in the number of mea-
surements was sometimes large, with e.g. only three mea-
surement locations in boreal Russia and 35 sites in North
America. Substantial regional differences in FC were found
within the defined biomes: for example, FC of temperate pine
forests in the USA was 37 % lower than Australian forests
dominated by eucalypt trees. Besides showing the differ-
ences between biomes, FC estimates were also grouped into
different fuel classes. Our results highlight the large variabil-
ity in FC, not only between biomes but also within biomes
and fuel classes. This implies that substantial uncertainties
are associated with using biome-averaged values to repre-
sent FC for whole biomes. Comparing the compiled FC val-
ues with co-located Global Fire Emissions Database version
3 (GFED3) FC indicates that modeling studies that aim to
represent variability in FC also within biomes, still require
improvements as they have difficulty in representing the dy-
namics governing FC.
1 Introduction
Landscape fires occur worldwide in all biomes except
deserts, with frequencies depending mostly on type of vege-
tation, climate, and human activities (Crutzen, 1990; Cooke
and Wilson, 1996; Andreae and Merlet, 2001; Bowman et
al., 2009). The amount of fire-related research is increasing,
partly due to improved abilities to monitor fires around the
world using satellite data and appreciation of the important
role of fires in the climate system and in air quality (Bow-
man et al., 2009, Johnston et al., 2012). Studies focusing on
the effects of fires on the atmosphere require accurate trace
gas and particle emissions estimates. Historically, these are
based on the Seiler and Crutzen (1980) equation, multiplying
burned area, fuel loads (abbreviated as “FL” in the remain-
der of the paper), combustion completeness (abbreviated as
“CC” in the remainder of the paper), and emission factors
over time and space of interest.
These four properties are obtained in different ways and,
generally, uncertainties are substantial (van der Werf et al.,
2010). The burned area may be estimated directly from satel-
lite observations, with the MODerate resolution Imaging
Spectroradiometer (MODIS) 500 m maps (Roy et al., 2005;
Giglio et al., 2009) being currently the most commonly used
products for large-scale assessments. Although small fires
and fires obscured by forest canopies escape detection with
this method (Randerson et al., 2012), the extent of most
larger fires can be relatively well constrained in this way.
With burned area estimates improving, the other parame-
ters may become the most uncertain component when esti-
mating emissions (French et al., 2004) as they are less easily
observed from space. In general, the FL is equivalent to the
total biomass available. New studies do provide estimates of
standing biomass (e.g., Baccini et al., 2012). However, fires
do not necessarily affect standing biomass. Especially in sa-
vannas the trees are usually protected from burning by a thick
barch, and in some of the literature the FL therefore has a
more restrictive definition, referring to only that portion of
the total available biomass that normally burns under speci-
fied fire conditions, which is often only the fine surface fuels.
In both definitions, the FL is typically expressed as the mass
of fuel per unit area on a dry weight basis. CC corresponds
to the fraction of fuel exposed to a fire that was actually con-
sumed or volatilized. Just like total FL, CC cannot be directly
derived from satellite observations. Instead, these quantities
are usually based on look-up tables of biome-averaged val-
ues, or are calculated from global vegetation models includ-
ing dynamic global vegetation models (DGVM, e.g., Kloster
et al., 2010) and biogeochemical models (e.g., Hély et al.,
2007; van der Werf et al., 2010).
Another approach that has been developed over the past
decade is the measurement of fire radiative power (FRP)
(Wooster et al., 2003, 2005; Kaiser et al., 2012). FRP per
unit area relates directly to the fuel consumption (abbreviated
as “FC” in the remainder of the paper) rate, which again is
proportional to the fire emissions. The FRP method has sev-
eral advantages compared to the Seiler and Crutzen (1980)
approach, such as the ability to detect smaller fires and the
fact that the fire emissions estimates derived this way do not
rely on FL or CC. One disadvantage is that the presence of
clouds and smoke can prevent the detection of a fire, and the
poor temporal resolution of polar orbiting satellites hampers
the detection of fast-moving or short-lived fires (which still
can show a burn scar in the burned area method), and makes
the conversion of FRP to fire radiative energy (FRE, time-
integrated FRP) difficult.
Biogeosciences, 11, 7305–7329, 2014 www.biogeosciences.net/11/7305/2014/

T. T. van Leeuwen et al.: Biomass burning fuel consumption rates 7307
Finally, emission factors, relating the consumption of dry
matter to trace gas and aerosol emissions of interest, are
obtained by averaging field measurements for the different
biomes. Andreae and Merlet (2001) have compiled these
measurements into a database that is updated annually, while
Akagi et al. (2011) used a similar approach to derive biome-
averaged emission factors but focused on measurement of
fresh plumes only and provided more biome-specific infor-
mation. The accompanying database is updated frequently
and is online.
To improve and validate fire emissions models, it is crucial
to gain a better overview of available FC measurements, as
well as of the FL and CC components that together govern
FC. This is obviously the case for emissions estimates based
on burned area, but FRP estimates could also benefit from
this information because one way to constrain these estimates
is by dividing the fire-integrated FRE by the fire-integrated
burned area, which in principle should equal FC.
Over the last few decades, many field measurements of
FL and CC have been made over a range of biomes and geo-
graphical locations. An examination of these studies revealed
several generalities: forested ecosystems in general show rel-
atively little variability in FL over time for a given location,
but CC can vary due to weather conditions. Fine fuels usually
burn more completely than coarser fuels, and therefore CC
in grassland savannas is often higher than in forested ecosys-
tems. While CC in the savanna biome shows relatively little
variability over time, the FL can vary on monthly timescales
depending on season, time since fire, and grazing rates. An-
other generalization that can be made is that FL in boreal
and tropical forests are relatively similar, but the distribution
into components (organic soil, boles, peat) is very different,
with FL in tropical forests being mostly composed of above-
ground biomass, while in the boreal region the organic soil
(including fermentation and humus layers) represents a large
part of the FL. Overall CC is often higher in tropical forests
though, leading to higher FC values.
While these findings are relatively easy to extract from the
body of literature, what is lacking is a universal database list-
ing all the available measurements so that they can be com-
pared in a systematic way, used to constrain models, and to
identify gaps in our knowledge with regard to spatial repre-
sentativeness. Building on Akagi et al. (2011), who listed 47
measurements for nine fuel types, this paper is a first attempt
to establish a complete database listing all the available FC
field measurements for the different biomes that were found
in the peer-reviewed literature. We focus on FC estimates,
but if FL and/or CC were reported separately, these were in-
cluded as well. The database, available at http://www.falw.
vu/~gwerf/FC, will be updated when new information be-
comes available. In follow-up papers we aim to provide more
in-depth analyses of the variability we found; the goal of this
paper is to give a quantitative overview of FC measurements
made around the world to improve large-scale fire emissions
assessments. This paper is organized as follows: in Sect. 2,
we list all the measurements and divide them into 11 differ-
ent biomes. In that section we also provide a short summary
of the methods used during the field campaigns, give a brief
introduction to fire processes in each biome, and present data
for different fuel classes (ground, surface, and crown fuels).
Our findings are discussed in Sect. 3, and in addition a com-
parison between the FC field measurements and (1) the val-
ues used in the GFED3 (van der Werf et al., 2010) modeling
framework, and (2) several FRE-derived estimates, is given.
Finally, our results are summarized in Sect. 4.
2 Measurements
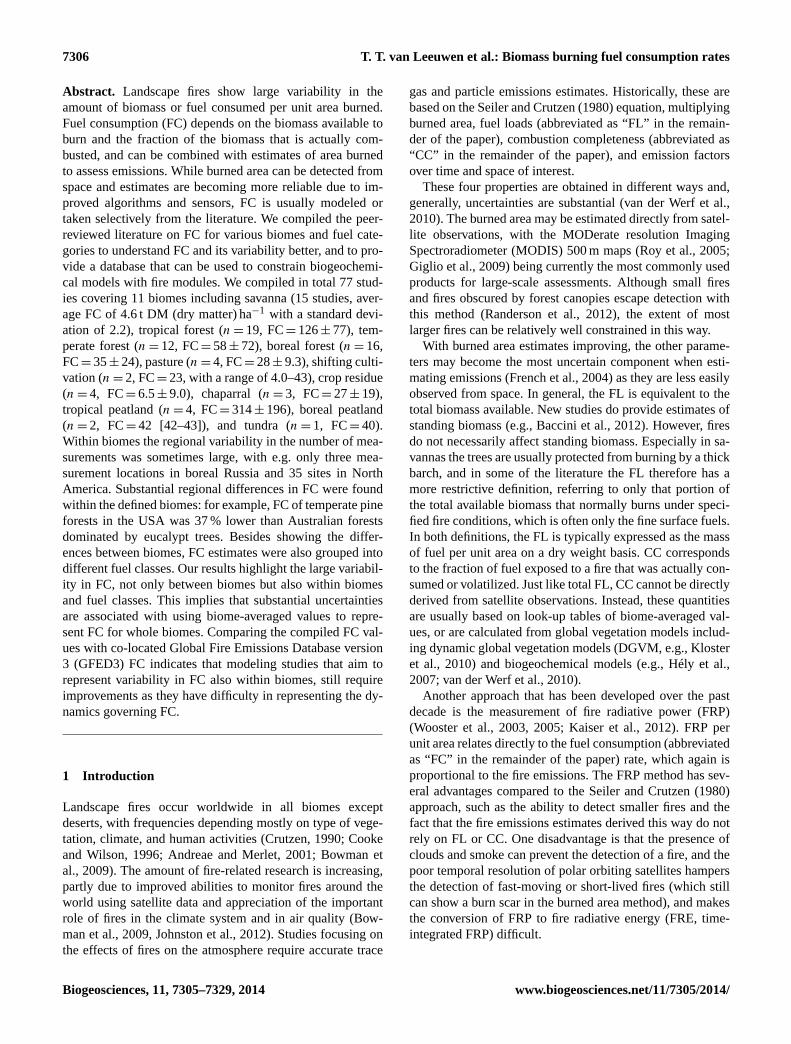
Figure 1 provides an overview of the locations where peer-
reviewed FC was measured in the field, overlaid on mean
annual fire carbon (C) emissions (van der Werf et al., 2010).
Field measurements of FC were conducted in most fire-prone
regions in the world, including the “arc of deforestation” in
Amazonia, the boreal regions of North America, and savan-
nas and woodlands in Africa, South America and Australia.
Due to ecological, technical, and logistical reasons (e.g.,
wildfire versus prescribed fire), the FL and FC sampling pro-
cedures at these measurement locations have ranged in scope
from simple and rapid visual assessment (e.g., Maxwell,
1976; Sandberg et al., 2001) to highly detailed measurements
of complex fuel beds along lines (line transect method: van
Wagner, 1968) or in fixed areas (planar intersect method;
Brown, 1971) that take considerable time and effort. Most
of the studies we found in the literature rely on the planar
intersect method (PIM), where fuel measurement plots are
typically divided into multiple, randomized smaller subplots.
The (small-size) biomass in these subplots is oven dried and
weighed both pre- and post-fire to estimate the CC and to
determine the FC. The consumption of larger-size material
(diameter > 10 cm) is often estimated based on experimental
observations of randomly selected trunks and branches that
were identified before the fire (Araújo et al., 1999). The PIM
is mainly applied in prescribed burns, and obtaining FC mea-
surements for large wildfires is logistically more challenging
but can be based on comparing burned and adjacent unburned
patches. Usually, the total FC of a fire is presented, but some
studies also include separate values for different fuel cate-
gories of the total below-ground biomass (peat, organic soils,
and roots) and total above-ground biomass (above-ground lit-
ter and live biomass). Diameters of woody fuels have been
classified according to their “time-lag”, which refers to the
length of time that a fuel element takes to respond to a new
moisture content equilibrium (Bradshaw et al., 1983). The
time lag categories traditionally used for fire behavior are
specified as 1, 10, 100, and 1000 h, and correspond to round
woody fuels in the size ranges of 0–0.635, 0.635–2.54, 2.54–
7.62, and 7.62–20.32 cm, respectively. In this study, we used
US fire management standards to classify fuels into three
different categories: (1) ground (all materials lying beneath
www.biogeosciences.net/11/7305/2014/ Biogeosciences, 11, 7305–7329, 2014
7308 T. T. van Leeuwen et al.: Biomass burning fuel consumption rates
Fuel Consumption field measurement locations
SavannaTropical forestTemperate forestBoreal forestPastureShifting cultivationCrop residueChaparralTropical peatlandBoreal peatlandTundra
<1 1 - 25 25 - 100 100 - 250 >250
Figure 1. Fuel consumption field measurement locations for different biomes. Background map shows annual GFED3 fire C emissions in
g C m−2 year−1, averaged over 1997–2009.
the surface, including organic soil, roots, rotten buried logs,
and other woody fuels), (2) surface (all materials lying on or
immediately above the ground, including needles or leaves,
grass, small dead wood, downed logs, stumps, large limbs,
low brush, and reproduction) and (3) crown (aerial) fuel (all
green and dead materials located in the upper forest canopy,
including tree branches and crowns, snags, moss, and high
brush).
Although a substantial body of grey literature of FC mea-
surements is available, we focused on peer-reviewed stud-
ies. An exception was made for a few reports that focus
on measurements conducted in the boreal forest and cha-
parral biome, because these reports were extensive and cited
in peer-reviewed literature. Because the available data from
peer-reviewed literature were obtained from a wide variety
of sources spanning multiple decades, the reported FC data
needed to be standardized. We converted all FC measure-
ments to units of tons dry matter per hectare (t ha−1), which
is the most commonly used unit. A carbon to dry matter con-
version factor of 2 was used to convert carbon FC values to
dry matter FC values. We note though that this conversion
factor is not always representative of all biomes. Especially
in the boreal regions – having a relative large contribution
of organic soil fuels – but also in other biomes, this factor
is sometimes lower, and therefore our approach may slightly
overestimate FL and FC.
In Table 1 we present the FL, CC, and FC data compiled
for 11 different biomes that are frequently used in global
fire emissions assessments (e.g., van der Werf et al., 2010;
Wiedinmeyer et al., 2011; Kaiser et al., 2012; Randerson
et al., 2012). Some studies provided data for specific fuel
classes (e.g., ground fuels) only, while others estimated a to-
tal FC for both the below- and above-ground biomass. The
data presented in Table 1 focused on FC. Additional stud-
ies on FL measurements exist and were not included here,
but are listed in a spreadsheet that is available online at
http://www.falw.vu/~gwerf/FC. These estimates were exten-
sive, mostly for southern Africa (e.g., Scholes et al., 2011)
and Australia (e.g., Rossiter et al., 2003). Including these ad-
ditional field measurements may change regional FL aver-
ages. More specific details on the measurements and different
fuel categories for each biome are listed in Sects. 2.1–2.11.
2.1 Savanna
Savanna fires in the tropics can occur frequently, in some
cases annually. Their FL consists mainly of surface fuels
(like grass and litter from trees), and is influenced both by
rainfall of the previous years and the time since the last fire
(Gill and Allan, 2008). Traditionally, (African) savannas are
split into dry and wet forms (Menaut et al., 1995). This split
occurs at a precipitation rate of about 900 mm year−1. Most
savanna fires burn due to human ignition, but it is believed
that these systems are seldom ignition limited, and more of-
ten limited by available fuel (Archibald et al., 2010). Fire
incidence generally increases after years of above-average
rainfall, especially in dry savannas with low population den-
sities (van Wilgen et al., 2004; Russell-Smith et al., 2007). As
these systems are generally fuel limited, grass production and
consumption by herbivores are very important factors con-
trolling the extent of area burned, particularly in drier regions
Biogeosciences, 11, 7305–7329, 2014 www.biogeosciences.net/11/7305/2014/

T. T. van Leeuwen et al.: Biomass burning fuel consumption rates 7309
Table 1. Location, fuel load (FL), combustion completeness (CC) and fuel consumption (FC) for field measurements conducted in the
savanna (a), tropical forest (b), temperate forest (c), boreal forest (d), pasture (e), shifting cultivation (f), crop residue (g), chaparral (h),
tropical peat (i), boreal peat (j), and tundra biome (k). Standard deviation (SD) is shown in parenthesis, and values indicated in bold were
used to calculate the biome average.
Refa Lat. Lon. Location FL CC FC Description
(◦) (◦) (t ha−1) (%) (tha−1)
(a)
1 25.15 S 31.14 E Kruger Park, South Africa 4.4 (1.4) 80 (16) 3.5 (1.4) Lowveld sour bushveld savanna
1 12.35 S 30.21 E Kasanka National Park, Zambia 5.4 (2.1) 81 (15) 4.2 (1.0) Dambo, miombo, chitemene
1 16.60 S 27.15 E Choma, Zambia 5.1 (0.4) 88 (2) 4.5 (–) Semi-arid miombo
2 14.52 S 24.49 E Kaoma local forest, Zambia 5.8 (3.8) 53 (32) 2.2 (1.2) Dambo and miombo
3 15.00 S 23.00 E Mongu region, Zambia 4.2 (0.8) 69 (21) 2.9 (0.9) Dambo and floodplain
4 12.22 N 2.70 W Tiogo state forest, Senegal 5.8 (1.6) 75 (15) 4.2 (0.7) Grazing and no grazing
5 15.84 S 47.95 W Brasilia, Brazil 8.3 (1.3) 88 (13) 7.2 (0.9) Different types of cerrado
6 8.56 N 67.25 W Calaboza, Venezuela 6.9 (2.3) 82 (17) 5.5 (1.9) Protected savanna for 27 years
7 15.51 S 47.53 W Brasilia, Brazil 8.3 (–) 90 (–) 7.5 (–) Campo limpo and campo sujo
8 15.84 S 47.95 W Brasilia, Brazil 8.9 (3.1) 92 (4.1) 8.2 (2.8) Different types of cerrado
9 3.75 N 60.50 W Roraima, Brazil 6.1 (3.6) 56 (27) 2.6 (0.9) Different types of cerrado
10 12.40 S 132.50 E Kapalga, Kakadu, Australia 4.8 (1.3) 94 (0.6) 4.5 (1.3) Woodland
11 12.30 S 133.00 E Kakadu National Park, Australia 5.6 (0.9) 91 (–) 5.1 (–) Tropical savanna
12 12.43 S 131.49 E Wildman Reserve, Australia 2.9 (1.8) 91 (14) 2.4 (1.1) Grass and woody litter
13 12.38 S 133.55 E Arnhem Plateau, Australia 3.6 (3.1) 44 (35) 1.4 (1.6) Early and late season fires
14 12.38 S 133.55 E Arnhem Plateau, Australia 8.5 (–) 39 (–) 4.8 (–) Grass and open woodland
15 17.65 N 81.75 E Kortha Valasa and Kudura, India 35 (6.4) 22 (7.7) 7.7 (2.6) Woodland
(b)
5 4.30 S 49.03 W Marabá, Pará, Brazil 207 (–) 48 (–) 103 (–) Primary and secondary forest
16 2.29 S 60.09 W Fazenda Dimona, Manaus, Brazil 265 (–) 29 (–) 77 (–) 200 ha clearing for pasture
17 7.98 S 38.32 W Serra Talh., Pernambuco, Brazil 74 (0.2) 87 (8.6) 64 (6.4) Second-growth tropical dry forest
18 4.50 S 49.01 W Marabá, Pará, Brazil 364 (–) 52 (–) 190 (–) Cleared for pastures
18 15.85 S 60.52 W Santa Barbara, Rondônia, Brazil 326 (–) 50 (–) 166 (–) Cleared for shifting cultivation
19 2.61 S 60.17 W Manaus, Brazil 425 (–) 25 (–) 107 (–) Tropical dense rainforest
20 9.11 S 63.16 W Jamari, Rondônia, Brazil 377 (31) 50 (4.5) 191 (33) Primary forest slash
21 2.61 S 60.17 W Manaus, Brazil 402 (–) 20 (–) 82 (–) Humid dense tropical forest
22 10.16 S 60.81 W Ariguimes, Rondônia, Brazil 307 (49) 36 (–) 110 (–) Open tropical forest
23 3.37 S 52.62 W Altamira, Pará, Brazil 263 (–) 42 (–) 110 (–) Lowland amazonian dense forest
24 2.50 S 48.12 W Igarape do vinagre, Pará, Brazil 214 (–) 20 (–) 43 (–) Tropical dense rainforest
25 5.35 S 49.15 W Djair, Pará, Brazil 121 (17) 43 (–) 52 (–) Slashed second-growth forest
25 9.20 S 60.50 W Rondônia, Brazil 118 (45) 56 (7.7) 65 (21) Second-, third-growth forest
25 4.30 S 49.03 W José, Pará, Brazil 64 (4.0) 86 (–) 55 (–) Third-growth forest
26 2.34 S 60.09 W Fazenda dimona, Manaus, Brazil 369 (187) 30 (–) 111 (–) Lowland amazonian dense forest
27 9.52 S 56.06 W Alta floresta, Mato Grosso, Brazil 496 (–) 39 (18) 192 (87) 1, 4, and 9 ha clearings
28 9.97 S 56.34 W Alta floresta, Mato Grosso, Brazil 306 (–) 24 (–) 73 (–) Primary forest, 4 ha
29 12.53 S 54.88 W Feliz Natal, Mato Grosso, Brazil 219 (–) 71 (–) 155 (–) Seasonal semi-deciduous forest
30 7.90 S 72.44 W Cruzeiro do Sul, Acre, Brazil 583 (–) 39 (–) 226 (–) Primary forest, 4 ha clearing
31 18.35 N 95.05 W Los Tuxtlas, Mexico 403 (–) 95 (–) 380 (–) Evergreen tropical forest
32 19.30 N 105.3 W San Mateo, Jalisco, Mexico 127 (–) 71 (–) 91 (–) Tropical dry forest
33 0.52 S 117.01 E East Kalimantan, Indonesia 237 (106) 56 (24) 120 (47) Lightly and heavily disturbed stands
(c)
34 34.80 N 82.60 W Southern Appalachians, USA 110 (–) 59 (–) 65 (–) Mixed pine hardwoods
34 35.21 N 83.48 W Nantahala, N. Carolina, USA 177 (49) 52 (5.5) 93 (34) Pine: jacob w. and e., devil den
34 36.00 S 79.10 W Hillsborough, N. Carolina, USA 21 (1.2) 11 (–) 2.3 (–) Loblolly pine forest floor
34 34.80 N 82.60 W South East Piedmont, USA – – 5.2 (3.4) Pinus taeda plantation, forest floor
34 37.50 N 122.00 W South East Coastal plain, USA – – 15 (9.1) Pine forest floor
35 34.82 N 94.13 W Scott County, Arkansas, USA 10 (–) 45 (–) 4.7 (–) Shortleaf pine grassland
36 36.60 N 118.81 W Sequoia National Park, USA 230 (–) 92 (–) 212 (–) Mixed conifer trees
37 38.90 N 120.67 W Dark Canyon Creek, USA 141 (49) 79 (–) 111 (–) Two week post fire
38 38.90 N 120.62 W Blodgett Forest, California, USA 154 (–) 70 (–) 108 (–) Mixed conifer: moist and dry burn
39 24.73 N 81.40 W National Key Deer Refuge, USA 23 (5.9) 57 (11) 13 (4.3) Pine forest, potential fuels
40 42.40 N 124.10 W Southwestern Oregon, USA – – 39 (–) Mixed conifer forest
41 33.56 N 81.70 W Savannah River, USA 19 (–) 55 (–) 11 (–) Mature loblolly, old longleaf pine
42 34.63 N 77.40 W Camp Lejeune, N. Carolina, USA 11 (3.8) 45 (29) 5.6 (4.7) Pine understory
42 34.01 N 80.72 W Fort Jackson, S. Carolina, USA 10 (–) 54 (–) 6.3 (2.0) Pine understory
34 36.00 S 148.00 E Southeastern Australia 79 (–) 84 (–) 67 (–) 27 year old pine plantation
43 33.68 S 116.25 E Wilga, Australia 48 (–) 76 (–) 28 (–) Eucalypt forest
43 34.20 S 116.34 E Quillben, Australia 183 (–) 46 (–) 58 (–) Eucalypt forest
43 33.91 S 116.16 E Hester, Australia 101 (–) 68 (–) 53 (–) Eucalypt forest
43 37.09 S 145.08 E Tallarook, Victoria, Australia 60 (–) 61 (–) 27 (–) Eucalypt forest
43 33.93 S 115.46 E McCorkhill, Australia 70 (–) 78 (–) 43 (–) Eucalypt forest
43 43.22 S 146.54 E Warra, Tasmania 644 (–) 62 (–) 299 (–) Eucalypt forest
43 35.77 S 148.03 E Tumbarumba, Australia 99 (–) 70 (–) 47 (–) Eucalypt forest
44 19.50 N 99.50 W Mexico City, Mexico – – 17 (12) Pine-dominated forest
www.biogeosciences.net/11/7305/2014/ Biogeosciences, 11, 7305–7329, 2014

7310 T. T. van Leeuwen et al.: Biomass burning fuel consumption rates
Table 1. Continued.
Refa Lat. Lon. Location FL CC FC Description
(◦) (◦) (t ha−1) (%) (tha−1)
(d)
45 46.98 N 83.43 W Aubinadong River, ON, Canada 99 (4.2) 66 (5.4) 34 (6.6) Different depth classes used
46 46.78 N 83.33 W Sharpsand Creek, ON, Canada 48 (10) 49 (18) 23 (7.6) Immature jack pine
47 48.92 N 85.29 W Kenshoe Lake, ON, Canada 332 (–) 7.5 (–) 24 (–) Surface and crown
48 63.38 N 158.25 W Innoko, Alaska, USA – – 37 (7.0) Black spruce forest/shrub/bog
49 64.45 N 148.05 W Rosie Creek, Alaska, USA – – 83 Ground fuels
49 60.43 N 149.17 W Granite Creek, Alaska, USA – – 30 Ground fuels
49 67.14 N 150.18 W Porcupine, Alaska, USA – – 25 Ground fuels
49 63.12 N 143.59 W Tok River, Alaska, USA – – 51 Ground fuels
49 63.45 N 145.12 W Dry Creek, Alaska, USA – – 41 Ground fuels
49 63.08 N 142.30 W Tetlin, Alaska, USA – – 56 Ground fuels
49 63.50 N 145.15 W Hajdukovich Creek, Alaska, USA – – 129 Ground fuels
50 61.60 N 117.20 W Fort Providence, NT, Canada 83 (10) 44 (7.6) 36 (5.8) Jack pine and black spruce
51 65.10 N 147.30 W Alaska, USA – – 19 (1.7) Forest floor
52 64.40 N 145.74 W Delta Junction, Alaska, USA 75 (–) 48 (–) 35 (–) Ground fuels: (non)-permafrost
53 53.92 N 105.70 W Montreal Lake, SK, Canada 43 (4.0) 62 (7.5) 26 (3.9) Spruce, pine, mixed wood
54 65.03 N 147.85 W Fairbanks, Alaska, USA 95 (17) 61 (17) 57 (19) Differently facing slopes
55 46.87 N 83.33 W Sharpsand Creek, ON, Canada 13 (2.0) 69 (32) 9 (4.0) Experimental fire: forest floor
55 48.87 N 85.28 W Kenshoe Lake, ON, Canada 17 (3.0) 35 (13) 6 (2.0) Experimental fire: forest floor
55 61.37 N 117.63 W Fort Providence, NT, Canada 47 (9.0) 36 (9.0) 17 (3.0) Experimental fire: forest floor
55 61.69 N 107.94 W Porter Lake, NT, Canada 15 (0.0) 60 (20) 9 (3.0) Experimental fire: forest floor
55 55.07 N 114.03 W Hondo, AB, Canada 3 (1.0) 33 (35) 1 (1.0) Experimental fire: forest floor
55 59.31 N 111.02 W Darwin Lake, NT, Canada 18 (3) 72 (20) 13 (3.0) Experimental fire: forest floor
55 55.74 N 97.91 W Burntwood River, MB, Canada 72 (12) 26 (8.0) 19 (5.0) Wildfire: forest floor
55 54.29 N 107.78 W Green Lake, SK, Canada 36 (13) 86 (54) 31 (16) Wildfire: forest floor
55 53.57 N 88.62 W Kasabonika, ON, Canada 69 (19) 55 (46) 38 (30) Wildfire: forest floor
55 55.74 N 97.85 W Thompson, MB, Canada 23 (14) 87 (63) 20 (8.0) Wildfire: forest floor
55 54.05 N 105.81 W Montreal Lake, SK, Canada 61 (41) 57 (47) 35 (17) Wildfire: forest floor
55 64.06 N 139.43 W Dawson City, YT, Canada 84 (30) 46 (31) 39 (22) Wildfire: forest floor
55 59.40 N 113.03 W Wood Buffalo Nat. Pk., Canada 37 (9.0) 59 (35) 22 (12) Wildfire: forest floor
56 60.49 N 150.98 W Soldotna, Alaska, USA 91 (22) 37 (5.2) 33 (4.8) Mystery creek 1–3
56 61.61 N 149.04 W Palmer, Alaska, USA 84 (4.2) 61 (3.5) 51 (5.7) Deshka 1–2
56 62.69 N 141.77 W Tetlin Refuge, Alaska, USA 105 (16) 45 (15) 49 (20) Tetlin, chisana 1–4
56 64.87 N 147.71 W Fairbanks, Alaska, USA 86 (16) 36 (23) 32 (22) Bonanza creek, frostfire
57 63.00 N 142.00 W Alaska, USA 152 (–) 59 (–) 90 (–) Black spruce forest
58 65.00 N 146.00 W Alaska, USA 72 (–) 58 (–) 40 (–) Black spruce forest
59 60.45 N 89.25 E Bor, Krasnoyarsk, Russia 34 (–) 50 (–) 17 (–) Pine-lichen forest and litter
60 58.58 N 98.92 E Lower Angara, Russia 54 (12) 31 (15) 17 (8.6) Scots pine, larch mixed wood
60 58.70 N 98.42 E Lower Angara, Russia 43 (–) 42 (–) 18 (–) Scots pine, larch mixed wood
(e)
20 9.17 S 63.18 W Jamari, Rondônia, Brazil 66 (13) 31 (10) 21 (17) 12 year old pasture site
61 5.30 S 49.15 W Fransico, Pará, Brazil 53 (4.8) 83 (–) 44 (–) Two slash fires prior to burning
61 9.20 S 60.50 W João and Durval, Rondônia, Brazil 96 (–) 34 (–) 30 (–) 4 year old pasture site
62 2.54 N 61.28 W Vila de Apiau, Roraíma, Brazil 119 (–) 20 (–) 24 (–) Pasture and forest
32 19.30 N 105.3 W San Mateo, Jalisco, Mexico 35 (–) 69 (–) 23 (–) High and low severity
(f)
63 10.53 S 31.14 E Kasama, Zambia 75 (–) 64 (–) 43 (–) Shifting cultivation
64 17.59 N 81.55 E Damanapalli and Velegapalli, India 14 (–) 30 (–) 4.0 (–) Shifting cultivation in dry forest
(g)
65 40.00 N 2.00 W Spain, Europe 1.4 (–) 80 (–) 1.1 (–) Cereal crops
66 22.85 S 47.60 W Piracicaba, Sao Paulo, Brazil – – 20 (–) Sugar cane
67 33.94 N 118.33 E Suqian, China 6.7 (1.2) 44 (4.6) 2.9 (0.5) Mix (wheat, rice, corn, potato)
68 40.00 N 98.00 E North America 2.4 (3.6) 86 (6.0) 2.1 (3.2) Mix of crop types
68 46.73 N 117.18 E North America 12 (–) 90 (–) 11 (–) Seedgrass
(h)
69 34.10 N 117.47 W Lodi Canyon, California, USA – – 45 (–) Prescribed chaparral fire
70 33.33 N 117.16 W Bear Creek, California, USA 60 (5.9) 83 (6.0) 50 (8.4) Mature caenothus and chamise
70 34.29 N 118.33 W Newhall, California, USA 20 (6.7) 75 (4.0) 15 (5.4) Mature chamise
70 32.32 N 117.15 W TNC, California, USA 21 (–) 77 (–) 16 (–) Young and healthy chamise
42 34.73 N 120.57 W Vandenberg, California, USA 14 (–) 68 (–) 10 (–) Coastal sage and maritime chaparral
Biogeosciences, 11, 7305–7329, 2014 www.biogeosciences.net/11/7305/2014/

T. T. van Leeuwen et al.: Biomass burning fuel consumption rates 7311
Table 1. Continued.
Refa Lat. Lon. Location FL CC FC Description
(◦) (◦) (t ha−1) (%) (tha−1)
(i)
71 2.52 S 113.79 E Kalimantan, Indonesia – – 500 (–) Peat and overstory
72 2.50 S 114.17 E Palangka Raya, Indonesia 399 (11) 27 (4.7) 109 (19) Various peat fire fuels
73 2.37 S 102.68 E Pelawan, Riau, Indonesia 45 (6.1) 81 (10) 37 (8.2) Litter and branches
74 2.52 S 113.79 E Kalimantan, Indonesia – – 332 (6.4) Measured by LIDAR
(j)
75 55.85 N 107.67 W Patuanak, Canada – – 42 (25) Continental and permafrost bogs
76 54.93 N 114.17 W Chisholm, Canada – – 43 (–) Hummocks and hollows
(k)
77 68.58 N 149.72 W Anaktuvuk River, Alaska, USA 165 (15) 24 (5.0) 40 (9.0) Soil and plants
a References: (1) Shea et al. (1996)/Ward et al. (1996); (2) Hoffa et al. (1999); (3) Hély et al. (2003b); (4) Savadogo et al. (2007); (5) Ward et al. (1992); (6) Bilbao and
Medina (1996); (7) Miranda et al. (1996); (8) De Castro and Kauffman (1998); (9) Barbosa and Fearnside (2005); (10) Cook et al. (1994); (11) Hurst et al. (1994); (12)
Rossiter-Rachor et al. (2007); (13) Russell-Smith et al. (2009); (14) Meyer et al. (2012); (15) Prasad et al. (2001); (16) Fearnside et al. (1993); (17) Kauffman et al. (1993); (18)
Kauffman et al. (1995); (19) Carvalho et al. (1995); (20) Guild et al. (1998); (21) Carvalho et al. (1998); (22) Graça et al. (1999); (23) Fearnside et al. (1999); (24) Araújo
et al. (1999); (25) Hughes et al. (2000a); (26) Fearnside et al. (2001); (27) Carvalho et al. (2001); (28) Christian et al., 2007/Soares Neto et al. (2009); (29) Righi et al. (2009); (30)
Carvalho Jr. et al. (2014); (31) Hughes et al. (2000b); (32) Kauffman et al. (2003); (33) Toma et al. (2005); (34) Carter et al. (2004); (35) Sparks et al. (2002); (36) Stephens and
Finney (2002); (37) Bêche et al. (2005); (38) Hille and Stephens (2005); (39) Sah et al. (2006); (40) Campbell et al. (2007); (41) Goodrick et al. (2010); (42) Yokelson et
al. (2013); (43) Hollis et al. (2010); (44) Yokelson et al. (2007); (45) Stocks et al. (1987a); (46) Stocks et al. (1987b); (47) Stocks (1989); (48) Goode et al. (2000); (49) Kasischke
et al. (2000); (50) Stocks et al. (2004); (51) Harden et al. (2004); (52) Harden et al. (2006); (53) de Groot et al. (2007); (54) Kane et al. (2007); (55) de Groot et al. (2009); (56)
Ottmar and Sandberg (2010); (57) Turetsky et al. (2011); (58) Boby et al. (2010); (59) FIRESCAN Science Team (1996); (60) Ivanova et al. (2011); (61) Kauffman et al. (1998);
(62) Barbosa and Fearnside (1996); (63) Stromgaard, 1985; (64) Prasad et al. (2000); (65) Zarate et al. (2005); (66) Lara et al. (2005); (67) Yang et al. (2008); (68) McCarty
et al. (2011); (69) Cofer III et al. (1988); (70) Hardy et al. (1996); (71) Page et al. (2002); (72) Usup et al. (2004); (73) Saharjo and Nurhayati (2006); (74) Ballhorn et al. (2009);
(75) Turetsky and Wieder (2001); (76) Benscoter and Wieder (2003); (77) Mack et al. (2011).
where rainfall can vary strongly between years (Menaut
et al., 1991; Cheney and Sullivan, 1997; Russell-Smith et
al., 2007). Grass production controls fire spread because low-
biomass grasslands have less continuous fuel swards and
also because they burn at lower intensities, which reduces
the probability of spread. In wet savannas, the grass pro-
duction is poorly correlated with rainfall and much higher
than in dry savannas (10 to 20 t ha−1 year−1, Gignoux et al.,
2006). This results in higher-intensity fires, keeping the land-
scape relatively open. In Australia, the division into dry and
wet savannas is less clear. Annual grass production is typ-
ically low (less than 3 t ha−1 year−1), even for precipitation
rates of 2000 mm year−1. This difference is mostly due to
the fact that Australia’s native grasses are limited by nitrogen
availability at high rainfalls, something African grasses such
as Andropogon gayanus overcome through various mecha-
nisms (Rossiter-Rachor et al., 2009).
Miombo woodlands in Africa are high-rainfall savannas
where up to 40 % of the fuel can be provided by litter
from trees (Frost et al., 1996). A similar type of vegeta-
tion can be found in Brazil, mainly consisting of wood-
lands with a closed canopy of tall shrubs and scattered
trees (Cerrado denso). We found several measurements con-
ducted in Miombo woodlands, as well as field measure-
ments in the Brazilian Cerrado denso. Moreover, one study
was found for an Indian deciduous forest, which can be
classified as wooded savanna and thus the savanna biome
(Ratnam et al., 2011).
To calculate averages, we divided the savanna biome into
grassland savanna and wooded savanna by using the fuel type
description that was provided in each study. The savanna
measurements presented in Table 1a were taken between
1990 and 2009, and represent 17 unique measurement loca-
tions (Fig. 1) taken from 15 different studies. For all measure-
ments conducted, we found an average FL of 7.6± 6.5 t ha−1
and FC of 4.6± 2.2 t ha−1. The average of the CC values
as presented in the different studies indicated a value of
71± 26 %, higher than the ratio derived from the average FL
and FC (61 %) above. This difference is because not all FC
measurements reported FL. Within the savanna biome, re-
gional differences were found (Fig. 2): FL and FC for South
American savannas, 8.2± 1.6 and 6.0± 2.4 t ha−1, respec-
tively, were nominally higher than the ones measured in the
savannas of Australia (5.1± 2.2 and 3.6± 1.6 t ha−1). Mea-
surements conducted in Africa, contributing to roughly 40 %
of all measurements in the biome, showed the lowest FC
(3.4± 1.0 t ha−1) of all regions. A larger number of measure-
ments are required to say conclusively whether these differ-
ences are statistically significant. To show the difference be-
tween grassland savannas and wooded savannas, data of both
types of savanna are also provided in Fig. 2. For grassland
savannas the average FL was relatively low (5.3± 2.0 t ha−1)
and the CC high (81± 16 %), yielding an average FC of
4.3± 2.2 t ha−1. Wooded savannas, on the other hand, had
a higher FL (11± 9.1 t ha−1) but lower CC (58± 32 %), and
therefore the average FC of 5.1± 2.2 t ha−1 was only slightly
higher than the one found for grasslands.
In Table 2 these values are given for different fuel cate-
gories. For the savanna biome most of the fuels were clas-
sified as surface fuels (Table 2a). In general, fuels with a
large surface-area-to-volume ratio (like litter, grass and di-
cots) had a high CC of at least 88 %. CC values were signifi-
cantly lower for the woody debris classes, with a minimum of
21± 12 % found for woody fuels with a diameter larger than
www.biogeosciences.net/11/7305/2014/ Biogeosciences, 11, 7305–7329, 2014
7312 T. T. van Leeuwen et al.: Biomass burning fuel consumption rates
2.54 cm (100 h fuel). FC for the different fuel types was be-
tween 0.3 and 1.9 t ha−1, with litter having the highest values.
In general, the total sum of different fuel categories agrees
well with the biome-averaged values presented. However, not
all measurements distinguished between fuel categories and
therefore small discrepancies were sometimes found: for FC
in the savanna biome, for example, the sum of different fuel
categories is 5.3 t ha−1, slightly higher than the biome aver-
age of 4.6± 2.2 t ha−1.
2.2 Tropical forest
Tropical evergreen forests are generally not susceptible to
fire except during extreme drought periods (e.g., Field et al.,
2009; Marengo et al., 2011; Tomasella et al., 2013) due to
their dense canopy cover keeping humidity high and wind
speed low, and also because the amount of fuel on the surface
is low due to rapid decomposition. Human activities have re-
sulted in fire activity in tropical forests, often with the goal
to clear biomass and establish pasture or cropland. These de-
forestation fires can be small-scale (e.g., shifting cultivation,
discussed in Sect. 2.6) or on a large scale with the aid of
heavy machinery. In the latter case, biomass is often piled in
windrows after the first burn and subject to additional fires
during the same dry season to remove the biomass more
completely. In large-scale deforestation regions like the state
of Mato Grosso in the Brazilian Amazon, the expansion of
mechanized agriculture could result in increased fuel con-
sumed per unit area (Cardille and Foley, 2003; Yokelson et
al., 2007a). All these fires, but also selective logging, may
lead to more frequent accidental fires as fragmented forests
are more vulnerable to fire (Nepstad et al., 1999; Siegert et
al., 2001; Pivello, 2011).
The total FL in tropical forests is mostly determined by
the tree biomass (surface and canopy fuels) and generally
on the order of a few hundred t ha−1. CC depends partly
on the size of the clearing and on the curing period. In
general, the CC for tropical forest clearings is lower than
50 % (Balch et al., 2008), but when there is a long (more
than a year) lag between slash and burning the CC might
increase to 60 % and more (Carvalho et al., 2001). The El
Niño–Southern Oscillation (ENSO) phenomenon may also
have a large effect on fuel conditions over tropical regions.
Large-scale fires have been shown to occur in South Amer-
ica, Southeast Asia, and Africa in ENSO years, thereby likely
increasing CC due to drought conditions (Chen et al., 2011;
Field et al., 2009; Hély et al., 2003a).
The 22 unique measurement locations shown in Table 1b
cover Brazil (19), Mexico (2), and Indonesia (1). In general,
measurement sites were divided into several smaller subplots
and the forest was slashed at the beginning of the dry season.
The biomass was then weighed using the PIM. After about
2 months the plots were set on fire and the remaining biomass
was weighed within 1 week after the burn. The average FL
for the whole biome was 285± 137 t ha−1, CC averaged
49± 22 %, and total FC was 126± 77 t ha−1. Since more
than 90 % of all measurements were conducted in Brazil
(Fig. 3), the biome-averaged values are biased towards mea-
surements conducted there. Studies conducted in Mexican
and Indonesian tropical forests reported average FL of 265
and 237 t ha−1, respectively. Surprisingly, the CC of tropi-
cal forest in Mexico was the highest of all the studies (83 %
on average), resulting in an average FC of 236 t ha−1, which
was significantly higher than values found for both Brazil
(117± 56 t ha−1) and Indonesia (120± 47 t ha−1). However,
due to the small number of measurements conducted in Mex-
ico and Indonesia, these findings are not conclusive.
Different forest types may partly explain the discrep-
ancy found, and therefore we distinguished between mea-
surements conducted in primary tropical evergreen forest,
secondary tropical evergreen forest, and tropical dry for-
est (Fig. 3). To distinguish between tropical dry forests and
wooded savannas (Sect. 2.1), we harmonized with the emis-
sion factor compilation of Akagi et al. (2011) in which
60 % canopy cover (Hansen et al., 2003) was the delin-
eation between both ecosystems. FL and FC were largest
for primary tropical evergreen forests, with average values of
339± 104 and 143± 79 t ha−1, respectively. For secondary
tropical evergreen forests these values were substantially
lower (101± 32 and 57± 7.0 t ha−1) and comparable with
tropical dry forests in South America and Mexico, where the
average FL was 100 and the FC 78 t ha−1.
Different fuel categories for the tropical forest biome are
presented in Table 2b and can be mainly classified as sur-
face fuels, except for the attached foliage (crown fuels) and
rootmat category (ground fuels). Large woody debris (di-
ameter > 20.5 cm) and trunks – although not always taken
into account in certain studies – correspond to a large part
of the above-ground biomass (FL= 147± 83 t ha−1) but are
usually only slightly burned during a forest clearing pro-
cess (Carvalho et al., 1995), as shown by an average CC
of 32± 23 % leading to an FC of this category of only
37± 32 t ha−1. Similar to the savanna biome, we found a
high CC of at least 73 % for surface fuels with a large sur-
face area to volume ratio (litter, leaves, and dicots). The small
woody fuels (1 and 10 h) also had a high CC, and the CC of
the woody debris generally decreased with increasing diam-
eter. From an FC perspective, the most important fuel types
in the tropical forest biome were litter (14± 8.4 t ha−1) and
woody debris size classes with a diameter larger than 0.64 cm
(15–37 t ha−1).
2.3 Temperate forest
Although accounting for only a small part of the global
emissions, temperate forest fires frequently occur nearby the
wildland–urban interface with important consequences for
human safety and air quality. While tropical fires are largely
intentionally ignited to pursue land management goals, the
temperate forest is also subject to wildfires. Obtaining FC
Biogeosciences, 11, 7305–7329, 2014 www.biogeosciences.net/11/7305/2014/

T. T. van Leeuwen et al.: Biomass burning fuel consumption rates 7313
Table 2. Fuel load (FL), combustion completeness (CC) and fuel consumption (FC) field measurements for different fuel categories within
the savanna (a), tropical forest (b), temperate forest (c), and boreal forest (d) biomes. Standard deviation (SD) is shown in parentheses.
Cla Fuel category FL CC FC Referencesb
(t ha−1) (%) (tha−1)
(a)
S Dicots 0.4 (0.5) 91 (12) 0.3 (0.3) 1, 2, 5
S Grass-dormant 1.9 (1.4) 93 (14) 1.3 (0.5) 1, 2, 5
C Grass-green 0.4 (0.2) 88 (23) 0.3 (0.1) 1, 2, 5
S Litter 2.1 (0.5) 88 (13) 1.9 (0.5) 1, 2, 5, 8, 12, 15
S Tree/shrub leaves 0.4 (0.8) 64 (12) 0.3 (0.6) 1, 2, 5
S Woody debris (0–0.64 cm) 0.6 (0.7) 65 (16) 0.4 (0.5) 1, 2, 5, 8
S Woody debris (0.64–2.54 cm) 0.9 (1.0) 39 (25) 0.5 (0.7) 1, 2, 5, 8
S Woody debris (> 2.54 cm) 1.0 (1.1) 21 (12) 0.3 (0.3) 1, 2, 5, 8
(b)
C Attached foliage 3.8 (3.0) 94 (5.1) 3.6 (2.8) 5, 18, 20, 25, 32
S Dicots 0.5 (0.3) 89 (23) 0.5 (0.3) 5, 18, 20, 25, 32
S Leaves 13 (8.8) 73 (38) 11 (9.8) 16, 17, 19, 21, 24, 27, 28, 29
S Litter 18 (9.9) 85 (30) 14 (8.4) 5, 17–29, 32
S Liana 5.2 (0.8) 21 (35) 0.9 (1.4) 19, 21, 24
G Rootmat 5.2 (2.7) 87 (13) 4.4 (2.2) 18, 20, 25
S Woody debris (0–0.64 cm) 4.6 (2.8) 94 (4.8) 6.4 (8.6) 5, 17, 18, 20, 25, 32
S Woody debris (0.65–2.54 cm) 17 (3.9) 87 (7.9) 15 (4.0) 5, 17, 18, 20, 25, 32
S Woody debris (2.55–7.6 cm) 27 (15) 65 (19) 18 (13) 5, 17, 18, 20, 25, 32
S Woody debris (7.6–20.5 cm) 45 (29) 41 (18) 18 (9.3) 5, 17, 18, 20, 25, 32
S Woody debris (> 20.5 cm), trunks 147 (83) 32 (23) 37 (32) 5, 16, 18–23, 26–30
(c)
G Organic soil 49 (37) 48 (44) 25 (31) 34, 37, 38
S Litter 20 (11) 81 (8.9) 17 (9.9) 34, 37, 38
S Woody debris (0–0.64 cm) 1.2 (0.8) 87 (11) 1.0 (0.6) 36, 37, 38
S Woody debris (0.65–2.54 cm) 5.2 (1.9) 79 (11) 4.0 (1.2) 36, 37, 38
S Woody debris (2.55–7.6 cm) 6.0 (0.9) 73 (14) 4.3 (0.2) 36, 37, 38
S Woody debris (7.6–20.5 cm sound) 16 (9.6) 38 (42) 6.2 (8.2) 36, 37, 38
G Woody debris (7.6–20.5 cm rotten) 20 (4.1) 96 (5.4) 20 (4.8) 36, 37, 38
(d)
G Ground fuels (soil, forest floor) 50 (29) 51 (18) 32 (26) 44, 48, 49, 50, 51, 53, 54, 55, 57, 58
S Surface fuels 44 (49) 52 (25) 12 (8.1) 44, 46, 49, 52, 55, 58, 59
C Crown fuels 37 (70) 71 (29) 8.1 (6.9) 44, 46, 49, 57, 59
a Fuel category classification: S= surface fuels, G= ground fuels, C= crown fuels.b References: (1) Shea et al. (1996)/Ward et al. (1996); (2) Hoffa et al. (1999); (5) Ward et al. (1992); (8) De Castro and Kauffman (1998);
(12) Rossiter-Rachor et al. (2007); (15) Prasad et al. (2001); (16) Fearnside et al. (1993); (17) Kauffman et al. (1993); (18) Kauffman et al. (1995); (19)
Carvalho et al. (1995); (20) Guild et al. (1998); (21) Carvalho et al. (1998); (22) Graça et al. (1999); (23) Fearnside et al. (1999); (24) Araújo et al. (1999);
(25) Hughes et al. (2000a); (26) Fearnside et al. (2001); (27) Carvalho et al. (2001); (28) Christian et al. (2007)/Soares Neto et al. (2009); (29) Righi
et al. (2009); (30) Carvalho Jr. et al. (2014); (32) Kauffman et al. (2003); (34) Carter et al. (2004); (36) Stephens and Finney (2002); (37) Bêche
et al. (2005); (38) Hille and Stephens (2005); (45) Stocks et al. (1987a); (47) Stocks (1989); (49) Kasischke et al. (2000); (50) Stocks et al. (2004); (51)
Harden et al. (2004); (52) Harden et al. (2006); (53) de Groot et al. (2007); (54) Kane et al. (2007); (55) de Groot et al. (2009); (56) Ottmar and
Sandberg (2010); (58) Boby et al. (2010); (59) FIRESCAN Science Team (1996); (60) Ivanova et al. (2011).
measurements for wildfires is obviously challenging, so most
information is derived from prescribed fires that allow re-
searchers to measure pre-fire conditions. However, these fires
may not always be a good proxy for wildfires. For example,
wildfires in western conifer forests of the US are often crown
fires (while prescribed fires usually only burn surface fuels).
Due to potential discrepancies with respect to FC, we distin-
guished between these fire types in Sect. 3.2.
The 23 unique FC measurement locations for the temper-
ate forest are from sites in North America (14), Australia (7),
Tasmania (1) and Mexico (1), and were taken between 1983
and 2011 (Fig. 1). In general, measurements were conducted
on sites that were divided into multiple, randomized subplots
www.biogeosciences.net/11/7305/2014/ Biogeosciences, 11, 7305–7329, 2014

7314 T. T. van Leeuwen et al.: Biomass burning fuel consumption rates
8
85
13
9
0
3
6
9
12
15
FL (
t ha−
1)
0
20
40
60
80
100
CC
(%
).
BIOME AVERAGE
AFRICA
SOUTH AMERICA
AUSTRALIA
GRASSLAND SAVANNA
WOODED SAVANNA0
2
4
6
8
10
FC (
t ha−
1)
Figure 2. Overview of field measurements of fuel load (FL), com-
bustion completeness (CC), and fuel consumption (FC) in the sa-
vanna biome. The pie charts on top correspond to the number of
unique measurement locations for different geographical regions
(left) and savanna types (right), and in the box plots below field
averages of FL, CC, and FC are presented. The boxes extend from
the lower to upper quartile values of the measurement data, with a
line at the median and a black filled circle at the mean. The whiskers
extend from the box to show the range of the data, and outliers are
indicated with pluses.
on which the pre-fire biomass was weighed according to the
PIM. The sites were then burned and within a few days af-
ter the burn the post-fire biomass was gathered, dried and
weighed.
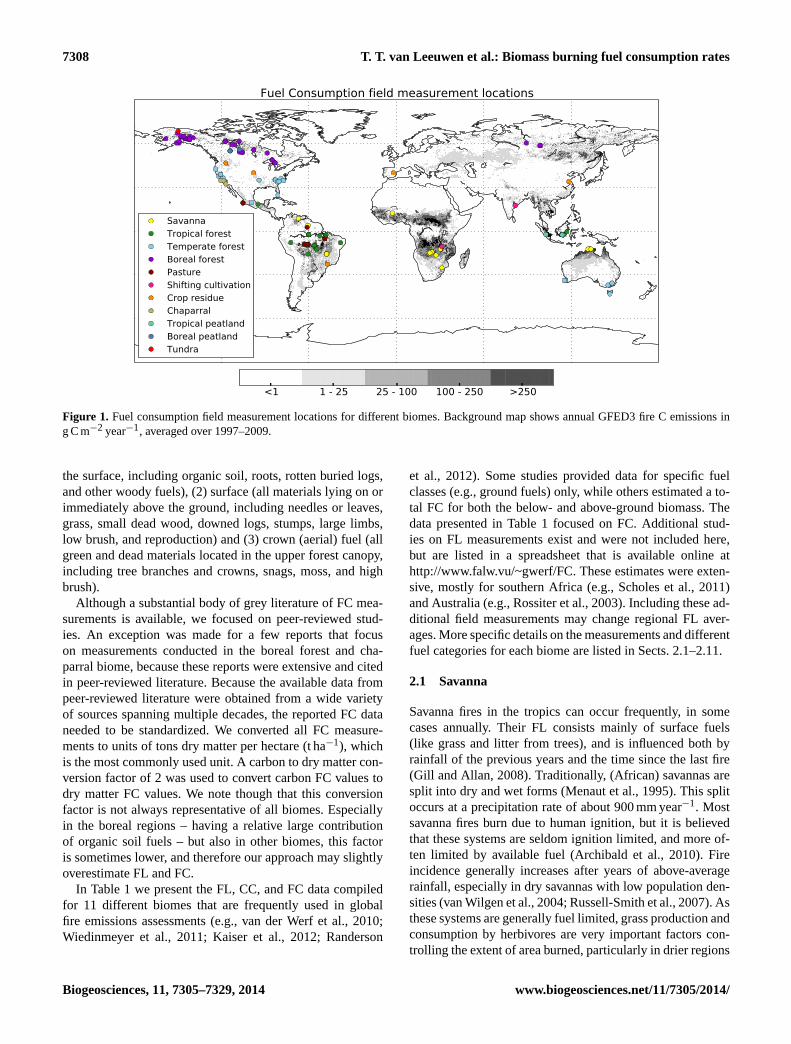
The biome-averaged FL for the temperate forest biome
was 115± 144 t ha−1, the CC equaled 61± 18 %, and fuel
consumed by the fire was 58± 72 t ha−1. Note that we
focused on all the measurements presented in Table 1c,
so studies that provide information on one specific fuel
class only (e.g., ground fuels, Goodrick et al., 2010)
were also included to calculate biome-averaged values. Al-
though CC for North America, Australia and Tasmania
were comparable (∼ 60 %), the FC showed lower values for
North America (49± 62 t ha−1) than Australia and Tasma-
nia (78± 91 t ha−1). One possible cause of this discrepancy
20
21
17
3
2
0
120
240
360
480
600
FL (
t ha−
1)
0
20
40
60
80
100
CC
(%
).
BIOME AVERAGE
BRAZIL
MEXICO
INDONESIA
PRIMARY FOREST
SECONDARY FOREST
DRY FOREST0
80
160
240
320
400
FC (
t ha−
1)
Figure 3. Overview of field measurements of fuel load (FL), com-
bustion completeness (CC), and fuel consumption (FC) in the trop-
ical forest biome. The pie charts on top correspond to the number
of unique measurement locations for different geographical regions
(left) and forest types (right), and in the box plots below field aver-
ages of FL, CC, and FC are presented. The boxes extend from the
lower to upper quartile values of the measurement data, with a line
at the median and a black filled circle at the mean. The whiskers
extend from the box to show the range of the data, and outliers are
indicated with pluses.
is the contribution of different vegetation types, as elabo-
rated in Fig. 4. Measurements in North America were mainly
conducted in conifer forest, while eucalypt was the more
dominant forest type for Australia and Tasmania. FC for
both forest types compares fairly well with the regional av-
erages found, and equaled 48± 58 t ha−1 for conifers and
79± 98 t ha−1 for eucalypt forest.
Table 2c shows that litter in the temperate forest had
a higher FL and FC than in the tropical forest biome,
and the average FC for this surface fuel category equaled
17± 9.9 t ha−1. The different woody debris classes had a
similar pattern to that found for the savanna and tropical for-
est biome, with decreasing CC for categories with increas-
ing fuel diameters. However, an interesting difference was
found in the biggest size class: sound woody debris had
a low CC (38± 42 %), while the fraction of rotten woody
Biogeosciences, 11, 7305–7329, 2014 www.biogeosciences.net/11/7305/2014/
T. T. van Leeuwen et al.: Biomass burning fuel consumption rates 7315
14
8
16
7
0
50
100
150
200
250
FL (
t ha−
1)
0
20
40
60
80
100
CC
(%
).
BIOME AVERAGE
NORTH AMERICA
AUSTRALIA & TASMANIA
CONIFER FOREST
EUCALYPT FOREST0
25
50
75
100
125
FC (
t ha−
1)
Figure 4. Overview of field measurements of fuel load (FL), com-
bustion completeness (CC), and fuel consumption (FC) in the tem-
perate forest biome. The pie charts on top correspond to the number
of unique measurement locations for different geographical regions
(left) and forest types (right), and in the box plots below field aver-
ages of FL, CC, and FC are presented. The boxes extend from the
lower to upper quartile values of the measurement data, with a line
at the median and a black filled circle at the mean. The whiskers
extend from the box to show the range of the data, and outliers are
indicated with pluses.
debris consumed by the fire was very high (96± 5.4 %), re-
sulting in an average FC of 20± 4.8 t ha−1 for this category.
Although this difference was observed in a few other studies
as well, little research is available on comparing the physi-
cal and chemical properties of sound and rotten woody de-
bris, which is likely to affect the FC (Hyde et al., 2011). The
most important fuel category from an FC perspective was or-
ganic soil, with an average value of 25± 31 t ha−1. For the
same reason as explained in Sect. 2.1, a small discrepancy
was found between the total FC sum of different fuel cate-
gories (77 t ha−1) and the biome average (58± 72 t ha−1).
2.4 Boreal forest
Fires in the boreal (high latitudes of about 50 to 70◦) forest
are thought to be mostly natural (wildfires) due to the vast
36
3
31
11
6
0
40
80
120
160
200
FL (
t ha−
1)
0
20
40
60
80
100
CC
(%
).
BIOME AVERAGE
NORTH AMERICA
RUSSIA
GROUND FUELS
SURFACE FUELS
CROWN FUELS0
20
40
60
80
100
FC (
t ha−
1)
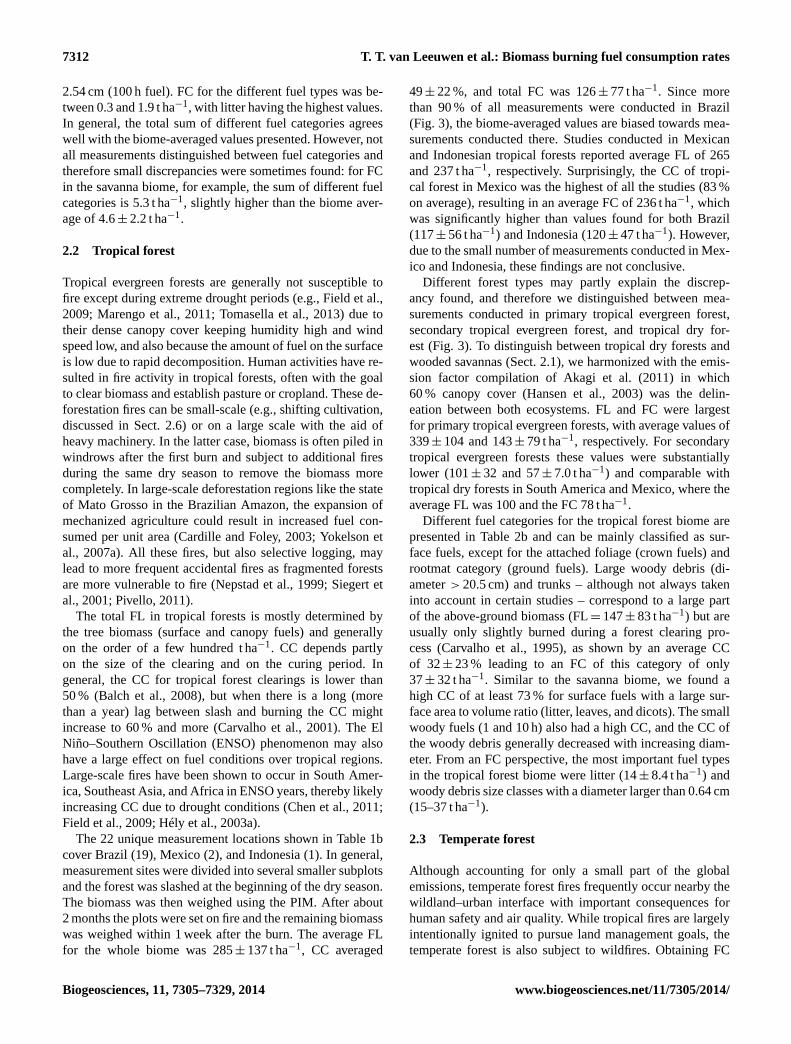
Figure 5. Overview of field measurements of fuel load (FL), com-
bustion completeness (CC), and fuel consumption (FC) in the bo-
real forest biome. The pie charts on top correspond to the number
of unique measurement locations for different geographical regions
(left) and fuel classes (right), and in the box plots below field aver-
ages of FL, CC, and FC are presented. The boxes extend from the
lower to upper quartile values of the measurement data, with a line
at the median and a black filled circle at the mean. The whiskers
extend from the box to show the range of the data, and outliers are
indicated with pluses.
size of the forest region, the low population densities and
the difficult accessibility. However, much of the Asian boreal
forests are disturbed by (il)legal logging activities (Vanderg-
ert and Newel, 2003), which can increase fire activity in more
remote regions (Mollicone et al., 2006). Approximately two
thirds of the boreal forests are located in northern Eurasia,
while the remainder is in North America. The circumpolar
boreal fire regime is characterized by large forest fires, al-
though fires in North America are in general larger and less
frequent than the ones in Eurasia (de Groot et al., 2013a).
North American boreal fires are characterized by high inten-
sity crown fires, while fires in boreal Russia are more often
surface fires of lower intensity (Amiro et al., 2001; Soja et al.,
2004; Wooster et al., 2004; de Groot et al., 2013a). Canada
has a very long fire record, starting in 1959, while the record
www.biogeosciences.net/11/7305/2014/ Biogeosciences, 11, 7305–7329, 2014

7316 T. T. van Leeuwen et al.: Biomass burning fuel consumption rates
for Alaska starts in 1950 (Kasischke et al., 2002). Since 1990,
2.65 million ha year−1 burned in the North American bo-
real forest, with high year-to-year variability (Kasischke et
al., 2011). FL in the boreal forests depends to a large ex-
tent on tree species, stand density, climate, topography, mois-
ture, seasonal thawing of permafrost and the time since the
last burn. In many forest types, dead material accumulates
in deep organic soil horizons due to the slow decomposition
rates. CC in organic soils is mostly controlled by conditions
that control surface soil moisture, including topography, sea-
sonal thawing of permafrost, and antecedent weather condi-
tions. When dry conditions prevail, such as during a high-
pressure blocking event that can last for few days to several
weeks over North America (Nash and Johnson, 1996), much
of the forest floor can burn, and depths of 30 cm or more can
be reached. There is a strong relation between moisture con-
tent and fuel bed depth on the one hand and forest floor con-
sumption on the other hand (e.g., de Groot et al., 2009). Of
all global fire regimes, the boreal forest is most susceptible to
climate change due to polar amplification of temperature in-
crease (Flannigan et al., 2013; de Groot et al. 2013b). For ex-
ample, the area burned by lightning fires in the North Amer-
ican boreal region doubled between 1960 and 1990 (Kasis-
chke and Turetsky, 2006).
Field measurements described in the literature were al-
most all conducted in boreal North America (35 in total),
except for three measurement sets that came from boreal
Asia (Fig. 1, Table 1d). The general method for determin-
ing FL and FC was to apply the PIM. Approaches have also
been developed to estimate consumption of surface organic
layer fuels by estimating the pre- and post-fire thicknesses
and densities of surface organic horizons (de Groot et al.,
2009; Turetsky et al., 2011).
We estimated a biome-averaged FL of 69± 61 t ha−1, sub-
stantially lower than the average FL for the temperate forests.
The average FL for this biome is for upland forest types.
However, deep peatland deposits (see Sect. 2.10) cover about
107 M ha (Zoltai et al., 1998) or 18 % of the North American
boreal forest zone (Brandt, 2009) and 16 % of the northern
circumpolar permafrost soil area (Tarnocai et al., 2009). By
contrast, peatlands only cover about 0.07 M ha in the temper-
ate zone, which has higher FL overall. Despite low decom-
position rates due to a cold, moist climate, the lower FL in
the boreal forest region is primarily a result of slower tree
growth rates (biomass accumulation) and frequent to infre-
quent fire disturbance that can remove substantial amounts
of fuel. The average CC was 51± 17 %, and the FC equaled
35± 24 t ha−1. Similar as for the temperate forest, we in-
cluded all measurements (presented in Table 1d) to calcu-
late the biome-averaged values. The representativeness of
these values for wildfires and prescribed fires is discussed
in Sect. 3.2. Differences between boreal North America and
Siberia were observed, but it should be noted that only three
studies provided an FC estimate for Russia. Values on FL,
CC, and FC were overall higher for boreal fires in North
America than the field studies in Russia (Fig. 5).
Information on fuel categories is presented in Table 2d,
as well as in Fig. 5. Different classification systems were
sometimes used for boreal fuels, and therefore it was diffi-
cult to extract the right information for ground, surface and
crown fuels (further discussed in Sect. 3.4). Moreover, it was
not always clear in which class certain fuels are consumed:
e.g., organic material can be consumed on the ground but
also in a crown fire (Hille and Stephens, 2005). The high-
est FL (50± 29 t ha−1) and FC (32± 26 t ha−1) in the boreal
forest biome was found for ground fuels, mainly consisting
of organic soils. Furthermore, a difference in organic matter
FL in permafrost and non-permafrost regions was found (56
and 86 t ha−1, respectively). However, due to a CC of 62 and
41 % for permafrost and non-permafrost regions, the FC for
both regions was equal (35 t ha−1). Finally, slope aspect has
been shown to have an effect as well, with the south facing
slopes having the highest FL and FC due to warmer and drier
conditions that better favour plant growth and fire intensity
than shadowed north faces (Viereck et al., 1986; Turetsky et
al., 2011). As with most of our findings, however, the num-
ber of studies is far too low to evaluate whether this is also
the case in general.
2.5 Pasture
Fires related to agricultural practices were divided into shift-
ing cultivation (Sect. 2.6), the burning of crop residues
(Sect. 2.7) and pasture burning. The latter type of burning
often follows tropical deforestation fires and is used to con-
vert land into pasture. Prior to this conversion, lands can
be used in shifting cultivation as well. Typically, landown-
ers set fires every 2–3 years to prevent re-establishment of
forests (Kauffman et al., 1998) and to enhance the growth
of certain grasses (Fearnside, 1992). In general, these fires
mostly consume grass and residual wood from the original
forest. Pasture fires are most common in the Brazilian Ama-
zon where many cattle ranches have been established in areas
that were previously tropical forest. Although less abundant,
these “maintenance” fires also occur in tropical regions of
Africa, central America and Asia.
The pasture measurements presented in Table 1e represent
five unique measurement locations and cover two different
continents (Fig. 1). Pasture had an average FL, CC, and FC of
74± 34 t ha−1, 47± 27 %, and 28± 9.3 t ha−1, respectively.
Regional discrepancies for FC were found though, with FL
for Brazilian pastures (84± 29 t ha−1) being substantially
higher than those found in Mexico (35 t ha−1). However, FC
values compared reasonably well for both regions (30± 10
and 24 t ha−1 for Brazil and Mexico, respectively).
Biogeosciences, 11, 7305–7329, 2014 www.biogeosciences.net/11/7305/2014/
T. T. van Leeuwen et al.: Biomass burning fuel consumption rates 7317
2.6 Shifting cultivation
Shifting cultivation is commonly practiced in Africa, central
America, South America and Asia. In general, lands are cul-
tivated temporarily (often for only a few years) before soil
fertility is exhausted or weed growth overwhelms the crops.
The lands are then abandoned and may revert to their natural
vegetation, while the farmers move on to clear a new fields
elsewhere. The land is slashed and burned, which leaves only
stumps and large trees in the field after the fire (Stromgaard,
1985). Apart from the fact that fire is an easy and cheap tool
to clear the land, it has the further advantage that the ashes
will also (temporarily) enrich the soil.
For shifting cultivation fires the average FL was 44 with
a range of 14–75 t ha−1, the CC equaled 47 [30–64] %, and
FC was 23 [4–43] t ha−1. Note that these values are based on
the measurements of two studies only (Fig. 1, Table 1f). The
two shifting cultivation studies showed a remarkable differ-
ence: FC of Indian tropical dry deciduous forest (4.0 t ha−1;
Prasad et al., 2000) was 1 order of magnitude lower than for
shifting cultivation practices in the wooded savanna of Zam-
bia (43 t ha−1; Stromgaard, 1985). Due to the relatively small
number of measurements, these findings are not conclusive.
2.7 Crop residue
Crop residue burning is a common practice to recycle nu-
trients, control pests, diseases, and weeds and, in general,
to prepare fields for planting and harvesting. The main crop
residue types that burn are rice, grains (i.e., wheat) and sug-
arcane, but burning is not limited to these crop types. FL is
highly variable, as it depends on both the type of crop burned
and the method used for harvesting the crop (mechanized,
manual, etc.). Detecting these fires using global burned area
products is difficult, as in general, cropland fires are small
and the land can be tilled and replanted quickly after burning
(making it difficult to observe the latency of burned ground as
is common in less managed and/or more natural landscapes).
Moreover, the fuel geometry varies globally from short-lived
burning of loose residue in the field to long-lasting smol-
dering combustion of small hand piles of residue, and both
are hard to detect from space. Traditional methods of obtain-
ing estimates for agricultural fires are the use of governmen-
tal statistics on crop yield (e.g., Yevich and Logan, 2003),
residue usage for cooking and livestock (the leftovers are as-
sumed to be burned), field measurements, or the use of agro-
nomic data (e.g., Jenkins et al., 1992).
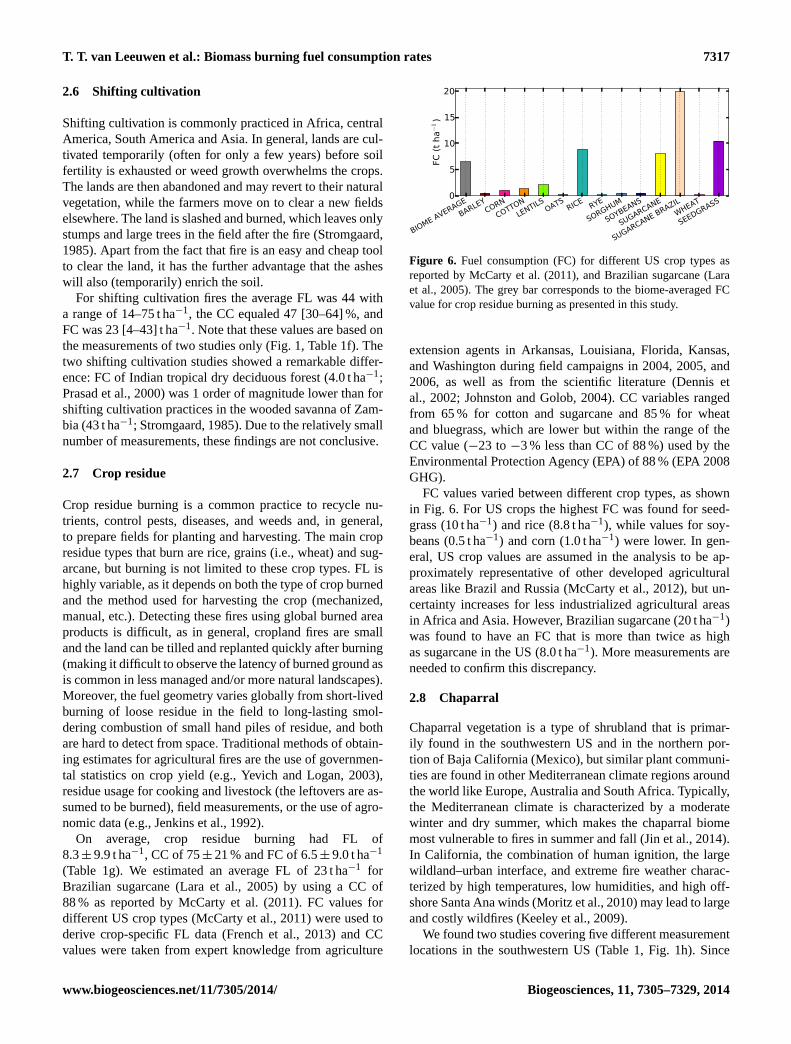
On average, crop residue burning had FL of
8.3± 9.9 t ha−1, CC of 75± 21 % and FC of 6.5± 9.0 t ha−1
(Table 1g). We estimated an average FL of 23 t ha−1 for
Brazilian sugarcane (Lara et al., 2005) by using a CC of
88 % as reported by McCarty et al. (2011). FC values for
different US crop types (McCarty et al., 2011) were used to
derive crop-specific FL data (French et al., 2013) and CC
values were taken from expert knowledge from agriculture
BIOME AVERAGE
BARLEYCORN
COTTON
LENTILSOATS
RICERYE
SORGHUM
SOYBEANS
SUGARCANE
SUGARCANE BRAZIL
WHEAT
SEEDGRASS0
5
10
15
20
FC (
t ha−
1)
Figure 6. Fuel consumption (FC) for different US crop types as
reported by McCarty et al. (2011), and Brazilian sugarcane (Lara
et al., 2005). The grey bar corresponds to the biome-averaged FC
value for crop residue burning as presented in this study.
extension agents in Arkansas, Louisiana, Florida, Kansas,
and Washington during field campaigns in 2004, 2005, and
2006, as well as from the scientific literature (Dennis et
al., 2002; Johnston and Golob, 2004). CC variables ranged
from 65 % for cotton and sugarcane and 85 % for wheat
and bluegrass, which are lower but within the range of the
CC value (−23 to −3 % less than CC of 88 %) used by the
Environmental Protection Agency (EPA) of 88 % (EPA 2008
GHG).
FC values varied between different crop types, as shown
in Fig. 6. For US crops the highest FC was found for seed-
grass (10 t ha−1) and rice (8.8 t ha−1), while values for soy-
beans (0.5 t ha−1) and corn (1.0 t ha−1) were lower. In gen-
eral, US crop values are assumed in the analysis to be ap-
proximately representative of other developed agricultural
areas like Brazil and Russia (McCarty et al., 2012), but un-
certainty increases for less industrialized agricultural areas
in Africa and Asia. However, Brazilian sugarcane (20 t ha−1)
was found to have an FC that is more than twice as high
as sugarcane in the US (8.0 t ha−1). More measurements are
needed to confirm this discrepancy.
2.8 Chaparral
Chaparral vegetation is a type of shrubland that is primar-
ily found in the southwestern US and in the northern por-
tion of Baja California (Mexico), but similar plant communi-
ties are found in other Mediterranean climate regions around
the world like Europe, Australia and South Africa. Typically,
the Mediterranean climate is characterized by a moderate
winter and dry summer, which makes the chaparral biome
most vulnerable to fires in summer and fall (Jin et al., 2014).
In California, the combination of human ignition, the large
wildland–urban interface, and extreme fire weather charac-
terized by high temperatures, low humidities, and high off-
shore Santa Ana winds (Moritz et al., 2010) may lead to large
and costly wildfires (Keeley et al., 2009).
We found two studies covering five different measurement
locations in the southwestern US (Table 1, Fig. 1h). Since
www.biogeosciences.net/11/7305/2014/ Biogeosciences, 11, 7305–7329, 2014

7318 T. T. van Leeuwen et al.: Biomass burning fuel consumption rates
Cofer III et al. (1988) only provided an FC for chaparral
burning, we used a CC of 76 % (average CC from the studies
of Hardy et al. (1996) and Yokelson et al., 2013) to derive
an FL estimate for the Cofer et al. (1988) study. We then
used the FL values of all three studies to estimate the biome-
averaged FL of 40± 23 t ha−1. The CC equaled 76 %, yield-
ing an average FC of 27± 19 t ha−1.
2.9 Tropical peat
Tropical peatland has only recently been recognized as an
important source of biomass burning emissions. Roughly
60 % of the worldwide tropical peatland is located in South-
east Asia, and more specifically in Indonesia (Rieley et al.,
1996; Page et al., 2007). Peat depth is an indicator for the to-
tal biomass stored in peatland, but only the peat layer above
the water table can burn. Drainage and droughts lower the
water table, adding to the total FL. On top of that, living
biomass and dead above ground organic matter also con-
tribute to the FLs in these peatlands. The bulk density and
carbon content of peat are of importance to determine the
amount of carbon stored. The average density is around
0.1 g cm−3 and the carbon content ranges between 54–60 %
(Page et al., 2002; Riely et al., 2008; Ballhorn et al., 2009;
Stockwell et al., 2014). The depth of burning is the key fac-
tor that determines the total FC, but information about it is
scarce. Results from several field measurements indicate a
link between this burning depth and the depth of drainage
(Ballhorn et al., 2009). Commercial logging in drained peat
swamps has increased their susceptibility to fire, especially
during droughts (such as during an ENSO event).
In total four studies provided data on tropical peatland
measurements in Indonesia (Table 1i). In general, post-fire
observations of the average burn depth were combined with
pre-fire conditions reconstructed from adjacent unburned
patches to determine the FC.
Tropical peatland (including peat soils and overstory)
had the highest FC of all biomes, with an average of
314± 196 t ha−1. Only two studies provided data on FL and
CC, and since the study of Saharjo and Nurhayati (2006)
focused on litter and branches only, a CC of 27 % (Usup
et al., 2004) was found to be representative for the tropical
peat biome. Taking a CC of 27 %, the biome-averaged FL
equaled 1056± 876 t ha−1, thereby having the highest FL of
all biomes. However, due to limited information on CC mea-
sured in the field there is no clear definition of the average
FL for tropical peat. Note that the measurements taken by
Ballhorn et al. (2009) were using Laser Imaging, Detection
And Ranging (LIDAR) aerial remote sensing, and the study
of Page et al. (2002) relied on field measurements combined
with information obtained from Landsat Thematic Mapper
(TM) images.
2.10 Boreal peat
The northern peatlands are a result of the slow decomposi-
tion of organic material over thousands of years. Tradition-
ally, northern peatlands have been considered a slow, con-
tinuous carbon sink. However, the vulnerability of this re-
gion to global warming and the resulting increase in wildland
fires have challenged this idea (Zoltai et al., 1998; Harden et
al., 2000; Turetsky, 2002). There are still large uncertainties
associated with the FL and CC of peat fires. The depth of
fires is not well documented, leading to large uncertainties
in the total FC estimates. In some cases, water table depth
may serve as a proxy for determining the depth of burning.
However, the susceptibility of peatlands to fire under differ-
ent moisture conditions is also poorly documented at best.
This makes modeling peat fires very difficult and stresses the
importance of more field measurements.
Two measurements were taken between 1999 and 2001 in
boreal Canada (Table 1j). On each burn site, multiple plots
were established and information on the peat density (which
is assumed to increase nonlinearly with depth) was used in
combination with the burn depth to determine the FC. No
data on FL and CC were provided, but the average FC of
the two studies is 43 [42–43] t ha−1. A standard deviation
of 25 t ha−1 (Turetsky and Wieder, 2001) can be used as the
average uncertainty for the boreal peat biome. Turetsky and
Wieder (2001) showed that FC of permafrost bogs (58 [43–
72] t ha−1) is more than twice as high as that of continental
bogs (27 [11–42] t ha−1). A similar difference was found for
hummocks and hollows, which are raised peat bogs and lows,
respectively: FC for hummocks was 29± 2.0 t ha−1, while
fires in hollows consumed on average 56± 6.0 t ha−1 (Ben-
scoter and Wieder, 2003).
2.11 Tundra
The Arctic tundra stores large amounts of carbon in its or-
ganic soil layers that insulate and maintain permafrost soils,
although these soil layers are shallower than those found in
peatlands and boreal forests. While the region is treeless,
some vegetation types include a substantial shrub compo-
nent where additional carbon is available for burning. On
Alaska’s North Slope approximately 10 % of the land cover
is shrub dominated (> 50 % shrub cover), while the remain-
der is dominated by herbaceous vegetation types (Raynolds
et al., 2006). Fire regime in the Arctic is largely unknown,
but historically fire is generally absent in the tundra biome
compared to other biomes. However, the evidence of increas-
ing fire frequency and larger extent of the fires in the arctic
(Hu et al., 2010) may represent a positive feedback effect of
global warming, so in the future more fires may occur in this
biome (Higuera et al., 2011). There are still large unknowns
of the impacts that fires have on the carbon stocks of the tun-
dra ecosystems. Even the topsoil layers in the tundra store
large pools of carbon in organic-rich material. This removal
Biogeosciences, 11, 7305–7329, 2014 www.biogeosciences.net/11/7305/2014/

T. T. van Leeuwen et al.: Biomass burning fuel consumption rates 7319
of the topsoil may also expose the permafrost layers to heat-
ing by the warm summer temperatures, thawing the ground
and destabilizing the tundra carbon balance.
The only measurements found in the literature of FC in
the tundra biome are from the Anaktuvuk River fire in 2007
(Mack et al., 2011). The measurements were taken on twenty
sites in the burned area and the pre-fire peat layer depth was
reconstructed to determine the pre-fire FL. The FL was on
average 165± 15 t ha−1, and averaged CC and total FC was
respectively 24± 5.0 % and 40± 9.0 t ha−1 (Table 1k). These
measurements represent a thorough effort to document FC,
but still represent just one fire that is considered to be a
fairly high severity event (Jones et al., 2009). Other measure-
ments of surface FC at fires in the Noatak region of Alaska
and a recent burn on the Alaskan North Slope showed min-
imal organic surface material loss (N. French, unpublished
data). These fires may represent more typical fire events with
more moderate consumption than was found in the Anak-
tuvuk River fire. There is no doubt that the lack of suffi-
cient field measurements in the tundra biome means a rea-
sonable estimate of FC in tundra fires is not fully known.
While the Anaktuvuk River fire measurements are of value,
there should be caution in using these data to generalize since
the event represents a more severe event than many fires in
the region. They may, however, be indicative of how future
fires in the region may impact carbon losses as the region
experiences increased fire frequency and severity.
3 Discussion
3.1 Spatial representativeness of fuel consumption
measured in the field
Due to the spatial heterogeneity in fuels and the limited num-
ber of measurements, one important question to ask is how
representative the biome-averaged values presented in this
review are. Field measurements of FC were spatially well
represented in the major biomass-burning regions, like the
Brazilian Amazon, boreal North America and the savanna
areas in southern Africa. However, several other regions
that are important from a fire emissions perspective were
lacking any measurements, and these include central Africa
(e.g., Congo and Angola, but also regions further north such
as Chad and southern Sudan), Southeast Asia and eastern
Siberia (Fig. 1). Due to these spatial gaps, it remains uncer-
tain whether measurements of FL, CC, and FC as presented
in this study are representative for the whole biome. As men-
tioned for the “Tundra”, where fire may become increasingly
important as the region warms, the one set of field samples
included in this review may not be representative of past and
future fire.
Within biomes differences were found to be large for cer-
tain regions, as shown in Figs. 2–5. For example, we found
substantial differences in FL and FC for boreal areas, with
Russian sites having lower values compared to the ones in
North America (Fig. 5). This difference might be due to dif-
ferent burning conditions in both regions, with a larger con-
tribution of surface fuels and less high-intensity crown fires
occurring in boreal Russia (Wooster et al., 2004). Although
available literature data showed that FC for crown fuels was
indeed higher than for surface fuels, more data for especially
boreal Russia is needed to confirm this line of thought. More-
over, Boby et al. (2010) and Turetsky et al. (2011) showed
that the timing of FC measurements (early dry seasons ver-
sus late dry season) contribute to different boreal FC values
as well. In general, both FC and CC may increase over the
course of the dry season as large diameter fuels dry out. This
was also suggested by Akagi et al. (2011) for the savanna
biome, and is consistent with the seasonal decrease in MCE
as proposed by Eck et al. (2013).
Regional differences were also found for the tropical for-
est biome, where almost all measurements were conducted
in the Brazilian Amazon, with a few exceptions for Mex-
ico and Indonesia. Southeast Asia (Myanmar, Vietnam, Laos,
and Cambodia) was lacking any FC measurements described
in the peer-reviewed literature, but this region is important
from a fire emissions perspective. Tropical forests in Mex-
ico had a higher CC than forests in the Amazon and Indone-
sia (Fig. 3), and had a higher FC as well. Different forest
types can likely explain this difference; in Fig. 3 substantial
differences are shown for FL, CC, and FC in primary tropi-
cal evergreen forest, secondary tropical evergreen forest, and
tropical dry forest. Obviously, the number of measurements
conducted in a specific forest type will impact the biome-
averaged value found for a certain region. Clearly, the defi-
nition of a certain biome is not always straightforward, and
uncertainty regarding regional discrepancies within the dif-
ferent biomes should be taken into account when averaged
values are interpreted and used by the modeling communi-
ties.
Coming back to the question posed in the beginning of
this section, we think care should be taken with using biome-
averaged values. They provide a guideline, but the path for-
ward is to continue developing models or remote sensing op-
tions that aim to account for variability within biomes, and
to use the database accompanying this paper to constrain
these models, rather than simply to use biome-averaged val-
ues (further discussed in Sect. 3.2). Use of FC for specific
vegetation types within broader biomes (like the different
crop types as presented in Fig. 6) or fuel categories offers an
interesting alternative and is further discussed in Sect. 3.4.
3.2 Field measurement averages and comparison with
GFED3
Although the definition of a certain biome is not al-
ways straightforward, the biome-averaged values that we
presented in this paper are still valuable for highlight-
ing differences in fire characteristics between regions with
www.biogeosciences.net/11/7305/2014/ Biogeosciences, 11, 7305–7329, 2014

7320 T. T. van Leeuwen et al.: Biomass burning fuel consumption rates
specific vegetation and climate characteristics. We compared
our work with estimates from the Global Fire Emissions
Database version 3 (GFED3) and several FRE derived stud-
ies (Sect. 3.3). GFED3 fire emissions estimates (monthly
0.5◦× 0.5◦ fields) are based on estimates of burned area
(Giglio et al., 2010) and the satellite-driven Carnegie–Ames–
Stanford Approach (CASA) biogeochemical model (van der
Werf et al., 2010). To calculate FC we divided the GFED3
total biome-specific emissions estimates (g dry matter) in
every modeling grid cell by the total burned area observed
for every grid cell. Since one grid cell may consist of mul-
tiple biomes we followed the GFED3 fractionation of emis-
sions estimates, which represents the contribution of a cer-
tain biome to total emissions within one grid cell. Biome-
specific information on the area burned within one grid cell
was not available, and therefore we assumed that burned area
followed the same fractionation as the GFED3 emissions es-
timates. This assumption may overestimate or underestimate
biome-averaged GFED3 FC values: for example, in a defor-
estation grid cell that consists of savannas and tropical ev-
ergreen forests, the contribution of savanna fire emissions to
total emissions can be small, even when the contribution of
savanna burned area to total burned area observed in a grid
cell is actually quite large. In this specific case – when as-
suming that burned area followed the same fractionation as
the emissions – the estimated FC of savannas would be over-
estimated.
In Table 3 an overview is given for biome-specific FL, CC,
and FC that we estimated from data found in the literature.
In the fifth column FC per unit burned area of GFED3 is
shown for the collocated grid cells, i.e., grid cells in which
measurements were taken, and the sixth column presents the
difference between GFED3 FC and the field measurements.
In general, substantial differences were found between co-
located GFED3 FC and the field measurements. Although
the average FC agreed reasonably well (< 40 %) for crop
residue, tropical peat and the boreal peat biome, much larger
discrepancies (> 59 %) were found for the other biomes.
Many field measurements for these biomes had a standard
deviation that was close to the measurement average, indi-
cating that the uncertainty is substantial.
Within the savanna biome GFED3 overestimated the FC
by 72 % compared to the measurements, and this over-
estimation was even higher for grassland regions (78 %).
A possible cause of these discrepancies is that field cam-
paigns tend to focus on frequently burning areas, so fu-
els do not have the time to build up and increase their FL
(van der Werf et al., 2010). Because of the relatively coarse
0.5◦ resolution of GFED3, the fire frequency in GFED is the
average of more and less frequently burning patches and thus
potentially longer than in field sampling sites. On the other
hand, only a very small portion of the land’s surface burns an-
nually (van der Werf et al., 2013). Improved resolution for the
models may help to alleviate this problem and bring model
values closer to the field measurements, although it is very
unlikely that this is the only reason for the noted discrepancy.
For tropical forests, an important biome due to large-scale
deforestation emissions, substantial differences were found
as well: GFED3 overestimated FC by 71 % compared to the
field measurement average for collocated grid cells. This dis-
crepancy may be partly explained by the fact that repeated
fires in the tropical forest domain (when forest slash that did
not burn in a first fire is subject to additional fires during the
same dry season) are not always included in the field mea-
surements. Within GFED3, on the other hand, these repeated
fires were modeled by the number of active fires observed in
the same grid cell (fire persistence), which yields information
on the fuel load and type of burning (Morton et al., 2008; van
der Werf et al., 2010). Regional differences within the biome,
as discussed in Sect. 3.1, will also contribute to the differ-
ences found: in our case, the field measurement average was
biased towards evergreen tropical forest fires, but when the
emphasis is put on fires in secondary or tropical dry forests
this average value could change significantly (Fig. 3). It is
likely that grid cell heterogeneity in tropical deforestation
regions explains the large discrepancy found for the pasture
biome, where GFED3 FC overestimated the field measure-
ments by almost 500 %. For these specific pasture grid cells,
GFED3 may have been biased towards tropical evergreen de-
forestation fires, thereby increasing the average FC.
In the temperate forest biome FC was underestimated in
GFED3 by 74 % compared to the field measurement aver-
age for collocated grid cells. In our averaged field measure-
ment estimate we included all measurements presented in
Table 1c. As noticed in Sect. 2.3, it is likely though that
studies that provided a total FC (i.e., the FC of ground, sur-
face and/or crown fuels) are more representative of wildfires.
Prescribed burns, on the other hand, tend to burn less fuel
and therefore the studies that only include ground or sur-
face fuels were probably more representative for this fire
type. When focusing on studies that provide information on
one specific fuel class only, the field average for the tem-
perate forest would be significantly lower (13± 12 t ha−1)
as well as the discrepancy with GFED3 (+14 %). This FC
value of 13 t ha−1 may be more realistic for prescribed fires,
which contribute to roughly 50 % of all temperate forest fire
emissions in the contiguous United States (CONUS). Still, it
remains very uncertain how well FC measured for specific
fuel classes is representative for prescribed fires and wild-
fires. This issue also counts for boreal forests, where GFED3
overestimated the field measurements by almost 80 %. When
only including studies that provided a total FC (i.e., the FC of
ground, surface and/or crown fuels), the field average for the
boreal forest would increase from 35± 24 to 39± 19 t ha−1
and the discrepancy with GFED3 would decrease (from +79
to +60 %). This value of 39± 19 t ha−1 may be more rep-
resentative of boreal wildfires. Note that for temperate and
boreal forest measurements sometimes the more restrictive
definition of FL (as presented in Sect. 1) was used, and this
Biogeosciences, 11, 7305–7329, 2014 www.biogeosciences.net/11/7305/2014/

T. T. van Leeuwen et al.: Biomass burning fuel consumption rates 7321
Table 3. Biome-averaged values for fuel load (FL), combustion completeness (CC), and fuel consumption (FC) field measurements. Col-
umn 5 shows the FC per unit burned area as used in GFED3 (FCGFED3) and in column 6 the difference (%) in FCGFED3 compared to the
average FC of field measurements is given. Standard deviation (SD) is shown in parentheses.
Biome FL CC FC FCGFED3 Difference
(t ha−1) (%) (t ha−1)a (t ha−1)b (%)c
Savanna 7.6 (6.5) 71 (26) 4.6 (2.2) 7.9 +72
Grassland savanna 5.3 (2.0) 81 (16) 4.3 (2.2) 7.7 +78
Wooded savanna 11 (9.1) 58 (32) 5.1 (2.2) 8.1 +59
Tropical forest 285 (137) 49 (22) 126 (77) 215 +71
Temperate forest 115 (144) 61 (18) 58 (72) 15 −74
Boreal forest 69 (61) 51 (17) 35 (24) 62 +79
Pasture 74 (34) 47 (27) 28 (9.3) 168 +491
Shifting cultivation 44 (–) 47 (–) 23 (–) 6.5 −72
Crop residue 8.3 (9.9)d 75 (21) 6.5 (9.0) 5.6 −13
Chaparral 35 (23)e 76 (6.2) 27 (19) 3.5 −87
Tropical peatland 1056 (876)f 27 (–) 314 (196) 228 −27
Boreal peatland – – 42 (–) 25 −40
Tundrag 165 (15) 24 (5.0) 40 (–) – –
a For biomes where only one or two measurements are available, no uncertainty estimate is given.b FC per unit area burned according to GFED3, averaged over 1997–2009. The number represents the FC rate for
the collocated grid cells, i.e., grid cells in which field measurements were taken. Note that for this calculation the
assumption was made that GFED burned area is equally divided over different fire types in one grid cell, which
may influence average FCGFED3 values.c FCGFED3 compared to the average FC of field measurements for collocated grid cells. Positive numbers indicate
that FCGFED3 is higher than the average FC of field measurements.d We assumed an average CC of 88 % as reported in McCarty et al. (2011) to estimate FL for the study of
Lara et al. (2005).e We assumed a CC of 76 % (average CC for the studies of Hardy et al., 1996 and Yokelson et al., 2013) to
estimate FL for the study of Cofer III et al. (1988).f We assumed an average CC of 27.2 %, as reported in Usup et al. (2004), to estimate FL for the studies of
Page et al. (2002) and Ballhorn et al. (2009).g For the measurement location in the tundra biome no area burned was detected by GFED, and therefore no
comparison with GFED3 estimates was made.
can have an impact on FC values as well; if one applies a CC
calculated with respect to a restrictive pre-fire FL to the total
biomass available, the overall FC that was estimated can be
too high.
For most biomes, a few field measurements had an FC that
was 1 order of magnitude larger than the other values listed
in Table 1, which explains the discrepancy between the me-
dian and average FC values that was sometimes found (e.g.,
the “Australia and Tasmania” region in Fig. 4). By neglect-
ing these “outliers” the biome-averaged values may change
significantly, but this could lead to erroneously low or high
estimates as well. In general, FC shows large variability be-
tween biomes, within biomes, and even within a specific fuel
type. FC is often hard to measure, and since only a few
measurements are available for some biomes, care should
be taken when using the biome-averaged values presented
in this paper.
3.3 Field measurement averages and comparison with
FRE derived FC estimates
Besides a comparison with GFED3 data, we performed a
comparison of field measurement averages with fire radia-
tive energy (FRE, time-integrated FRP) derived estimates
as well. The basis of the FRE approach for estimating FC
is that the heat content of vegetation is more or less con-
stant, and that the FRE released and observed through a sen-
sor can be converted to FC by the use of a constant factor,
which was found to be 0.368± 0.015 kg MJ−1 across of a
range of fuels burned under laboratory conditions (Wooster
et al., 2005). More recent field experiments, however, indi-
cated that the conversion factor might be slightly lower for
grasslands in North America (Kumar et al., 2011; Schroeder
et al., 2014). Smith et al. (2013) investigated the relation-
ship between FC and FRE for pine needles with different fuel
moisture contents, and found that FRE released per kilogram
biomass consumed decreased with fuel moisture content due
to the energy required to evaporate and desorb the water con-
tained in the fuel. Thus, corrections for FRE based FC as-
sessments may be needed for fuels that burn at higher fuel
moisture contents. Differences in heat content of fuel may
introduce additional variation: for example, a clear relation-
ship between FRE and FC has not yet been demonstrated
for fires that burn mostly in the smoldering stage, like or-
ganic soils in boreal forests or large woody debris and trunks
in tropical deforestation regions. Another potential source of
uncertainty in the relation between satellite-derived FRE and
www.biogeosciences.net/11/7305/2014/ Biogeosciences, 11, 7305–7329, 2014
7322 T. T. van Leeuwen et al.: Biomass burning fuel consumption rates
FC is the correction for atmospheric disturbances, which may
significantly alter FRP retrievals and hence estimates of FC
(Schroeder et al., 2014). Note that, currently, atmospheric
correction is not performed for the standard fire products de-
rived from MODIS. Moreover, Schroeder et al. (2014) also
indicate that cloud masking in the MODIS FRP product may
lead to FRP underestimates as hotspots under thick smoke
may erroneously be masked out.
Despite all these uncertainties this approach is promising
and there are a number of studies that relate FRE to FC
on regional (Roberts et al., 2011; Freeborn et al., 2011) to
global scales (Vermote et al., 2009; Ellicott et al., 2009), and
Kaiser et al. (2012) used FRE to represent biomass burn-
ing in an operational chemical weather forecast framework.
However, since such estimates can be derived independently
of burned area, only a limited number of studies allow a
straightforward comparison to the FC values given in mass
units per area burned from the field experiments used in this
study.
A common finding of FRE-based estimates is that FC is
generally lower than GFED estimates, as shown by Roberts
et al. (2011) who estimated FC for Africa through an inte-
gration of MODIS burned area and Meteosat Spinning En-
hanced Visible and Infrared Imager (SEVIRI) derived FRP
and found values that were about 35 % lower than GFED.
For the savanna biome a median FC of ∼ 4 t ha−1 was found
for grassland and shrubland. This corresponds relatively well
to the mean of 4.3± 2.2 and 5.1± 2.2 t ha−1 found in the
grassland savanna and wooded savanna field studies we com-
piled, respectively. Boschetti and Roy (2009) explored tem-
poral integration and spatial extrapolation strategies for fus-
ing MODIS FRP and MODIS burned area data over a single
large fire in a grassland dominated area with sparse euca-
lypt trees in northern Australia. They estimated an FC range
of 3.97–4.13 t ha−1, which is well within the range found in
the Australian FC studies summarized in Table 1. Kumar et
al. (2011) exploited properties of the power law distribution
to estimate FC from FRP for an Australian savanna and a
study area in the Brazilian Amazon. While their FC estimate
of 4.6 t ha−1 of the Australian site is similar to the tempo-
ral integration results of Boschetti and Roy (2009), the esti-
mate for the Brazilian site is above 250 t ha−1 and thus sub-
stantially higher than the biome-averaged value for Brazilian
tropical forest (117± 56 t ha−1).
In general, realistic values are often obtained for well-
observed fires, but unrealistically low or high values can of-
ten occur especially for smaller fires due to the sparseness
of FRP observations and inaccuracies in the temporal inter-
polation and the burned area estimates. While FRE seems to
provide realistic estimates under a range of conditions, issues
of undersampling of FRE and – maybe less importantly – the
conversion of FRE to FC still remain to be addressed more
completely in order to derive spatially explicit FC estimates
using the FRP approach.
3.4 Fuel consumption for different fuel categories
As discussed in Sect. 3.1, the interpretation of average FC
values for each biome should be done carefully. As an al-
ternative to biome-averaged values, we also provided FC for
specific fuel categories, which may be more useful for cer-
tain research areas or modeling communities. In Table 2 fuel
category information was presented for the savanna, tropical
forest, temperate forest and boreal forest biomes. We focused
on the main fuel categories found in the literature, and clas-
sified these according to the US classification system. Most
of these fuel categories were similarly defined in different
studies and biomes; the woody debris classes for example
were systematically based on their time lag. However, for
measurements conducted in boreal forests the definition of
woody fuel classes was less consistent, mainly due to dif-
ferences between Canadian and American sampling method-
ologies (Keane, 2012). The difference between surface and
ground fuels can therefore be especially vague: e.g., litter is
classified as surface fuel according to the US fire manage-
ment standards, while many Canadian studies define litter
and organic soils as the forest floor and thus as the ground
fuel class. Obviously, this can cause problems when com-
paring studies, and therefore we recommend a more uniform
measurement protocol for this fuel type and biome.
Certain fuel type averages presented in this paper were
based on a minimum of three different studies. For these fuel
categories specifically, more field measurements are needed
to decrease the uncertainty and better understand the vari-
ations found, especially within the boreal and tropical forest
biomes. Measurements in the boreal and tropical peat biomes
deserve specific attention in future measurement campaigns:
although peat fires have been studied in several field cam-
paigns, they still remain one of the least understood fire types
due to poor knowledge of the depth of the burning and the
complex mix of trace gases emitted in these fires as a con-
sequence of the below-ground combustion that is less effi-
cient than during surface or crown fires. Additional studies
are needed in order to capture fully the variability and pro-
cesses occurring in these biomes, especially considering their
large FL and FC. Another biome that deserves more attention
in future studies is crop residue, since our understanding of
FC variability for different crop types is still poor.
4 Summary
This study aimed to compile peer-reviewed literature on mea-
sured fuel consumption in landscape fires. The field measure-
ments were partitioned into 11 different biomes, and for each
biome we have reported biome averages and other statistics.
For some biomes, we provided information on different fuel
categories as well. The number of study sites varied from
1 for the tundra biome to 39 different measurement sites in
the boreal forest biome. In total, we compiled 124 unique
Biogeosciences, 11, 7305–7329, 2014 www.biogeosciences.net/11/7305/2014/

T. T. van Leeuwen et al.: Biomass burning fuel consumption rates 7323
measurement locations. The biome-averages and fuel-type-
specific data of fuel load and fuel consumption can be used to
constrain models, or can be used as an input parameter in cal-
culating emissions. Care should be taken though with using
biome-averaged values because it is unclear whether these
are representative and because there is substantial variability
within biomes, as indicated by the large standard deviations
found.
Modeled values from GFED3 corresponded reasonably
well to the co-located measured values for all biomes except
for the savanna and tropical forest, where GFED-derived val-
ues were over a factor 2 too high. In tropical forests, part
of this discrepancy can be explained because field measure-
ments only take one fire into account, while GFED also ac-
counts for consecutive fires that boost fuel consumption.
Although the overall spatial representativeness of the
fuel consumption field measurements was reasonable for
most fire-prone regions, several important regions from a
fire emissions perspective – including Southeast Asia, east-
ern Siberia, and central Africa – were severely under-
represented. When new information on fuel consumption be-
comes available, the field measurement database will be up-
dated. The most up-to-date version can be retrieved from
http://www.falw.vu/~gwerf/FC. As a next step, we aim to im-
prove our understanding of the drivers of regional and tem-
poral variability within biomes, as well as for different fuel
categories.
Acknowledgements. The workshop that led to this paper was
sponsored by the EU FP7 COCOS project. Thijs van Leeuwen,
Guido van der Werf, and Rob Detmers acknowledge funding from
the EU FP7 MACC-II project (contract number 218793) and the
EU FP7 GeoCarbon project (contract number 283080).
Edited by: K. Thonicke
References
Akagi, S. K., Yokelson, R. J., Wiedinmyer, C., Alvarado, M. J.,
Reid, J. S., Karl, T., Crounse, J. D., and Wennberg, P. O.: Emis-
sion factors for open and domestic biomass burning for use
in atmospheric models, Atmos. Chem. Phys, 11, 4039–4072,
doi:10.5194/acp-11-4039-2011, 2011.
Amiro, B. D., Todd, J. B., Wotton, B. M., Logan, K. A., Flannigan,
M. D., Stocks, B. J., Mason, J. A., Martell, D. L., and Hirsch, K.
G.: Direct carbon emissions from Canadian forest fires, 1959–
1999, Can. J. For. Res., 31, 512–525, 2001.
Andreae, M. O. and Merlet, P.: Emission of trace gases and aerosols
from biomass burning, Global Biogeochem. Cy., 15, 955–966,
2001.
Araújo, T., Carvalho Jr., J., and Higuchi, N.: A tropical rainfor-
est clearing experiment by biomass burning in the state of Pará,
Brazil, Atmos. Environ., 33, 1991–1998, 1999.
Archibald, S., Scholes, R. J., Roy, D. P., Roberts, G., and Boschetti,
L.: Southern African fire regimes as revealed by remote sensing,
Int. J. Wildland Fire, 19, 861–878, 2010.
Baccini, A., Goetz, S. J., Walker, W. S., Laporte, N. T., Sun, M.,
Sulla-Menashe, D., Hackler, J., Beck, P. S. A., Dubuyah, R.,
Friedl, M. A., Samanta, S., and Houghton, R. A.: Estimated car-
bon dioxide emissions from tropical deforestation improved by
carbon-density maps, Nat. Clim. Change, 2, 182–185, 2012.
Balch, J. K., Nepstad, D. C., Brando, P. M., Curran, L. M., Portela,
O., de Carvalho Jr., O., and Lefebvre, P.: Negative fire feedback
in a transitional forest of southeastern Amazonia, Global. Change
Biol., 14, 2276–2287, 2008.
Ballhorn, U., Siegert, F., Mason, M., and Limin, S.: Derivation of
burn scar depths and estimation of carbon emissions with LIDAR
in Indonesian peatlands, Proc. Natl. Acad. Sci., 106, 21213–
21218, 2009.
Barbosa, R. and Fearnside, P.: Pasture burning in Amazonia: Dy-
namics of residual biomass and the storage and release of above-
ground carbon, J. Geophys. Res.-Atmos., 101, 25847–25857,
1996.
Barbosa, R. I. and Fearnside, P. M.: Above-ground biomass and the
fate of carbon after burning in the savannas of Roraima, Brazilian
Amazonia, Forest Ecol. Manag., 216, 295–316, 2005.
Benscoter, B. W. and Wieder, R. K.: Variability in organic matter
lost by combustion in a boreal bog during the 2001 Chisholm
fire, Can. J. For. Res., 33, 2509–2513, 2003.
Bêche, L. A., Stephens, S. L., and Resh, V. H.: Effects of prescribed
fire on a Sierra Nevada (California, USA) stream and its riparian
zone, Forest Ecol. Manag., 218, 37–59, 2005.
Bilbao, B. and Medina, E.: Types of grassland fires and nitro-
gen volatilization in tropical savannas of Venezuela, in: Biomass
burning and global change, vol 2. Biomass burning in South
America, Southeast Asia and temperate and boreal ecosystems,
and the oild fires of Kuwait, edited by: Levine, J. S., Cambridge,
MIT press, 569–574, 1996.
Boby, L. A., Schuur, E. A., Mack, M. C., Verbyla, D., and John-
stone, J. F.: Quantifying fire severity, carbon, and nitrogen emis-
sions in Alaska’s boreal forest, Ecol. Appl., 20, 1633–1647,
2010.
Boschetti, L. and Roy, D. P.: Strategies for the fusion of satel-
lite fire radiative power with burned area data for fire ra-
diative energy derivation, J. Geophys. Res., 114, D20302,
doi:10.1029/2008JD011645, 2009.
Bowman, D. M. J. S., Balch, J. K., Artaxo, P., Bond, W. J., Carlson,
J. M., Cochrane, M. A., D’Antonio, C. M., DeFries, R. S., Doyle,
J. C., Harrison, S. P., Johnston, F. H., Keeley, J. E., Krawchuk,
M. A., Kull, C. A., Marston, J. B., Moritz, M. A., Prentice, I. C.,
Roos, C. I., Scott, A. C., Swetnam, T. W., van der Werf, G. R.,
and Pyne, S. J.: Fire in the Earth System, Science, 324, 481–484,
2009.
Bradshaw, L. S., Deeming, J. E., Burgan, R. E., and Cohen, J.
D.: The 1978 National Fire-Danger Rating System: Technical
documentation. USDA Forest Service, Intermountain Forest and
Range Experiment Station General Technical Report INT-169,
1983.
Brandt, J. P.: The extent of the North American boreal zone, Envi-
ron. Rev., 17, 101–161, 2009.
Brown, J. K.: A Planar Intersect Method for Sampling Fuel Volume
and Surface Area, Forest Science, 1971.
www.biogeosciences.net/11/7305/2014/ Biogeosciences, 11, 7305–7329, 2014
7324 T. T. van Leeuwen et al.: Biomass burning fuel consumption rates
Campbell, J., Donato, D., Azuma, D., and Law, B.: Pyro-
genic carbon emission from a large wildfire in Oregon,
United States, J. Geophys. Res.-Biogeosci., 112, G04014,
doi:10.1029/2007JG000451, 2007.
Cardille, J. A. and Foley, J. A.: Agriculture Land-use Change in
Brazilian Amazonia between 1980 and 1995: Evidence from In-
tegrated Satellite and Census Data, Remote Sens. Environ., 87,
551–562, 2003.
Carter, M. C. and Darwin Foster, C.: Prescribed burning and pro-
ductivity in southern pine forests: a review, Forest Ecol. Manag.,
191, 93–109, 2004.
Carvalho, J. A., Santos, J. M., Santos, J. C., Leitão, M. M.,
and Higuchi, N.: A tropical rainforest clearing experiment by
biomass burning in the Manaus region, Atmos. Environ., 29,
2301–2309, 1995.
Carvalho Jr., J. A., Higuchi, N., Araújo, T. M., and Santos, J. C.:
Combustion completeness in a rainforest clearing experiment in
Manaus, Brazil, J. Geophys. Res., 103, 13195–13199, 1998.
Carvalho Jr., J. A., Costa, F. S., Veras, C. A. G., Sandberg, D. V.,
Alvarado, E. C., Gielow, R., Serra Jr., A. M., and Santos, J. C.:
Biomass fire consumption and carbon release rates of rainforest-
clearing experiments conducted in northern Mato Grosso, Brazil,
J. Geophys. Res., 106, 17877–17887, 2001.
Carvalho Jr., J. A., Veras, C. A. G., Soares Neto, T. G., Costa, M.
A. M., Costa, F. S., van Leeuwen, T. T., Krieger Filho, G. C.,
Tourigny, E., Forti, M. C., Fostier, A. H., Siqueira, M. B., San-
tos, J. C., Anselmo, E., Santos, C. R., Lima, B. A., Cascão, P., and
Frade Jr., E. F.: Biomass Consumption and CO2 and CO emis-
sion amounts in a Forest Clearing Fire in Western Amazonia. Sci-
entific Report, Thematic Project, Project 2008/04490-4, FAPESP
(Fundação de Amparo à Pesquisa do Estado de São Paulo), 2011.
Chen, Y., Randerson, J. T., Morton, D. C., DeFries, R. S., Collatz,
G. J., Kasibhatla, P. S., Giglio, L., Jin, Y., and Marlier, M. E.:
Forecasting Fire Season Severity in South America Using Sea
Surface Temperature Anomalies, Science, 334, 787–791, 2011.
Cheney, P. and Sullivan, A.: Grassfires. Fuel, Weather and Fire Be-
haviour, CSIRO Publishing, Melbourne, 1997.
Christian, T. J., Yokelson, R. J., Carvalho, J. A. J., Griffith, D. W.
T., Alvarado, E. C., Santos, J. C., Neto, T. G. S., Gurgel Veras,
C. A., and Hao, W. M.: The tropical forest and fire emissions
experiment: Trace gases emitted by smoldering logs and dung
from deforestation and pasture fires in Brazil, J. Geophys. Res.-
Atmos., 112, D18308, doi:10.1029/2006JD008147, 2007.
Cofer III, W. R., Levine, J. S., Riggan, P. J., Sebacher, D. I., Win-
stead, E. L., Shaw Jr., E. F., Brass, J. A., and Ambrosia, V. G.:
Trace gas emissions from a Mid-latitude prescribed chaparral
fire, J. Geophys. Res., 93, 1653–1658, 1988.
Cook, G. D.: The fate of nutrients during fires in a tropical savanna,
Austral. Ecol., 19, 359–365, 1994.
Cooke, W. F. and Wilson, J. J. N.: A global black carbon aerosol
model, J. Geophys. Res., 101, 19395, doi:10.1029/96JD00671,
1996.
Crutzen, P. J. and Andreae, M. O.: Biomass Burning in the Tropics –
Impact on Atmospheric Chemistry and Biogeochemical Cycles,
Science, 250, 1669–1678, 1990.
De Castro, E. A. and Kauffman, J. B.: Ecosystem structure in
the Brazilian Cerrado: a vegetation gradient of aboveground
biomass, root mass and consumption by fire, J. Trop. Ecol., 14,
263–283, 1998.
de Groot, W. J., Landry, R., Kurz, W. A., Anderson, K. R., Engle-
field, P., Fraser, R. H., Hall, R. J., Banfield, E., Raymond, D. A.,
Decker, V., Lynham, T. J., and Pritchard, J. M.: Estimating direct
carbon emissions from Canadian wildland fires, Int. J. Wildland
Fire, 16, 593, doi:10.1071/WF06150, 2007.
de Groot, W. J., Pritchard, J. M., and Lynham, T. J.: Forest floor
fuel consumption and carbon emissions in Canadian boreal forest
fires, Can. J. For. Res., 39, 367–382, 2009.
de Groot, W. J., Cantin, A. S., Flannigan, M. D., and Soja, A. J.: A
comparison of Canadian and Russian boreal forest fire regimes,
Forest Ecol. Manag., 294, 23–34, 2013a.
de Groot, W. J., Flannigan, M. D., and Cantin, A. S.: Climate change
impacts on future boreal fire regimes, Forest Ecol. Manag., 294,
35–44, 2013b.
Dennis, A., Fraser, M., Anderson, S., and Allen, D.: Air pollu-
tant emissions associated with forest, grassland, and agricultural
burning in Texas, Atmos. Environ., 36, 3779–3792, 2002.
Eck, T. F., Holben, B. N., Reid, J. S., Mukelabai, M. M., Piketh,
S. J., Torres, O., Jethva, H. T., Hyer, E. J., Ward, D. E., Dubovik,
O., Sinyuk, A., Schafer, J. S., Giles, D. M., Sorokin, M., Smirnov,
A., and Slutsker, I.: A seasonal trend of single scattering albedo
in southern African biomass-burning particles: Implications for
satellite products and estimates of emissions for the world’s
largest biomass-burning source, J. Geophys. Res.-Atmos., 118,
6414–6432, 2013.
Ellicott, E., Vermote, E., Giglio, L., and Roberts, G.: Estimating
biomass consumed from fire using MODIS FRE, Geophys. Res.
Lett, 36, L13401, doi:10.1029/2009GL038581, 2009.
Fearnside, P. M.: Greenhouse gas emissions from deforestation in
the Brazilian Amazon, in: Carbon emissions and sequestration
in forests: case studies from seven developing countries, (Draft
edition) US Environmental Protection Agency, Climate Change
Division, edited by: Makundi, W. and Sathaye, J., Washington
DC and Energy and Environment Division, Lawrence Berkeley
Laboratory, Berkeley, CA, 1–73, 1992.
Fearnside, P. M., Leal Jr., N., and Moreira Fernandes, F.: Rainfor-
est burning and the global carbon budget: biomass, combustion
efficiency, and charcoal formation in the Brazilian Amazon, J.
Geophys. Res., 98, 16733-16743, 1993.
Fearnside, P. M., de Alencastro Graça, P. M. L., Leal Jr., N., Ro-
drigues, F., and Robinson, J. M.: Tropical forest burning in
Brazilian Amazonia: measurement of biomass loading, burning
efficiency and charcoal formation at altamira, Pará, Forest Ecol.
Manag., 123, 65–79, 1999.
Fearnside, P. M., de Alencastro Graça, P., and Rodrigues, F.: Burn-
ing of Amazonian rainforests: burning efficiency and charcoal
formation in forest cleared for cattle pasture near Manaus, Brazil,
Forest Ecol. Manag., 146, 115–128, 2001.
Field, R., van der Werf, G., and Shen, S.: Human amplification of
drought-induced biomass burning in Indonesia since 1960, Nat.
Geosci., 2009.
FIRESCAN Science Team: Fire in Ecosystems of Boreal Eura-
sia: The Bor Forest Island Fire Experiment Fire Research Cam-
paign Asia-North (FIRESCAN), in: Biomass Burning and Global
Change, edited by: Levine, J. S., MIT Press, Cambridge, Mass.,
848–873, 1996.
Flannigan, M., Cantin, A. S., de Groot, W. J., Wotton, M., Newbery,
A., and Gowman, L. M.: Global wildland fire season severity in
the 21st century, Forest Ecol. Manag., 294, 54–61, 2013.
Biogeosciences, 11, 7305–7329, 2014 www.biogeosciences.net/11/7305/2014/
T. T. van Leeuwen et al.: Biomass burning fuel consumption rates 7325
Freeborn, P. H., Wooster, M. J., and Roberts, G.: Addressing the
spatiotemporal sampling design of MODIS to provide estimates
of the fire radiative energy emitted from Africa, Remote Sens.
Environ., 115, 475–489, 2011.
French, N. H. F., Goovaerts, P., and Kasischke, E. S.: Uncertainty in
estimating carbon emissions from boreal forest fires, J. Geophys.
Res.-Atmos., 109, D14S08, doi:10.1029/2003JD003635, 2004
French, N. H. F., McKenzie, D., Hamermesh, N., and McCarty, J.:
NACP Integrated Wildland and Cropland 30 m Fuel Characteris-
tics Map, USA, 2010.
Frost, P. G. H.: The ecology of miombo woodlands, in: The Miombo
in Transition: Woodlands and Welfare in Africa, edited by:
Campbell, B., 11–58, CIFOR, Bogor, Indonesia, 1996.
Giglio, L., Loboda, T., Roy, D. P., Quayle, B., and Justice, C. O.: An
active-fire based burned area mapping algorithm for the MODIS
sensor, Remote Sens. Environ., 113, 408–420, 2009.
Giglio, L., Randerson, J. T., van der Werf, G. R., Kasibhatla, P.
S., Collatz, G. J., Morton, D. C., and DeFries, R. S.: Assess-
ing variability and long-term trends in burned area by merging
multiple satellite fire products, Biogeosciences, 7, 1171–1186,
doi:10.5194/bg-7-1171-2010, 2010.
Gignoux, J., Mordelet, P., and Menaut, J. C.: Biomass cycle and
primary production, Lamto: Structure, functioning and dynam-
ics of a savanna ecosystem, edited by: Abbadie, L., Gignoux, J.,
LeRoux, X., and Lepage, M., 115–137, 2006.
Gill, A. M. and Allan, G.: Large fires, fire effects and the fire-regime
concept, Int. J. Wildland Fire, 17, 688, doi:10.1071/WF07145,
2008.
Goode, J. G., Yokelson, R. J., Ward, D. E., Susott, R. A., Bab-
bitt, R. E., Davies, M. A., and Hao, W. M.: Measurements of
excess O3, CO2, CO, CH4, C2H4, C2H2, HCN, NO, NH3,
HCOOH, CH3COOH, HCHO, and CH3OH in 1997 Alaskan
biomass burning plumes by airborne Fourier transform infrared
spectroscopy (AFTIR), J. Geophys. Res., 105, 22147–22166,
2000.
Goodrick, S. L., Shea, D., and Blake, J.: Estimating fuel consump-
tion for the upper coastal plain of South Carolina, South, J. Appl.
For., 34, 5–12, 2010.
Guild, L. S., Kauffman, J. B., Ellingson, L. J., Cummings, D. L.,
Castro, E. A., Babbitt, R. E., and Ward, D. E.: Dynamics asso-
ciated with total aboveground biomass, C, nutrient pools, and
biomass burning of primary forest and pasture in Rondônia,
Brazil during SCAR-B, J. Geophys. Res.-Atmos., 103, 32091–
32100, 1998.
Harden, J. W., Trumbore, S. E., Stocks, B. J., Hirsch, A., Gower,
S. T., O’Neill, K. P., and Kasischke, E. S.: The role of fire in the
boreal carbon budget, Glob. Change Biol., 6, 174–184, 2000.
Harden, J. W., Neff, J. C., Sandberg, D. V., Turetsky, M. R., Ottmar,
R., Gleixner, G., Fries, T. L., and Manies, K. L.: Chemistry
of burning the forest floor during the FROSTFIRE experimen-
tal burn, interior Alaska, 1999, Global Biogeochem. Cy., 18,
GB3014, doi:10.1029/2003GB002194, 2004.
Harden, J. W., Manies, K. L., Turetsky, M. R., and Neff, J. C.: Ef-
fects of wildfire and permafrost on soil organic matter and soil
climate in interior Alaska, Glob. Change Biol., 12, 2391–2403,
2006.
Hardy, C. C., Conard, S. G., Regelbrugge, J. C., and Teesdale, D.
R.: Smoke emissions from prescribed burning of southern Cali-
fornia chaparral, United States Department of Agriculture, Forest
Service Research Paper PNW-RP-486, 1996.
Hély, C., Dowty, P. R., Alleaume, S., Caylor, K. K., Korontzi, S.,
Swap, R. J., Shugart, H. H., and Justice, C. O.: Regional fuel
load for two climatically contrasting years in southern Africa, J.
Geophys. Res., 108, D13, doi:10.1029/2002JD002341, 2003a.
Hély, C., Alleaume, S., Swap, R. J., Shugart, H. H., and Justice, C.
O.: SAFARI-2000 characterization of fuels, fire behavior, com-
bustion completeness, and emissions from experimental burns in
infertile grass savannas in western Zambia, J. Ar. Environ., 54,
381–394, 2003b.
Hély, C., Caylor, K. K., Dowty, P., Alleaume, S., Swap, R. J.,
Shugart, H. H., and Justice, C. O.: A Temporally Explicit Pro-
duction Efficiency Model for Fuel Load Allocation in Southern
Africa, Ecosystems, 10, 1116–1132, 2007.
Higuera, P. E., Chipman, M. L., Barnes, J. L., Urban, M. A.,
and Hu, F. S.: Variability of tundra fire regimes in Arctic
Alaska: millennial-scale patterns and ecological implications,
Ecol. Appl., 21, 3211–3226, 2011.
Hille, M. G. and Stephens, S. L.: Mixed conifer forest duff con-
sumption during prescribed fires: tree crown impacts, Forest Sci-
ence, 51, 417–424, 2005.
Hoffa, E. A., Ward, D. E., Hao, W. M., Susott, R. A., and Wakimoto,
R. H.: Seasonality of carbon emissions from biomass burning in a
Zambian savanna, J. Geophys. Res.-Atmos., 104, 13841–13853,
1999.
Hollis, J. J., Matthews, S., Ottmar, R. D., Prichard, S. J., Slijepcevic,
A., Burrows, N. D., Ward, B., Tolhurst, K. G., Anderson, W. R.,
and Gould, J. S.: Testing woody fuel consumption models for ap-
plication in Australian southern eucalypt forest fires, Forest Ecol.
Manag., 260, 948–964, 2010.
Hu, F. S., Higuera, P. E., Walsh, J. E., Chapman, W. L., Duffy, P. A.,
Brubaker, L. B., and Chipman, M. L.: Tundra burning in Alaska:
linkages to climatic change and sea ice retreat, J. Geophys. Res.
Biogeosci., 115, G04002, doi:10.1029/2009JG001270, 2010.
Hughes, R. F., Kauffman, J. B., and Cummings, D. L.: Fire in the
Brazilian Amazon, Oecologia, 124, 574–588, 2000a.
Hughes, R. and Kauffman, J.: Ecosystem-scale impacts of defor-
estation and land use in a humid tropical region of Mexico, Eco-
logical Applications, 2000b.
Hurst, D. F., Griffith, D. W. T., Carras, J. N., Williams, D. J., and
Fraser, P. J.: Measurements of trace gases emitted by Australian
savanna fires during the 1990 dry season, J. Atmos. Chem., 18,
33–56, 1994.
Hyde, J. C., Smith, A. M. S., Ottmar, R. D., Alvarado, E. C., and
Morgan, P.: The combustion of sound and rotten woody debris: a
review, Int. J. Wildland Fire, 20, 163–174, 2011.
Ivanova, G. A., Conard, S. G., Kukavskaya, E. A., and McRae, D.
J.: Fire impact on carbon storage in light conifer forests of the
Lower Angara region, Siberia, Environ. Res. Lett., 6, 045203,
doi:10.1088/1748-9326/6/4/045203, 2011.
Jenkins, B. M., Turn, S. Q., and Williams, R. B.: Atmospheric emis-
sions from agricultural burning in California: determination of
burn fractions, distribution factors, and crop-specific contribu-
tions, Agriculture, Ecosyst. Environ., 38, 313–330, 1992.
Jin, Y., Randerson, J. T., Faivre, N., Capps, S., Hall, A., and
Goulden, M. L.: Contrasting controls on wildland fires in South-
ern California during periods with and without Santa Ana winds,
J. Geophys. Res.-Biogeosci., 119, 432–450, 2014.
www.biogeosciences.net/11/7305/2014/ Biogeosciences, 11, 7305–7329, 2014

7326 T. T. van Leeuwen et al.: Biomass burning fuel consumption rates
Johnston, F. H., Henderson, S. B., Chen, Y., Randerson, J. T., Mar-
lier, M., DeFries, R. S., Kinney, P., Bowman, D. M. J. S., and
Brauer, M.: Estimated Global Mortality Attributable to Smoke
from Landscape Fires, Environ. Health Perspect., 120, 695–701,
2012.
Johnston, W. J. and Golob, C. T.: Quantifying post-harvest emis-
sions from bluegrass seed production field burning. Department
of Crop and Soil Sciences, Washington State University, Wash-
ington, DC, Final report, 2004.
Jones, B. M., Kolden, C. A., Jandt, R., Abatzoglou, J. T., Urban, F.,
and Arp, C. D.: Fire Behavior, Weather, and Burn Severity of the
2007 Anaktuvuk River Tundra Fire, North Slope, Alaska, Arctic,
Ant. Alpine Res., 41, 309–316, 2009.
Kaiser, J. W., Heil, A., Andreae, M. O., Benedetti, A., Chubarova,
N., Jones, L., Morcrette, J.-J., Razinger, M., Schultz, M. G.,
Suttie, M., and van der Werf, G. R.: Biomass burning emis-
sions estimated with a global fire assimilation system based
on observed fire radiative power, Biogeosciences, 9, 527–554,
doi:10.5194/bg-9-527-2012, 2012.
Kane, E. S., Kasischke, E. S., Valentine, D. W., Turetsky, M. R.,
and McGuire, A. D.: Topographic influences on wildfire con-
sumption of soil organic carbon in interior Alaska: Implications
for black carbon accumulation, J. Geophys. Res., 112, G03017,
doi:10.1029/2007JG000458, 2007.
Kasischke, E. S., Stocks, B. J., O’Neill, K., French, N. H. F.,
and Bourgeau-Chavez, L. L.: Direct Effects of Fire on the Bo-
real Forest Carbon Budget, in: Biomass Burning and Its Inter-
Relationships with the Climate System, edited by: Innes, J. L.,
Beniston, M., and Verstraete, M. M., Springer Netherlands, Dor-
drecht, 3, 51–68, 2000.
Kasischke, E. S., Williams, D., and Barry, D.: International
Journal of Wildland Fire, Int. J. Wildland Fire, 11, 131,
doi:10.1071/WF02023, 2002.
Kasischke, E. S. and Turetsky, M. R.: Kasischke: Recent changes in
the fire regime across the North American boreal region-Spatial
and temporal patterns of burning across Canada and Alaska,
Geophys. Res. Lett., 33, L09703, 2006.
Kasischke, E. S., Loboda, T., Giglio, L., French, N. H. F.,
Hoy, E. E., de Jong, B., and Riano, D.: Quantifying burned
area for North American forests: Implications for direct re-
duction of carbon stocks, J. Geophys. Res., 116, G04003,
doi:10.1029/2011JG001707, 2011.
Kauffman, J. B., Sanford Jr., R. L., Cummings, D. L., Salcedo, I.
H., and Sampaio, E. V. S. B.: Biomass and nutrient dynamics
associated with slash fires in neotropical dry forests, Ecology,
74, 140–151, 1993.
Kauffman, J. B., Cummings, D. L., Ward, D. E., and Babbitt,
R.: Fire in the Brazilian Amazon: 1. Biomass, nutrient pools,
and losses in slashed primary forests, Oecologia, 104, 397–408,
1995.
Kauffman, J. B., Cummings, D. L., and Ward, D. E.: Fire in the
Brazilian Amazon: 2. Biomass, nutrient pools and losses in cattle
pastures, Oecologia, 113, 415–427, 1998.
Kauffman, J. B., Steele, M. D., Cummings, D. L., and Jaramillo,
V. J.: Biomass dynamics associated with deforestation, fire, and,
conversion to cattle pasture in a Mexican tropical dry forest, For-
est Ecol. Manag., 176, 1–12, 2003.
Keane, R. E.: Describing wildland surface fuel loading for fire man-
agement: a review of approaches, methods, and systems, Int. J.
Wildland Fire, 22, 51–62, 2012.
Keeley, J. E., Safford, H., Fotheringham, C. J., Franklin, J., and
Moritz, M.: The 2007 Southern California Wildfires: Lessons in
Complexity, J. Forest., 107, 287–296, 2009.
Kloster, S., Mahowald, N. M., Randerson, J. T., Thornton, P. E.,
Hoffman, F. M., Levis, S., Lawrence, P. J., Feddema, J. J., Ole-
son, K. W., and Lawrence, D. M.: Fire dynamics during the
20th century simulated by the Community Land Model, Biogeo-
sciences, 7, 1877–1902, doi:10.5194/bg-7-1877-2010, 2010.
Kumar, S. S., Roy, D. P., Boschetti, L., and Kremens, R.: Exploit-
ing the power law distribution properties of satellite fire radiative
power retrievals: A method to estimate fire radiative energy and
biomass burned from sparse satellite observations, J. Geophys.
Res., 116, D19303, doi:10.1029/2011JD015676, 2011.
Lara, L., Artaxo, P., Martinelli, L., Camargo, P., Victoria, R., and
Ferraz, E.: Properties of aerosols from sugar-cane burning emis-
sions in Southeastern Brazil, Atmos. Environ., 39, 4627–4637,
2005.
Mack, M. C., Bret-Harte, M. S., Hollingsworth, T. N., Jandt, R. R.,
Schuur, E. A. G., Shaver, G. R., and Verbyla, D. L.: Carbon loss
from an unprecedented Arctic tundra wildfire, Nature, 475, 489–
492, 2011.
Marengo, J. A., Borma, L. S., Rodriguez, D. A., Pinho, P., Soares,
W. R., and Alves, L. M.: Recent Extremes of Drought and Flood-
ing in Amazonia: Vulnerabilities and Human Adaptation, Am. J.
Clim. Change, 2, 87–96, 2013.
Maurìcio Lima de Alencastro Graça, P., Fearnside, P. M., and Cerri,
C. C.: Burning of Amazonian forest in Ariquemes, Rondônia,
Brazil: biomass, charcoal formation and burning efficiency, For-
est Ecol. Manag., 120, 179–191, 1999.
Maxwell, W. G. and Ward, F. R.: Photo series for quantifying forest
residues in the: ponderosa pine type/ponderosa pine and associ-
ated species type/lodgepole pine type, USDA For Ser Gen Tech
Rep PNW Pac Northwest For Range Exp Stn US Dep Agric,
1976.
McCarty, J. L.: Remote Sensing-Based Estimates of Annual and
Seasonal Emissions from Crop Residue Burning in the Contigu-
ous United States, J. Air Waste Manag. Assoc., 61, 22–34, 2011.
McCarty, J. L., Ellicott, E. A., Romanenkov, V., Rukhovitch, D., and
Koroleva, P.: Multi-year black carbon emissions from cropland
burning in the Russian Federation, Atmos. Environ., 63, 223–
268, 2012
Menaut, J. C., Abbadie, L., Lavenu, F., Loudjani, P., and Po-
daire, A.: Biomass burning in West African savannas, in: Global
Biomass Burning – Atmospheric, Climatic, and Biospheric Im-
plications, edited by: Levine, J. S., Massachusetts Institute of
Technology Press, Cambridge, MA, USA, 133–142, 1991.
Menaut J. C., Lepage M., and Abbadie, L.: Savannas, woodlands
and dry forests in Africa, in: Seasonally Dry Tropical Forests,
edited by: Bullock, S. H., Mooney, H. A., and Medina, E. E.,
Cambridge, UK, Cambridge University Press, 64–92, 1995.
Meyer, C. P., Cook, G. D., Reisen, F., Smith, T. E. L., Tattaris, M.,
Russell-Smith, J., Maier, S. W., Yates, C. P., and Wooster, M.
J.: Direct measurements of the seasonality of emission factors
from savanna fires in northern Australia, J. Geophys. Res., 117,
D20305, doi:10.1029/2012JD017671, 2012.
Biogeosciences, 11, 7305–7329, 2014 www.biogeosciences.net/11/7305/2014/
T. T. van Leeuwen et al.: Biomass burning fuel consumption rates 7327
Miranda, H. S., Rocha e Silva, E. P., and Miranda, A. C.: Compor-
tamento do fogo em queimadas de campo sujo, in: Impactos de
Queimadas em Areas de Cerrado e Restinga, edited by: Miranda,
H. S., Saito, C. H., and Dias, B. F. S., Universidade de Brasilia,
Brasilia, DF, Brazil, 1–10, 1996.
Mollicone, D., Eva, H. D., and Achard, F.: Human role in Russian
wild fires, Nature, 440, 436–437, 2006.
Moritz, M. A., Moody, T. J., Krawchuk, M. A., Hughes, M., and
Hall, A.: Spatial variation in extreme winds predicts large wild-
fire locations in chaparral ecosystems, Geophys. Res. Lett., 37,
L04801, doi:10.1029/2009GL041735, 2010.
Morton, D. C., DeFries, R. S., Randerson, J. T., Giglio, L.,
Schroeder, W. and Van Der Werf, G. R.: Agricultural in-
tensification increases deforestation fire activity in Amazo-
nia, Glob. Change Biol., 14, 2262–2275, doi:10.1111/j.1365-
2486.2008.01652.x, 2008.
Nash, C. H. and Johnson, E. A.: Synoptic climatology of lightning-
caused forest fires in subalpine and boreal forests, Can. J. For.
Res., 26, 1859–1874, 1996.
Nepstad, D. C., Verssimo, A., Alencar, A., Nobre, C., Lima, E.,
Lefebvre, P., Schlesinger, P., Potter, C., Moutinho, P., Mendoza,
E., Cochrane, M., and Brooks, V.: Large-scale impoverishment
of Amazonian forests by logging and fire, Nature, 398, 505–508,
1999.
Ortiz de Zárate, I., Ezcurra, A., Lacaux, J. P., Van Dinh, P., and Díaz
de Argandoña, J.: Pollution by cereal waste burning in Spain,
Atmos. Res., 73, 161–170, 2005.
Ottmar, R. D. and Sandberg, D.V.: Predicting Forest Floor Con-
sumption From Wildland Fire in Boreal forests of Alaska, Am.
Geophys. Un., 41, 1469, 218–224, 2010.
Page, S. E., Banks, C., and Rieley, J. O.: Tropical peatlands: dis-
tribution, extent and carbon storage-uncertainties and knowledge
gaps, Peatlands International, 26–27, 2007.
Page, S., Siegert, F., Rieley, J., and Boehm, H.: The amount of car-
bon released from peat and forest fires in Indonesia during 1997,
Nature, 420, 61–65, 2002.
Pivello, V. R.: The Use of Fire in the Cerrado and Amazonian Rain-
forests of Brazil: Past and Present, Fire Ecol., 7, 24–39, 2011.
Prasad, V. K., Gupta, P. K., Sharma, C., Sarkar, A. K., Kant, Y.,
Badarinath, K. V. S., Rajagopal, T., and Mitra, A. P.: NOx emis-
sions from biomass burning of shifting cultivation areas from
tropical deciduous forests of India – estimates from ground-
based measurements, Atmos. Environ., 34, 3271–3280, 2000.
Prasad, V. K., Kant, Y., Gupta, P. K., Sharma, C., Mitra, A. P., and
Badarinath, K. V. S.: Biomass and combustion characteristics of
secondary mixed deciduous forests in Eastern Ghats of India, At-
mos. Environ., 35, 3085–3095, 2001.
Randerson, J. T., Chen, Y., Van Der Werf, G. R., Rogers, B. M.,
and Morton, D. C.: Global burned area and biomass burning
emissions from small fires, J. Geophys. Res., 117, G04012,
doi:10.1029/2012JG002128, 2012.
Ratnam, J., Bond, W. J., Fensham, R. J., Hoffmann, W. A.,
Archibald, S., Lehmann, C. E. R., Anderson, M. T., Higgins, S.
I., and Sankaran, M.: When is a “forest” a savanna, and why does
it matter?, Glob. Ecol. Biogeogr., 20, 653–660, 2011.
Raynolds, M. A., Walker, D. A., and Maier, H. A.: Alaska Arc-
tic Tundra Vegetation Map. Scale 1 : 4000 000, Conservation
of Arctic Flora and Fauna (CAFF) Map No. 2, U.S. Fish and
Wildlife Service, Anchorage, Alaska, http://www.arcticatlas.org/
maps/themes/ak/index, 2006.
Rieley, J. O., Ahmad-Shah, A. A., and Brady, M. A.: Tropical Low-
land Peatlands of Southeast Asia, edited by: Maltby, E., Immirzi,
C. P., and Safford, R. J., IUCN, Gland, Switzerland, 17–53, 1996.
Rieley, J. O., Wüst, R., Jauhiainen, J., Page, S. E., Wösten, H., Hooi-
jer, A., Siegert, F., Limin, S. H., Vasander, H., and Stahlhut, M.:
Tropical peatlands: carbon stores, carbon gas Emissions and con-
tribution to climate change Processes, edited by: Maria Strack,
Peatlands and Climate Change, 2008.
Righi, C. A., de Alencastro Graça, P. M. L., Cerri, C. C., Feigl, B.
J., and Fearnside, P. M.: Biomass burning in Brazil’s Amazonian
“arc of deforestation”: Burning efficiency and charcoal formation
in a fire after mechanized clearing at Feliz Natal, Mato Grosso,
Forest Ecol. Manag., 258, 2535–2546, 2009.
Roberts, G., Wooster, M. J., Freeborn, P. H., and Xu, W.: Integration
of geostationary FRP and polar-orbiter burned area datasets for
an enhanced biomass burning inventory, Remote Sens. Environ.,
115, 2047–2061, 2011.
Rossiter, N. A., Setterfield, S. A., Douglas, M. M., and Hutley, L.
B.: Testing the grass-fire cycle: alien grass invasion in the tropical
savannas of northern Australia, Div. Distribut., 9, 169–176, 2003.
Rossiter-Rachor, N. A., Setterfield, S. A., Douglas, M. M., Hutley,
L. B., and Cook, G. D.: Andropogon gayanus (Gamba Grass)
Invasion Increases Fire-mediated Nitrogen Losses in the Tropical
Savannas of Northern Australia, Ecosystems, 11, 77–88, 2007.
Rossiter-Rachor, N. A., Setterfield, S. A., Douglas, M. M., Hut-
ley, L. B., Cook, G. D., and Schmidt, S.: Invasive Andropogon
gayanus (Gamba Grass) is an ecosystem transformer of nitrogen
relations in Australia’s tropical savanna, Ecol. Appl., 19, 1546–
1560, 2009.
Roy, D. P., Jin, Y., Lewis, P. E., and Justice, C. O.: Prototyping a
global algorithm for systematic fire-affected area mapping using
MODIS time series data, Remote Sens. Environ., 97, 137–162,
2005.
Russell-Smith, J., Yates, C. P., Whitehead, P. J., Smith, R., Craig,
R., Allan, G. E., Thackway, R., Frakes, I., Cridland, S., Meyer,
M. C. P., and Gill, A. M.: Bushfires “down under”: patterns and
implications of contemporary Australian landscape burning, Int.
J. Wildland Fire, 16, 361–377, 2007.
Russell-Smith, J., Murphy, B. P., Meyer, C. P. M., Cook, G. D.,
Maier, S., Edwards, A. C., Schatz, J., and Brocklehurst, P.: Im-
proving estimates of savanna burning emissions for greenhouse
accounting in northern Australia: limitations, challenges, appli-
cations, Int. J. Wildland Fire, 18, 1–18, 2009.
Sah, J. P., Ross, M. S., Snyder, J. R., Koptur, S., and Cooley,
H. C.: Fuel loads, fire regimes, and post-fire fuel dynamics
in Florida Keys pine forests, Int. J. Wildland Fire, 15, 463,
doi:10.1071/WF05100, 2006.
Saharjo, B. H. and Nurhayati, A. D.: Domination and composition
structure change at hemic peat natural regeneration following
burning; a case study in Pelalawan, Riau Province, Biodiversi-
tas, 7, 154–158, 2006.
Sandberg, D. V., Ottmar, R. D., and Cushon, G. H.: International
Journal of Wildland Fire, Int. J. Wildland Fire, 10, 381–387,
2001.
Savadogo, P., Zida, D., Sawadogo, L., Tiveau, D., Tigabu, M. and
Odén, P. C.: Fuel and fire characteristics in savanna–woodland of
www.biogeosciences.net/11/7305/2014/ Biogeosciences, 11, 7305–7329, 2014

7328 T. T. van Leeuwen et al.: Biomass burning fuel consumption rates
West Africa in relation to grazing and dominant grass type, Int.
J. Wildland Fire, 16, 531, doi:10.1071/WF07011, 2007.
Scholes, R. J., Archibald, S., and von Malitz, G.: Emissions from
fire in Sub-Saharan Africa: the magnitude of sources, their vari-
ability and uncertainty, Global Environ. Res., 15, 53–63, 2011.
Schroeder, W., Ellicott, E., Ichoku, C., Ellison, L., Dickinson, M.
B., Ottmar, R. D., Clements, C., Hall, D., Ambrosia, V., and
Kremens, R.: Integrated active fire retrievals and biomass burn-
ing emissions using complementary near-coincident ground, air-
borne and spaceborne sensor data, Remote Sens. Environ., 140,
719–730, 2014.
Seiler, W. and Crutzen, P.: Estimates of gross and net fluxes of car-
bon between the biosphere and the atmosphere from biomass
burning, Clim. Change, 2, 207–247, 1980.
Shea, R. W., Shea, B. W., Kauffman, J. B., Ward, D. E., Haskins,
C. I., and Scholes, M. C.: Fuel biomass and combustion factors
associated with fires in savanna ecosystems of South Africa and
Zambia, J. Geophys. Res.-Atmos., 101, 23551–23568, 1996.
Siegert, F., Ruecker, G., Hinrichs, A., and Hoffmann, A. A.: In-
creased damage from fires in logged forests during droughts
caused by El Niño, Nature, 414, 437–440, 2001.
Soares Neto, T. G., Carvalho Jr., J. A., Veras, C. A. G., Alvarado, E.
C., Gielow, R., Lincoln, E. N., Christian, T. J., Yokelson, R. J.,
and Santos, J. C.: Biomass consumption and CO2, CO and main
hydrocarbon gas emissions in an Amazonian forest clearing fire,
Atmos. Environ., 43, 438–446, 2009.
Soja, A. J.: Estimating fire emissions and disparities in bo-
real Siberia (1998–2002), J. Geophys. Res., 109, D14S06,
doi:10.1029/2004JD004570, 2004.
Sparks, J. C., Masters, R. E., Engle, D. M., and Bukenhofer, G. A.:
Season of burn influences fire behavior and fuel consumption in
restored shortleaf pine–grassland communities, Restorat. Ecol.,
10, 714–722, 2002.
Stephens, S. L. and Finney, M. A.: Prescribed fire mortality of
Sierra Nevada mixed conifer tree species: effects of crown dam-
age and forest floor combustion, Forest Ecol. Manag., 162, 261–
271, 2002.
Stocks, B. J.: Fire behavior in immature jack pine, Can. J. For. Res.,
17, 80–86, 1987a.
Stocks, B. J.: Fire potential in the spruce budworm-damaged forests
of Ontario, Forest. Chron., 63, 8–14, 1987b.
Stocks, B. J.: Fire behavior in mature jack pine, Can. J. For. Res.,
19, 783–790, 1989.
Stocks, B. J., Alexander, M. E., Wotton, B. M., Stefner, C. N., Flan-
nigan, M. D., Taylor, S. W., Lavoie, N., Mason, J. A., Hartley, G.
R., Maffey, M. E., Dalrymple, G. N., Blake, T. W., Cruz, M. G.,
and Lanoville, R. A.: Crown fire behaviour in a northern jack
pine – black spruce forest, Can. J. For. Res., 34, 1548–1560,
2004.
Tomasella, J., Pinho, P. F., Borma, L. S., Marengo, J. A., Nobre, C.
A., Bittencourt, O. R., Prado, M. C. R., Rodriguez, D. A. R., and
Cuartas, L. A.: The Droughts of 1997 and 2005 in Amazonia:
Floodplain Hydrology and Its Potential Ecological and Human
Impacts, Clim. Change, 116, 723–746, 2013.
Smith, A. M. S., Tinkham, W. T., Roy, D. P., Boschetti, L., Kremens,
R. L., Kumar, S. S., Sparks, A. M., and Falkowski, J.: Quantifica-
tion of fuel moisture effects on biomass consumed derived from
fire radiative energy retrievals, Geophys. Res. Lett., 40, 6298–
6302, 2013.
Stockwell, C. E., Yokelson, R. J., Kreidenweis, S. M., Robinson, A.
L., DeMott, P. J., Sullivan, R. C., Reardon, J., Ryan, K. C., Grif-
fith, D. W. T., and Stevens, L.: Trace gas emissions from combus-
tion of peat, crop residue, domestic biofuels, grasses, and other
fuels: configuration and Fourier transform infrared (FTIR) com-
ponent of the fourth Fire Lab at Missoula Experiment (FLAME-
4), Atmos. Chem. Phys., 14, 9727–9754, doi:10.5194/acp-14-
9727-2014, 2014.
Stromgaard, P.: Biomass, growth, and burning of woodland in a
shifting cultivation area of South Central Africa, Forest Ecol.
Manag., 12, 163–178, 1985.
Tarnocai, C., Canadell, J. G., Mazhitova, G., Schuur, E. A. G.,
Kuhry, P., and Zimov, S.: Soil organic carbon stocks in the north-
ern circumpolar permafrost region, Global Biogeochem. Cy., 23,
GB2023, doi:10.1029/2008GB003327, 2009.
Toma, T., Ishida, A., and Matius, P.: Long-term monitoring of post-
fire aboveground biomass recovery in a lowland dipterocarp for-
est in East Kalimantan, Indonesia, Nutr. Cycl. Agroecosyst., 71,
63–72, 2005.
Turetsky, M. R. and Wieder, R. K.: A direct approach to quantifying
organic matter lost as a result of peatland wildfire, Can. J. For.
Res., 31, 363–366, 2001.
Turetsky, M.: Current disturbance and the diminishing
peatland carbon sink, Geophys. Res. Lett, 29, 1526,
doi:10.1029/2001GL014000, 2002.
Turetsky, M. R., Kane, E. S., Harden, J. W., Ottmar, R. D., Ma-
nies, K. L., Hoy, E., and Kasischke, E. S.: Recent acceleration of
biomass burning and carbon losses in Alaskan forests and peat-
lands, Nat. Geosci., 4, 27–31, 2011.
Uhl, C. and Buschbacher, R.: A Disturbing Synergism Between
Cattle Ranch Burning Practices and Selective Tree Harvesting in
the Eastern Amazon, Biotropica, 17, 265, doi:10.2307/2388588,
1985.
United States Environmental Protection Agency (EPA): 2002 Na-
tional Emissions Inventory Booklet. Research Triangle Park,
North Carolina, available at: http://www.epa.gov/ttn/chief/net/
2002neibooklet.pdf, last accessed: 20 November 2008.
Usup, A., Hashimoto, Y., Takahashi, H., and Hayasaka, H.: Com-
bustion and thermal characteristics of peat fire in tropical peat-
land in Central Kalimantan, Indonesia, Tropics, 14, 1–19, 2004.
Vandergert, P. and Newell, J.: Illegal logging in the Russian Far East
and Siberia, Int. Forest. Rev., 5, 303–306, 2003.
van der Werf, G. R., Randerson, J. T., Giglio, L., Collatz, G. J.,
Kasibhatla, P. S., and Arellano Jr., A. F.: Interannual variabil-
ity in global biomass burning emissions from 1997–2004, At-
mos. Chem. Phys., 6, 3423–3441, doi:10.5194/acp-6-3423-2006,
2006.
van der Werf, G. R., Randerson, J. T., Giglio, L., Collatz, G. J., Mu,
M., Kasibhatla, P. S., Morton, D. C., DeFries, R. S., Jin, Y., and
van Leeuwen, T. T.: Global fire emissions and the contribution of
deforestation, savanna, forest, agricultural, and peat fires (1997–
2009), Atmos. Chem. Phys., 10, 11707–11735, doi:10.5194/acp-
10-11707-2010, 2010.
Van Der Werf, G. R., Peters, W., Van Leeuwen, T. T., and Giglio,
L.: What could have caused pre-industrial biomass burning
emissions to exceed current rates?, Clim. Past., 9, 289–306,
doi:10.5194/cp-9-289-2013, 2013.
Van Wagner, C. E.: The Line Intersect Method in Forest Fuel Sam-
pling, For. Sci., 14, 20–26, 1968.
Biogeosciences, 11, 7305–7329, 2014 www.biogeosciences.net/11/7305/2014/
T. T. van Leeuwen et al.: Biomass burning fuel consumption rates 7329
Van Wilgen, B. W., Govender, N., Biggs, H. C., Ntsala, D., and
Funda, X. N.: Response of Savanna Fire Regimes to Chang-
ing Fire-Management Policies in a Large African National Park,
Conservat. Biol., 18, 1533–1540, 2004.
Vermote, E., Ellicott, E., Dubovik, O., Lapyonok, T., Chin, M.,
Giglio, L., and Roberts, G. J.: An approach to estimate global
biomass burning emissions of organic and black carbon from
MODIS fire radiative power, J. Geophys. Res.-Atmos., 114,
D18205, doi:10.1029/2008JD011188, 2009.
Viereck, L. A., Van Cleve, K., and Dyrness, C. T.: Forest ecosystem
distribution in the taiga environment, in: Forest Ecosystems in
the Alaskan Taiga, edited by: Van Cleve, K., Chapin III, F. S.,
Flanagan, P. W., Viereck, L. A., and Dyrness, C. T., Springer-
Verlag, New York, 57, 22–43, 1986.
Ward, D. E., Susott, R. A., Kauffman, J. B., Babbitt, R. E., Cum-
mings, D. L., Dias, B., Holben, B. N., Kaufman, Y. J., Ras-
mussen, R. A., and Setzer, A. W.: Smoke and fire characteristics
for cerrado and deforestation burns in Brazil- BASE-B Experi-
ment, J. Geophys. Res., 97, 14601–14619, 1992.
Ward, D. E., Hao, W. M., Susott, R. A., Babbitt, R. E., Shea, R. W.,
Kauffman, J. B., and Justice, C. O.: Effect of fuel composition on
combustion efficiency and emission factors for African savanna
ecosystems, J. Geophys. Res.-Atmos., 101, 23569–23576, 1996.
Wiedinmyer, C., Akagi, S. K., Yokelson, R. J., Emmons, L. K., Al-
Saadi, J. A., Orlando, J. J., and Soja, A. J.: The Fire INventory
from NCAR (FINN): a high resolution global model to estimate
the emissions from open burning, Geosci. Model Dev., 4, 625–
641, doi:10.5194/gmd-4-625-2011, 2011.
Wooster, M. J., Zhukov, B., and Oertel, D.: Fire radiative energy for
quantitative study of biomass burning: derivation from the BIRD
experimental satellite and comparison to MODIS fire products,
Remote Sens. Environ., 86, 83–107, 2003.
Wooster, M.: Boreal forest fires burn less intensely in Rus-
sia than in North America, Geophys. Res. Lett., 31, L20505,
doi:10.1029/2004GL020805, 2004.
Wooster, M. J., Roberts, G., and Perry, G. L. W.: Retrieval of
biomass combustion rates and totals from fire radiative power ob-
servations: FRP derivation and calibration relationships between
biomass consumption and fire radiative energy release, J. Geo-
phys. Res., 110, D24311, doi:10.1029/2005JD006318, 2005.
Yang, S., He, H., Lu, S., Chen, D., and Zhu, J.: Quantification of
crop residue burning in the field and its influence on ambient air
quality in Suqian, China, Atmos. Environ., 42, 1961–1969, 2008.
Yevich, R. and Logan, J. A.: An assessment of biofuel use and burn-
ing of agricultural waste in the developing world, Global Bio-
geochem. Cy., 4, 1095, doi:10.1029/2002GB001952, 2003.
Yokelson, R. J., Karl, T., Artaxo, P., Blake, D. R., Christian, T. J.,
Griffith, D. W. T., Guenther, A., and Hao, W. M.: The Trop-
ical Forest and Fire Emissions Experiment: overview and air-
borne fire emission factor measurements, Atmos. Chem. Phys.,
7, 5175–5196, doi:10.5194/acp-7-5175-2007, 2007a.
Yokelson, R. J., Urbanski, S. P., Atlas, E. L., Toohey, D. W., Al-
varado, E. C., Crounse, J. D., Wennberg, P. O., Fisher, M. E.,
Wold, C. E., Campos, T. L., Adachi, K., Buseck, P. R., and
Hao, W. M.: Emissions from forest fires near Mexico City, At-
mos. Chem. Phys., 7, 5569–5584, doi:10.5194/acp-7-5569-2007,
2007b.
Yokelson, R. J., Burling, I. R., Gilman, J. B., Warneke, C., Stock-
well, C. E., de Gouw, J., Akagi, S. K., Urbanski, S. P., Veres,
P., Roberts, J. M., Kuster, W. C., Reardon, J., Griffith, D. W. T.,
Johnson, T. J., Hosseini, S., Miller, J. W., Cocker III, D. R., Jung,
H., and Weise, D. R.: Coupling field and laboratory measure-
ments to estimate the emission factors of identified and uniden-
tified trace gases for prescribed fires, Atmos. Chem. Phys., 13,
89–116, doi:10.5194/acp-13-89-2013, 2013.
Zoltai, S. C., Morrissey, L. A., Livingston, G. P., and Groot, W.
J.: Effects of fires on carbon cycling in North American boreal
peatlands, Environ. Rev., 6, 13–24, 1998.
www.biogeosciences.net/11/7305/2014/ Biogeosciences, 11, 7305–7329, 2014
Recommended


