Embed Size (px)
Citation preview

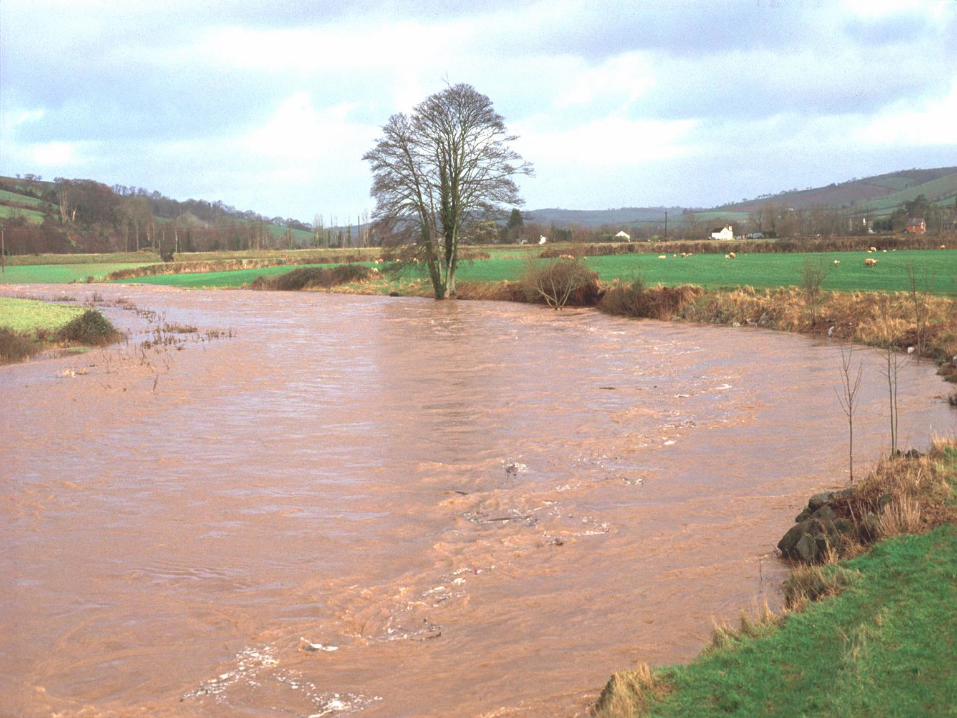
OVERVIEW OF FINE SEDIMENT
RESEARCH – THE LAST 40 YEARS
DES WALLING
College of Life and Environmental Sciences
Workshop on Sediment Fluxes in Irish Rivers, UCD, Dublin, September 28, 2014
System Behaviour cf Modelling
A Personal View

The Department of Geography,
University of Exeter,1968
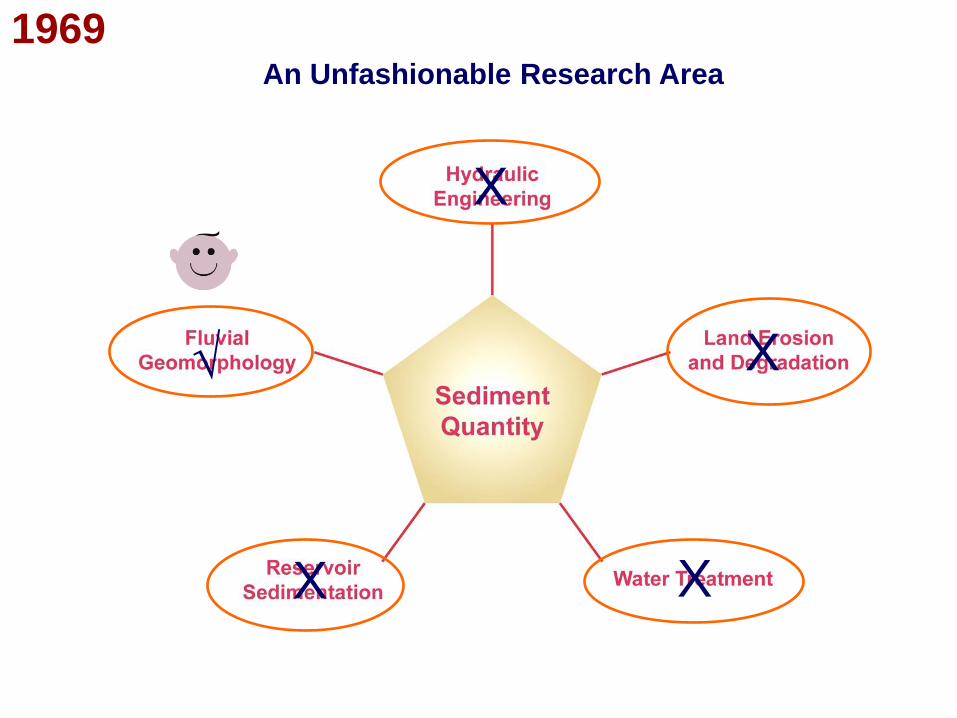
1969
An Unfashionable Research Area
X
X X
X
√
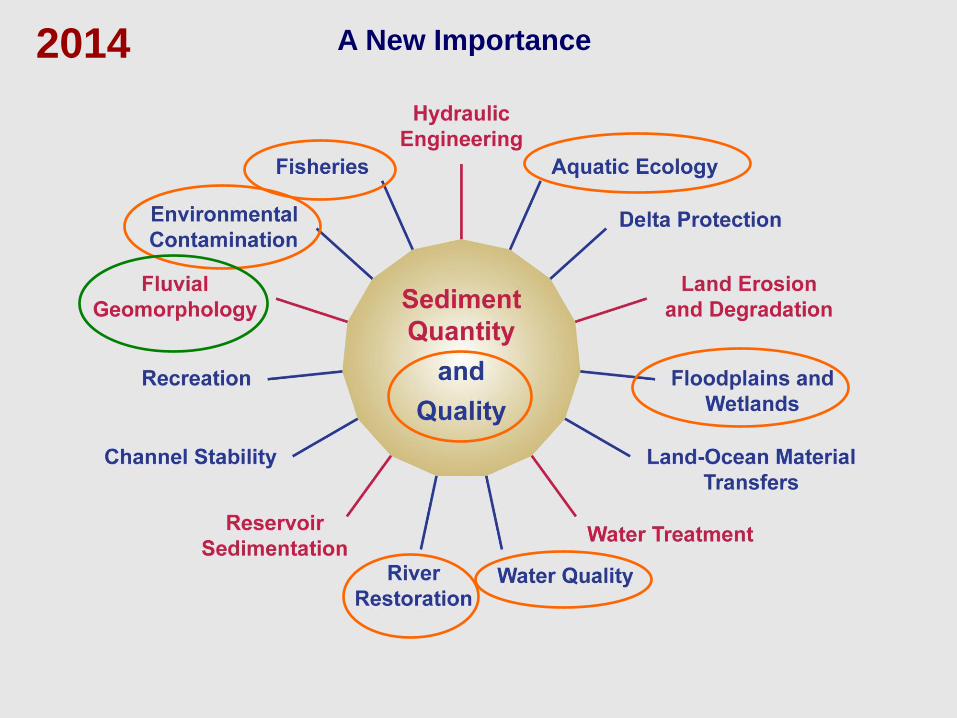
A New Importance 2014
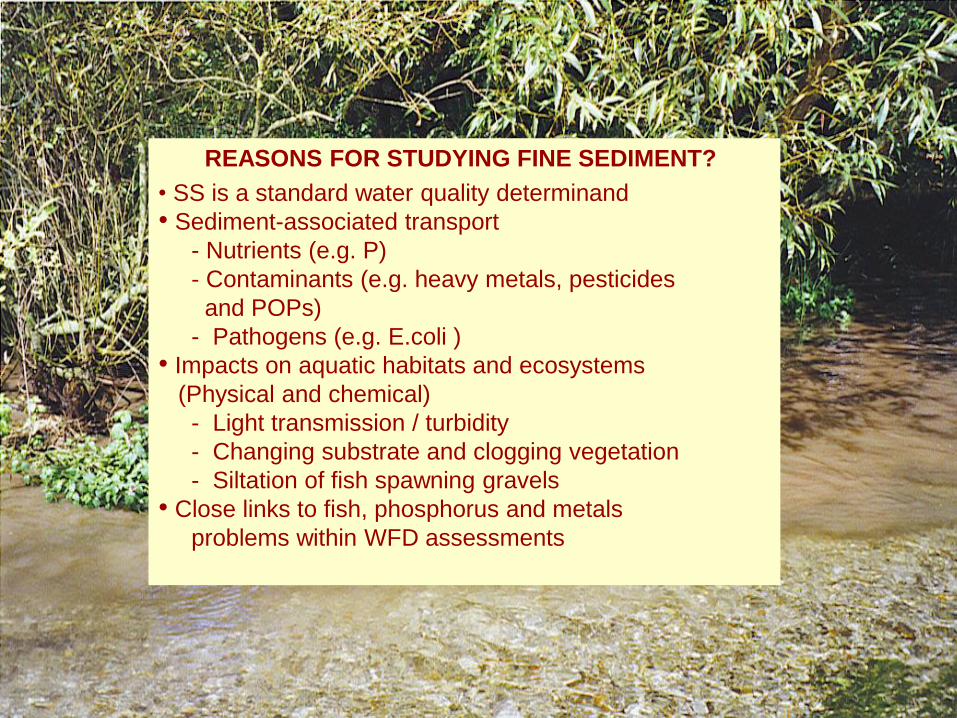
REASONS FOR STUDYING FINE SEDIMENT?
• SS is a standard water quality determinand
• Sediment-associated transport
- Nutrients (e.g. P)
- Contaminants (e.g. heavy metals, pesticides
and POPs)
- Pathogens (e.g. E.coli )
• Impacts on aquatic habitats and ecosystems
(Physical and chemical)
- Light transmission / turbidity
- Changing substrate and clogging vegetation
- Siltation of fish spawning gravels
• Close links to fish, phosphorus and metals
problems within WFD assessments

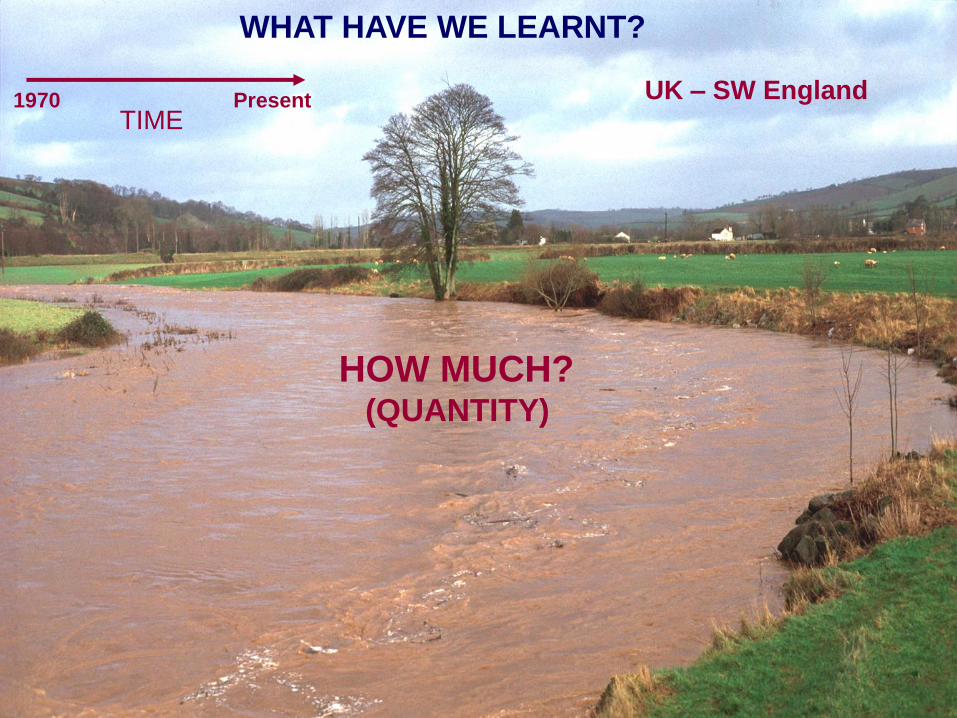
HOW MUCH? (QUANTITY)
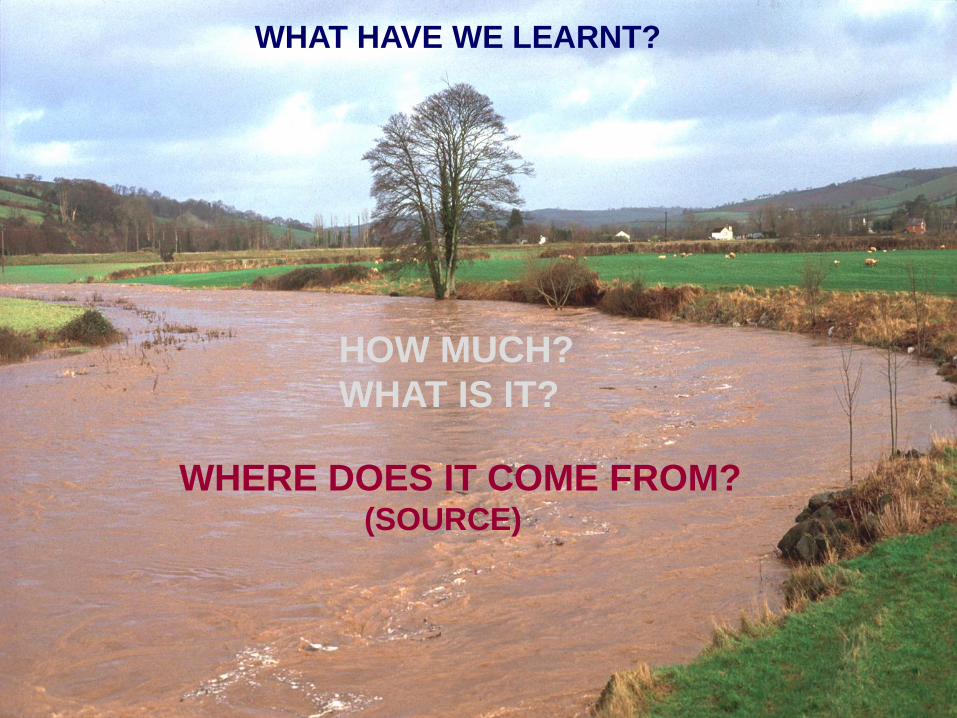
WHAT HAVE WE LEARNT?
1970 Present TIME
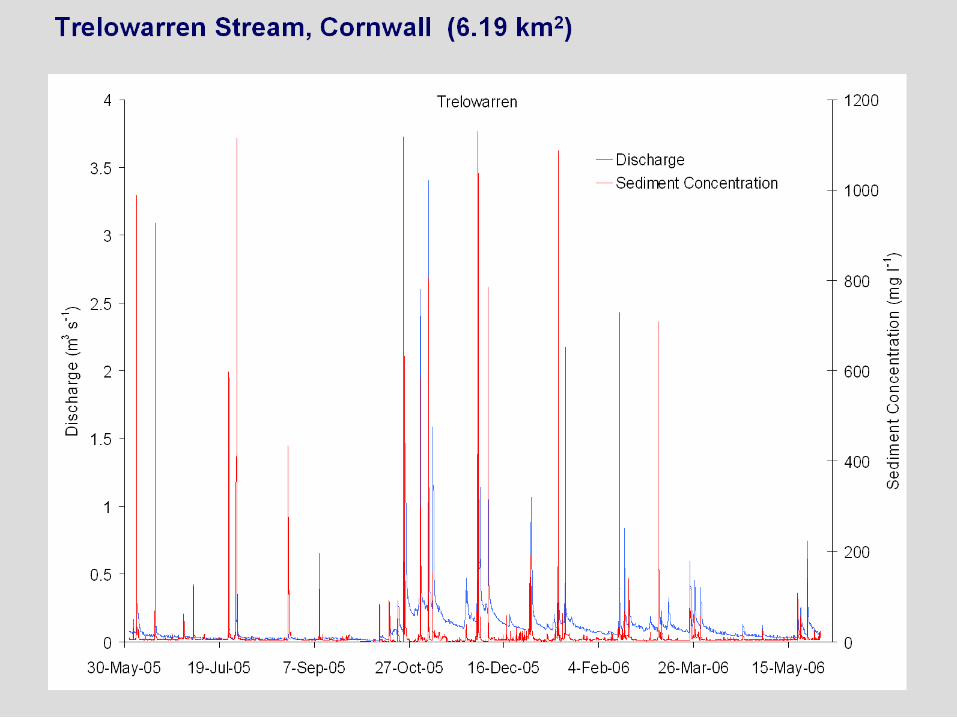
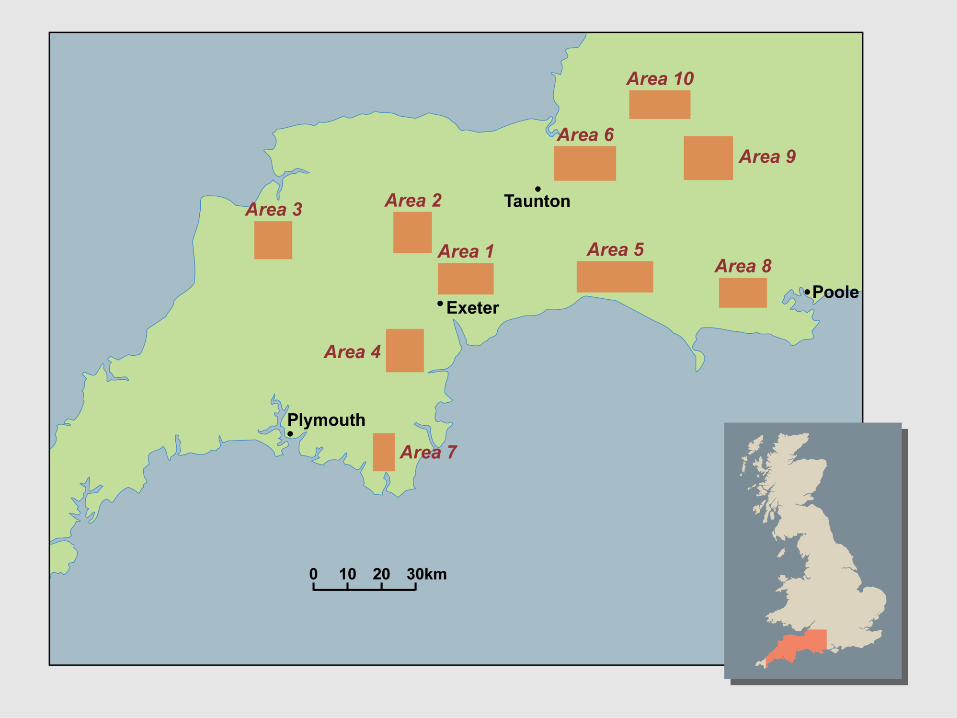
UK – SW England
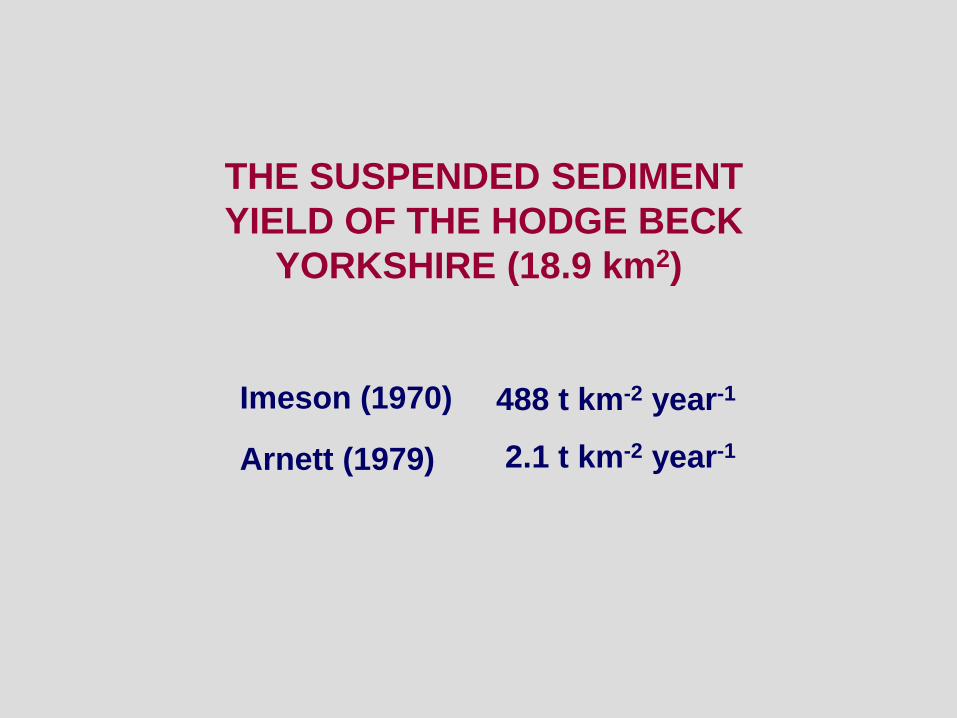
THE SUSPENDED SEDIMENT
YIELD OF THE HODGE BECK
YORKSHIRE (18.9 km2)
Imeson (1970) Arnett (1979)
488 t km-2 year-1
2.1 t km-2 year-1
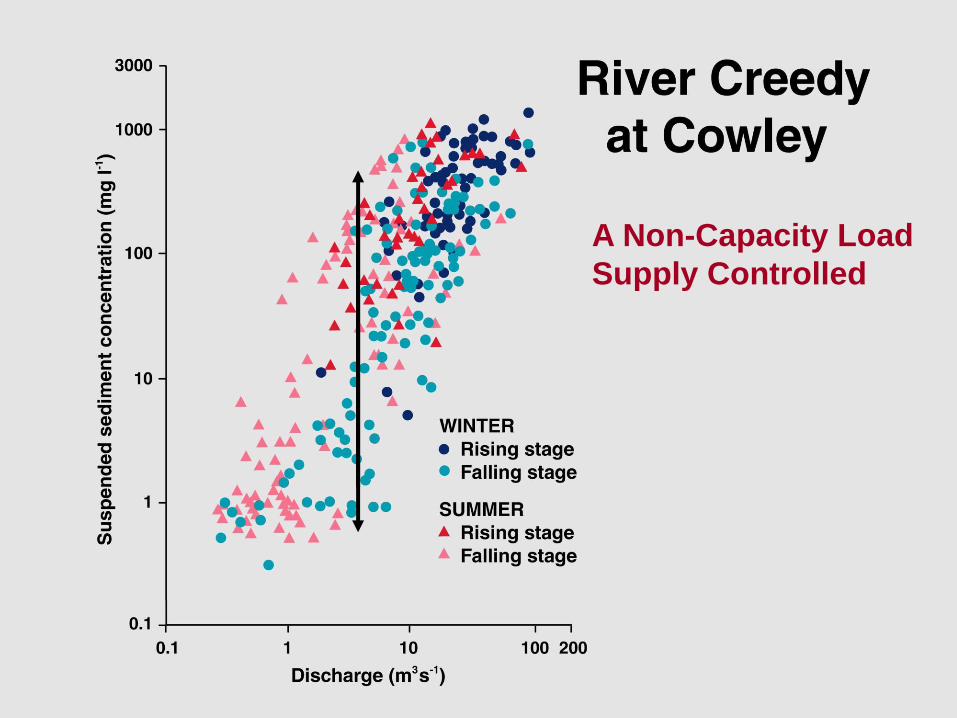
A Non-Capacity Load
Supply Controlled
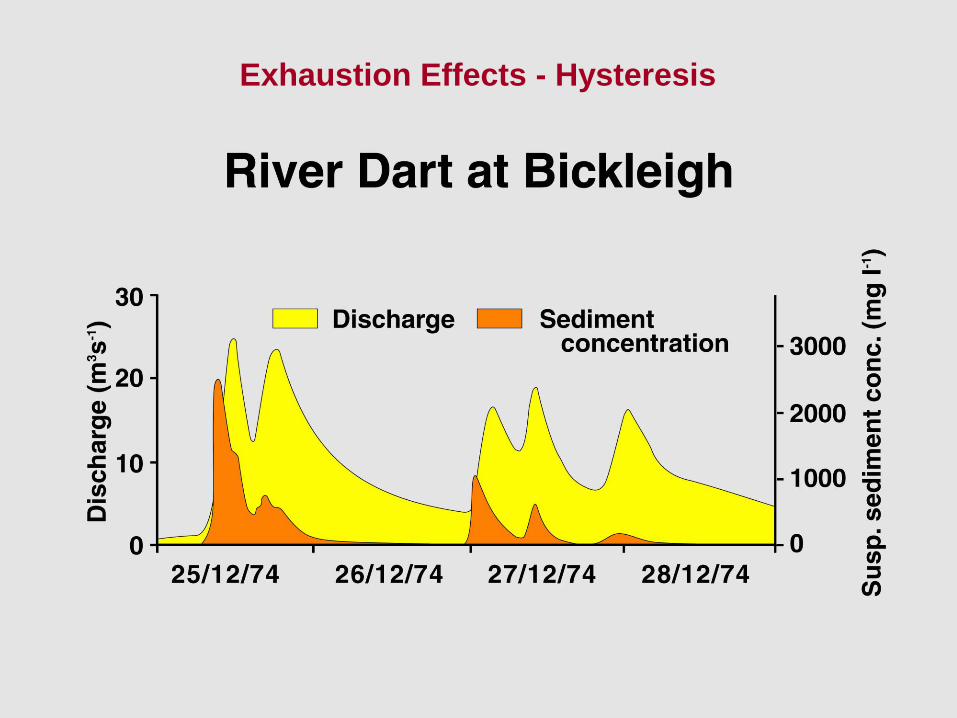
Exhaustion Effects - Hysteresis
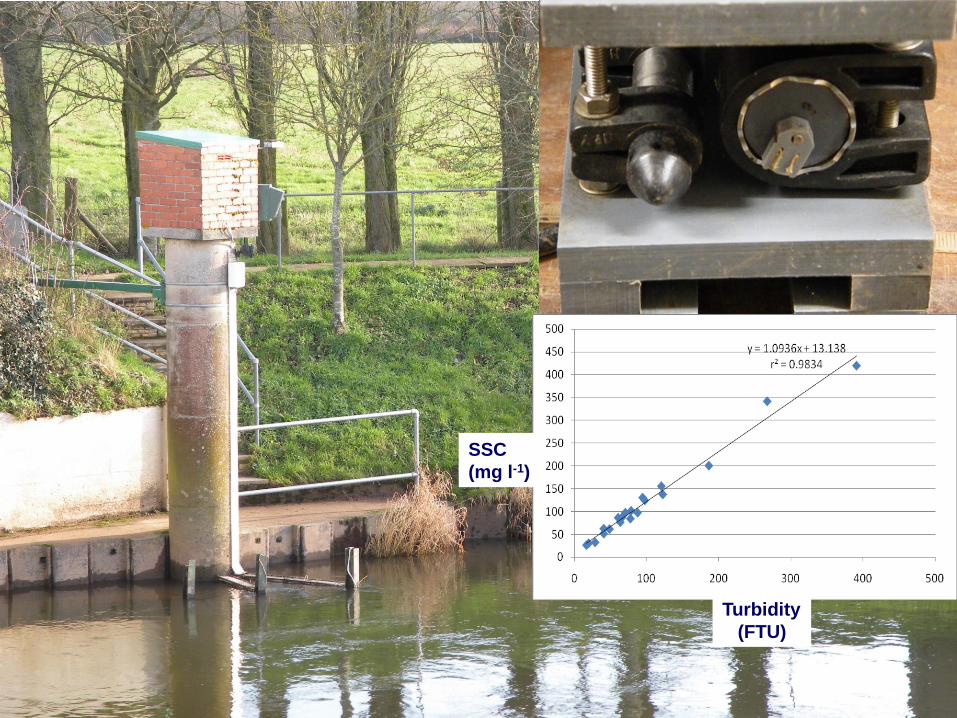
SSC
(mg l-1)
Turbidity
(FTU)
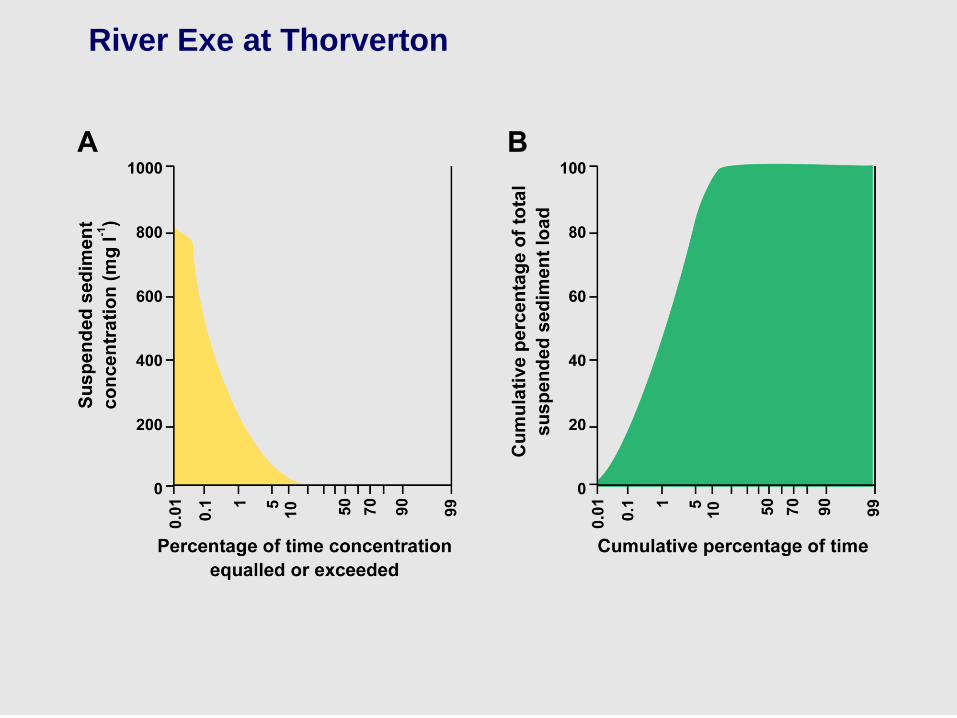
River Exe at Thorverton
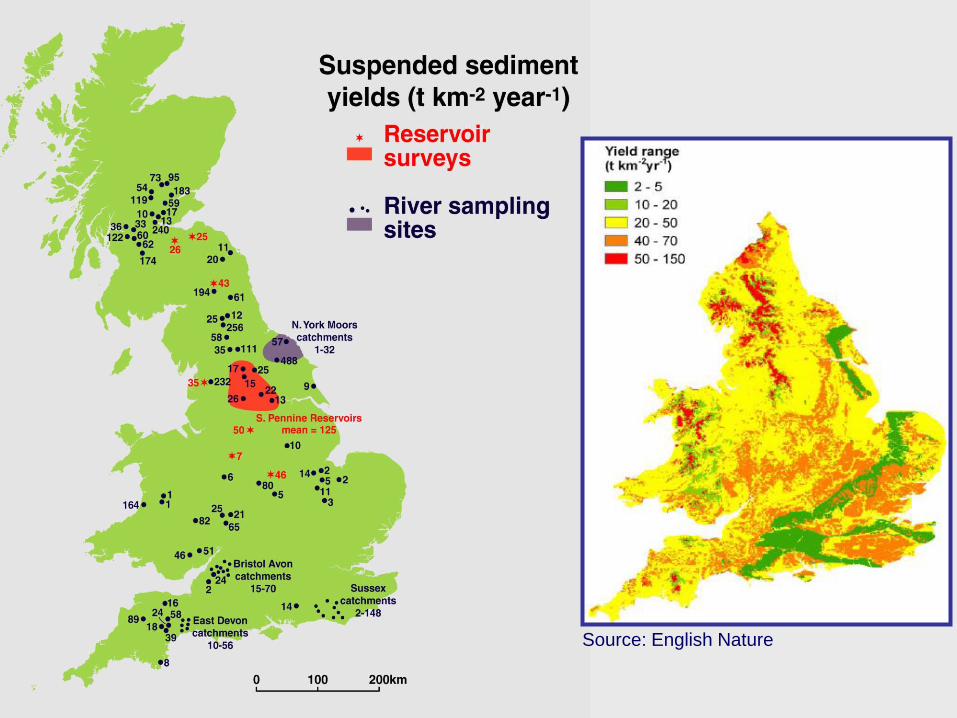
Source: English Nature
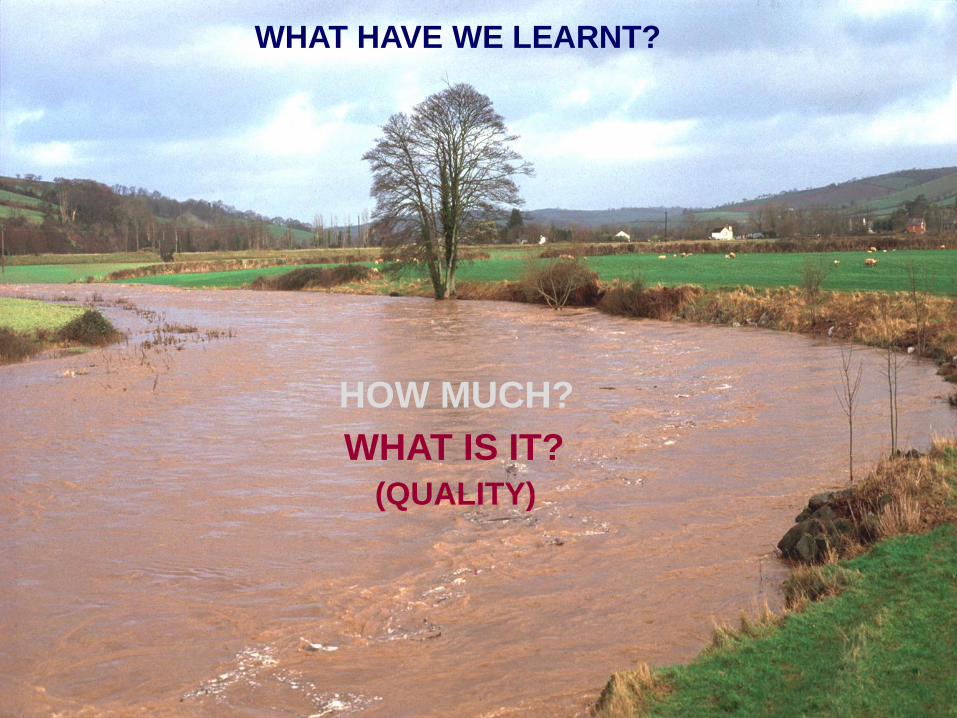
HOW MUCH?
WHAT HAVE WE LEARNT?
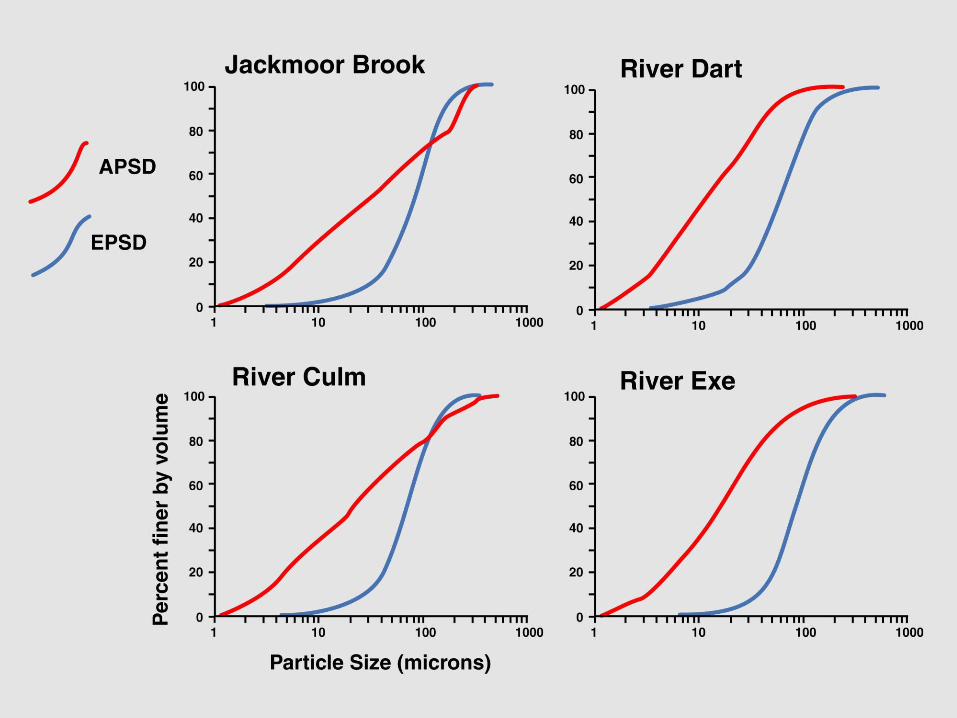
WHAT IS IT?
(QUALITY)
100 µm1.201F
0.705SfW
0.700Sf
0.942R
0.993PR
0.767SfC
0.713E
0.645FR
40.37PCr
36.55PC
39.91P
103.39AC
82.77A
13.88Fmax
9.45Fint
8.66Fmin
9.60DA
1.201F
0.705SfW
0.700Sf
0.942R
0.993PR
0.767SfC
0.713E
0.645FR
40.37PCr
36.55PC
39.91P
103.39AC
82.77A
13.88Fmax
9.45Fint
8.66Fmin
9.60DA
100 µm 1.250F
0.695SfW
0.621Sf
0.893R
0.942PR
0.754SfC
0.702E
0.634FR
82.20PCr
71.09PC
85.05P
483.50AC
372.43A
27.13Fmax
18.37Fint
16.71Fmin
18.26DA
1.250F
0.695SfW
0.621Sf
0.893R
0.942PR
0.754SfC
0.702E
0.634FR
82.20PCr
71.09PC
85.05P
483.50AC
372.43A
27.13Fmax
18.37Fint
16.71Fmin
18.26DA
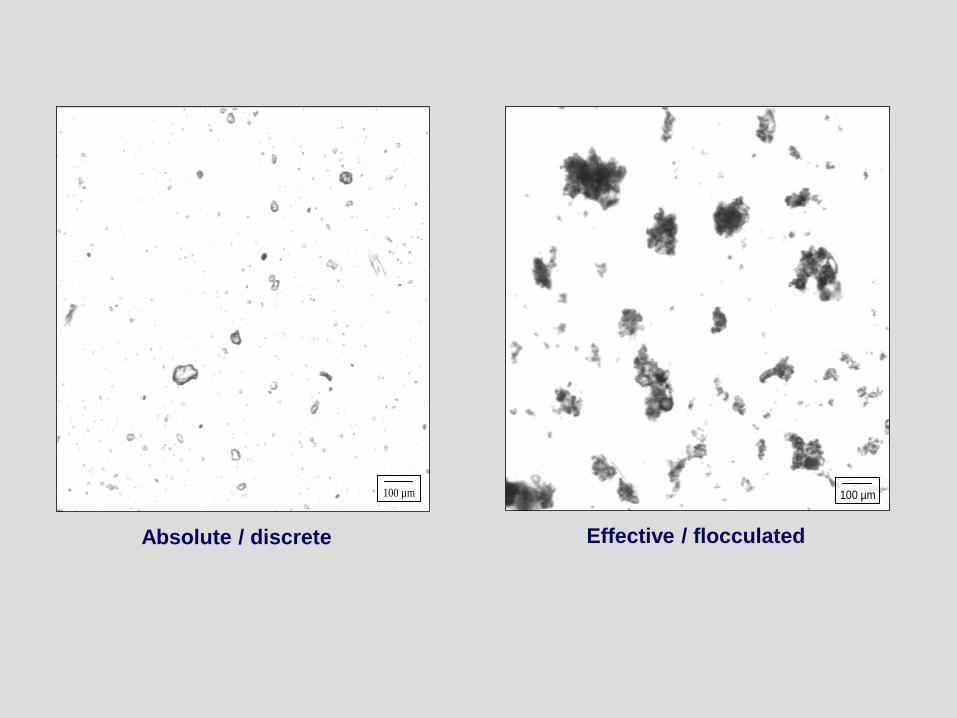
Absolute / discrete Effective / flocculated
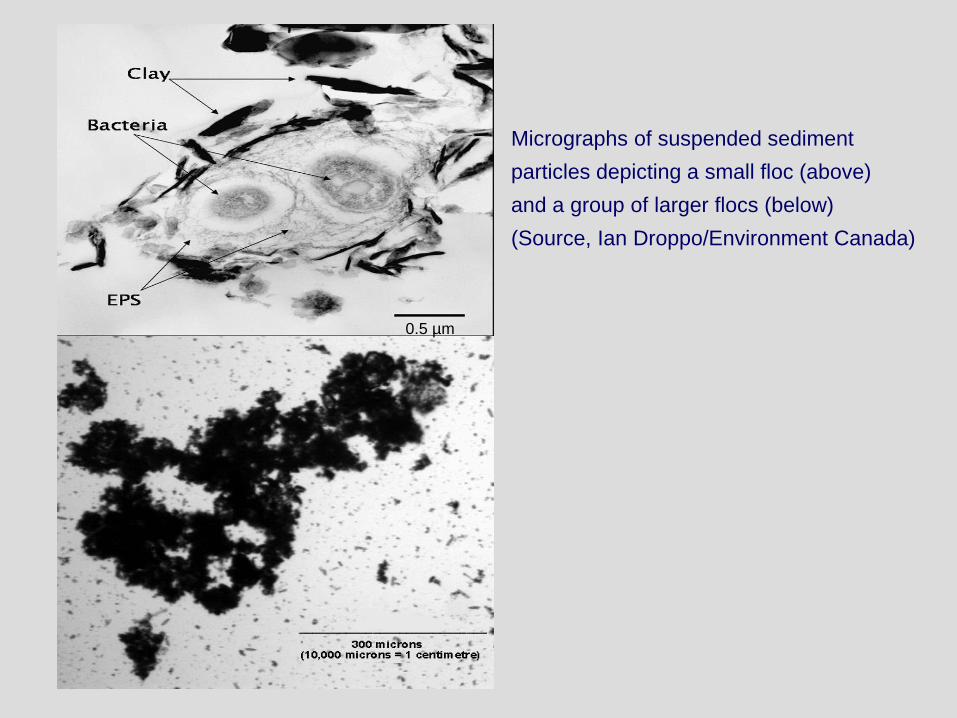
Micrographs of suspended sediment
Micrographs of suspended sediment
particles depicting a small floc (above)
and a group of larger flocs (below)
(Source, Ian Droppo/Environment Canada)
0.5 µm
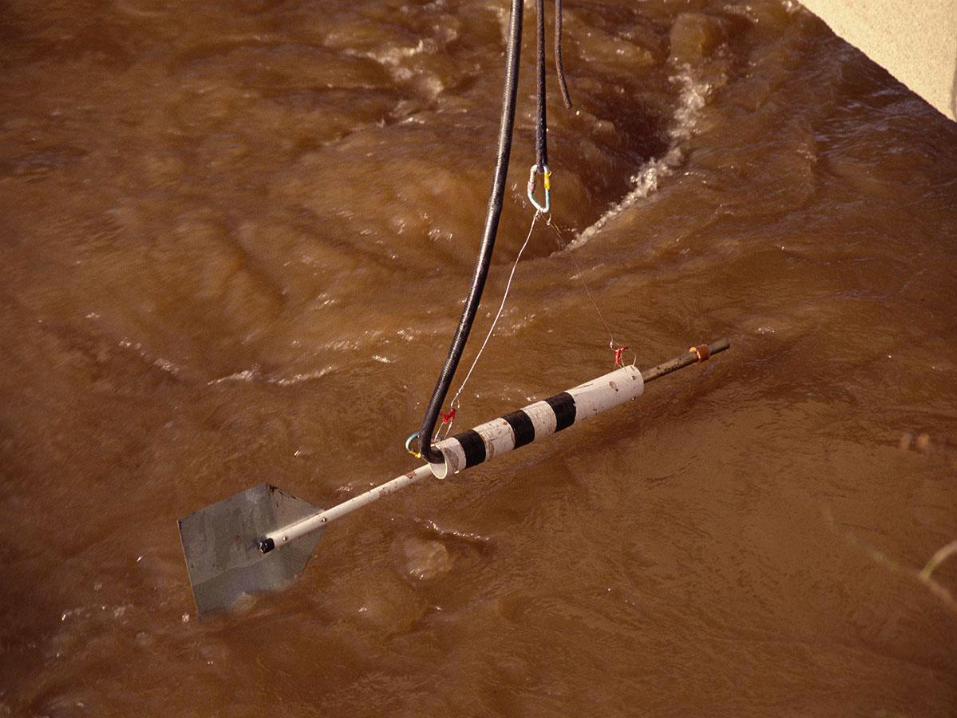
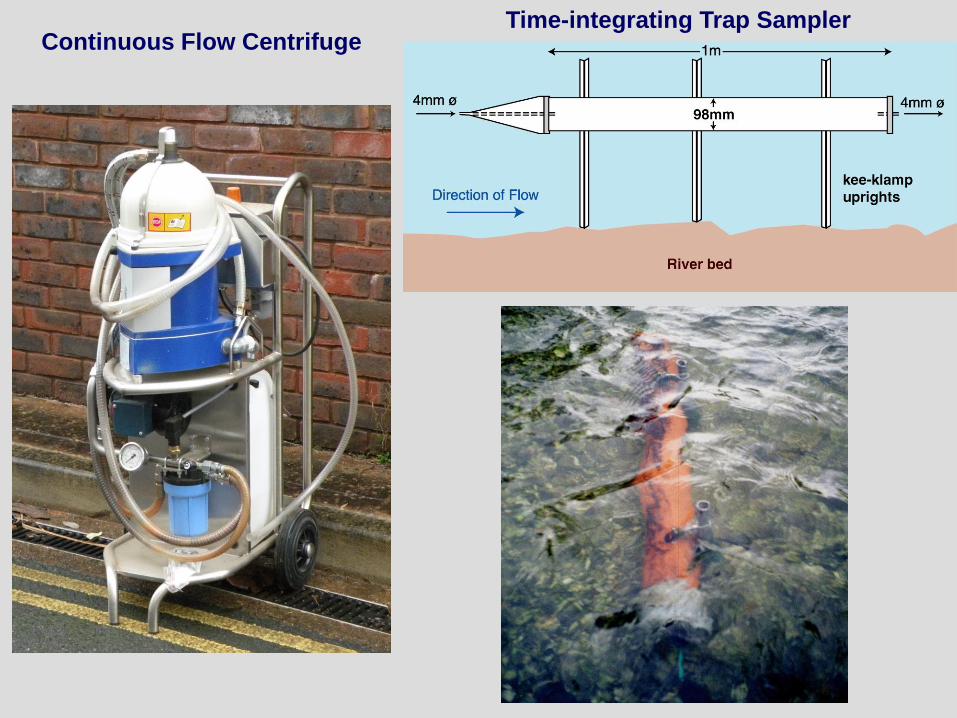
Continuous Flow Centrifuge Time-integrating Trap Sampler
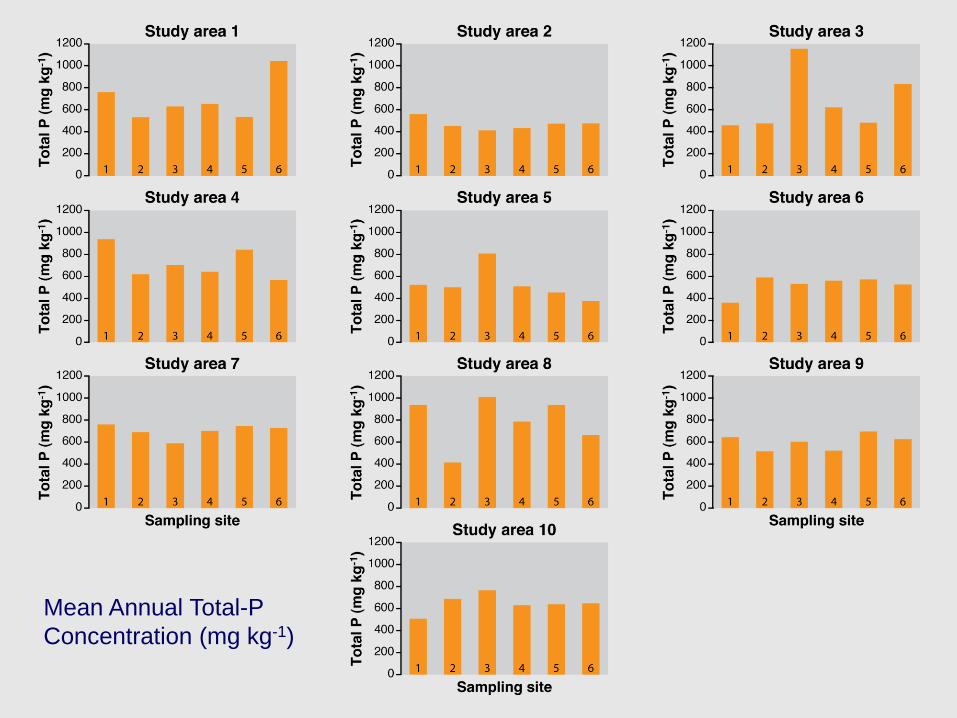
Mean Annual Total-P
Concentration (mg kg-1)
HOW MUCH?
WHAT IS IT?
WHAT HAVE WE LEARNT?
WHERE DOES IT COME FROM?
(SOURCE)

C
O
M
P
A
R
E
Source A
Source D
Source C
Source B
SEDIMENT SOURCE FINGERPRINTING
Sediment
Properties
Source Material
Properties
Composite Fingerprints
Testing Source Discrimination
Multicomponent Mixing Models – goodness of fit
Particle size effects (Selectivity)
Incorporating Uncertainty into the final result
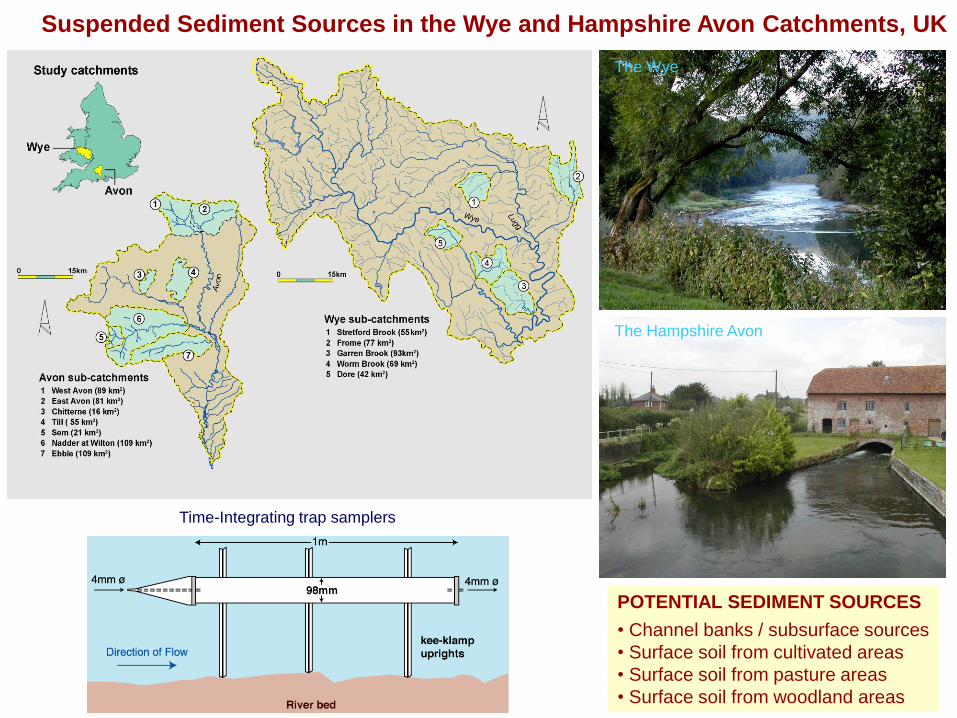
POTENTIAL SEDIMENT SOURCES
• Channel banks / subsurface sources
• Surface soil from cultivated areas
• Surface soil from pasture areas
• Surface soil from woodland areas
Time-Integrating trap samplers
Suspended Sediment Sources in the Wye and Hampshire Avon Catchments, UK
The Wye
The Hampshire Avon
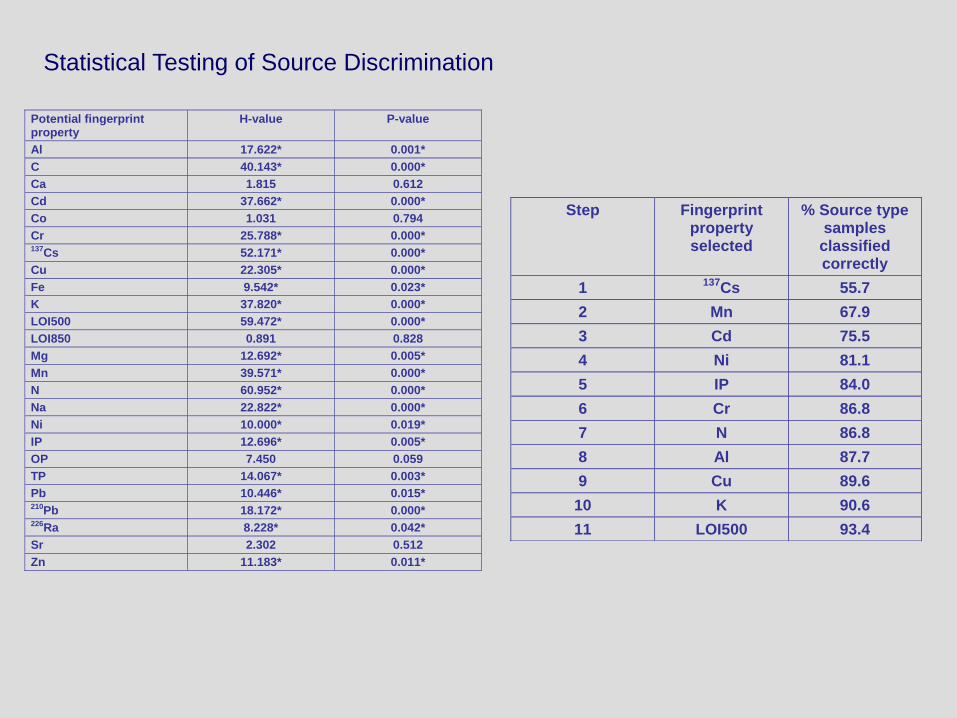
Potential fingerprint property
H-value P-value
Al 17.622* 0.001*
C 40.143* 0.000*
Ca 1.815 0.612
Cd 37.662* 0.000*
Co 1.031 0.794
Cr 25.788* 0.000* 137Cs 52.171* 0.000*
Cu 22.305* 0.000*
Fe 9.542* 0.023*
K 37.820* 0.000*
LOI500 59.472* 0.000*
LOI850 0.891 0.828
Mg 12.692* 0.005*
Mn 39.571* 0.000*
N 60.952* 0.000*
Na 22.822* 0.000*
Ni 10.000* 0.019*
IP 12.696* 0.005*
OP 7.450 0.059
TP 14.067* 0.003*
Pb 10.446* 0.015* 210Pb 18.172* 0.000* 226Ra 8.228* 0.042*
Sr 2.302 0.512
Zn 11.183* 0.011*
Step Fingerprint property selected
% Source type samples
classified correctly
1 137
Cs 55.7
2 Mn 67.9
3 Cd 75.5
4 Ni 81.1
5 IP 84.0
6 Cr 86.8
7 N 86.8
8 Al 87.7
9 Cu 89.6
10 K 90.6
11 LOI500 93.4
Statistical Testing of Source Discrimination

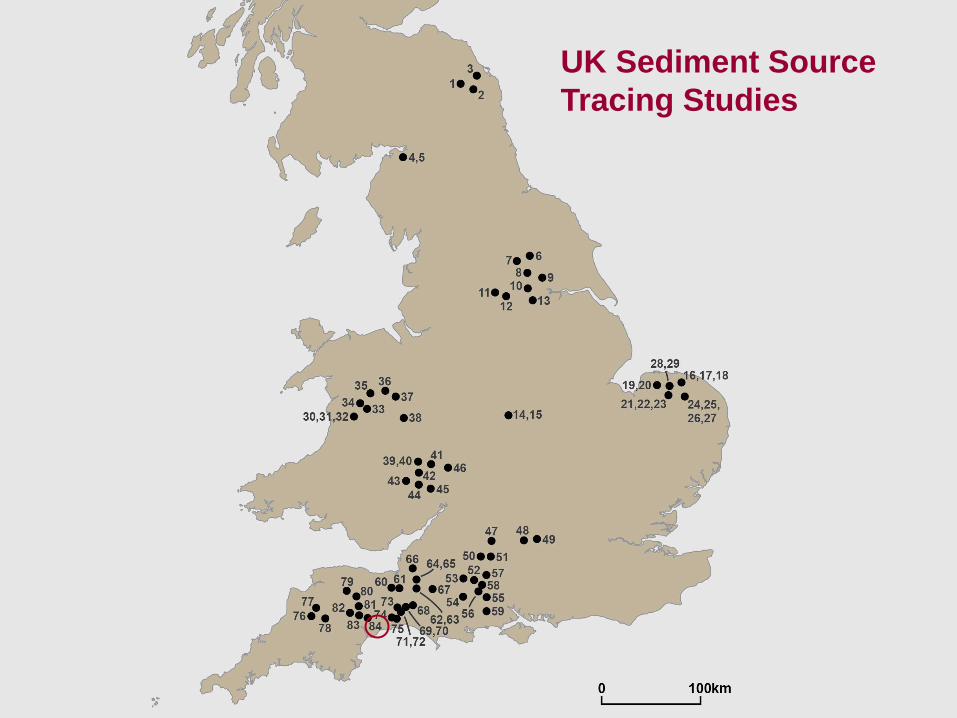
UK Sediment Source
Tracing Studies
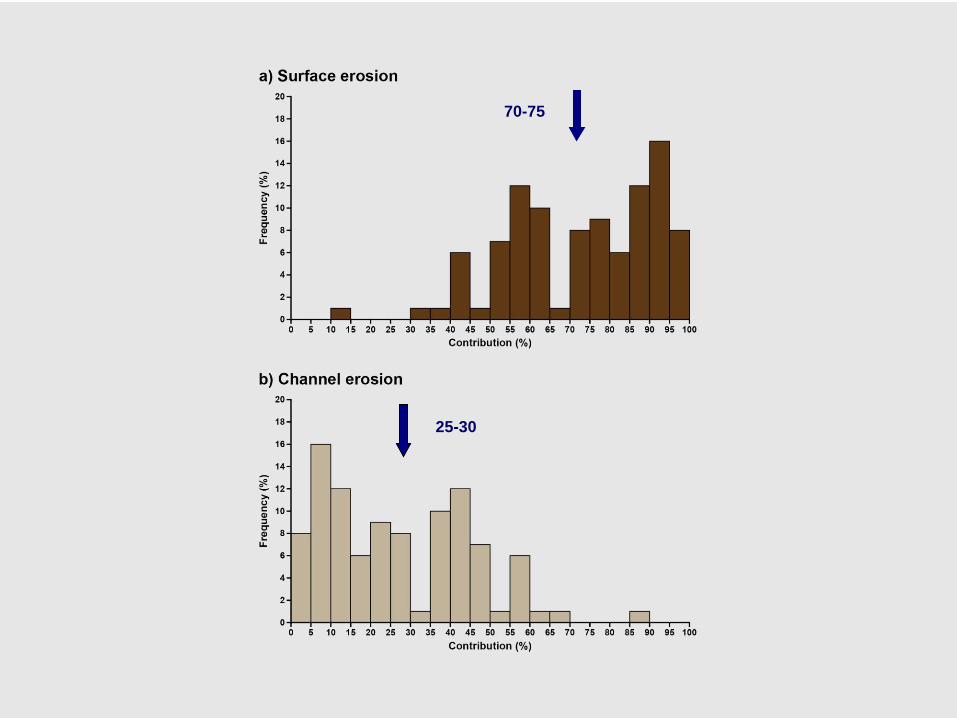
70-75
25-30
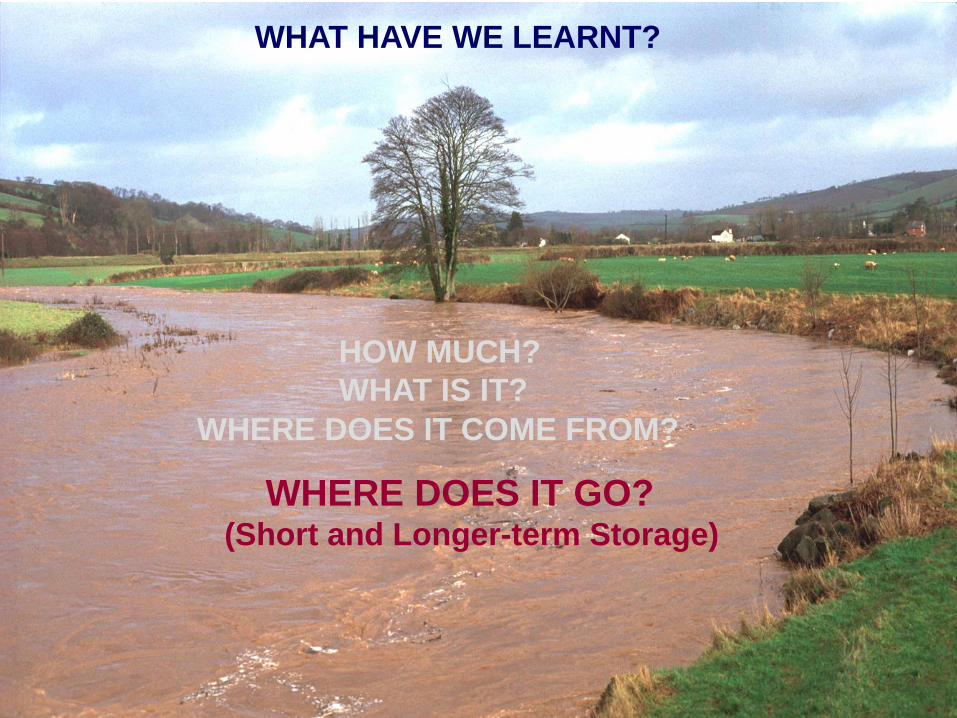
HOW MUCH?
WHAT IS IT?
WHAT HAVE WE LEARNT?
WHERE DOES IT COME FROM?
WHERE DOES IT GO? (Short and Longer-term Storage)
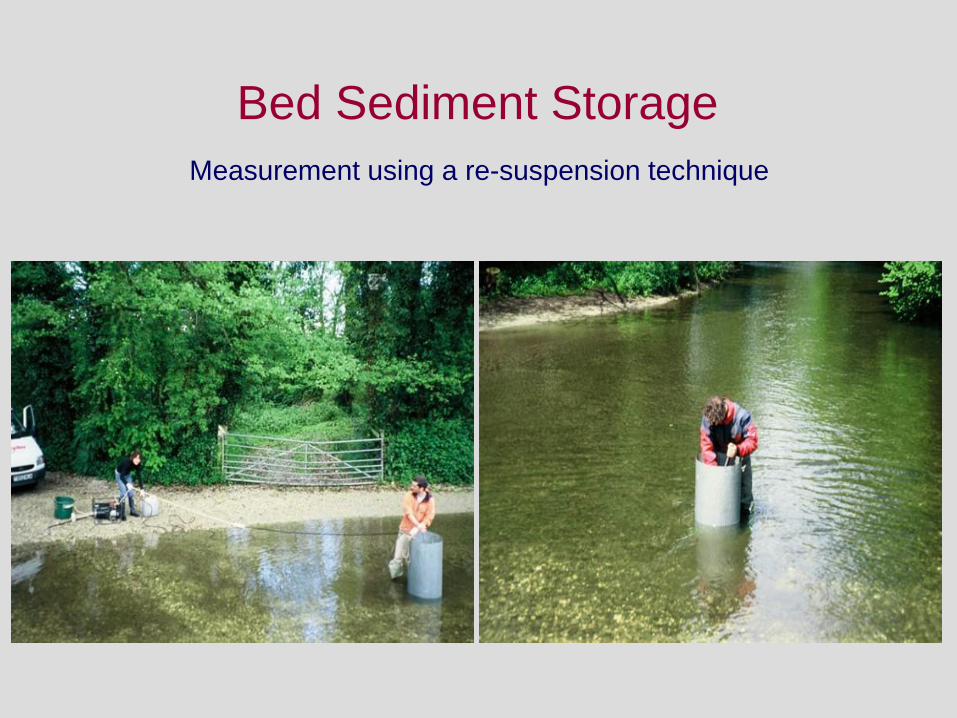
Bed Sediment Storage
Measurement using a re-suspension technique

Channel Storage of Fine Sediment in English Groundwater Fed River Systems
(LOCAR)
• Three rivers
• Periodic measurements at selected sampling points – estimate Δ storage
• Extrapolate to entire catchment
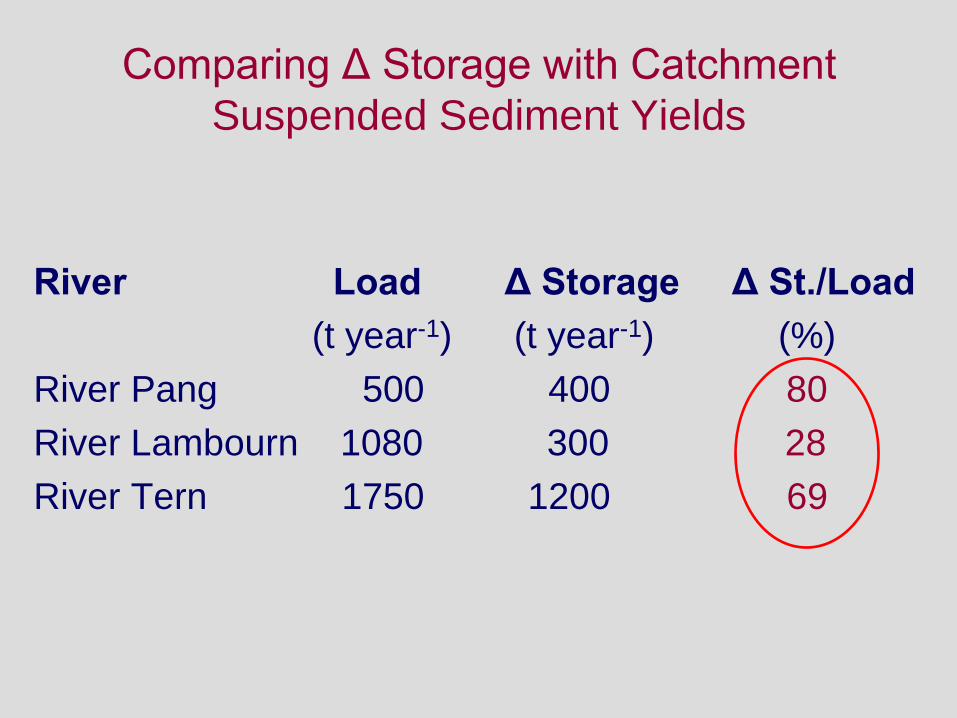
Comparing Δ Storage with Catchment
Suspended Sediment Yields
River Load Δ Storage Δ St./Load
(t year-1) (t year-1) (%)
River Pang 500 400 80
River Lambourn 1080 300 28
River Tern 1750 1200 69
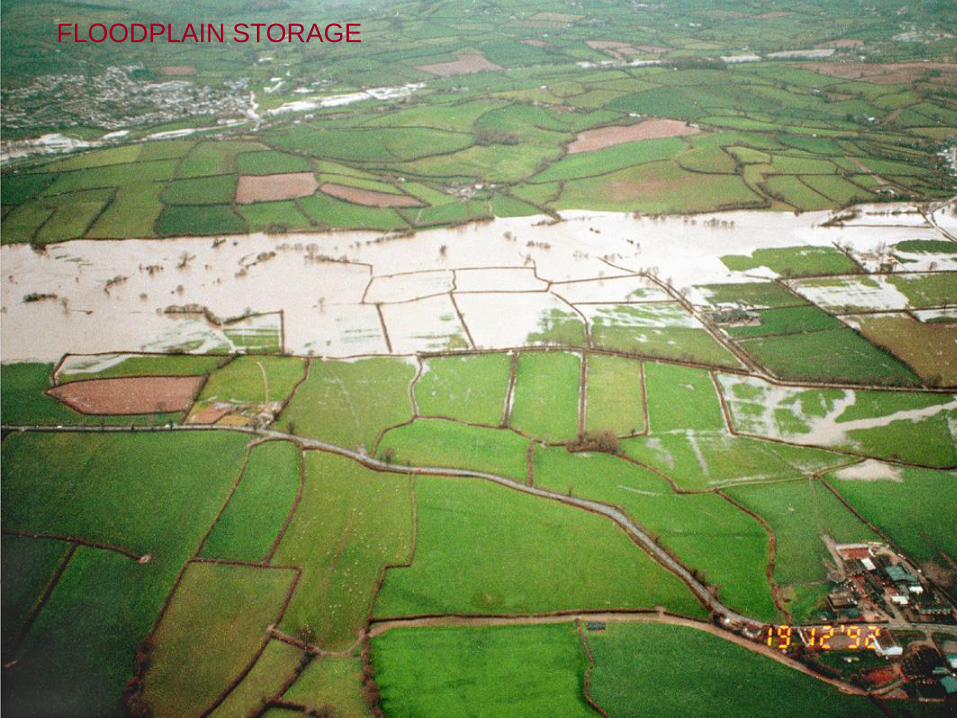
FLOODPLAIN STORAGE
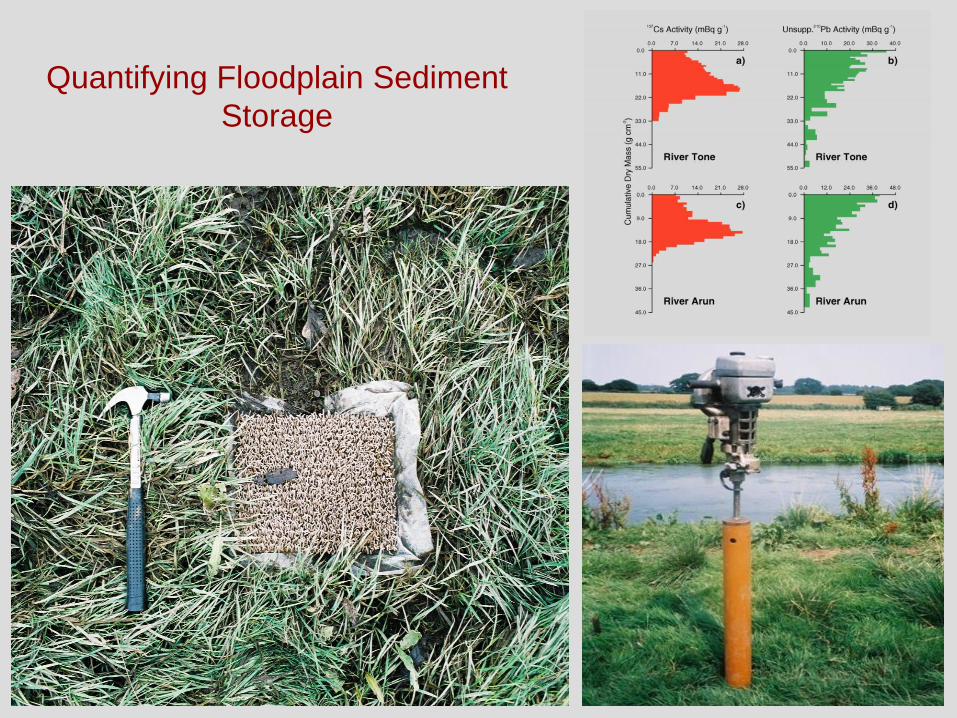
Quantifying Floodplain Sediment
Storage
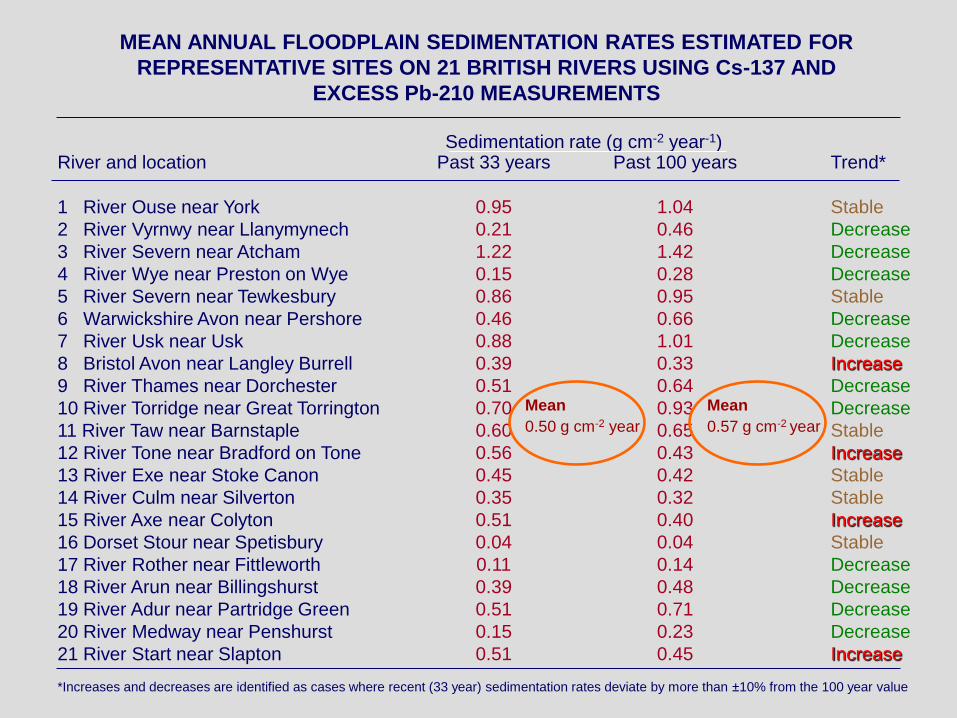
MEAN ANNUAL FLOODPLAIN SEDIMENTATION RATES ESTIMATED FOR
REPRESENTATIVE SITES ON 21 BRITISH RIVERS USING Cs-137 AND
EXCESS Pb-210 MEASUREMENTS
River and location
1 River Ouse near York
2 River Vyrnwy near Llanymynech
3 River Severn near Atcham
4 River Wye near Preston on Wye
5 River Severn near Tewkesbury
6 Warwickshire Avon near Pershore
7 River Usk near Usk
8 Bristol Avon near Langley Burrell
9 River Thames near Dorchester
10 River Torridge near Great Torrington
11 River Taw near Barnstaple
12 River Tone near Bradford on Tone
13 River Exe near Stoke Canon
14 River Culm near Silverton
15 River Axe near Colyton
16 Dorset Stour near Spetisbury
17 River Rother near Fittleworth
18 River Arun near Billingshurst
19 River Adur near Partridge Green
20 River Medway near Penshurst
21 River Start near Slapton
Past 33 years
0.95
0.21
1.22
0.15
0.86
0.46
0.88
0.39
0.51
0.70
0.60
0.56
0.45
0.35
0.51
0.04
0.11
0.39
0.51
0.15
0.51
Sedimentation rate (g cm-2 year-1) Past 100 years
1.04
0.46
1.42
0.28
0.95
0.66
1.01
0.33
0.64
0.93
0.65
0.43
0.42
0.32
0.40
0.04
0.14
0.48
0.71
0.23
0.45
Trend*
Stable
Decrease
Decrease
Decrease
Stable
Decrease
Decrease
Increase
Decrease
Decrease
Stable
Increase
Stable
Stable
Increase
Stable
Decrease
Decrease
Decrease
Decrease
Increase
*Increases and decreases are identified as cases where recent (33 year) sedimentation rates deviate by more than ±10% from the 100 year value
Mean
0.50 g cm-2 year Mean
0.57 g cm-2 year
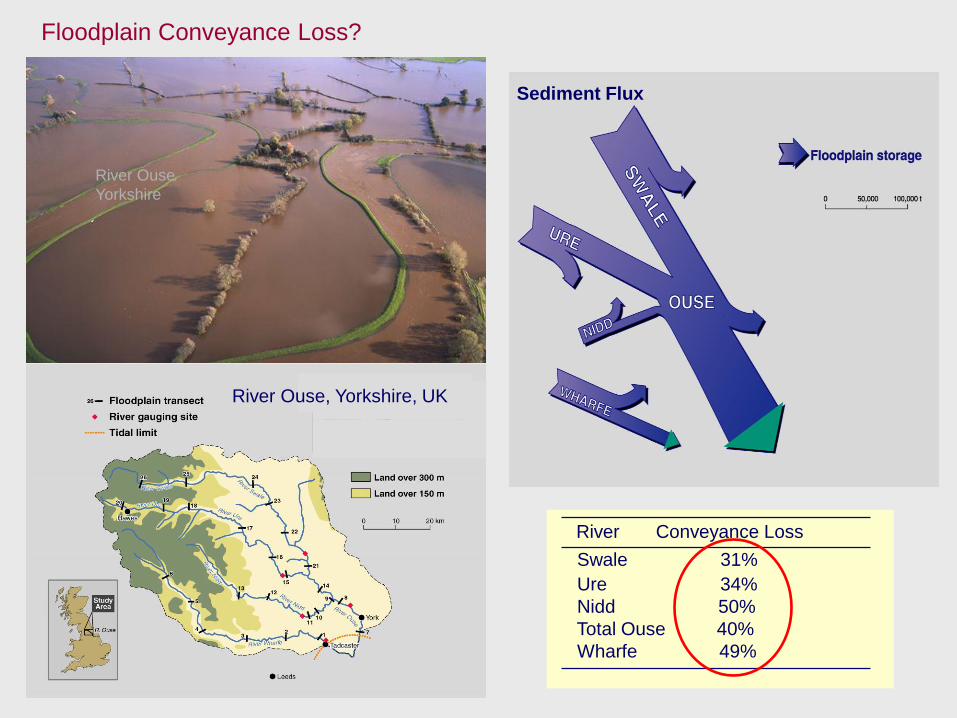
River Ouse, Yorkshire, UK
River Conveyance Loss
Swale 31%
Ure 34%
Nidd 50%
Total Ouse 40%
Wharfe 49%
Floodplain Conveyance Loss?
River Ouse
Yorkshire
Sediment Flux

HOW MUCH?
WHAT IS IT?
WHAT HAVE WE LEARNT?
WHERE DOES IT COME FROM?
WHERE DOES IT GO?
(STORAGE)
THE SEDIMENT BUDGET
AS A MANAGEMENT TOOL
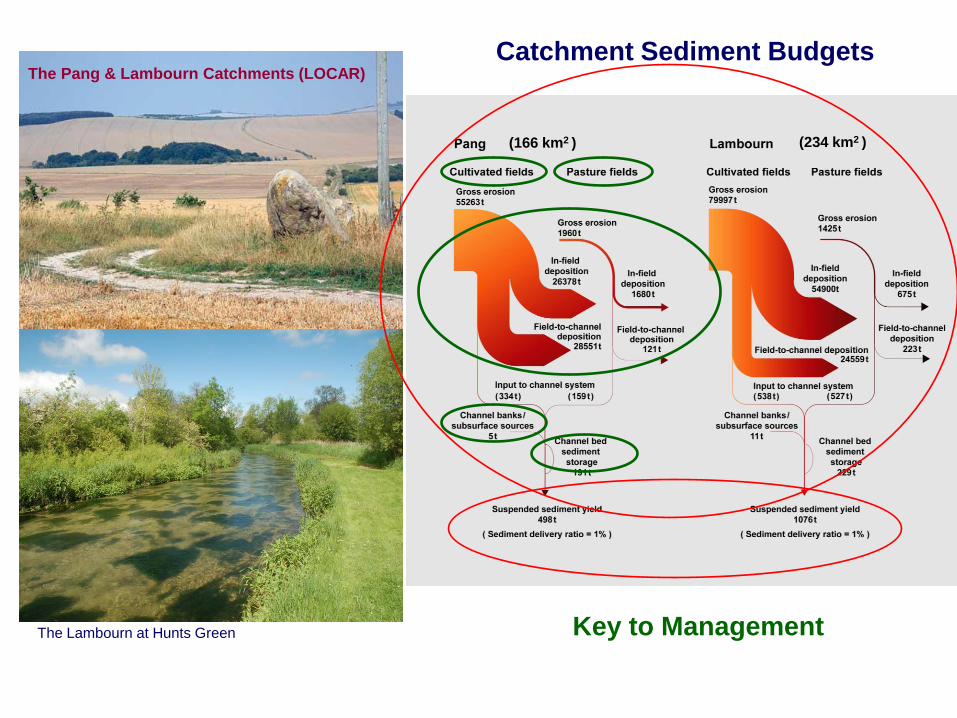
The Pang & Lambourn Catchments (LOCAR)
Catchment Sediment Budgets
The Lambourn at Hunts Green
(166 km2 ) (234 km2 )
Key to Management
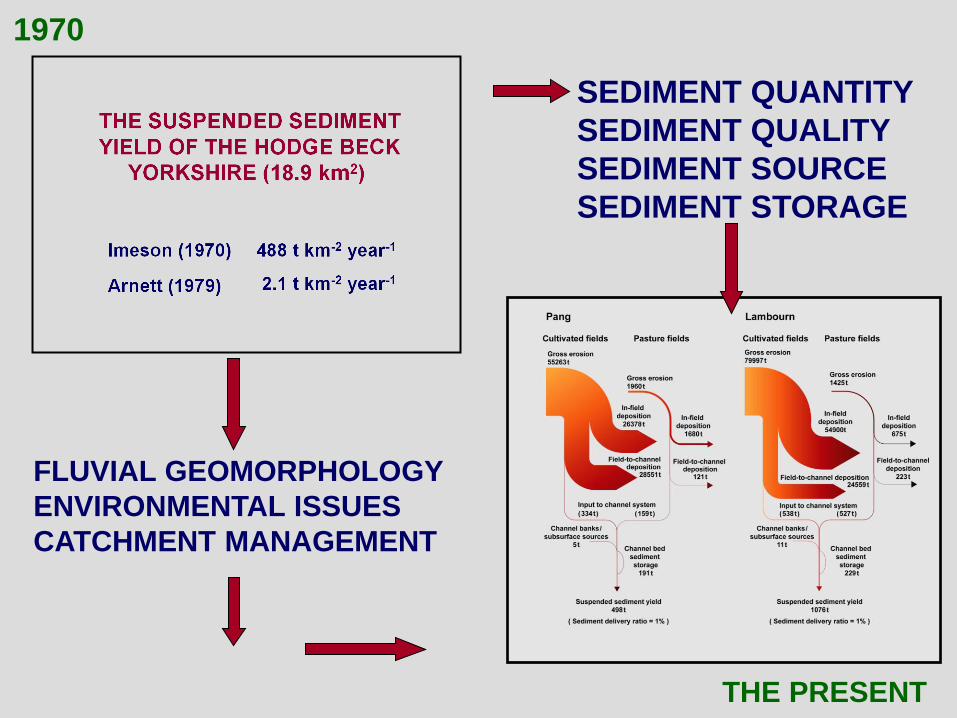
SEDIMENT QUANTITY
SEDIMENT QUALITY
SEDIMENT SOURCE
SEDIMENT STORAGE
FLUVIAL GEOMORPHOLOGY
ENVIRONMENTAL ISSUES
CATCHMENT MANAGEMENT
1970
THE PRESENT

Acknowledgements
THANK YOU