Embed Size (px)
Citation preview
Putting people at the heart of Air Quality Management:Developing a more social approach to emissions analysis and reduction.
Dr Tim Chatterton
With Jo Barnes, Enda Hayes, James Longhurst, Ben Williams
UWE, Bristol
Presentation by
Dr Tim ChattertonSenior Research Fellow
Air Quality Management Resource Centre
Routes to Clean Air conference, Bristol, 10th October 2016
Presentation
• A new approach to Air Quality Management
• Moving from “What and Where” to include “Who and Why”
• Why? The role of social activities
• Who? Differentials between the polluters and the polluted
• Conclusions
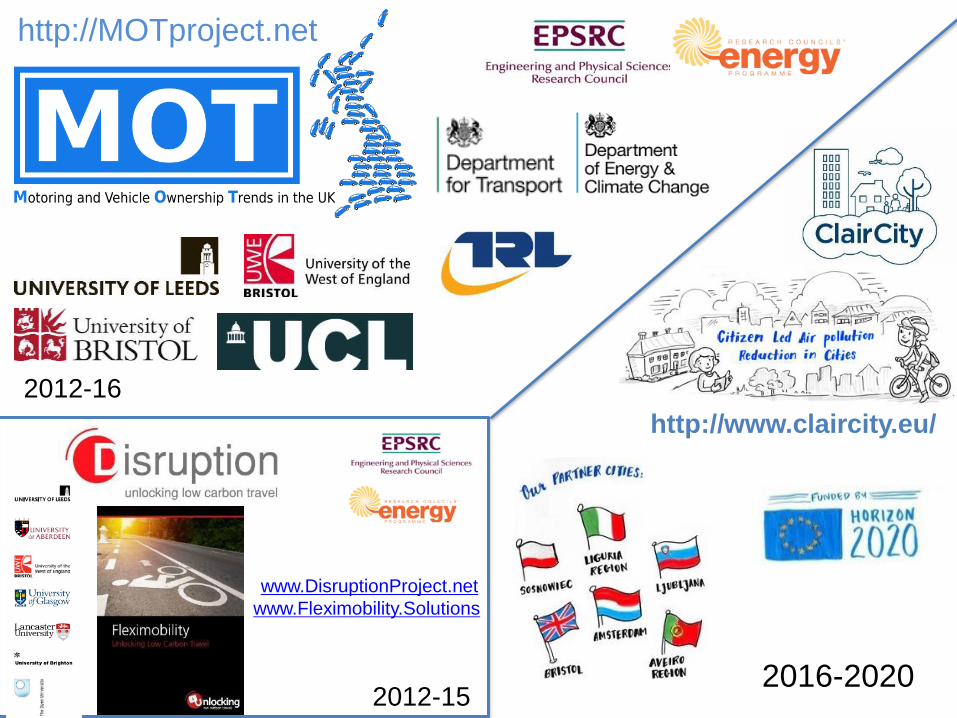
http://MOTproject.net
12012-16
http://www.claircity.eu/
2016-20202012-15
www.DisruptionProject.net
www.Fleximobility.Solutions
Air Quality Management vs Air Pollution Control
Pollution Control = Use of predominantly technical measures (end-of-pipe or before) to control emissionsfrom individual sources (stacks or exhaust pipes)
Air Quality Management = The control of diffuse sources to achieve reductions in ambient concentrations of pollutants
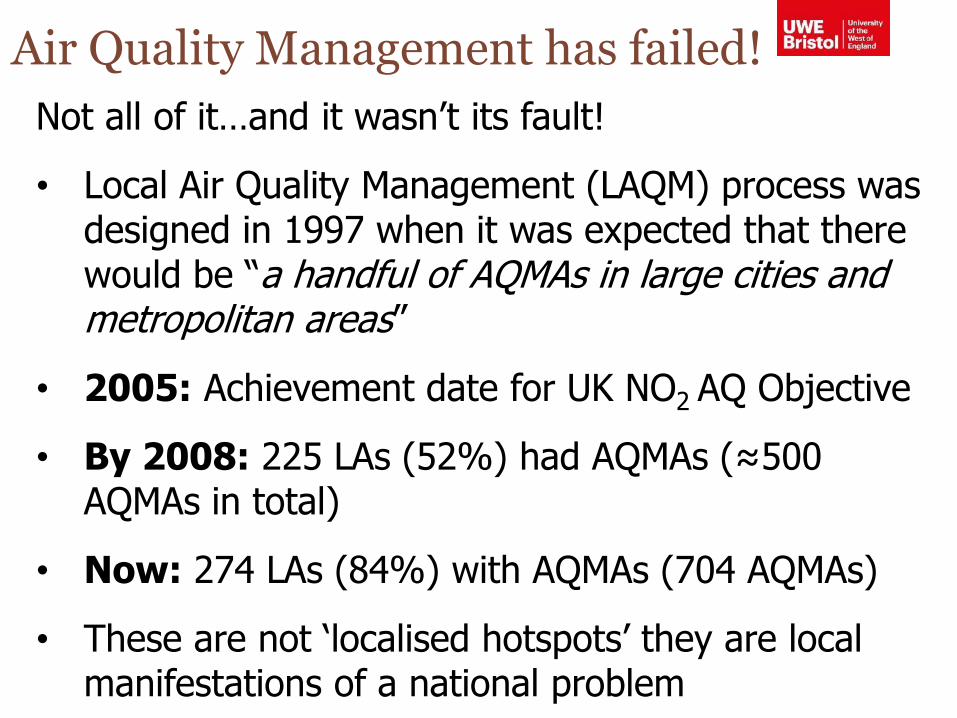
Air Quality Management has failed!
Not all of it…and it wasn’t its fault!
• Local Air Quality Management (LAQM) process was designed in 1997 when it was expected that there would be “a handful of AQMAs in large cities and metropolitan areas”
• 2005: Achievement date for UK NO2 AQ Objective
• By 2008: 225 LAs (52%) had AQMAs (≈500 AQMAs in total)
• Now: 274 LAs (84%) with AQMAs (704 AQMAs)
• These are not ‘localised hotspots’ they are local manifestations of a national problem
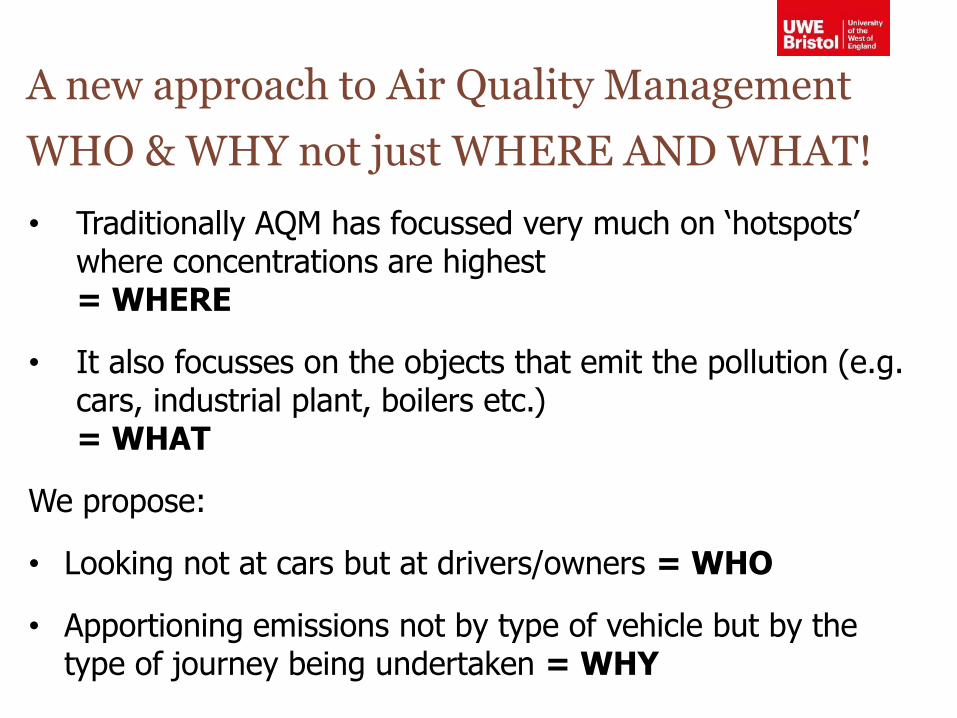
A new approach to Air Quality Management
WHO & WHY not just WHERE AND WHAT!
• Traditionally AQM has focussed very much on ‘hotspots’ where concentrations are highest = WHERE
• It also focusses on the objects that emit the pollution (e.g. cars, industrial plant, boilers etc.)= WHAT
We propose:
• Looking not at cars but at drivers/owners = WHO
• Apportioning emissions not by type of vehicle but by the type of journey being undertaken = WHY
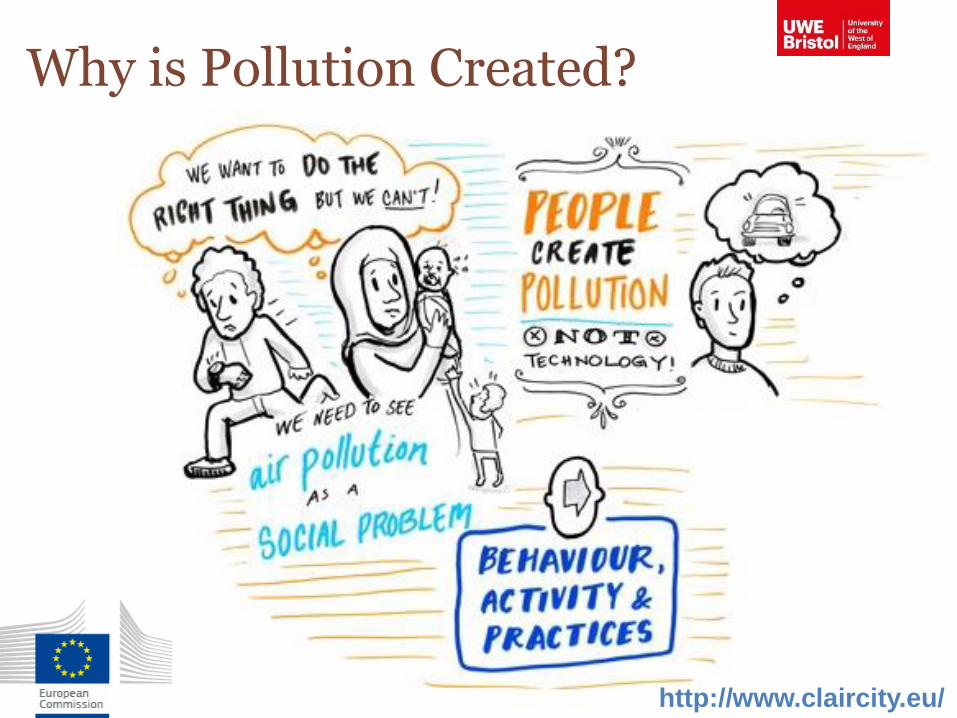
Why is Pollution Created?
http://www.claircity.eu/
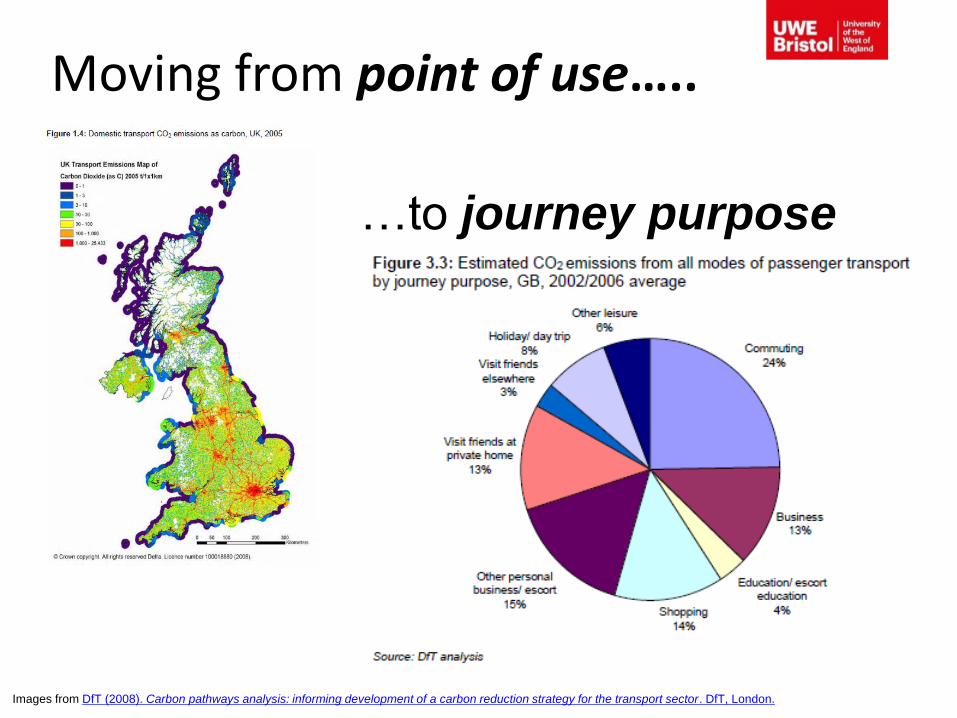
Moving from point of use…..
…to journey purpose
Images from DfT (2008). Carbon pathways analysis: informing development of a carbon reduction strategy for the transport sector. DfT, London.
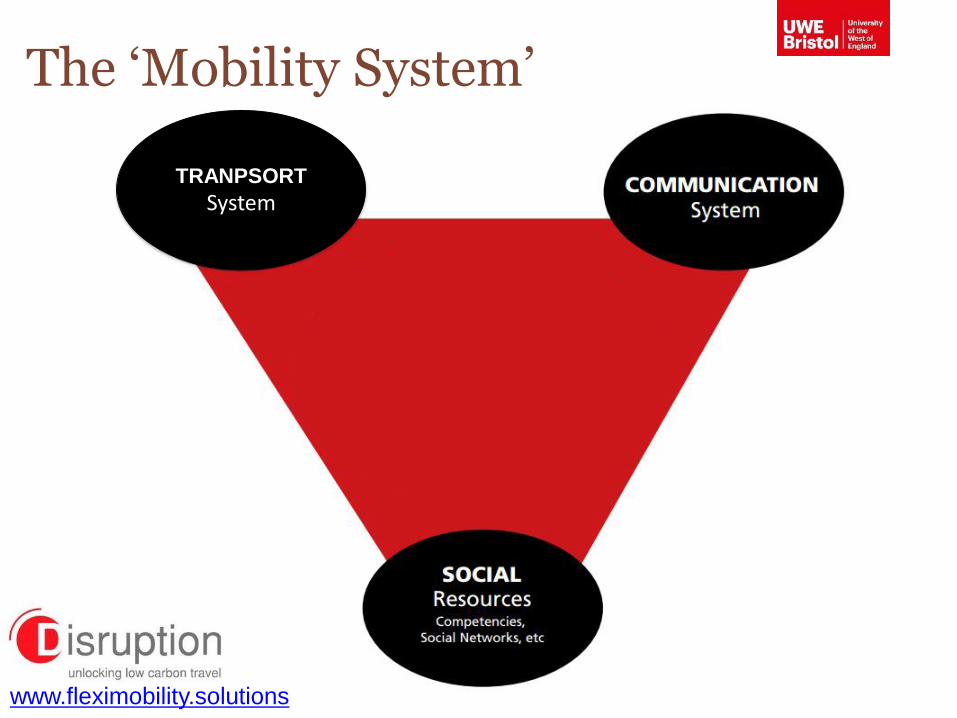
The ‘Mobility System’
www.fleximobility.solutions
TRANPSORT
System
The role of ‘activities’
• Transport is generated through the participation of people within sets of socially constructed ‘activities’
• How it is considered ‘normal’ to participate in these is established through a range of things from physical infrastructure to cultural conventions
• Organisations (employers, service providers etc.) at the heart of these activities often take unrestricted (auto) mobility as a given
• Where some attention is paid (green travel plans etc.) this is often seen as helping out individual travellers…
• ..rather than addressing a fundamental part of their ‘business model’
Who is Creating Pollution?
• Looking at the “Polluter” not just the “Polluted”
• Who are the people driving the cars that cause the emissions?
• Do the people who cause the most pollution suffer from the most pollution?
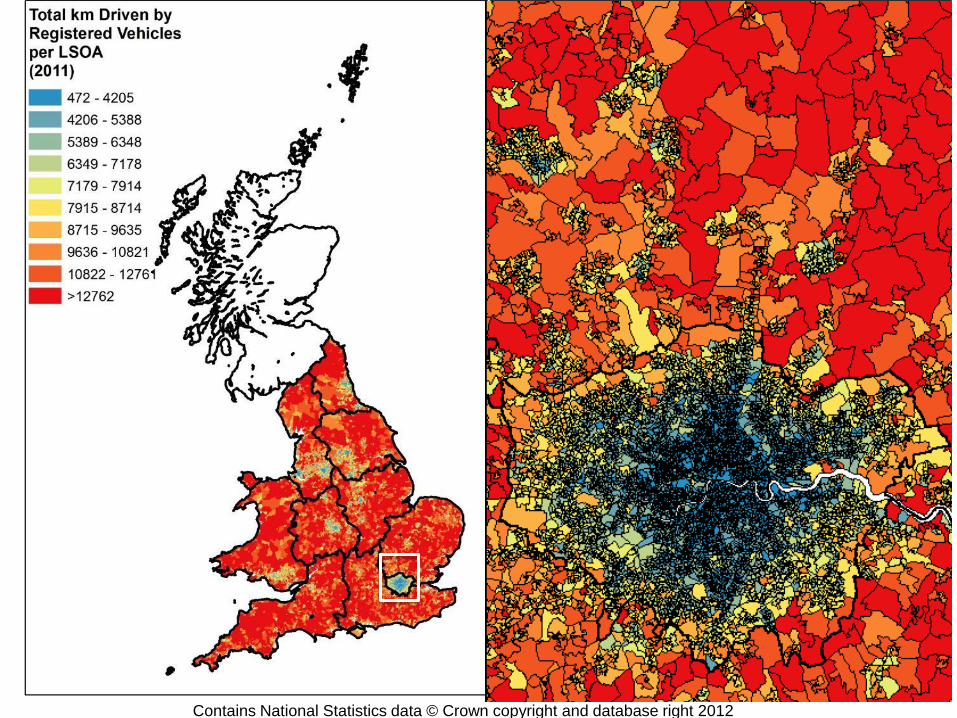
• What types of areas lead to the most emissions?
• Are their social or structural reasons for this?
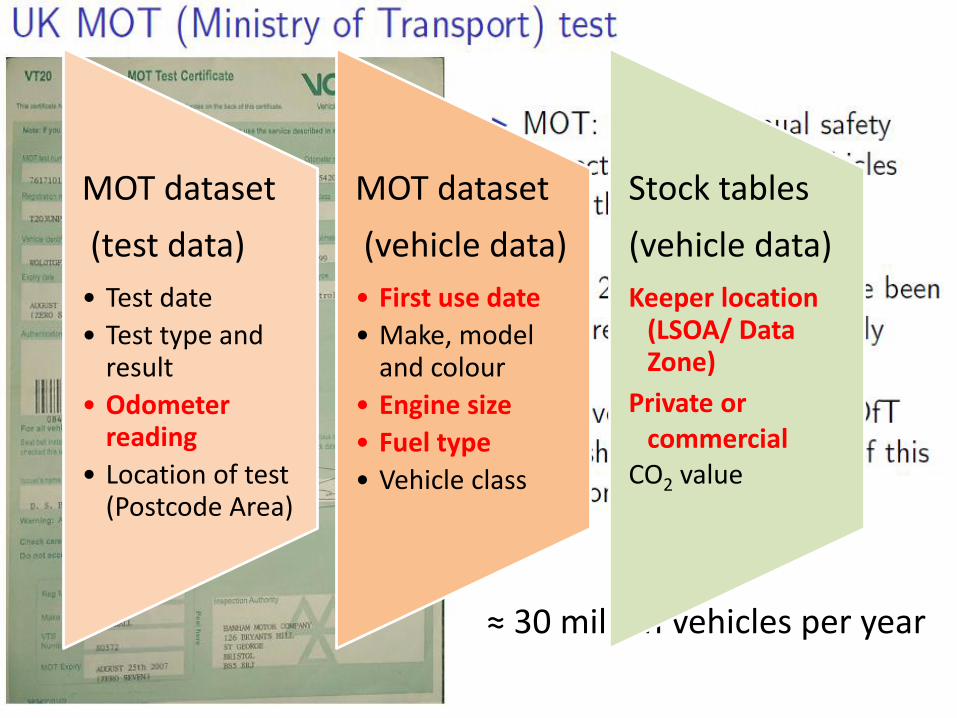
≈ 30 million vehicles per year
MOT dataset
(test data)
• Test date
• Test type and result
• Odometer reading
• Location of test (Postcode Area)
MOT dataset
(vehicle data)
• First use date
• Make, model and colour
• Engine size
• Fuel type
• Vehicle class
Stock tables
(vehicle data)
Keeper location (LSOA/ Data Zone)
Private or commercial
CO2 value
Contains National Statistics data © Crown copyright and database right 2012
Contains National Statistics data © Crown copyright and database right 2012
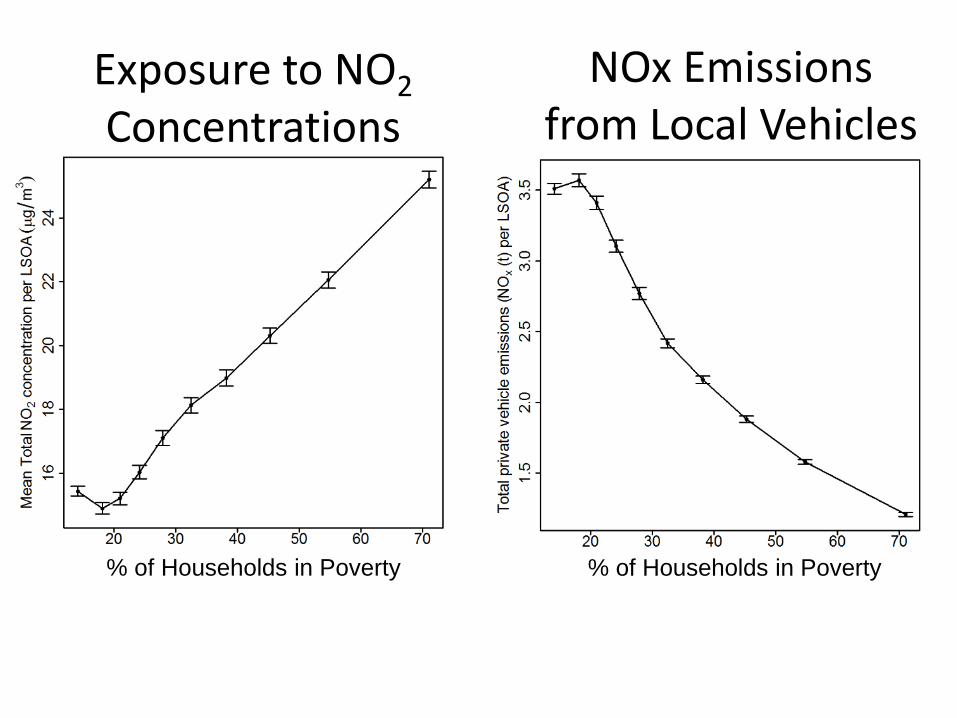
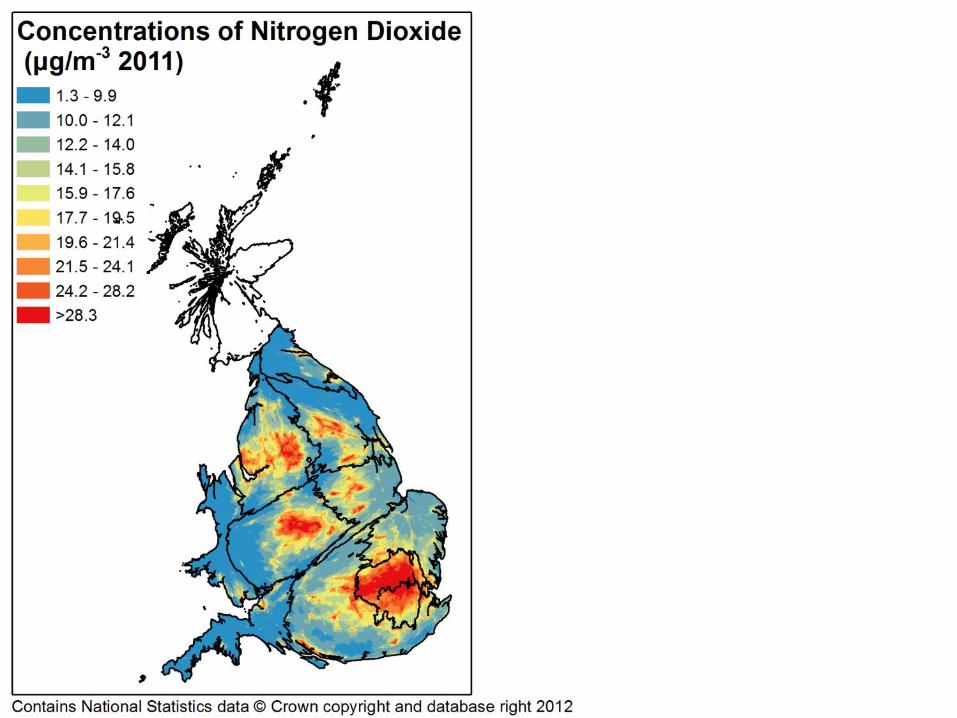
Exposure to NO2
Concentrations
% of Households in Poverty
NOx Emissions from Local Vehicles
% of Households in Poverty
Farming Communities
Rural Tenants
Ageing Rural Dwellers
Students Around Campus
Inner-City Students
Comfortable Cosmopolitans
Aspiring and Affluent
Ethnic Family Life
Endeavouring Ethnic Mix
Ethnic Dynamics
Aspirational Techies
Rented Family Living
Challenged Asian Terraces
Asian Traits
Urban Professionals and Families
Ageing Urban Living
Suburban Achievers
Semi-Detached Suburbia
Challenged Diversity
Constrained Flat Dwellers
White Communities
Ageing City Dwellers
Industrious Communities
Challenged Terraced Workers
Hard-Pressed Ageing Workers
Migration and Churn
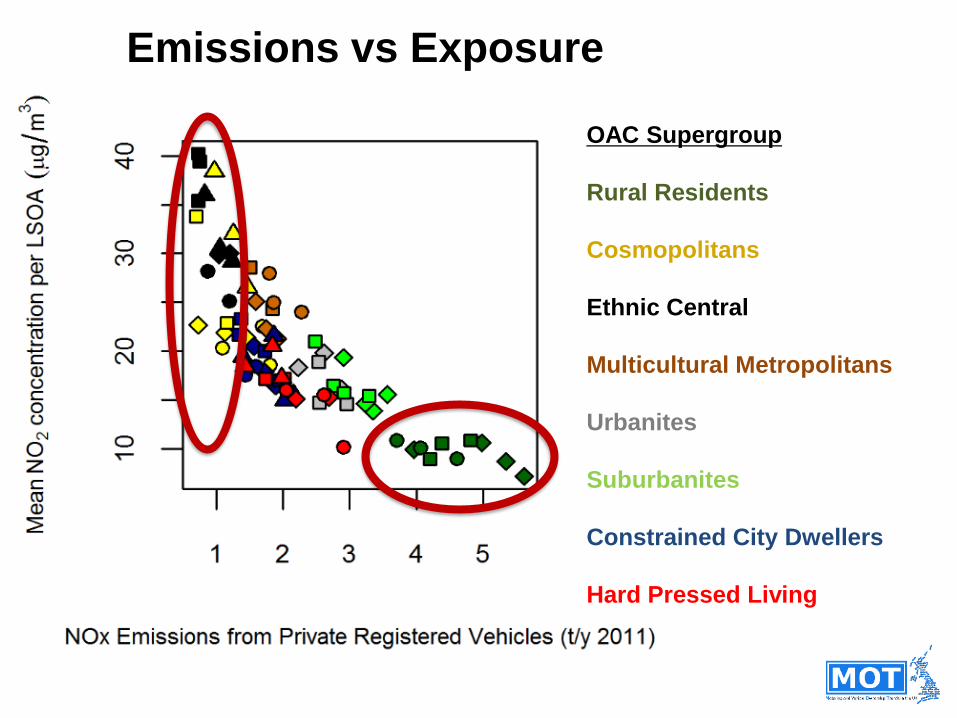
OAC Supergroup
Rural Residents
Cosmopolitans
Ethnic Central
Multicultural
Metropolitans
Urbanites
Suburbanites
Constrained City
Dwellers
Hard Pressed Living
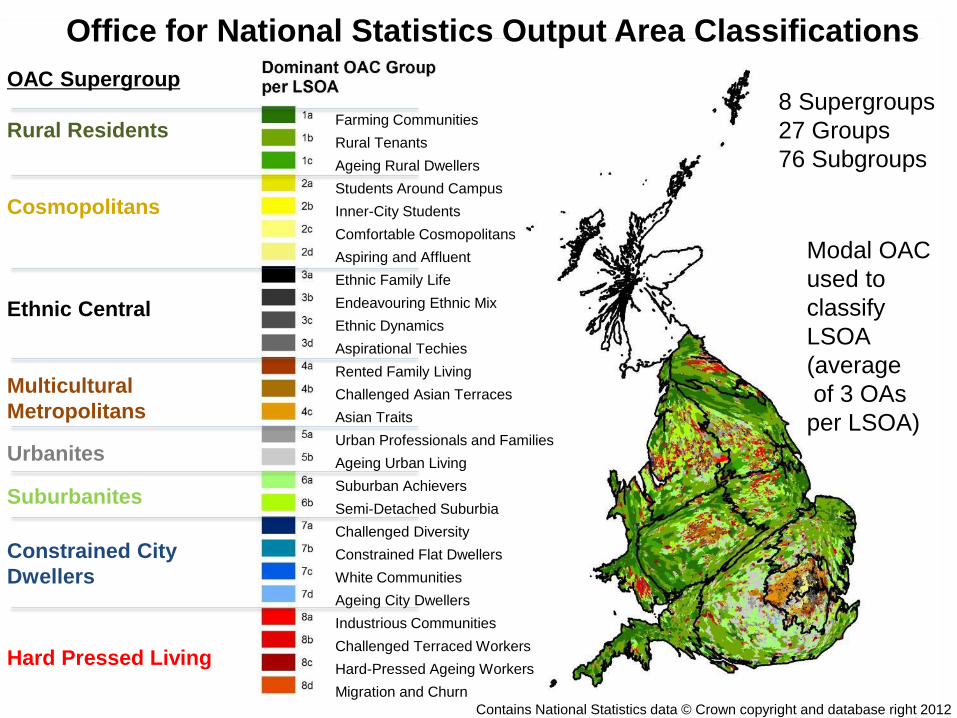
8 Supergroups
27 Groups
76 Subgroups
Office for National Statistics Output Area Classifications
Contains National Statistics data © Crown copyright and database right 2012
Modal OAC
used to
classify
LSOA
(average
of 3 OAs
per LSOA)
OAC Supergroup
Rural Residents
Cosmopolitans
Ethnic Central
Multicultural Metropolitans
Urbanites
Suburbanites
Constrained City Dwellers
Hard Pressed Living
Emissions vs Exposure
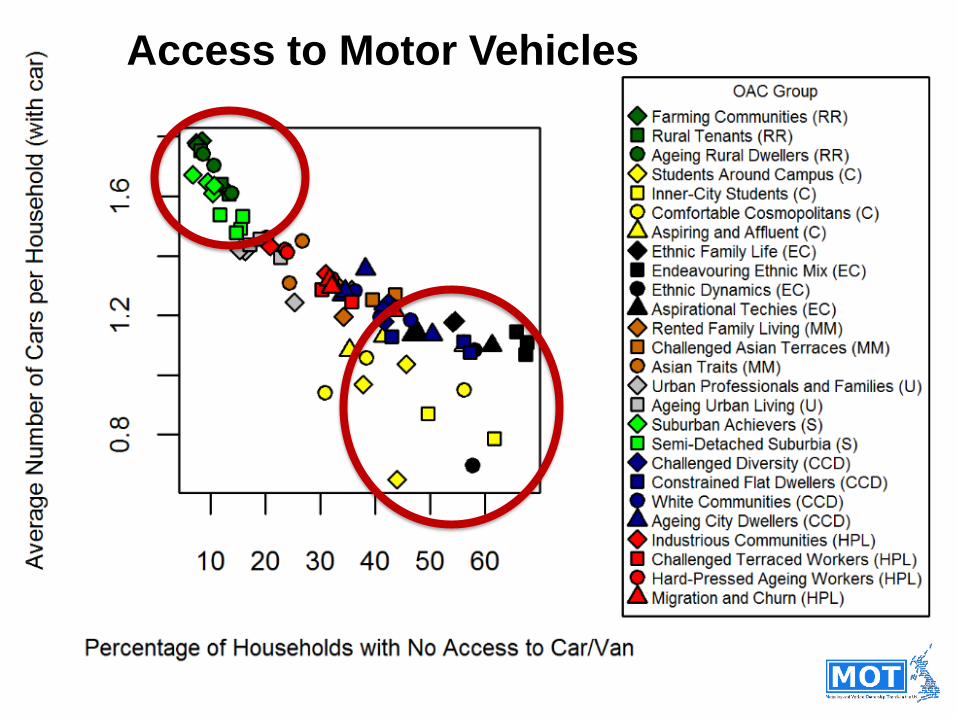
Access to Motor Vehicles
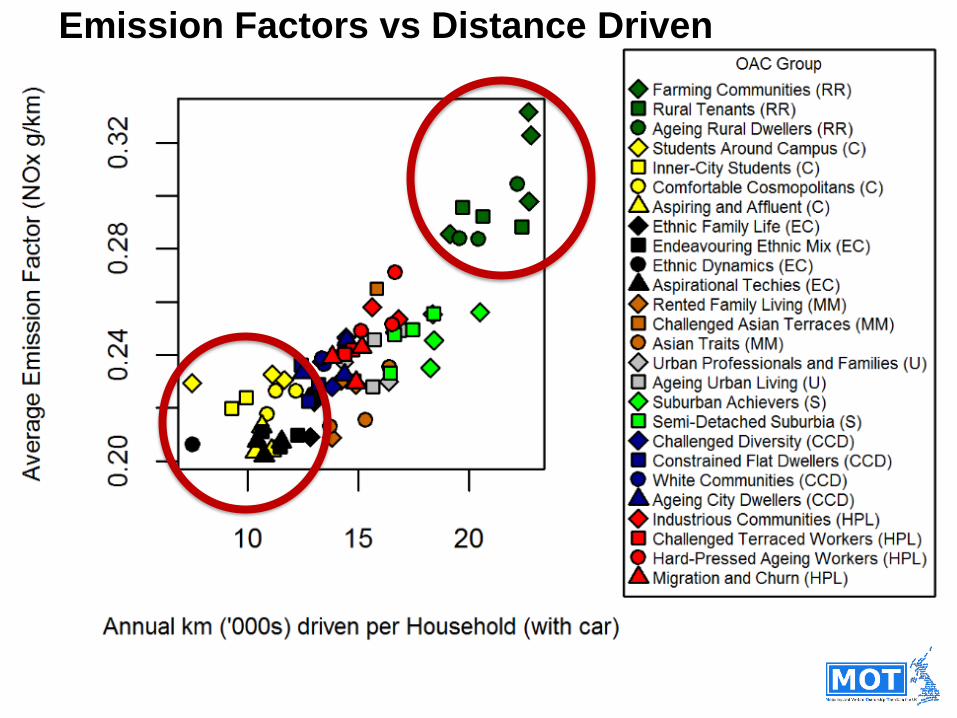
Emission Factors vs Distance Driven
What next?
• H2020 ClairCity project
• 4 year project: 2016-2020
• 10 Research + 6 City partners across Europe
• Extend ‘social activities’ approach to quantitative emissions and concentration modelling for alternative source apportionment
• Use new approaches to carry out improved public engagement with city management (through workshops, game and app)
Summary• AQM has failed to achieve both high levels of public
engagement or to address activity part of the equation: emissions = emission factors x activity
• A social rather than technocentric and point-of-use approaches may help and should be complementary to current practice
• This will help to address the social and structural inequalities related to both the causes of air pollution and its impacts….
• And enable widespread emission reductions - not just hotspot management – linking more clearly to energy and carbon agendas and achieving co-benefits
http://www.Fleximobility.Solutions
http://MOTproject.net
http://ClairCity.eu
Thank You!
The work has been undertaken under EPSRC Grants EP/K000438/1 (MOT) and EP/J00460X/1 (Disruption) and has received funding from the
European Union’s Horizon 2020 research and innovation programme under grant agreement 689289 (ClairCity).
Contains National Statistics and Ordnance Survey data © Crown copyright and database right 2012.