Embed Size (px)
Citation preview

Managing the impactof fine sediment onriver ecosystems
Iwan Jones, Adrian Collins, JohnMurphy, David Sear, Pam Naden

Erosion and Deposition are Natural Processes

Human Activities Influence Load andRetention

Impact of Fine Sediment inRiver
Light reductionBed alteration
Altered hydrodynamicsOxygen depletion
ScouringBurial
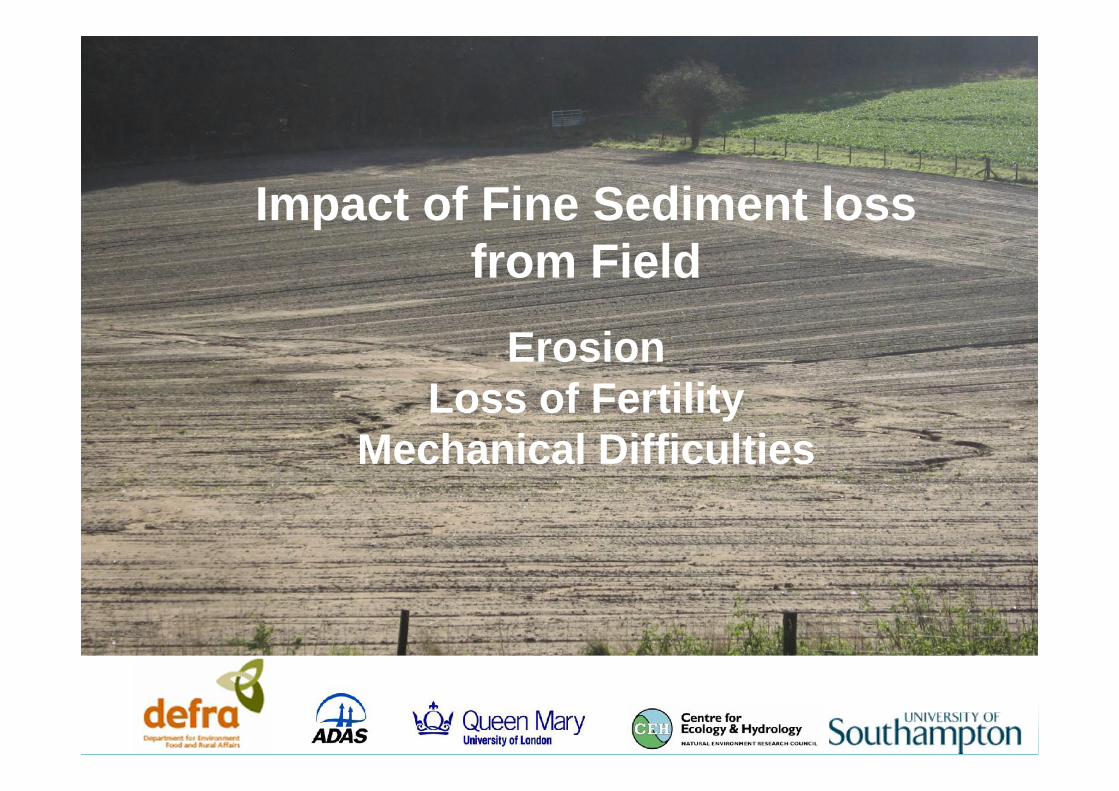
Impact of Fine Sediment lossfrom Field
ErosionLoss of Fertility
Mechanical Difficulties
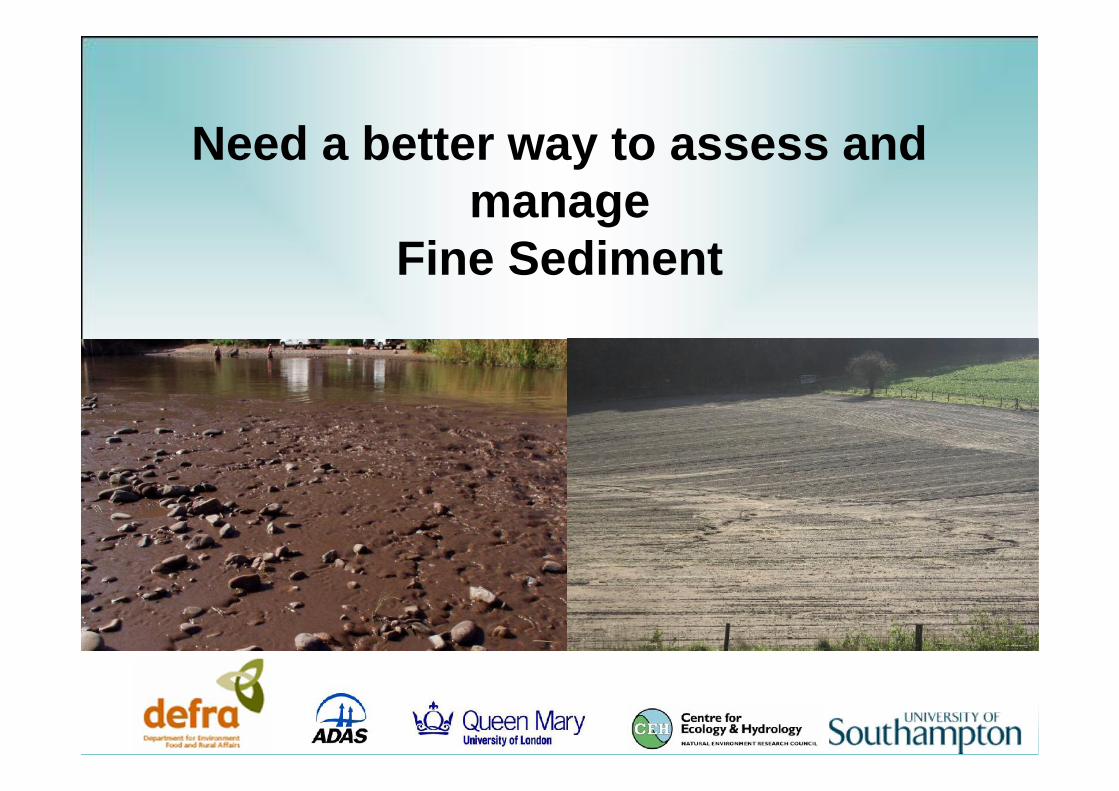
Need a better way to assess andmanage
Fine Sediment

Sources of fine sedimentNational-scale sediment sourceapportionment for England & Wales Relative
contribution ofagriculture toannual sedimentload
>50%<50%
Zhang, Collins et al. (2014) Env. Sci. Pol. 42:16-32
Insert image here
Insert image here
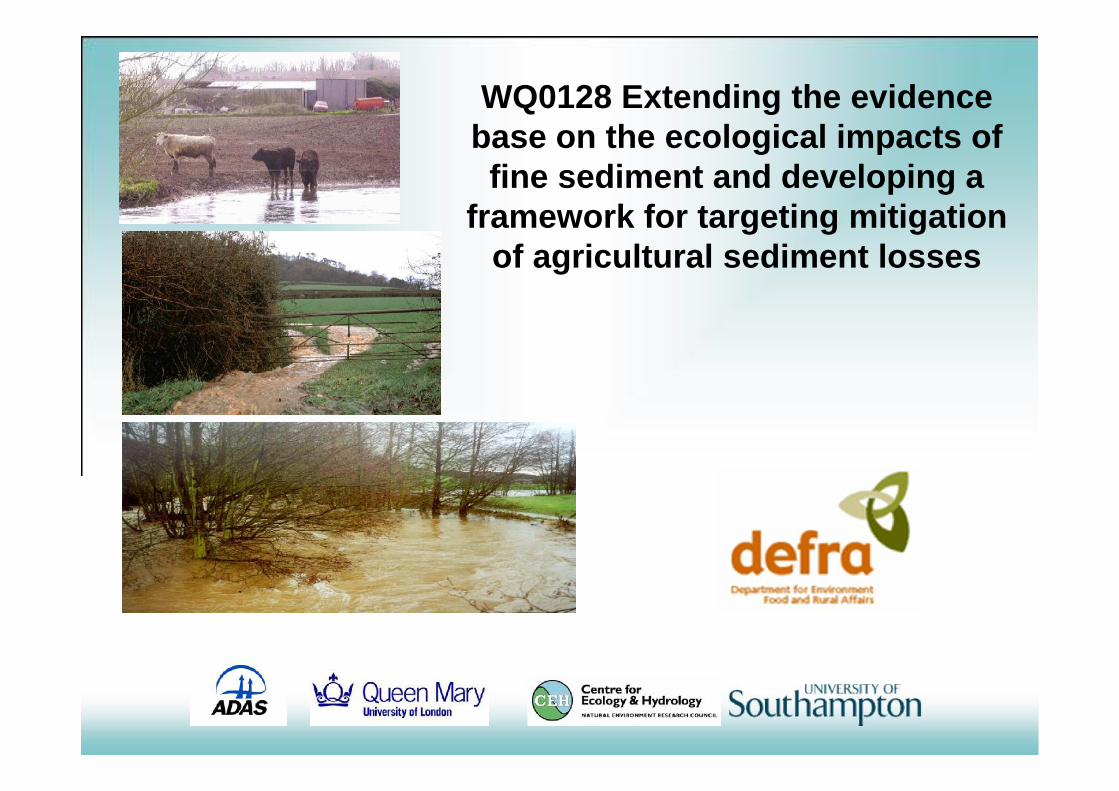
WQ0128 Extending the evidencebase on the ecological impacts offine sediment and developing a
framework for targeting mitigationof agricultural sediment losses
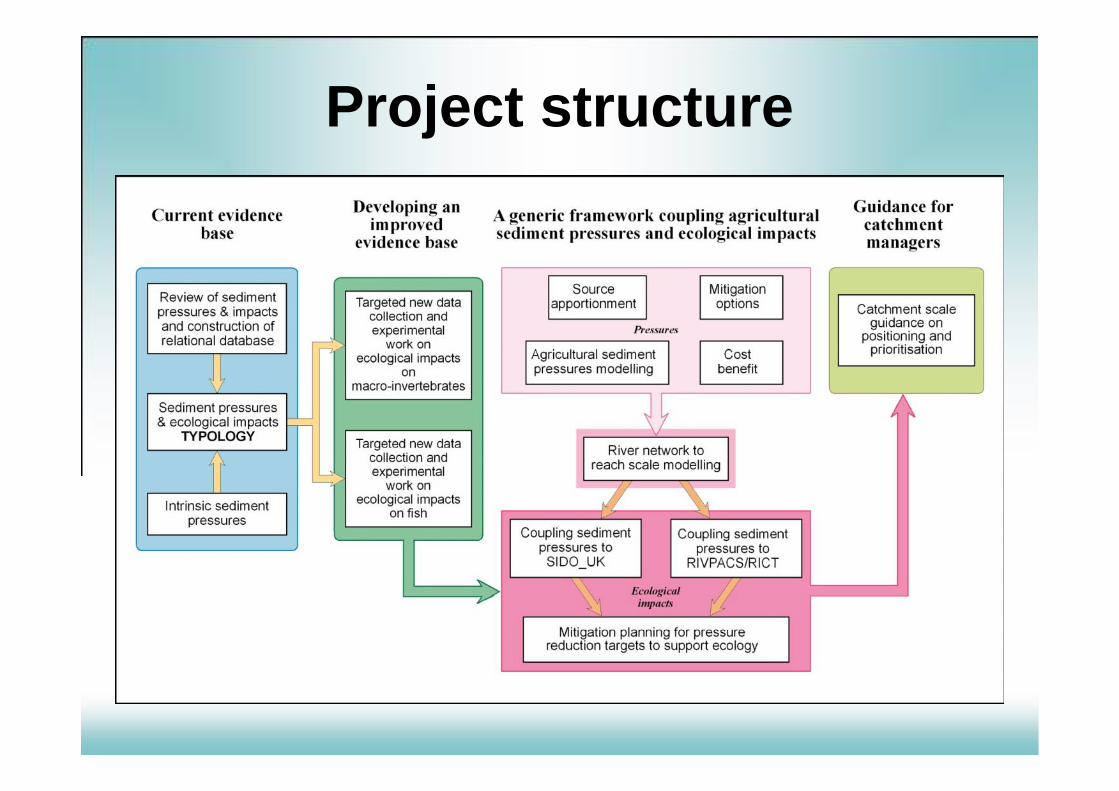
Project structure
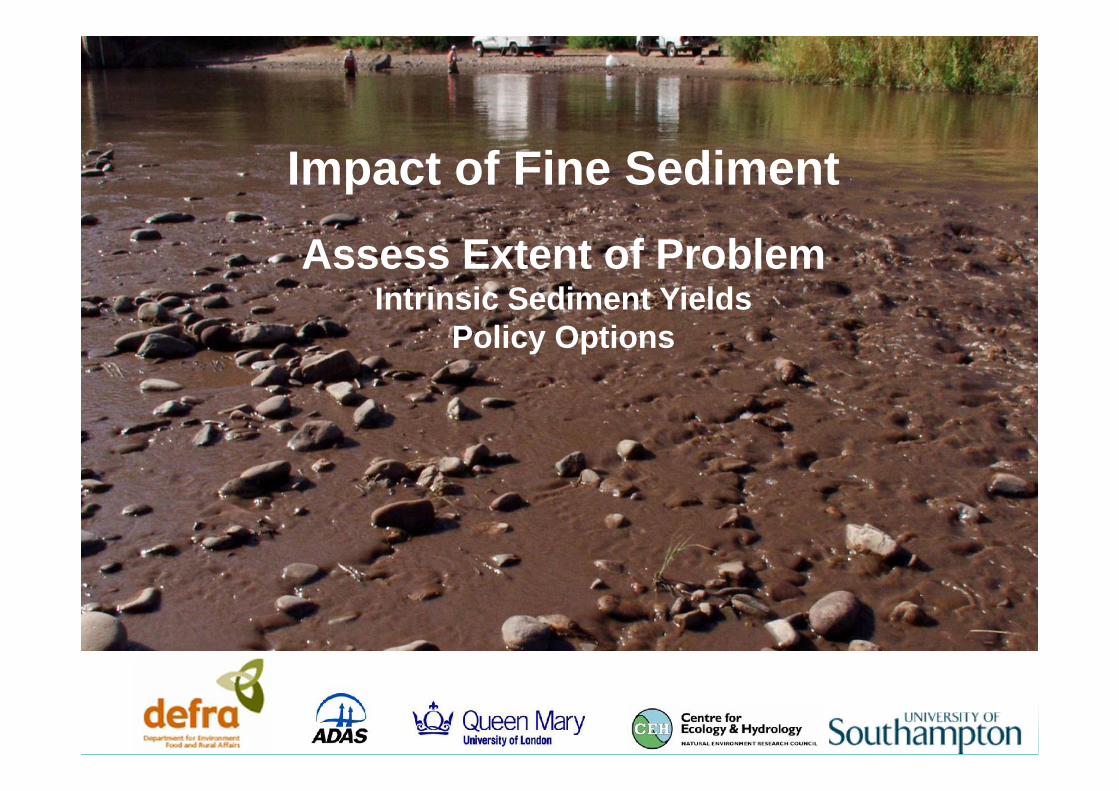
Impact of Fine Sediment
Assess Extent of ProblemIntrinsic Sediment Yields
Policy Options

The concept

Yield estimated from lake deposits
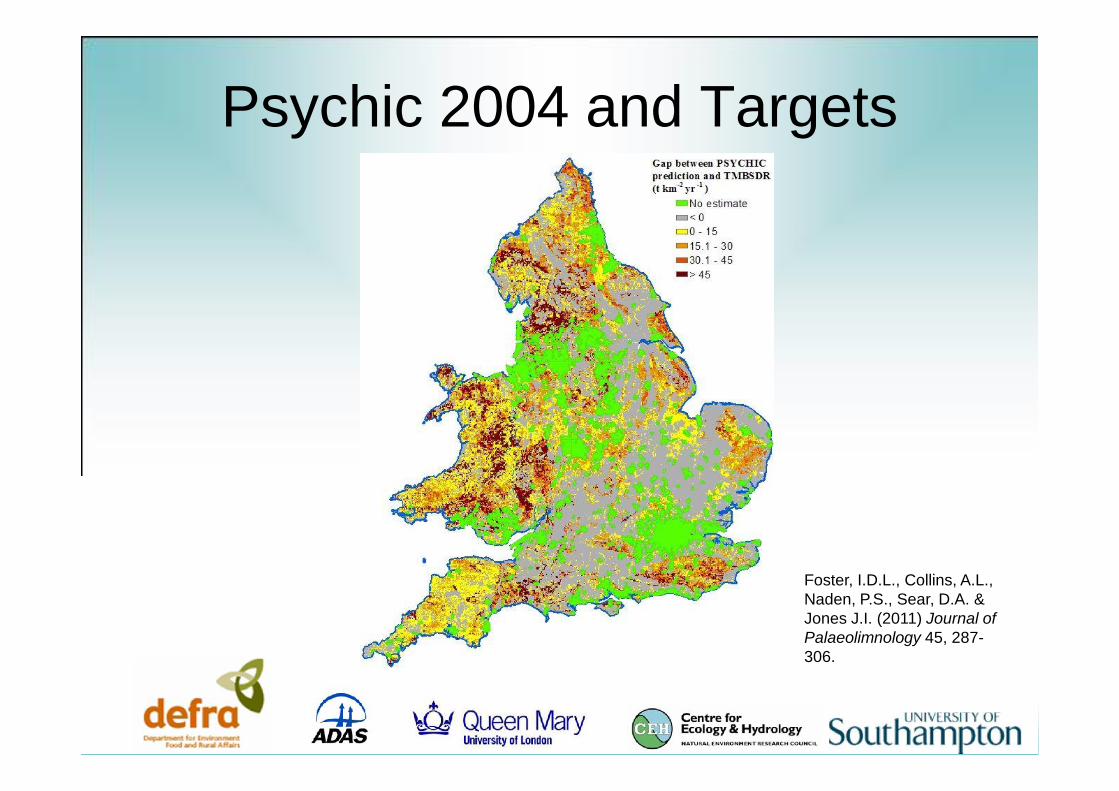
Psychic 2004 and Targets
Foster, I.D.L., Collins, A.L.,Naden, P.S., Sear, D.A. &Jones J.I. (2011) Journal ofPalaeolimnology 45, 287-306.

Impact of Fine Sediment
Review impacts on:Fish
InvertebratesMacrophytes
Diatoms
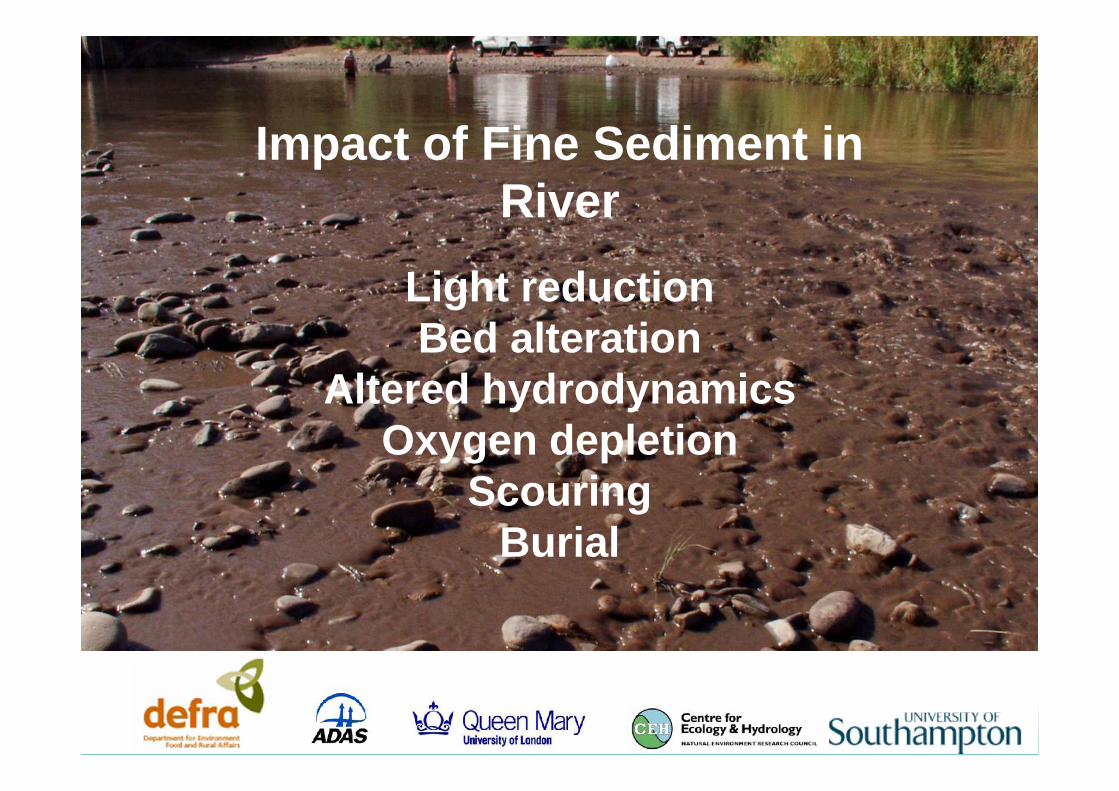
Impact of Fine Sediment inRiver
Light reductionBed alteration
Altered hydrodynamicsOxygen depletion
ScouringBurial
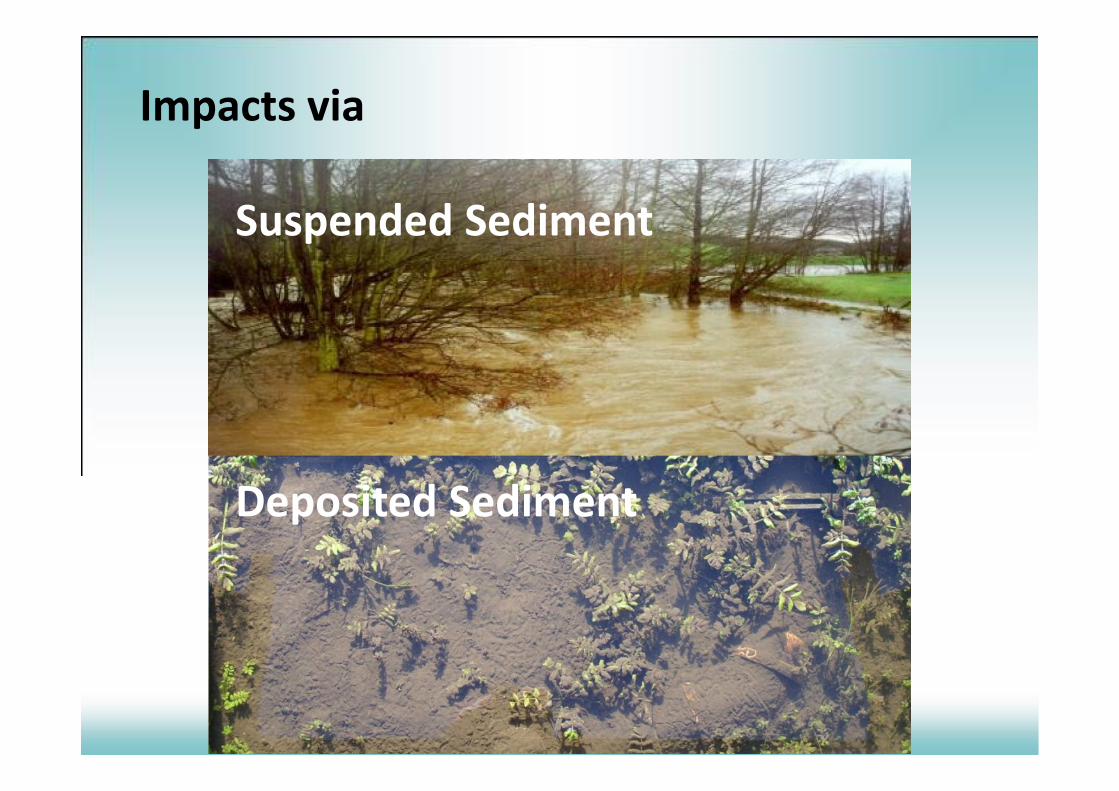
Impacts via
Suspended Sediment
Deposited Sediment
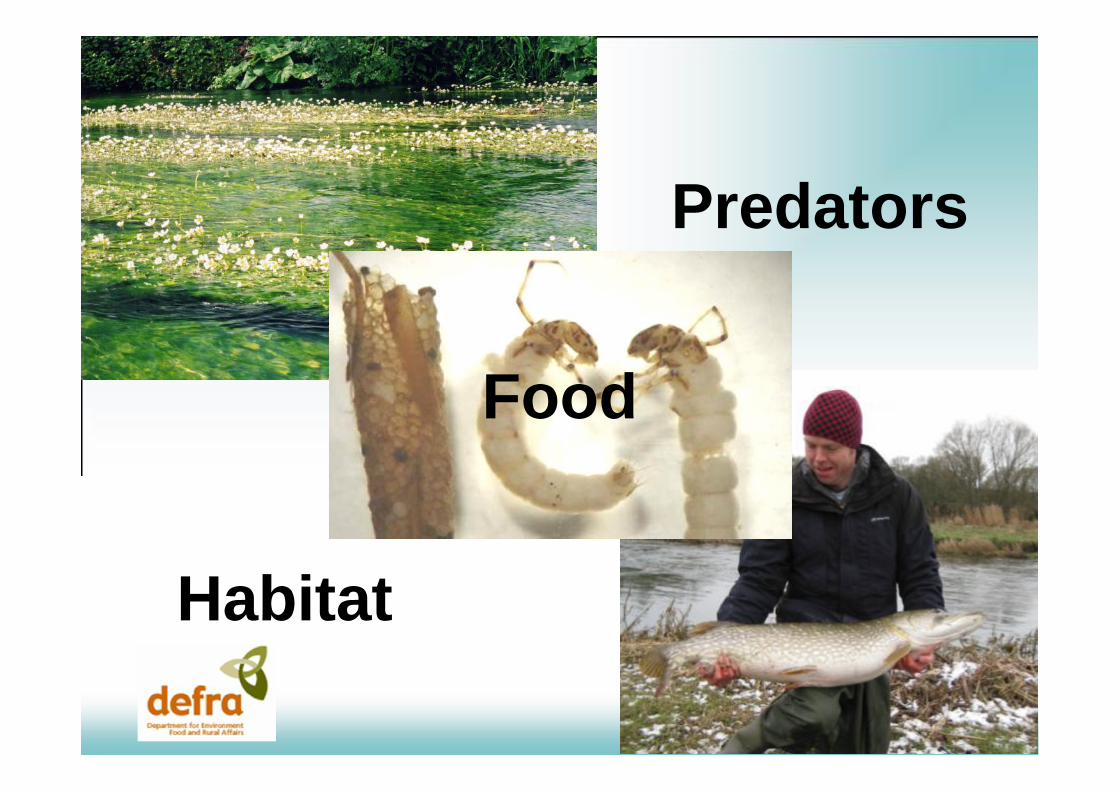
Habitat
Predators
Food

Lithophilous (gravel spawning) Fish

Kemp et al. (2011) Hydrological Processes
Sediment, Agricultural Calendar and FishReproduction

Survival of Atlantic salmon embryos in relation to% fine sediment
% S
urvi
val t
o ha
tch
Kemp et al. (2011) Hydrological Processes
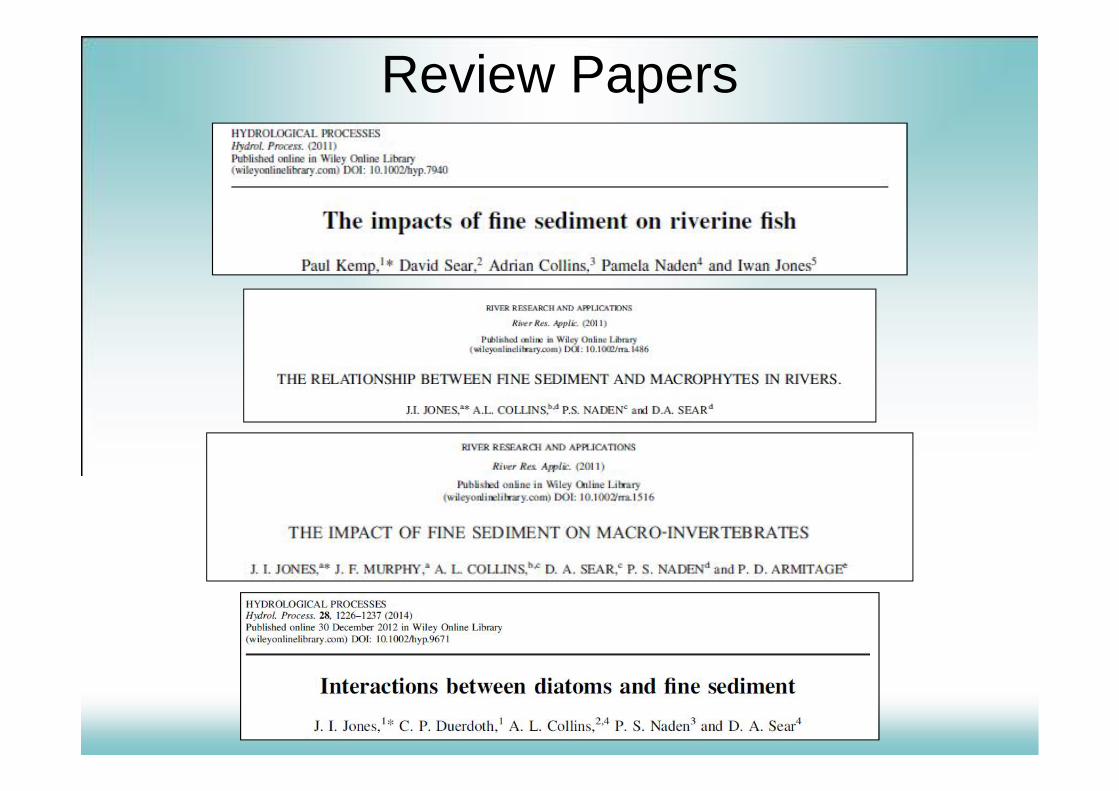
Review Papers
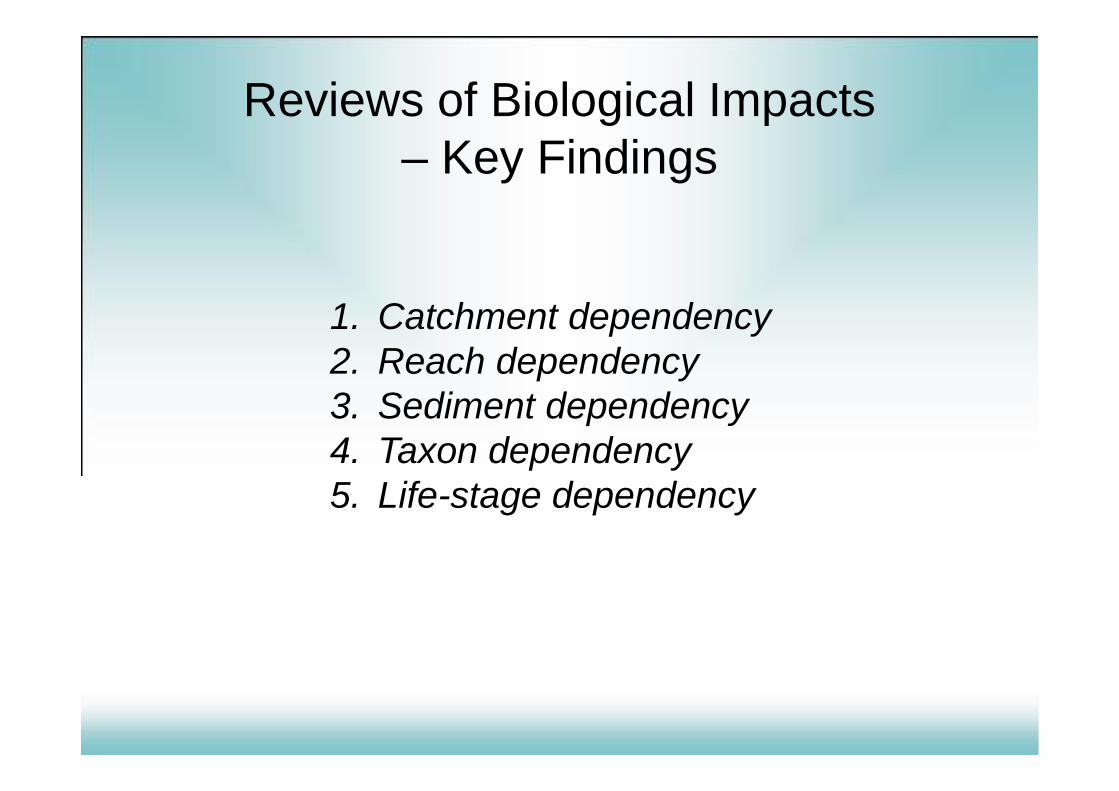
Reviews of Biological Impacts– Key Findings
1. Catchment dependency2. Reach dependency3. Sediment dependency4. Taxon dependency5. Life-stage dependency

• Existing evidence base for impacts of fine sediment islargely correlative
• Failure to elucidate the critical process linkagesbetween sediment stress and key environmentalparameters/characteristics
Reviews of Biological Impacts– Key Findings
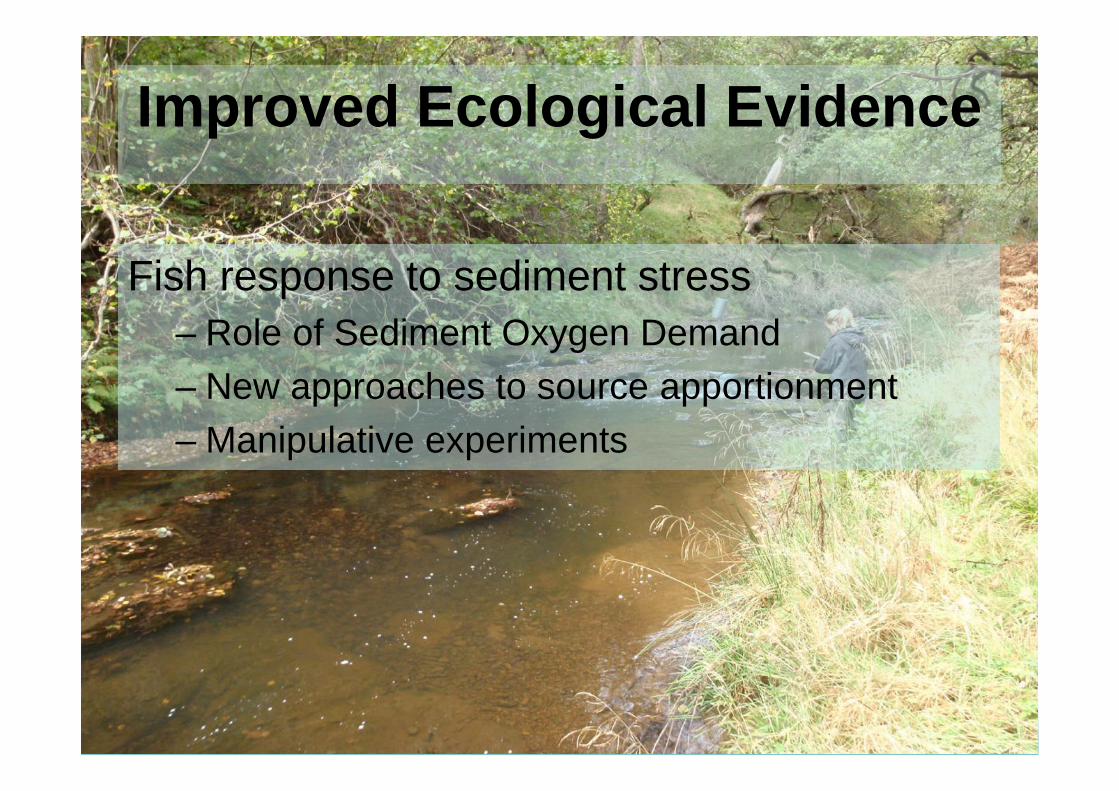
Improved Ecological Evidence
Fish response to sediment stress– Role of Sediment Oxygen Demand– New approaches to source apportionment– Manipulative experiments
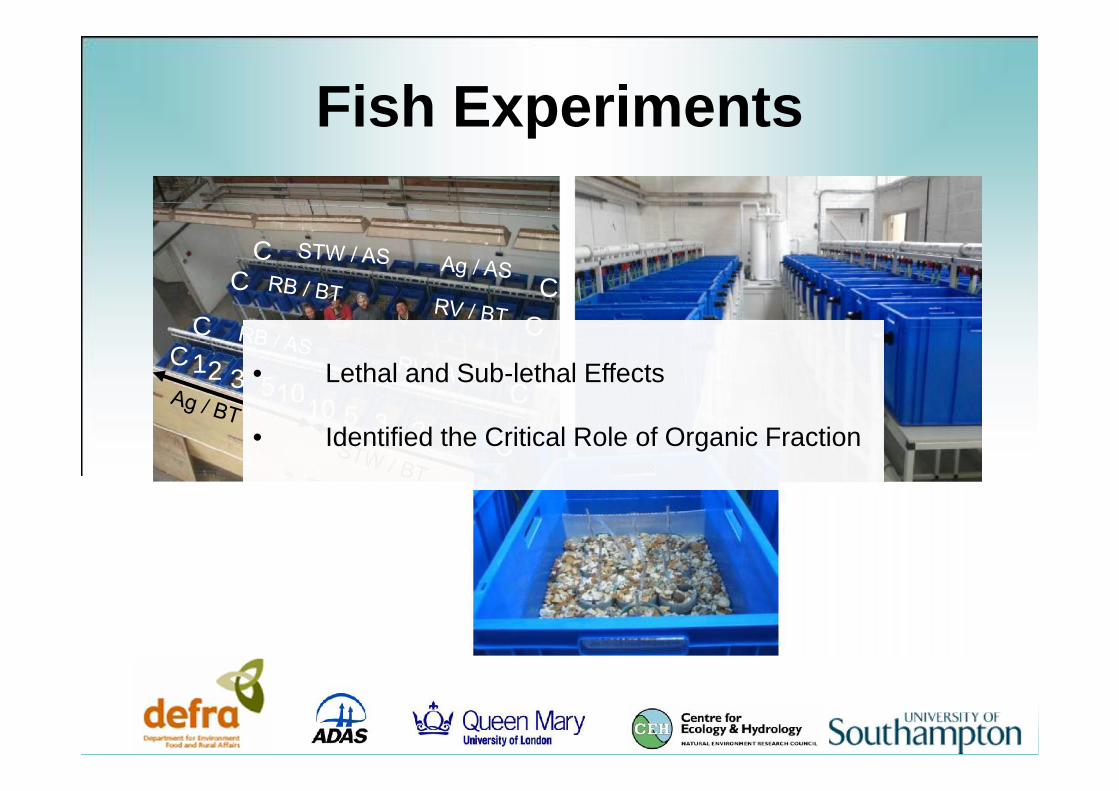
Fish Experiments
C
C
CC
CC
CC
123510
12 3 510• Lethal and Sub-lethal Effects
• Identified the Critical Role of Organic Fraction
0
0.1
0.2
0.3
0.4
0.5
0.6
0.7
0.8
0.9
1
0 50 100 150 200 250
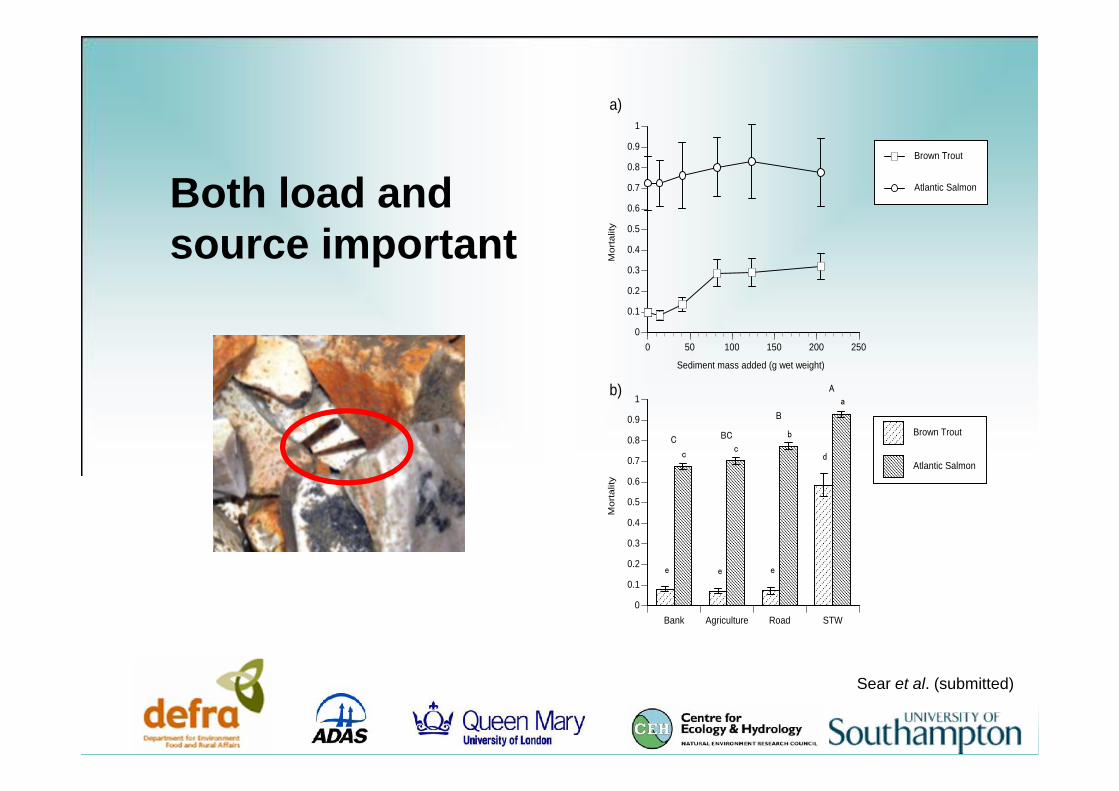
Brown Trout
Atlantic Salmon
Bank Agriculture Road STW0
0.1
0.2
0.3
0.4
0.5
0.6
0.7
0.8
0.9
1
Brown Trout
Atlantic Salmon
a
b
cc d
ee e
Mor
talit
yM
orta
lity
a)
b) A
B
BCC
Sediment mass added (g wet weight)
Both load andsource important
Sear et al. (submitted)
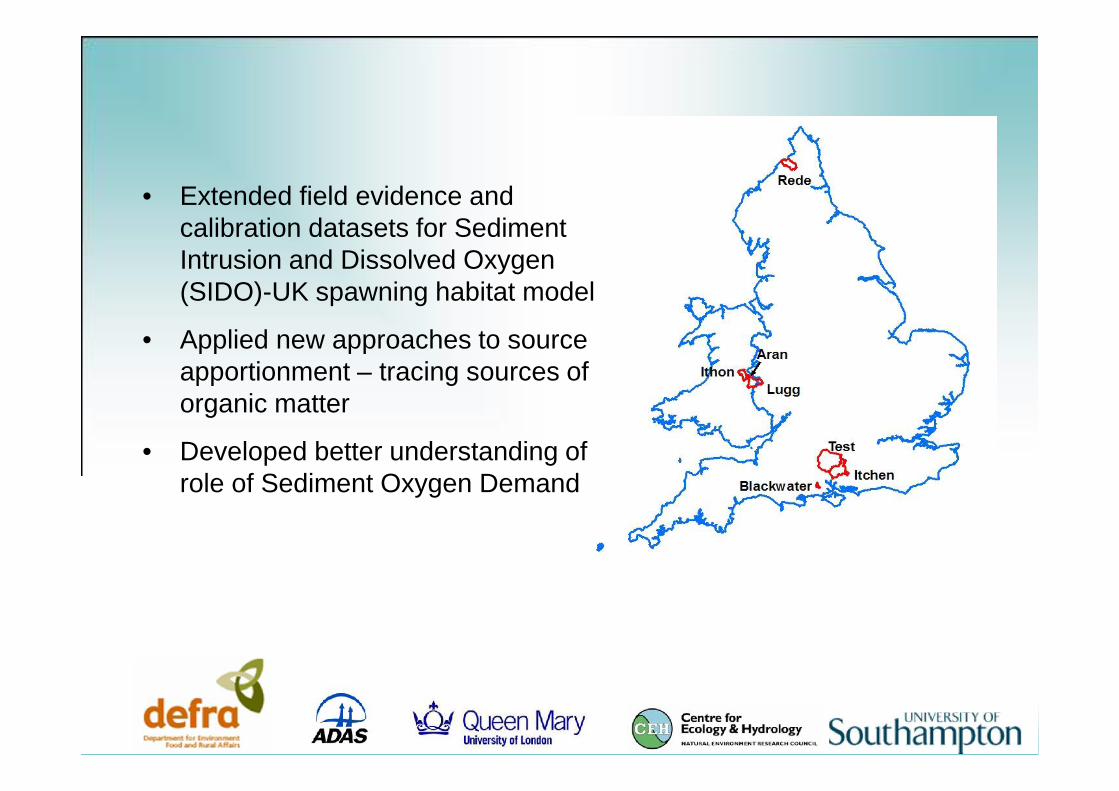
• Extended field evidence andcalibration datasets for SedimentIntrusion and Dissolved Oxygen(SIDO)-UK spawning habitat model
• Applied new approaches to sourceapportionment – tracing sources oforganic matter
• Developed better understanding ofrole of Sediment Oxygen Demand
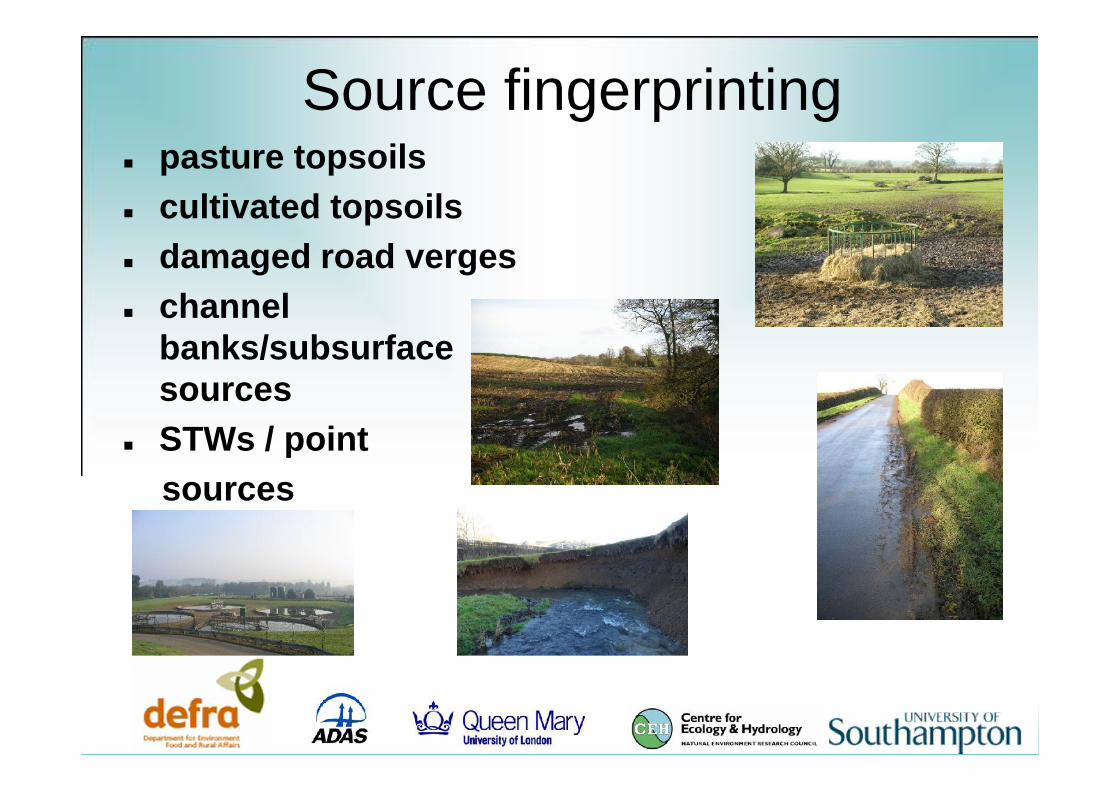
Source fingerprinting pasture topsoils cultivated topsoils damaged road verges channel
banks/subsurfacesources
STWs / pointsources
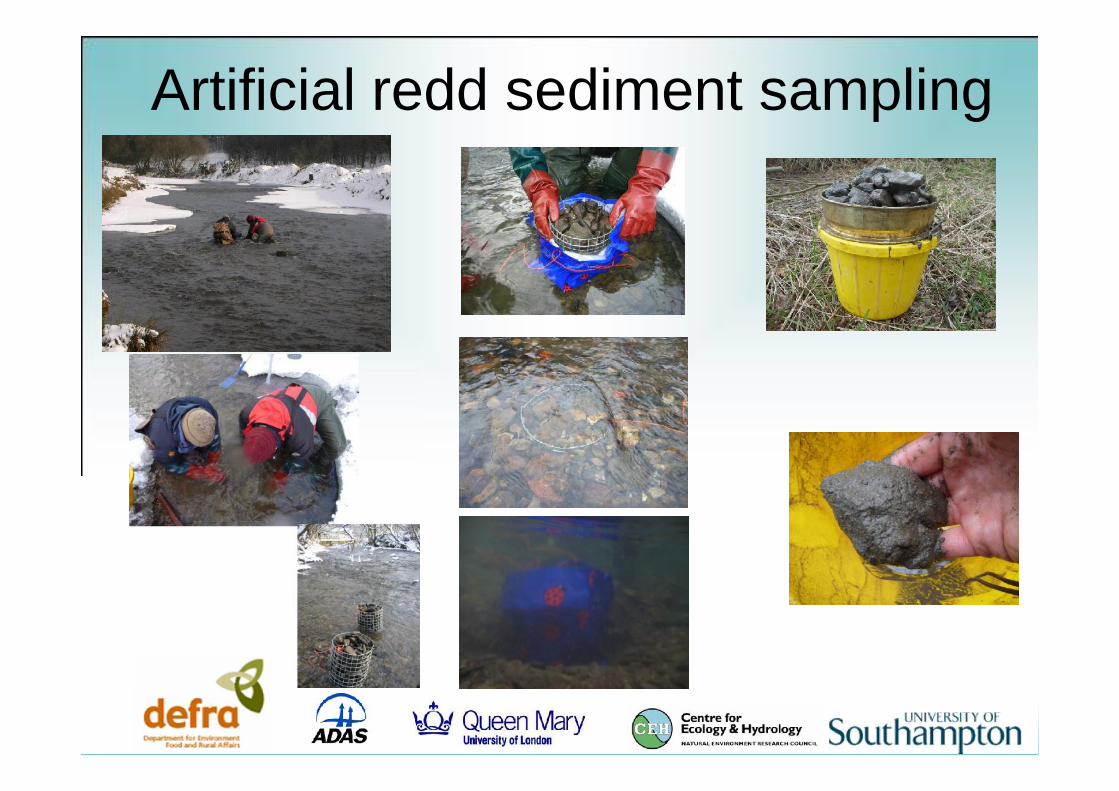
Artificial redd sediment sampling
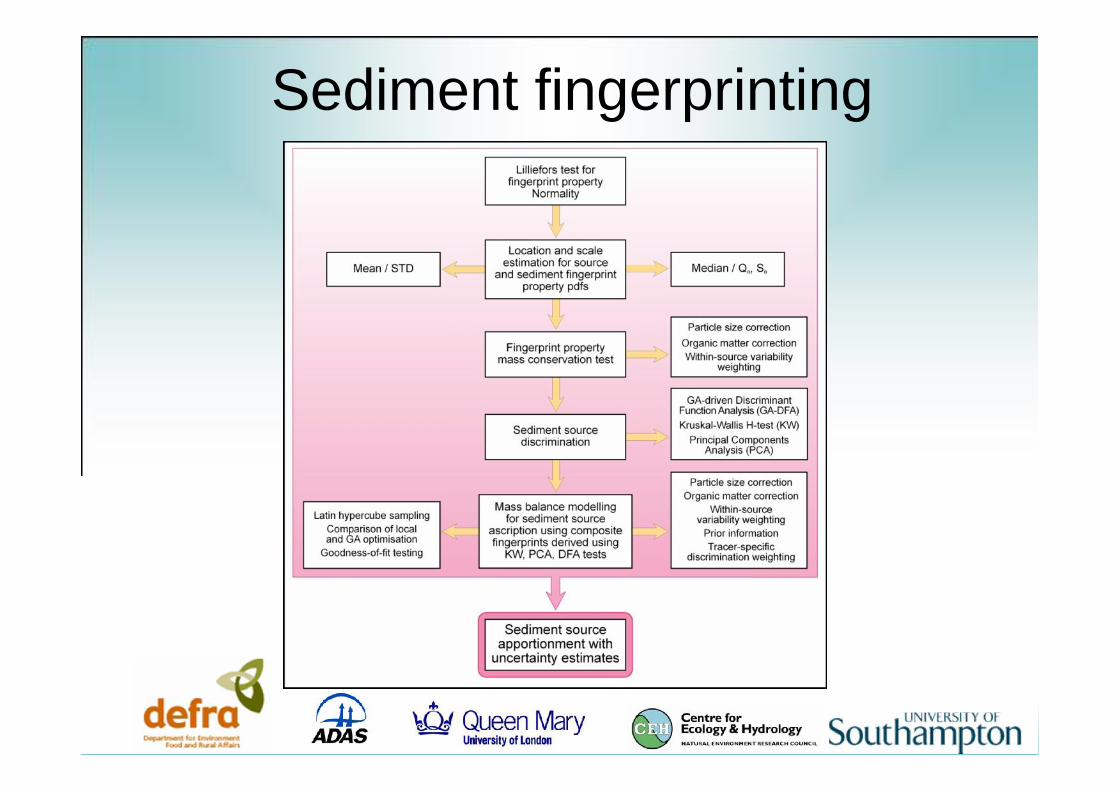
Sediment fingerprinting

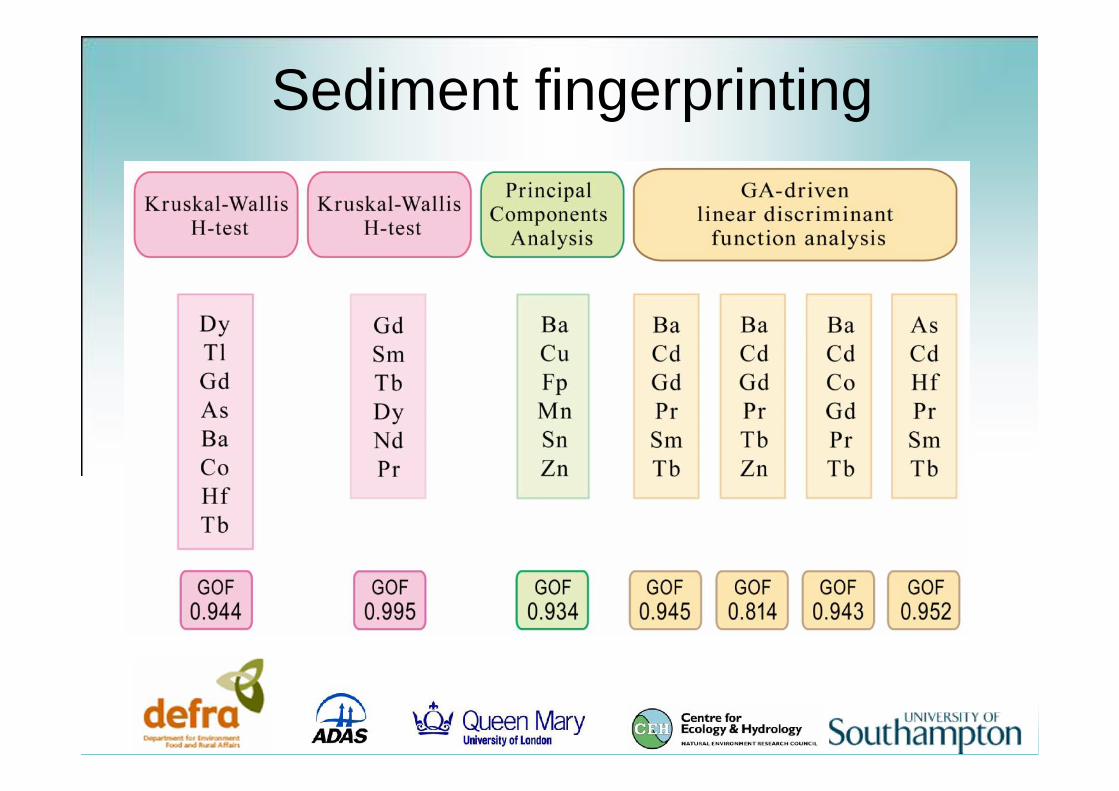
Sediment fingerprinting
Sediment fingerprinting

Sediment fingerprinting
• pasture topsoils– 29±1%
• cultivated topsoils– 3±1%
• damaged road verges– 33±1%
• channel banks / subsurfacesources– 31±1%
• STWs / point sources– 4±1%
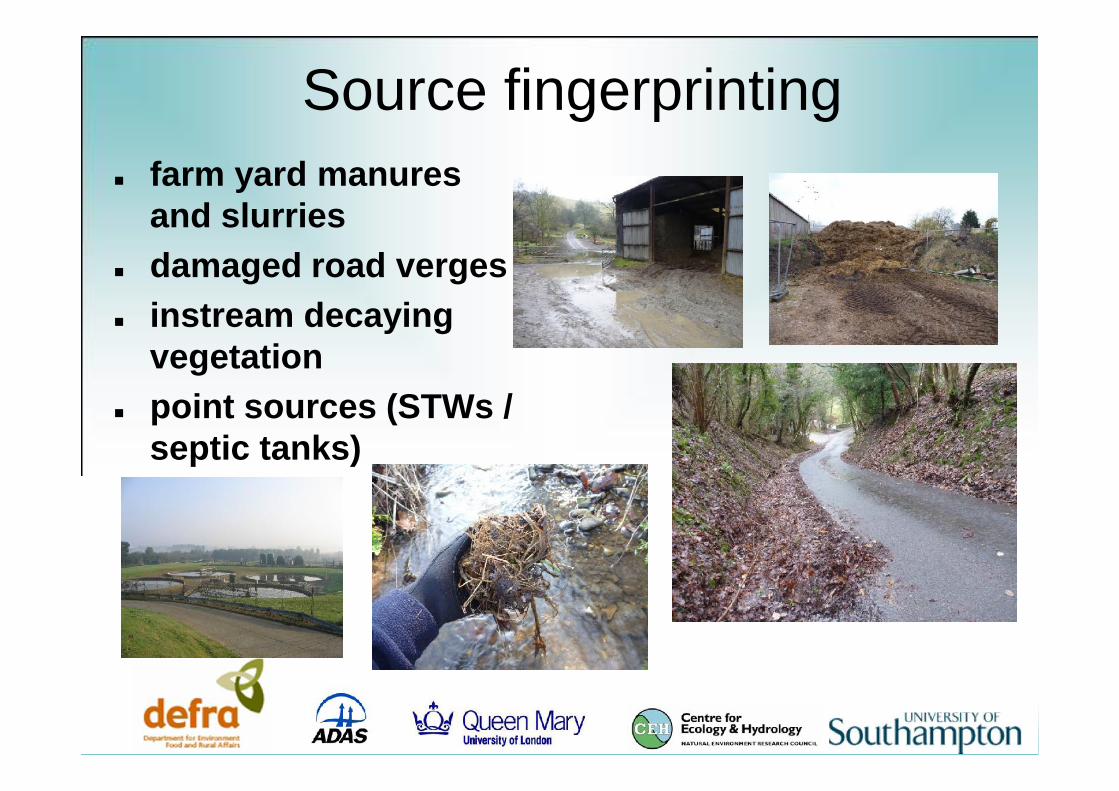
Source fingerprinting farm yard manures
and slurries damaged road verges instream decaying
vegetation point sources (STWs /
septic tanks)
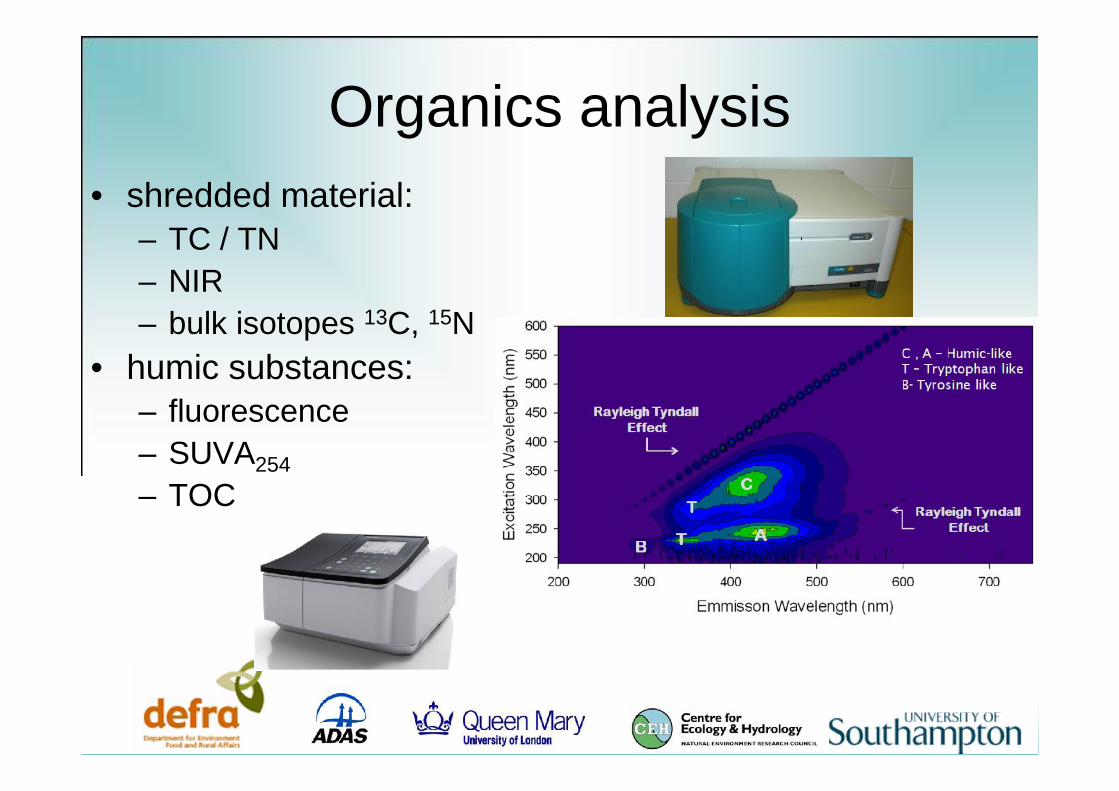
Organics analysis• shredded material:
– TC / TN– NIR– bulk isotopes 13C, 15N
• humic substances:– fluorescence– SUVA254– TOC
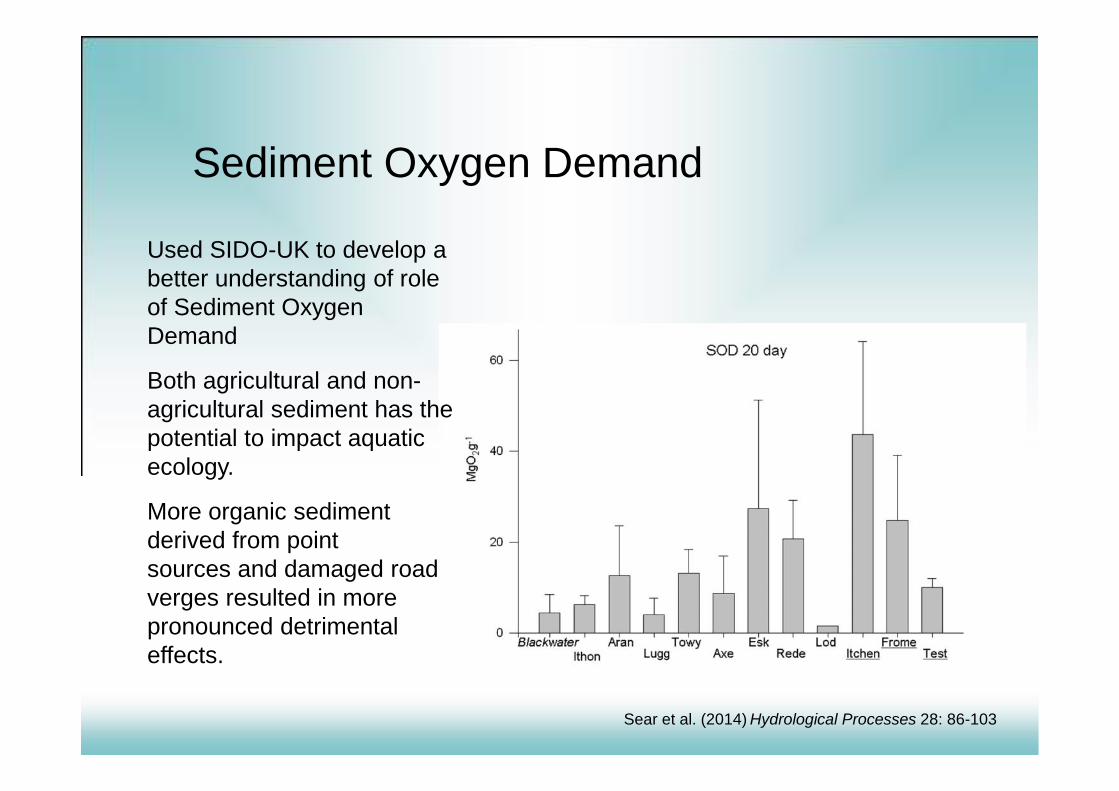
Sediment Oxygen Demand
Used SIDO-UK to develop abetter understanding of roleof Sediment OxygenDemand
Both agricultural and non-agricultural sediment has thepotential to impact aquaticecology.
More organic sedimentderived from pointsources and damaged roadverges resulted in morepronounced detrimentaleffects.
Sear et al. (2014) Hydrological Processes 28: 86-103

Improved Ecological Evidence
Invertebrate response to sediment stress– Correlative field survey– Manipulative experiments

Calibration dataset• 230 sites sampled for macroinvertebrates & deposited
fine sediment
• across a gradient of modelled sediment pressure
• across a gradient of stream types
• free from STW and urban area inputs
• upstream of lakes & reservoirs
• predominantly agricultural catchments

Objectives
• Establish relationship between macroinvertebratecommunity and fine sediment pressure at an appropriatemanagement scale
• Develop a diagnostic biotic index
• Independently test new index
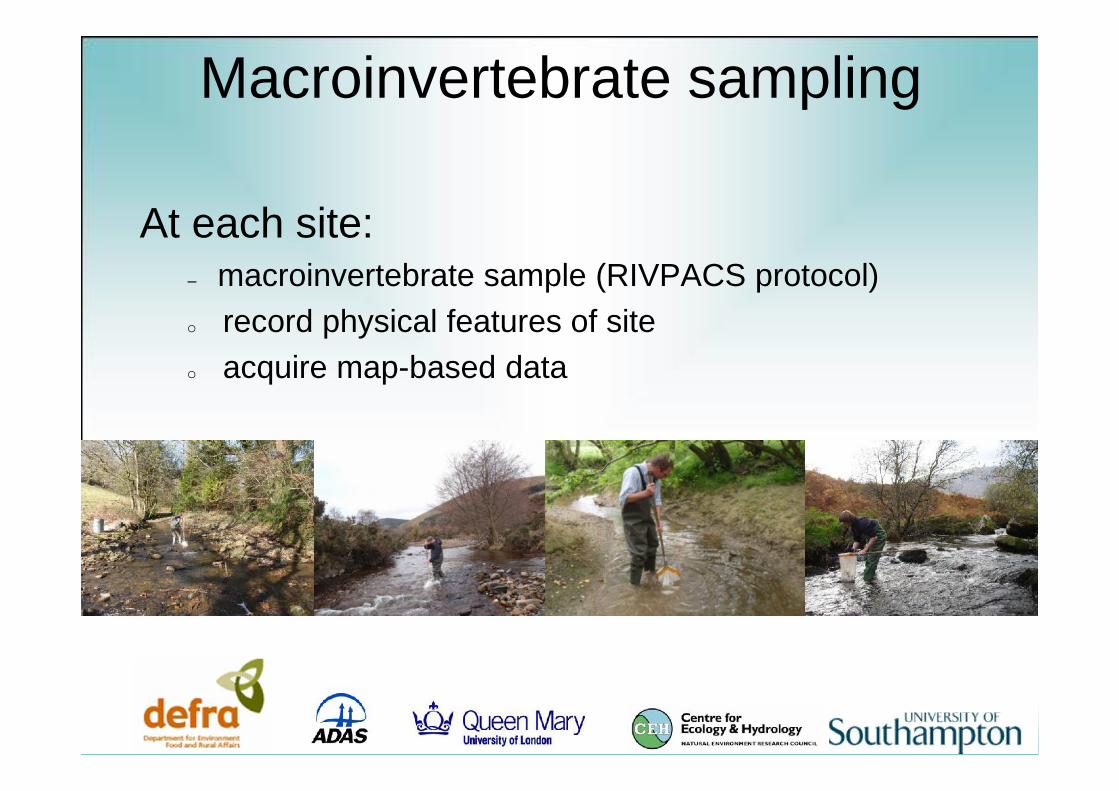
Macroinvertebrate sampling
At each site:– macroinvertebrate sample (RIVPACS protocol)o record physical features of siteo acquire map-based data
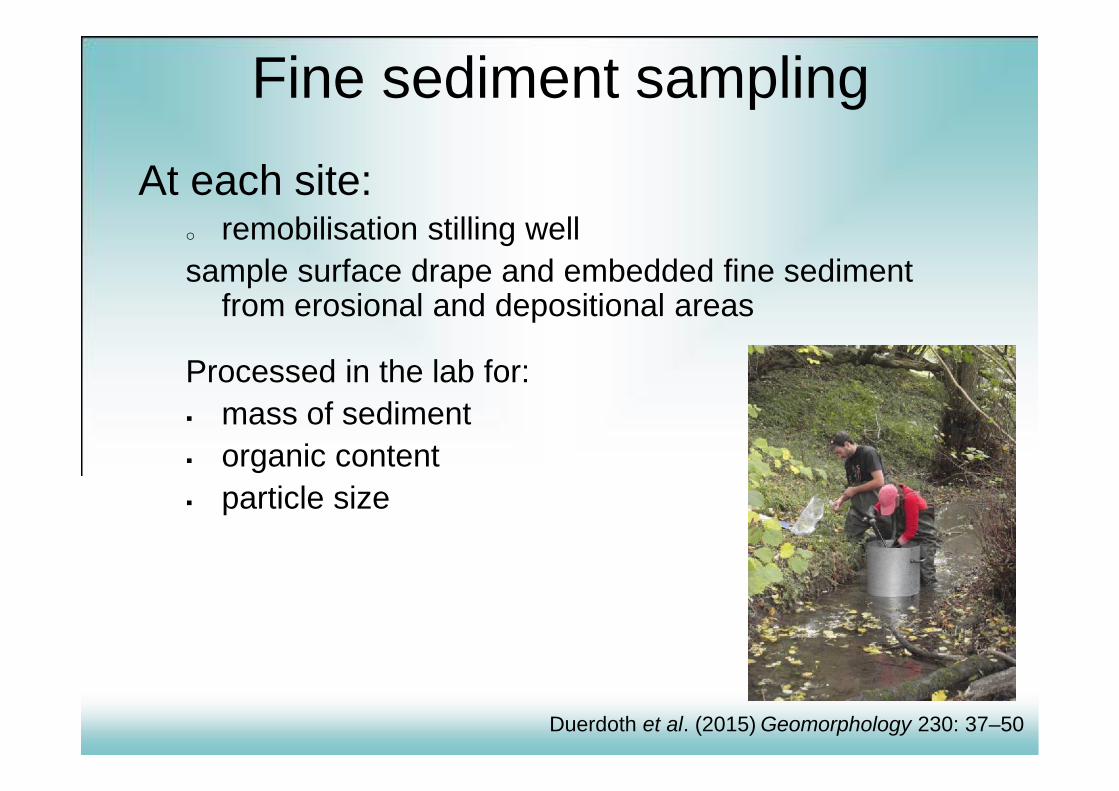
Fine sediment samplingAt each site:
o remobilisation stilling wellsample surface drape and embedded fine sediment
from erosional and depositional areas
Processed in the lab for: mass of sediment organic content particle size
Duerdoth et al. (2015) Geomorphology 230: 37–50

Duerdoth et al. (2015) Geomorphology 230: 37–50
Fine sediment sampling
Reach scale confidence intervals and reproducibility quantified
0
1
2
3
4
5
0 1 2 3 4 5
site mean log10
surface sediment mass (g m-2) site mean log10
total sediment mass (g m-2)
site mean log10
surface non-volatile sediment mass (g m-2) site mean log10
total non-volatile sediment mass (g m-2)
site mean log10
surface volatile sediment mass (g m-2) site mean log10
total volatile sediment mass (g m-2)
surface drape total
sam
ple
log 10
sur
face
sed
imen
t mas
s (g
m-2
)sa
mpl
e lo
g 10 s
urfa
ce n
on-v
olat
ile
sedi
men
t mas
s (g
m-2
)
sam
ple
log 10
sur
face
vol
atile
sed
imen
t
mas
s (g
m-2
)
sam
ple
log 10
tota
l sed
imen
t mas
s (g
m-2
)sa
mpl
e lo
g 10 to
tal n
on-v
olat
ile
sedi
men
t mas
s (g
m-2
)
sam
ple
log 10
tota
l vol
atile
sed
imen
t
mas
s (g
m-2
)a)
b)
c)
95% Confidenceintervals = ±0.237
0
1
2
3
4
5
0 1 2 3 4 5
0
1
2
3
4
5
0 1 2 3 4 5
0
1
2
3
4
5
0 1 2 3 4 5
0
1
2
3
4
5
0 1 2 3 4 5
0
1
2
3
4
5
0 1 2 3 4 5
95% Confidenceintervals = ±0.236
95% Confidenceintervals = ±0.188
95% Confidenceintervals = ±0.235
95% Confidenceintervals = ±0.227
95% Confidenceintervals = ±0.169
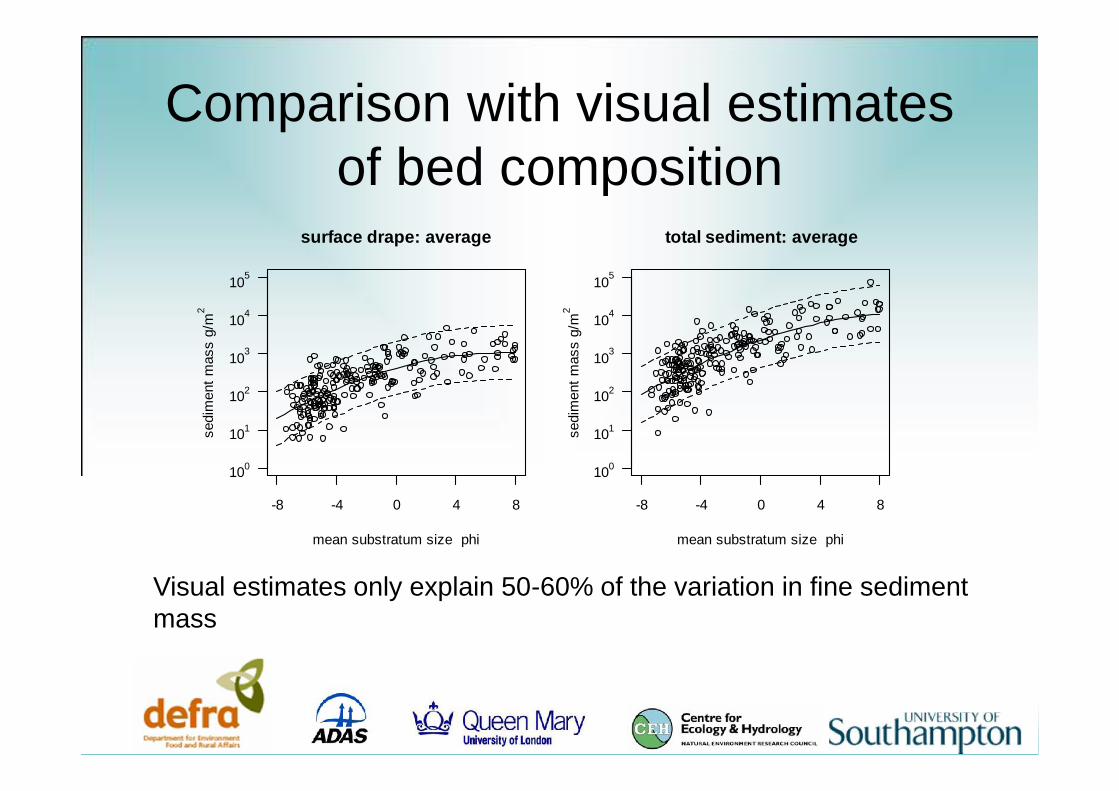
Comparison with visual estimatesof bed composition
surface drape: average
mean substratum size phi
sedi
men
t mas
s g/
m2
-8 -4 0 4 8
100
101
102
103
104
105
total sediment: average
mean substratum size phi
sedi
men
t mas
s g/
m2
-8 -4 0 4 8
100
101
102
103
104
105
Visual estimates only explain 50-60% of the variation in fine sedimentmass

Analytical Approach
Predicted Sediment LoadPredicted Sediment RetentionMeasured Retained SedimentMeasured Sediment Quality
Invertebrate communityrange of sediment loadings
within river types

Analytical Approach
• Association between variation in the macroinvertebratecommunity and the fine sediment stressor gradienthaving first factored out that portion of the biologicalvariation correlated with natural background variation
• Empirical basis for a diagnostic biotic index• Relationship between modelled agricultural fine
sediment inputs, retentiveness of stream reach andbiological condition of the reach quantified
• Link land-use models to WFD water quality status.

Unconfoundedstress gradients
Invertebrate response to fine sediment stress comprises twodistinct components
ToFSIsp – index of response to organic component of finesediment
oFSIsp – index of response to organic component of finesediment
The results of these two indices are then combined
CoFSIsp – combined index of fine sediment stress
Index Development
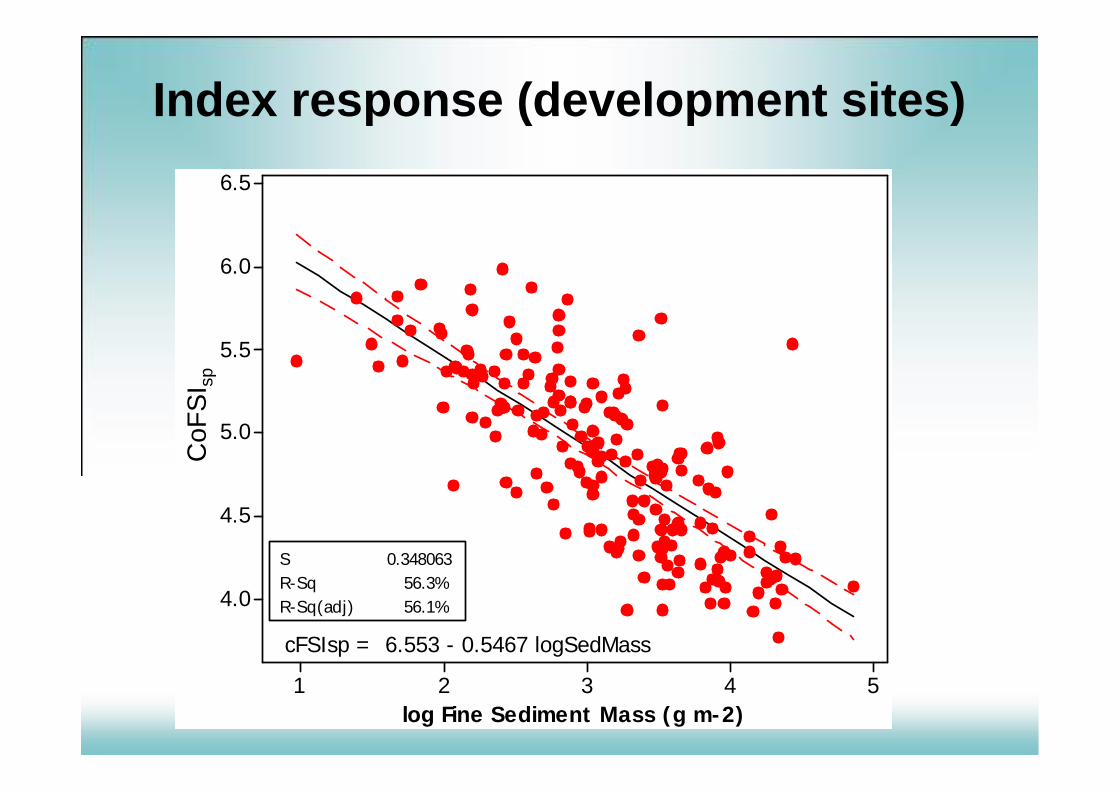
Index response (development sites)
54321
6.5
6.0
5.5
5.0
4.5
4.0
log Fine Sediment Mass (g m-2)
cFSI
sp
S 0.348063R-Sq 56.3%R-Sq(adj) 56.1%
cFSIsp = 6.553 - 0.5467 logSedMass
CoF
SIsp
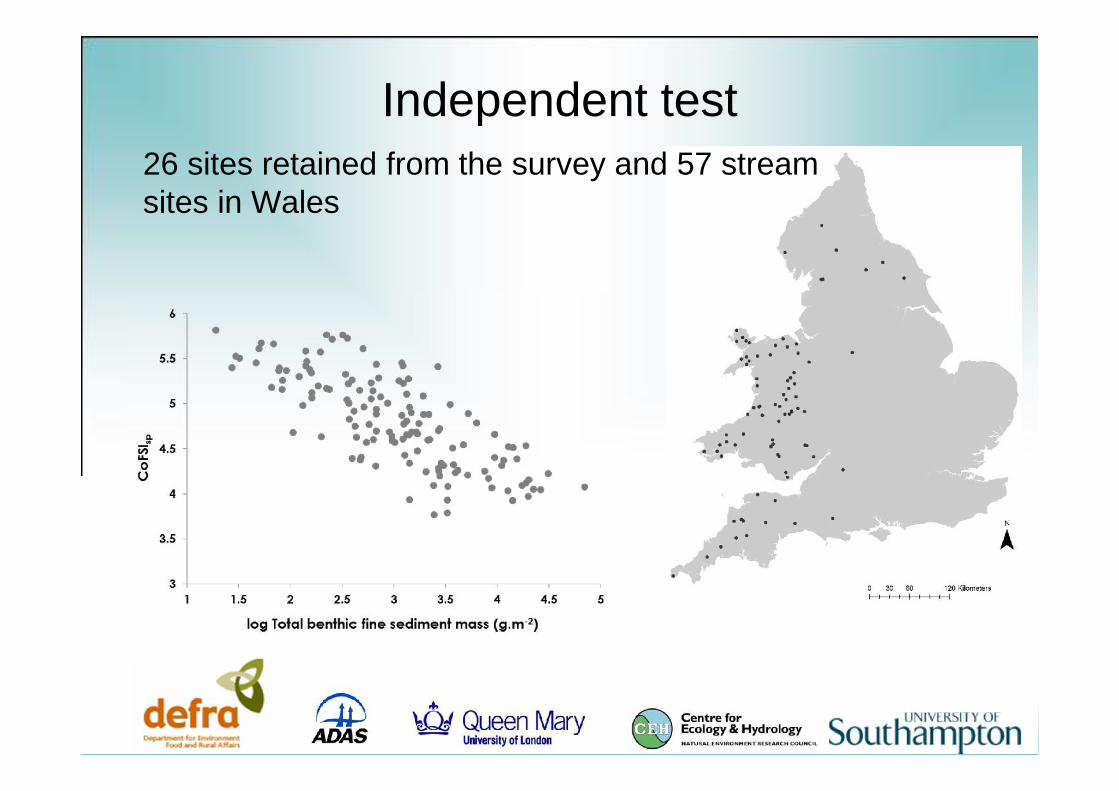
Independent test26 sites retained from the survey and 57 streamsites in Wales

Independent test26 sites retained from the survey and 57 streamsites in Wales
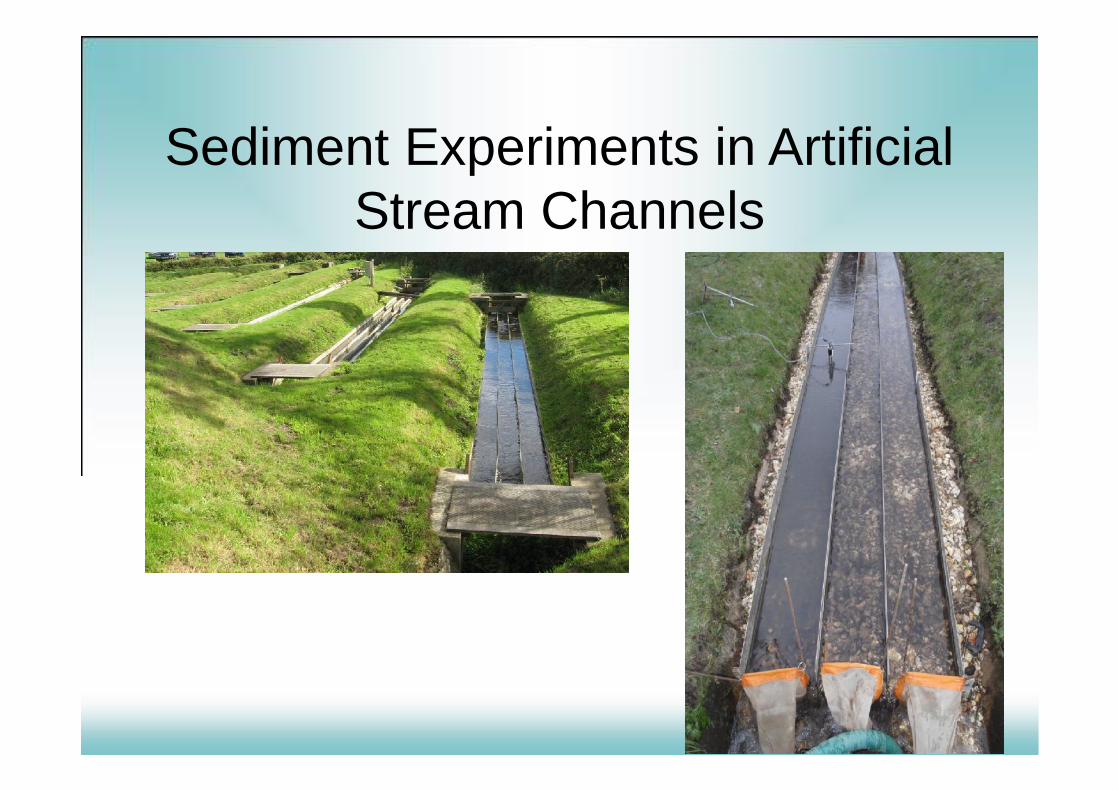
Sediment Experiments in ArtificialStream Channels

Jones et al. (2015) Freshwater BiologyGrowns et al. (submitted)
Response variablesTurbidityDeposited Sediment MassOxygen PenetrationHyporheic ChemistryInteraction with Flow
DriftCommunity CompositionIndex ValuesTrait CompositionHyporheic Invertebrates
CONTROL MODERATE HIGH

Control Moderate High0
2
4
6
8
10
12
14
16
18
Before After
Taxo
n R
ichn
ess
Control Moderate High0
0.5
1
1.5
2
a) b)
e)
Control Moderate High0
0.5
1
1.5
2
2.5
3
3.5
4
4.5
5
Log 10
Indi
vidu
als
PS
I sp
AS
PT
cFS
I sp
ToFS
I sp
Control Moderate High0
5
10
15
20
25
30
35
Control Moderate High0
0.5
1
1.5
2
2.5
3
3.5
4
4.5
5
Control Moderate High0
1
2
3
4
5
c) d)
f)
CoFSIsp index performs wellPSI index unstable
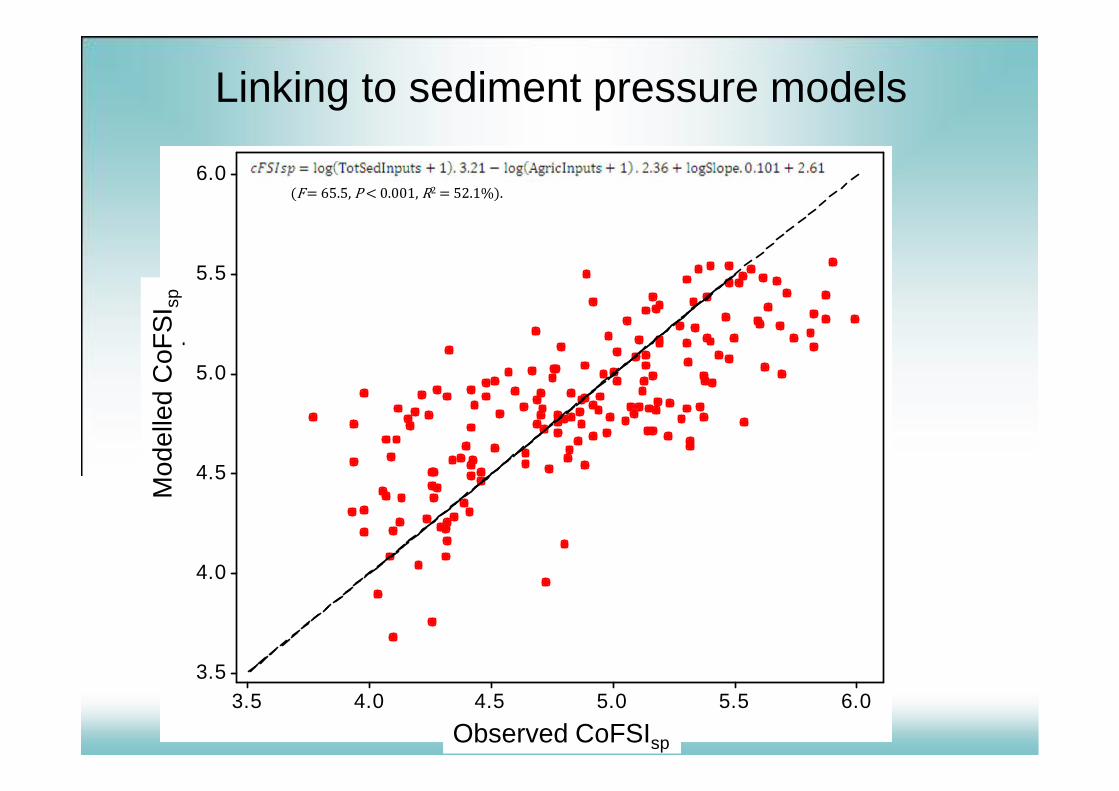
Linking to sediment pressure models
6.05.55.04.54.03.5
6.0
5.5
5.0
4.5
4.0
3.5
Observed cFSIsp
Mo
del
led
cFS
Isp
(F= 65.5, P< 0.001, R2 = 52.1%).M
odel
led
CoF
SIsp
Observed CoFSIsp
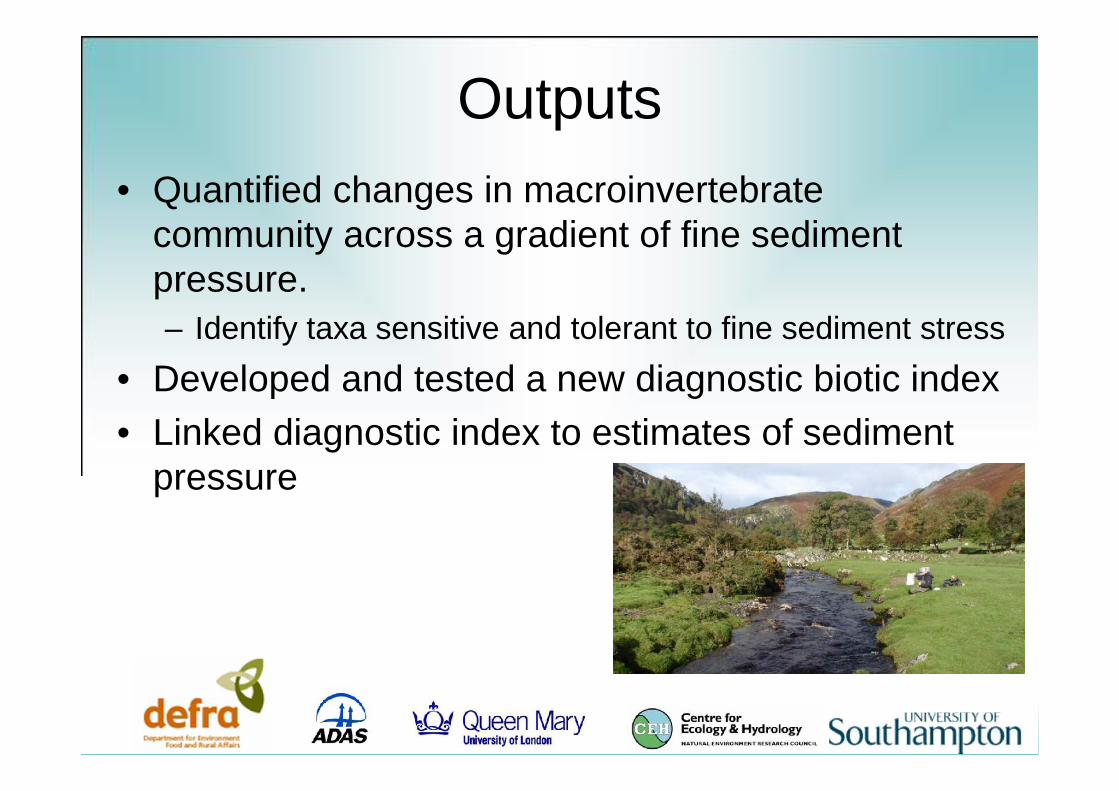
Outputs• Quantified changes in macroinvertebrate
community across a gradient of fine sedimentpressure.– Identify taxa sensitive and tolerant to fine sediment stress
• Developed and tested a new diagnostic biotic index• Linked diagnostic index to estimates of sediment
pressure

New Modelling Framework daily time step
use of weather data (as opposed to climatic mean) explicit representation of pathways (tramlines,
compaction, etc) explicit representation of crops and rotations drain flow connectivity and retention:
field boundaries types particle size distribution and selectivity
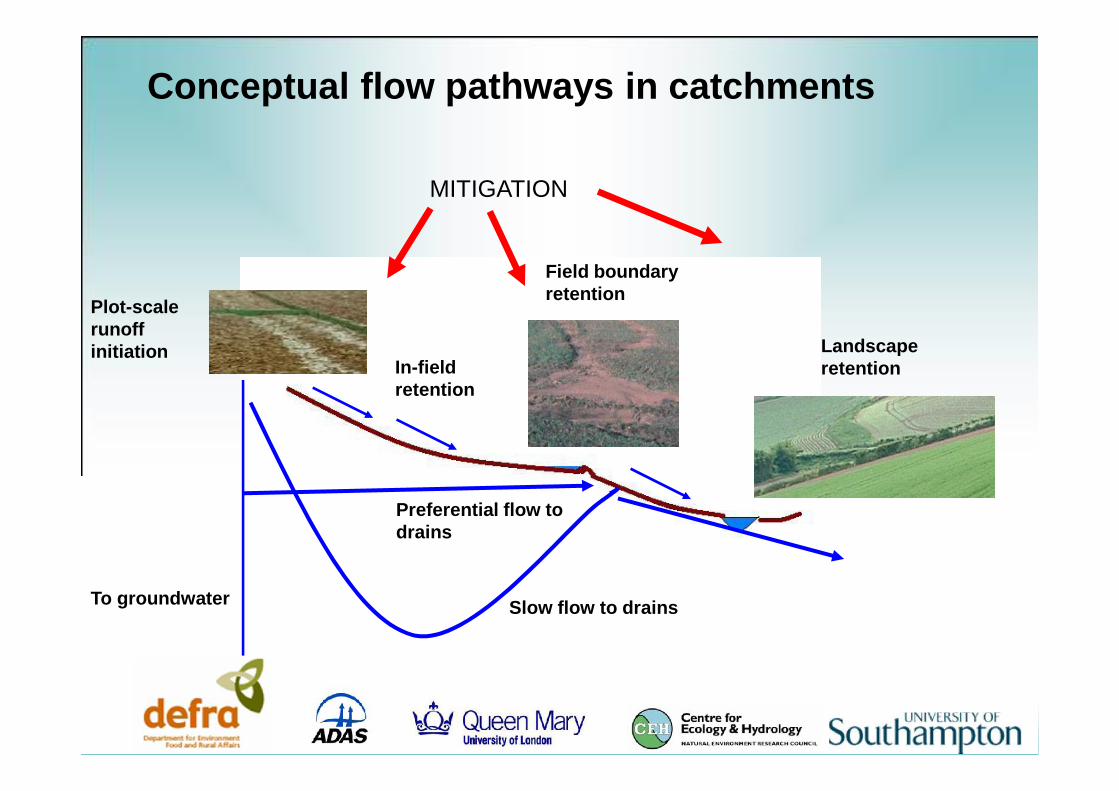
Conceptual flow pathways in catchments
Preferential flow todrains
Slow flow to drainsTo groundwater
Plot-scalerunoffinitiation
Field boundaryretention
LandscaperetentionIn-field
retention
MITIGATION
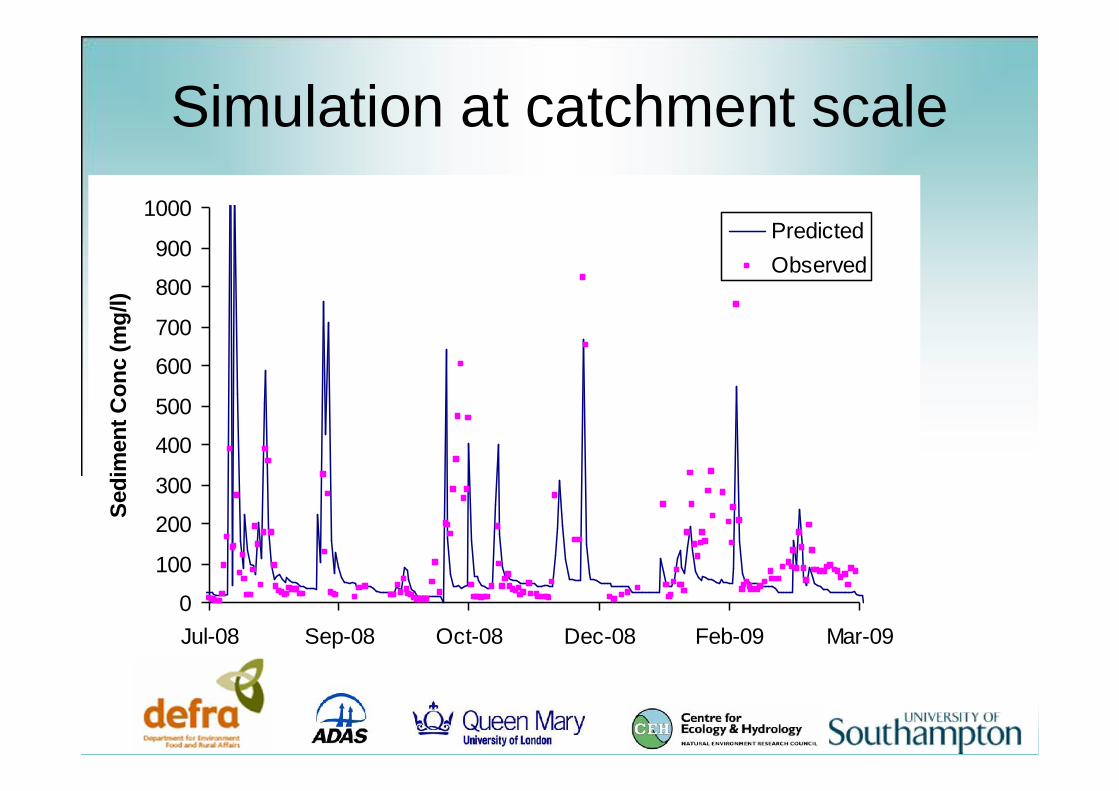
Simulation at catchment scale
0
100
200
300
400
500
600
700
800
900
1000
Jul-08 Sep-08 Oct-08 Dec-08 Feb-09 Mar-09
Sedi
men
t Con
c (m
g/l)
PredictedObserved

• Downscale catchment scale processes to the channel reachand redd scales
• use of a hydraulic sediment routing model to link network toreach scales
In-channel sediment routing
Catchment Reach Redd> 1 km2 100-50 m
< 1 m
Psychic SIDO-UKRouting
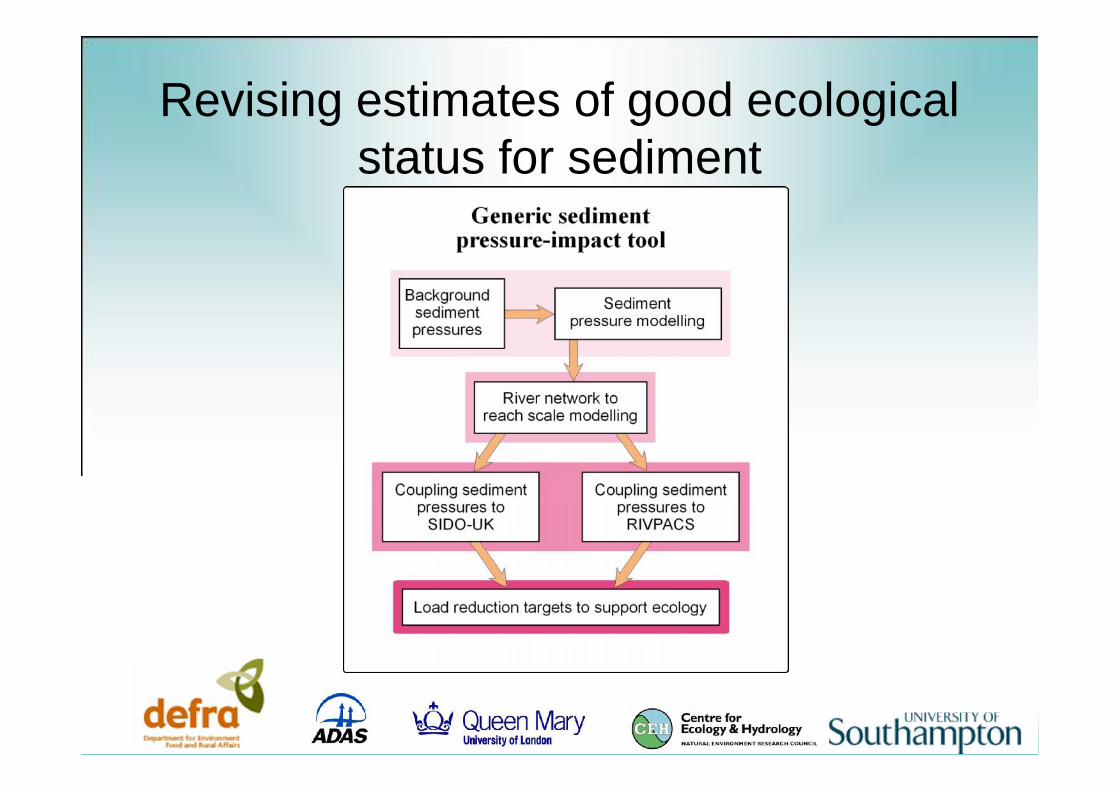
Revising estimates of good ecologicalstatus for sediment
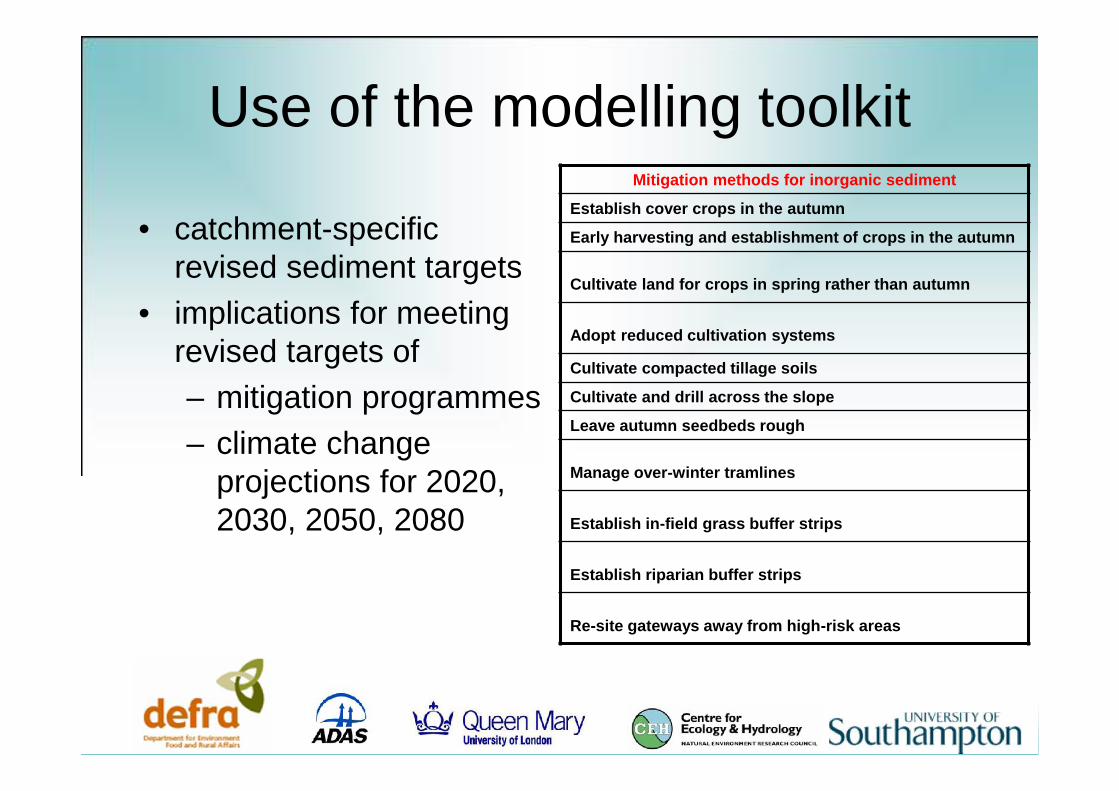
Use of the modelling toolkit
• catchment-specificrevised sediment targets
• implications for meetingrevised targets of– mitigation programmes– climate change
projections for 2020,2030, 2050, 2080
Mitigation methods for inorganic sediment
Establish cover crops in the autumn
Early harvesting and establishment of crops in the autumn
Cultivate land for crops in spring rather than autumn
Adopt reduced cultivation systems
Cultivate compacted tillage soils
Cultivate and drill across the slope
Leave autumn seedbeds rough
Manage over-winter tramlines
Establish in-field grass buffer strips
Establish riparian buffer strips
Re-site gateways away from high-risk areas

Modelling toolkit for managing theproblem
• Ecological status linked to land-use modelsto enable managers to explore outcome ofagricultural mitigation options
• Better targeting of mitigation

0
1
2
3
4
5
6
Fast Slow
Clean
Dirty
Num
bero
ftax
a
Flow
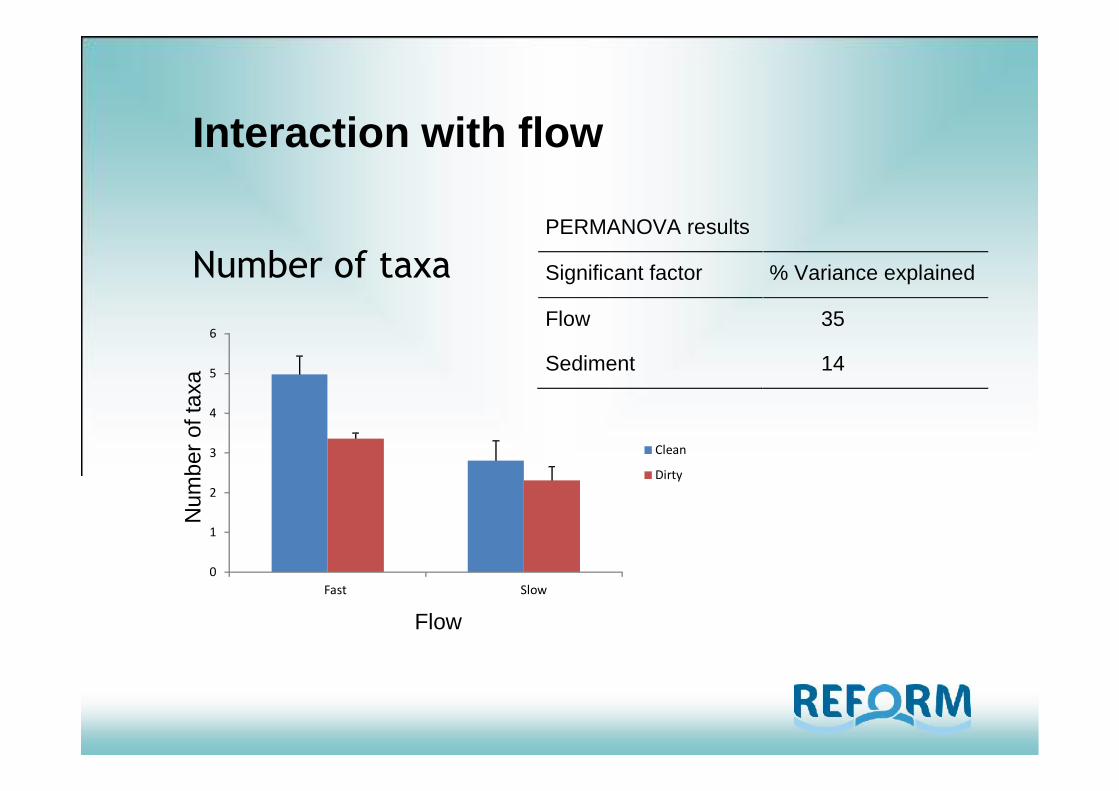
Number of taxaPERMANOVA results
Significant factor % Variance explained
Flow 35
Sediment 14
Interaction with flow
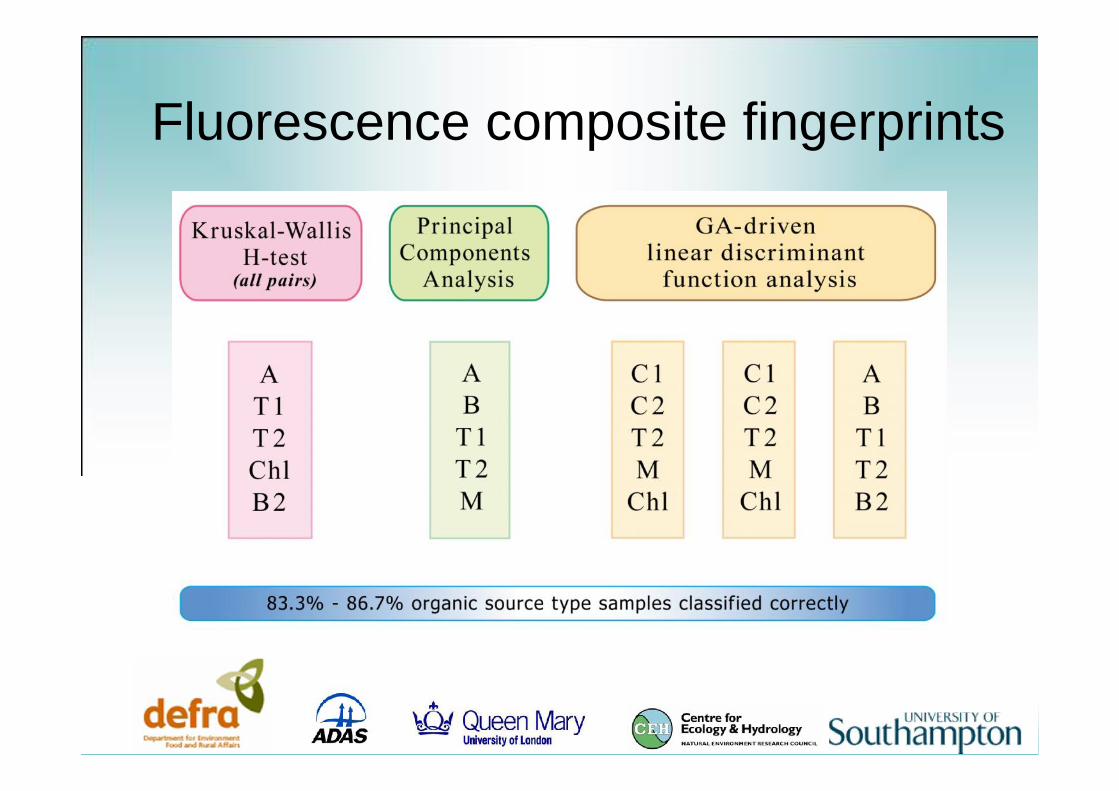
Fluorescence composite fingerprints