Embed Size (px)
Citation preview

Marina Herrera-Pantoja
Julio 2014

Wetlands provide valuable
hydrological, biochemical
and climatic functions that
are essential for supporting
the world’s biodiversity
In Britain, the high species
richness of wetlands in
East Anglia, support 20%
of all nationally rare and
40% of nationally scarce
vascular plants

1637 1825 1934 20030
500
1000
1500
2000
2500
3000
3500
km
² o
f w
etl
an
d
year
History of East Anglia Fenlands
since 1600s
There has been a dramatic loss of wetlands
and now climate change are expected to disrupt
these fragile ecosystems
Smoothed figures based on 10 years moving averages
1-
0.75-
0.5-
0.25-
0-
-0.25-
-.5-
-0.75-
-1-
1772 1792 1812 1832 1852 1872 1892 1912 1932 1952 1972 1992
An
om
aly
(°C
) fr
om
1961
-90 a
vera
ge
Central England Global
Smoothed figures based on 10 years moving averages
1-
0.75-
0.5-
0.25-
0-
-0.25-
-.5-
-0.75-
-1-
1772 1792 1812 1832 1852 1872 1892 1912 1932 1952 1972 1992
An
om
aly
(°C
) fr
om
1961
-90 a
vera
ge
Central England Global

N
Breckland
Breckland is a natural habitat which
comprises a group of fluctuating meres
fed by groundwater from the underlying
Chalk aquifer
These meres have unique
hydrogeological characteristics which
advantage a number of rare species
that require low competition and low
nutrient levels

Open water area Swamp area Fen area
A1 - A4 S1 - S2 - S4 M9 - M13 - M22 - M24 Vegetation
Community
ZoneOpen water area Swamp area Fen area
A1 - A4 S1 - S2 - S4 M9 - M13 - M22 - M24 Vegetation
Community
ZoneOpen water area Swamp area Fen area
A1 - A4 S1 - S2 - S4 M9 - M13 - M22 - M24 Vegetation
Community
ZoneOpen water area Swamp area Fen area
A1 - A4 S1 - S2 - S4 M9 - M13 - M22 - M24 Vegetation
Community
Zone
Generalised zonation of wetland vegetation in a typical habitat in
East Anglia indicating the National Vegetation Classification plant
communities (Rodwell, 1991; Fojt, 1994; 1995; Wheeler and
Proctor, 2000)
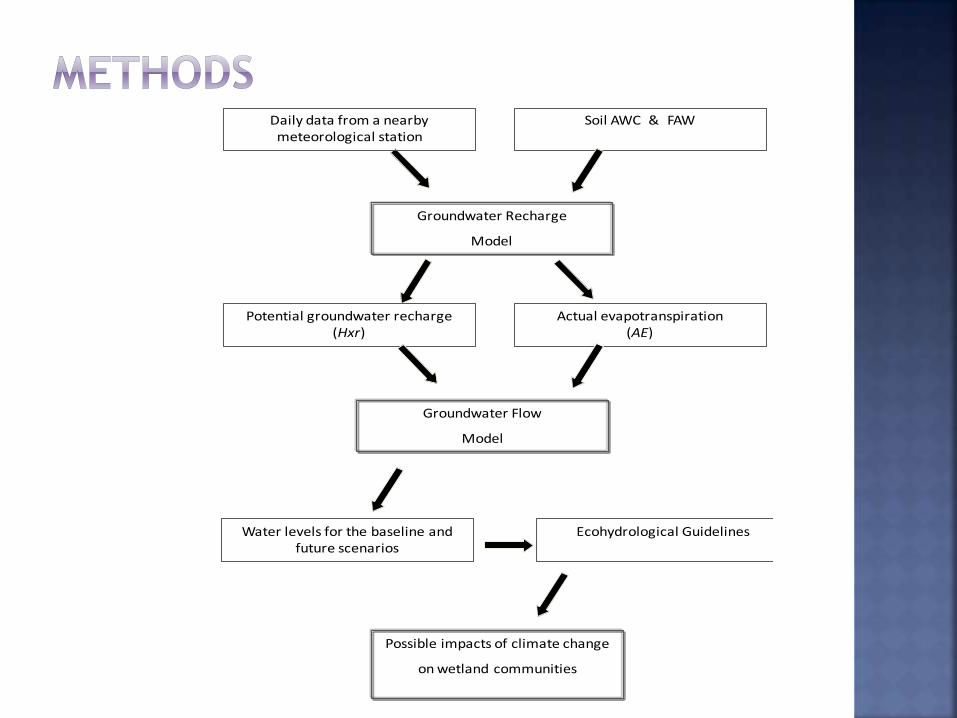
Soil AWC & FAW
Groundwater Recharge
Model
Daily data from a nearby meteorological station
Potential groundwater recharge (Hxr)
Actual evapotranspiration(AE)
Groundwater Flow
Model
Water levels for the baseline and future scenarios
Ecohydrological Guidelines
Possible impacts of climate change
on wetland communities

Fowlmere
boreholes
Predicted water table contours
Groundwater flow
Z
Fowlmere
boreholes
Predicted water table contours
Groundwater flow
Z
During the 2080s the mean water table is almost 0.9 m lower than the baseline mean value and the lowest of the three modelled scenarios
The persistence of future dry periods could lead to a loss of wetland communities and increased representation of drylandspecies.

Mean
water table
(m AOD )
Minimum
water table
(m AOD)
Duration of
low water table
(months)
Maximum
water table
(m AOD)
Duration of
hight water
table (months)
Likely impact on
wetland communities
Baseline 30.74 28.68 12 33.85 3
2020s 31.06 27.98 24 33.76 2 Changes towards swamp-like stands
2050s 30.79 29.35 9 36.85 6 Recovery of rare and local plant species
2080s 29.84 27.91 61 32.03 0 Loss of wetlands communities
Simulated water levels in a wetland fed by an unconfined Chalk
aquifer during the baseline period (1961-1990) and the 2020s,
2050s and 2080s future periods of the ‘high’ gas emissions
scenario and their likely impacts on groundwater dependent
wetland communities in East Anglia

Climate change may alter groundwater recharge provoking changes in the elevation of the water table in unconfined Chalk aquifers in East Anglia.
The persistence of future dry periods with associated low groundwater recharge during the latter part of this century will potentially increase pressures on groundwater dependent wetlands.
The predicted fall in wetland water level by the end of this century may have a greater impact on those mere species with a small tolerance to dry conditions.
Although species may adapt themselves to climate change planned adaptation can provide opportunities for protection of endanger species

ACKNOWLEDGEMENTS
Mexican National Council for Science and Technology (CONACYT)
Climatic Research Unit, University of East Anglia


![Mhp Gold The Automated Mhp Mgr[1].Revised](https://img.dokumen.tips/doc/110x75/55c343e3bb61ebe9438b45a3/mhp-gold-the-automated-mhp-mgr1revised-55c4568e3551f.jpg)