Embed Size (px)
Citation preview
Remote Sensing for Coastal
Hazards
Dr. D. Mitra
Marine and Atmospheric Sciences Department
IIRS, Dehradun
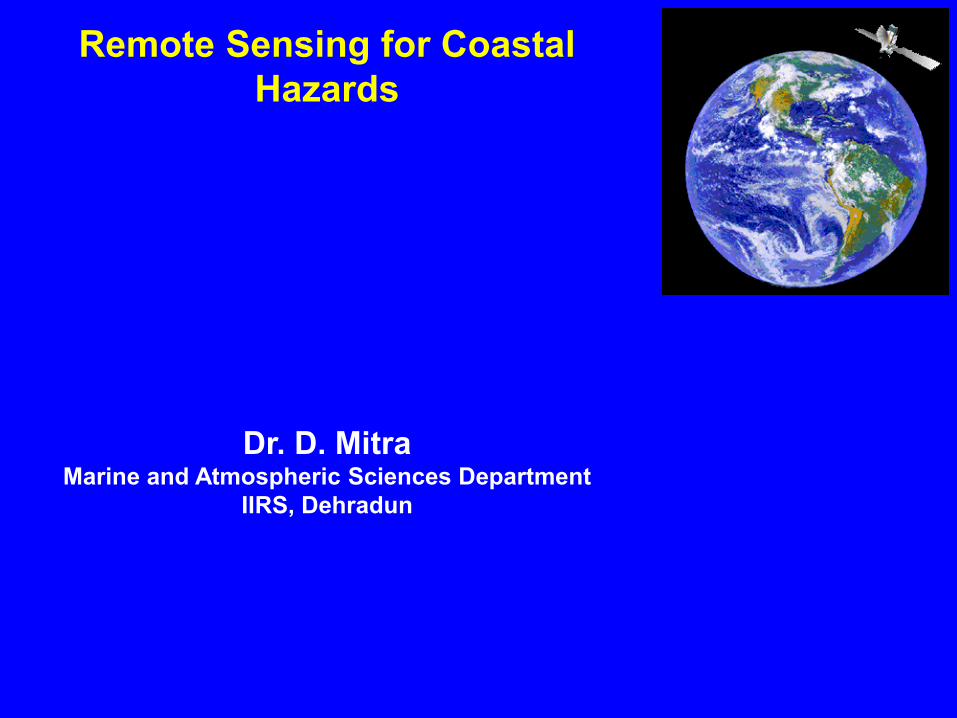
NATIONAL SPACE SYSTEMS
Communication Remote Sensing
INSAT Series of IRS Series of
Satellites Satellites
Meteorology Radio/TV Broadcast Disaster Warning,
Search & Rescue System,
Natural Resources Monitoring and Management, Hazard &
Risk Assessment, Relief, Drainage Assessment and
Rehabilitation
Space Technology for National Development
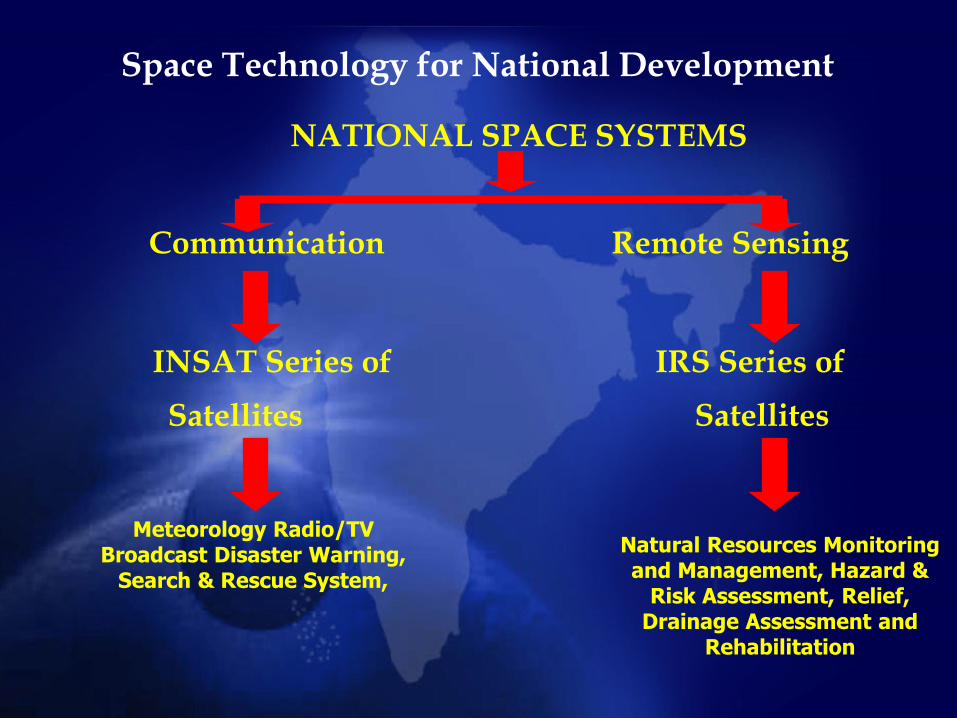
Why satellite survey ?
The major components of application of satellite based data are:
•Detection, monitoring and forecasting (Preparedness)
• Monitor the event during time of occurrence (Disaster event)
•Damage assessment (Relief)
•Hazard zonation (Rehabilitation, reconstruction, mitigation and
prevention)
Only means of getting accurate, reliable and quick information due to
synoptic view and multi-temporal coverage from various space-borne
sensors with different capabilities

Disaster Management Cycle
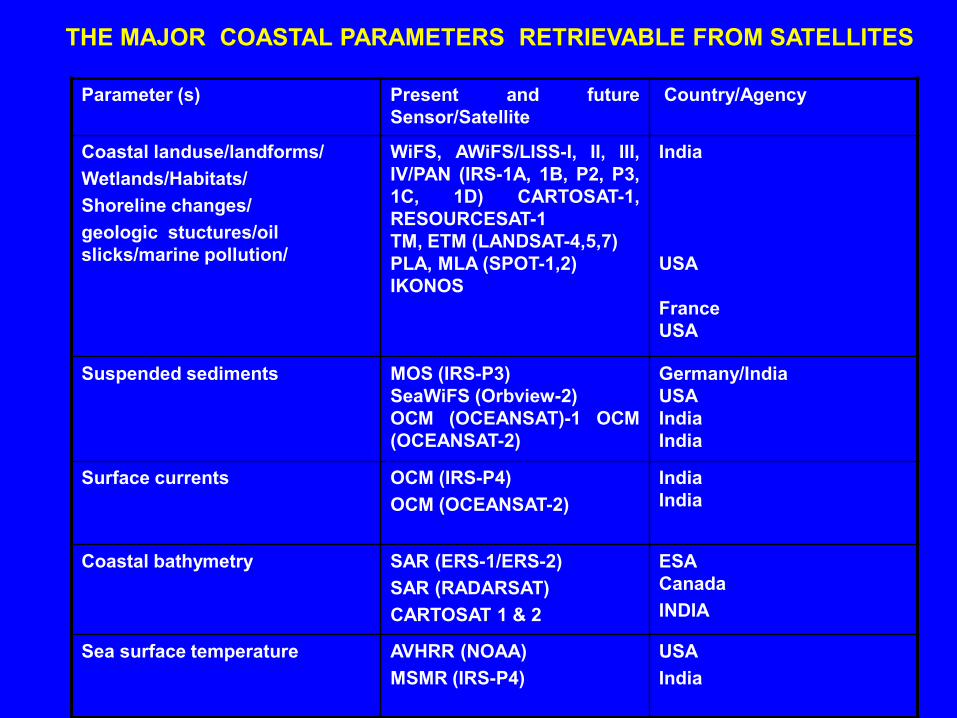
Parameter (s) Present and future
Sensor/Satellite
Country/Agency
Coastal landuse/landforms/
Wetlands/Habitats/
Shoreline changes/
geologic stuctures/oil
slicks/marine pollution/
WiFS, AWiFS/LISS-I, II, III,
IV/PAN (IRS-1A, 1B, P2, P3,
1C, 1D) CARTOSAT-1,
RESOURCESAT-1
TM, ETM (LANDSAT-4,5,7)
PLA, MLA (SPOT-1,2)
IKONOS
India
USA
France
USA
Suspended sediments MOS (IRS-P3)
SeaWiFS (Orbview-2)
OCM (OCEANSAT)-1 OCM
(OCEANSAT-2)
Germany/India
USA
India
India
Surface currents OCM (IRS-P4)
OCM (OCEANSAT-2)
India
India
Coastal bathymetry SAR (ERS-1/ERS-2)
SAR (RADARSAT)
CARTOSAT 1 & 2
ESA
Canada
INDIA
Sea surface temperature AVHRR (NOAA)
MSMR (IRS-P4)
USA
India
THE MAJOR COASTAL PARAMETERS RETRIEVABLE FROM SATELLITES

Parameter (s) Present and future
Sensor/Satellite
Country/Agency
Wave height Altimeter
(ERS-1/ERS-2)
(OCEANSAT-2)
ESA
India
Wave direction SAR (ERS-1/ERS-2)
SAR (RADARSAT)
ESA
Canada
Wave length SAR (ERS-1/ERS-2)
SAR (RADARSAT)
ESA
Canada
Surface Wind speed Scatterometer (ERS-1/ERS-2)
MSMR (IRS-P4)
ESA
India
Surface wind direction
SAR (ERS-1/ERS-2)
SAR (RADARSAT)
ESA
Canada
Sea surface topography Altimeter
(ERS-1/ERS-2)
(GEOSAT)
(TOPEX)
(POSEIDON)
(OCEANSAT-2)
ESA
ESA
USA
USA
USA
INDIA
Chlorophyll MOS (IRS-P3)
SeaWiFS (Orbview-2)
OCM (OCEANSAT)-1 OCM
(OCEANSAT-2)
Germany/India
USA
India
India

Sept.-Oct. 1999 7
COASTAL ZONE
The coastal zone is the transitional area between land and sea. It
is a band rather than a line. The width of the band varies from
place to place and is determined by the interaction of marine
and terrestrial processes.
The zone occupies less than 15% of the Earth's land surface.
Only 40% of the one million km of coast-line is accessible and
temperate enough to be habitable. Yet it accommodates more
than 60% of the world's population.
See: UNCED 1992, Agenda 21, Chapter 17 (Oceans).
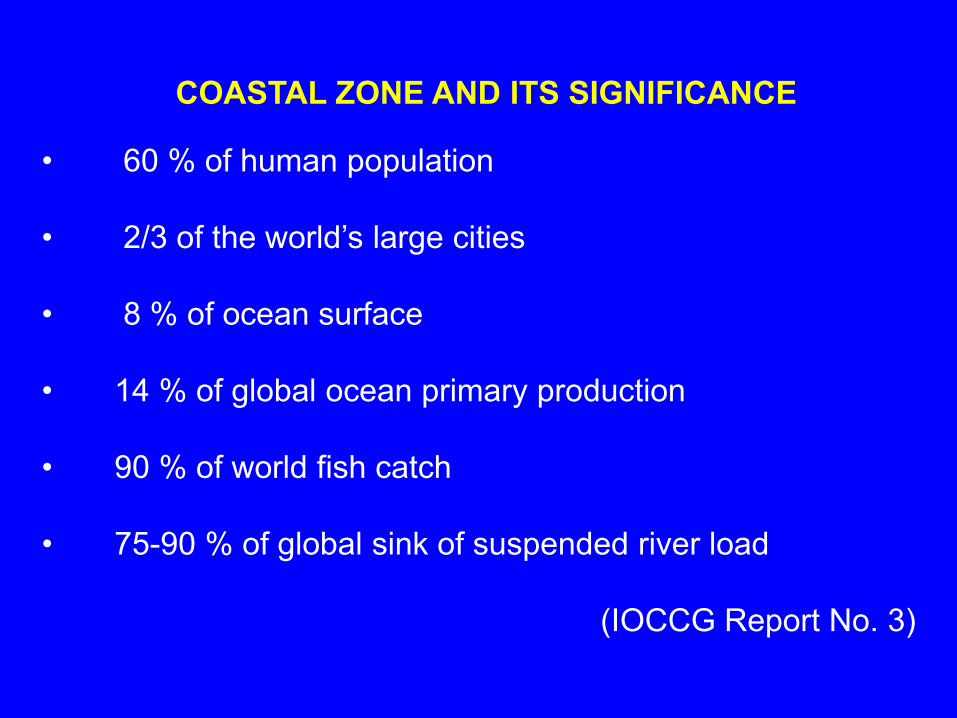
• 60 % of human population
• 2/3 of the world’s large cities
• 8 % of ocean surface
• 14 % of global ocean primary production
• 90 % of world fish catch
• 75-90 % of global sink of suspended river load
(IOCCG Report No. 3)
COASTAL ZONE AND ITS SIGNIFICANCE
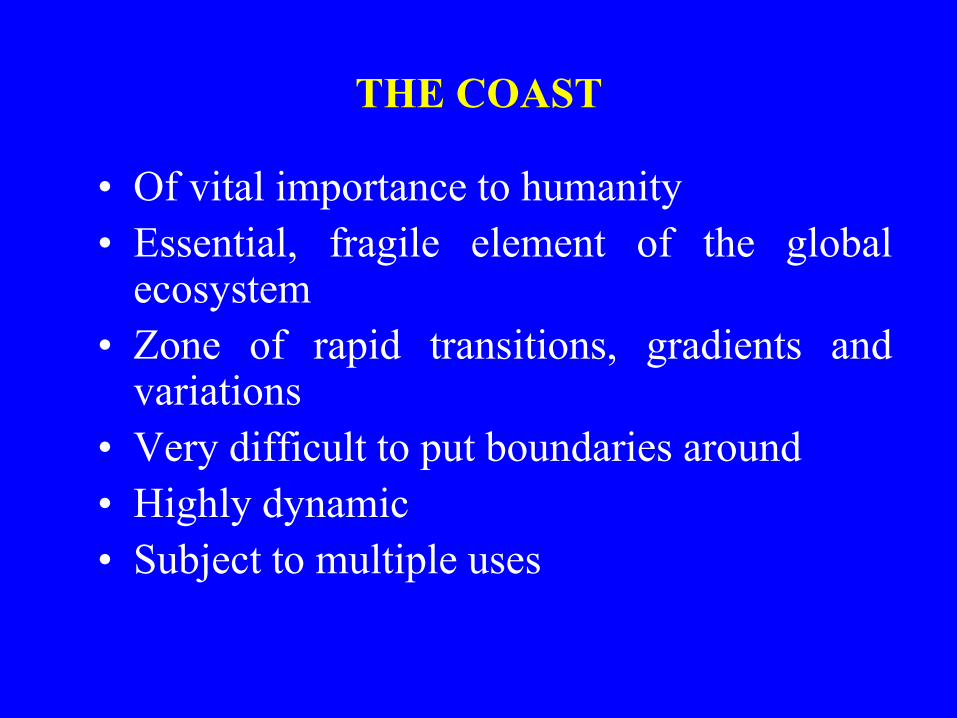
THE COAST
• Of vital importance to humanity
• Essential, fragile element of the global ecosystem
• Zone of rapid transitions, gradients and variations
• Very difficult to put boundaries around
• Highly dynamic
• Subject to multiple uses
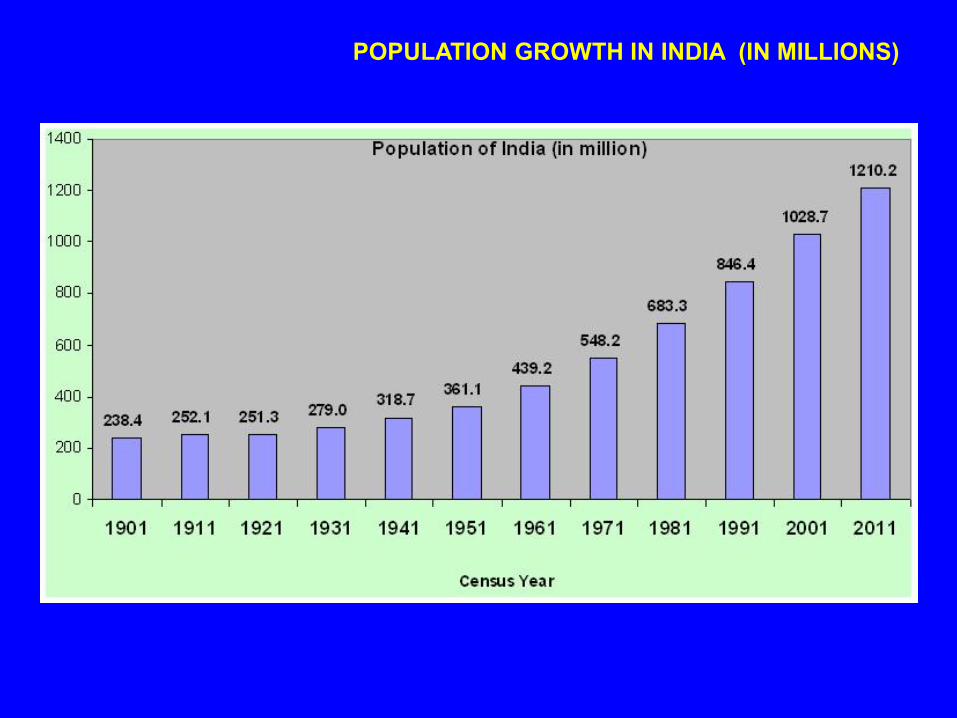
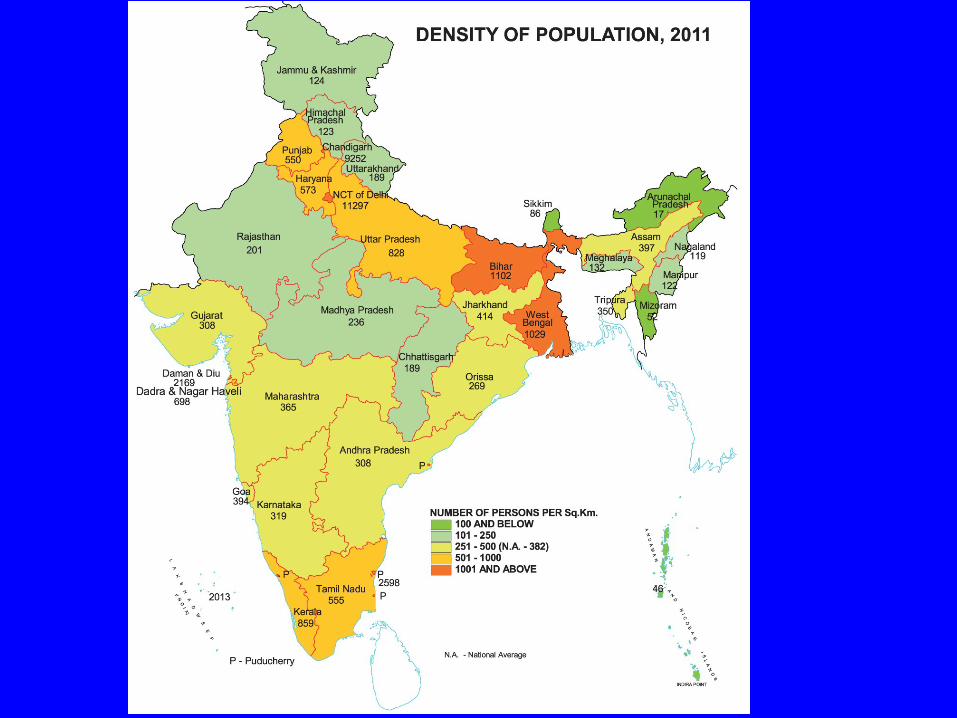
POPULATION GROWTH IN INDIA (IN MILLIONS)
0
2000
4000
6000
8000
10000
12000
14000
1 2 3
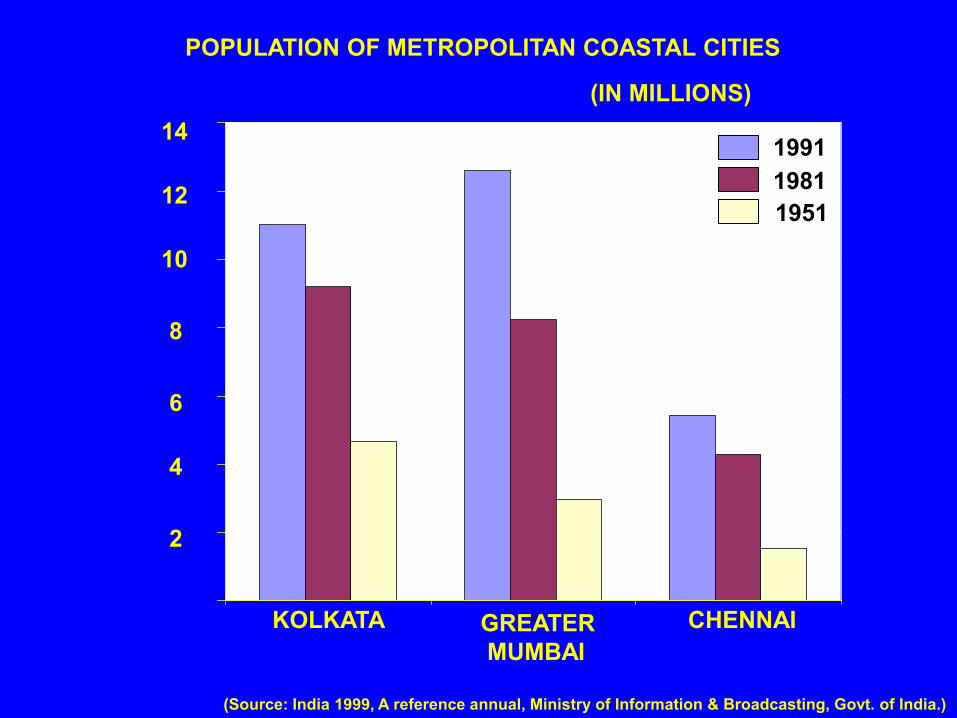
POPULATION OF METROPOLITAN COASTAL CITIES
(IN MILLIONS)
KOLKATA GREATER
MUMBAI
CHENNAI
1991
1981
1951
(Source: India 1999, A reference annual, Ministry of Information & Broadcasting, Govt. of India.)
14
12
10
8
6
4
2

Application of space technology in coastal disaster management
Disaster
Preparedness Relief Mitigation/Prevention
Cyclone Detection, monitoring and
communicating
Map extent of damage Early warning
strategies and their
implementation
Flood Flood forecasting and
communicating
Mapping peak flood
inundation areas,
identifying areas for
dropping relief aid,
setting up
communication links
Mapping sequential
inundation phases,
geomorphological
mapping of the flood
prone areas,
identification of the
vulnerable areas,
Earthquake Data base preparation within
the known seismic active
zones, detection of surface
deformation
Identification of large
associated features due
to fault rupture, damage
due to ground shaking,
liquefaction, landslides,
fires and floods
Mapping of active faults,
measurement of fault
displacements,
identification of risk
zones
Landslide Forecasting rainfall,
Monitoring the vulnerable
zones and communicating
Damage assessment Inventory of past
landslides, landslide
hazard zonation using
integrated approach
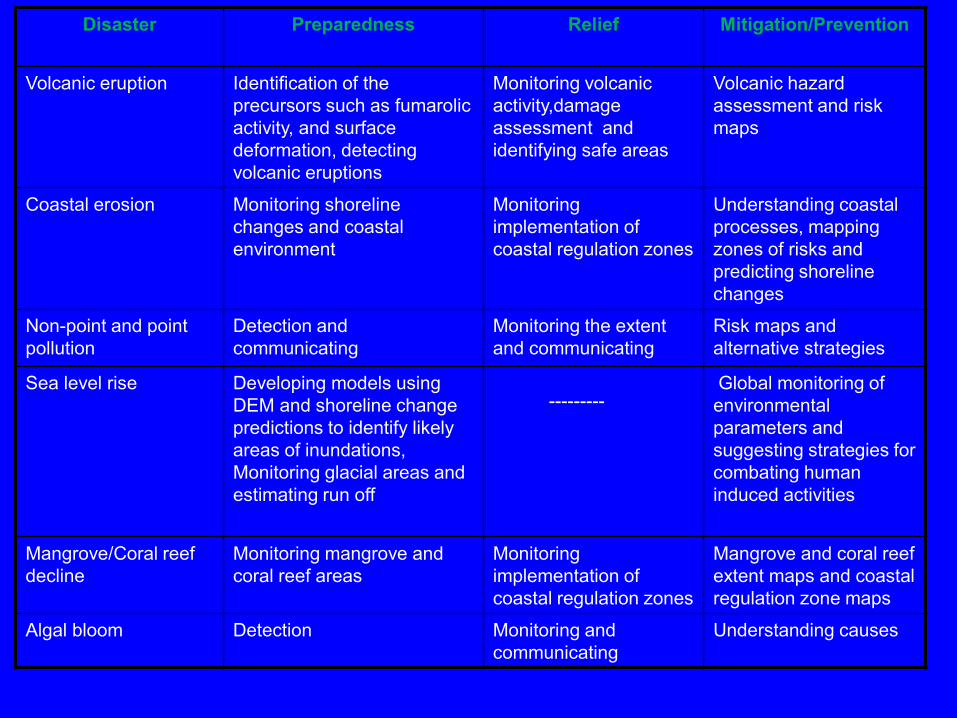
Disaster
Preparedness Relief Mitigation/Prevention
Volcanic eruption Identification of the
precursors such as fumarolic
activity, and surface
deformation, detecting
volcanic eruptions
Monitoring volcanic
activity,damage
assessment and
identifying safe areas
Volcanic hazard
assessment and risk
maps
Coastal erosion Monitoring shoreline
changes and coastal
environment
Monitoring
implementation of
coastal regulation zones
Understanding coastal
processes, mapping
zones of risks and
predicting shoreline
changes
Non-point and point
pollution
Detection and
communicating
Monitoring the extent
and communicating
Risk maps and
alternative strategies
Sea level rise Developing models using
DEM and shoreline change
predictions to identify likely
areas of inundations,
Monitoring glacial areas and
estimating run off
---------
Global monitoring of
environmental
parameters and
suggesting strategies for
combating human
induced activities
Mangrove/Coral reef
decline
Monitoring mangrove and
coral reef areas
Monitoring
implementation of
coastal regulation zones
Mangrove and coral reef
extent maps and coastal
regulation zone maps
Algal bloom Detection Monitoring and
communicating
Understanding causes

15
COASTAL HAZARDS – MAIN TYPES
Short term:
A. Cyclone - hurricane - typhoon
B. Tsunami
C. Flash flooding from river
Long term:
D. Land subsidence
E. Sea level rise
F. Coastal Erosion

Definitions : Coastal Hazards
Cyclone An atmospheric closed circulation rotating counter-clockwise in the
Northern Hemisphere and clockwise in the Southern Hemisphere.
Storm Surge An abnormal rise in sea level accompanying a cyclone or other
intense storm, and whose height is the difference between the observed level of
the sea surface and the level that would have occurred in the absence of the
cyclone. Storm surge is usually estimated by subtracting the normal or
astronomic high tide from the observed storm tide.
Storm Tide The actual level of sea water resulting from the astronomic tide
combined with the storm surge.
17
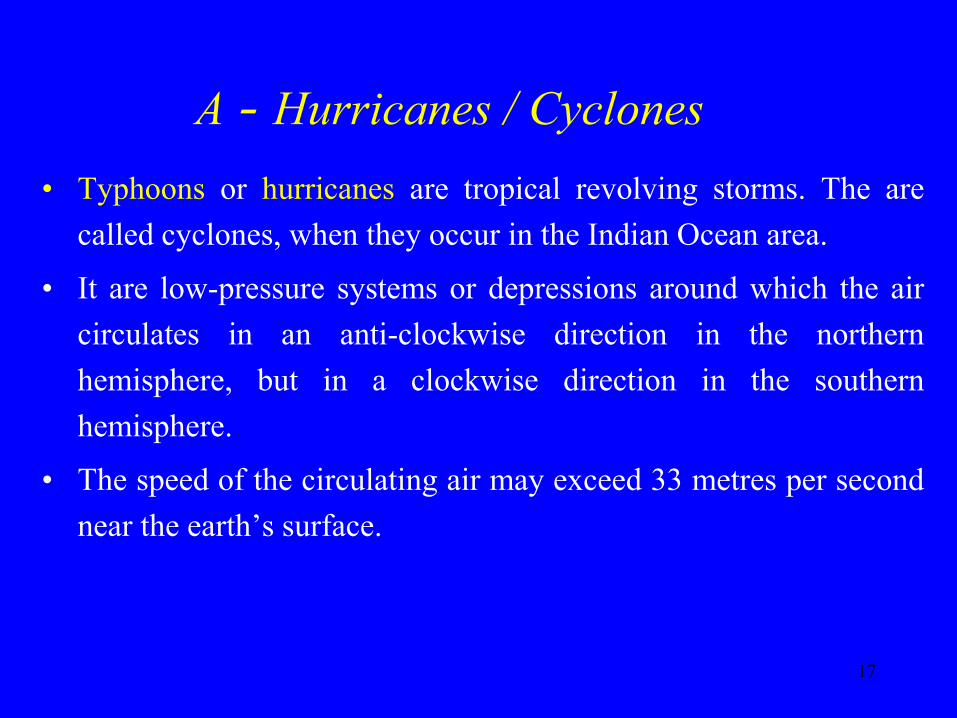
• Typhoons or hurricanes are tropical revolving storms. The are
called cyclones, when they occur in the Indian Ocean area.
• It are low-pressure systems or depressions around which the air
circulates in an anti-clockwise direction in the northern
hemisphere, but in a clockwise direction in the southern
hemisphere.
• The speed of the circulating air may exceed 33 metres per second
near the earth’s surface.
A - Hurricanes / Cyclones

Tropical Cyclone
Strong Winds Storm Surge Heavy Rain
Sea Level Rise
Damage to Flooding
Structures
Loss of Life
Destruction of Crops
IMPACT OF CYCLONE ON LANDFALL

0
20
40
60
80
100
120
1 2 3 4 5 6 7 8 9 10 11 12
BAY OF BENGALARABIAN SEA
Jan. Feb. Mar. Apr. May June July Aug. Sept. Oct. Nov. Dec.
120
100
80
60
40
20
0
MONTH-WISE FREQUENCY OF CYCLONIC STORM FROM 1891-1999
(Total 456)
(Total 123)
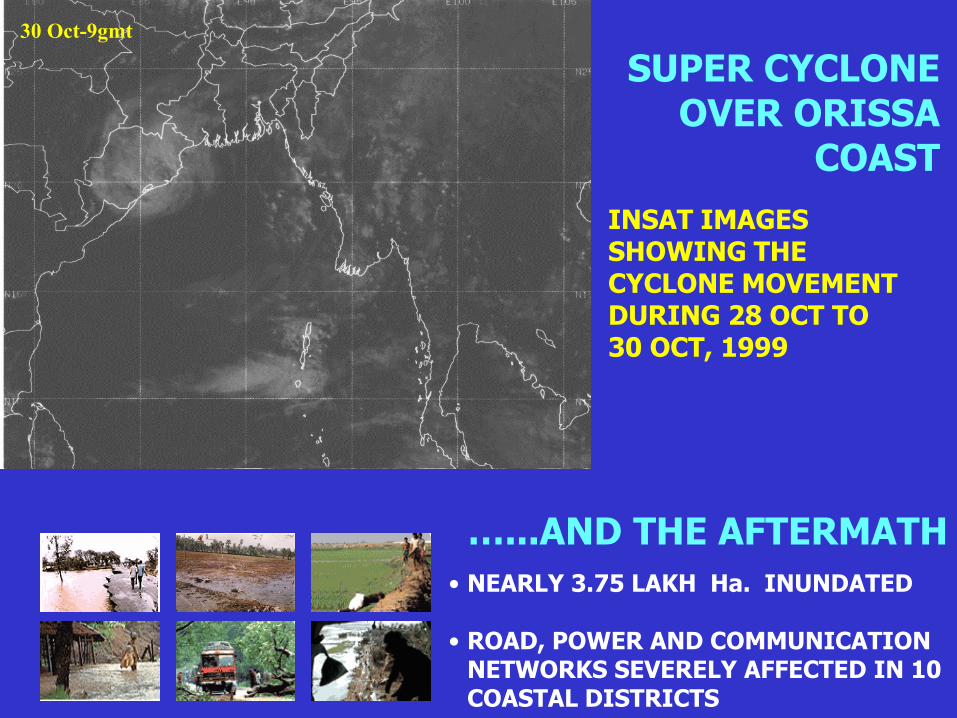
INSAT IMAGES SHOWING THE CYCLONE MOVEMENT DURING 28 OCT TO 30 OCT, 1999
…...AND THE AFTERMATH
• NEARLY 3.75 LAKH Ha. INUNDATED
• ROAD, POWER AND COMMUNICATION NETWORKS SEVERELY AFFECTED IN 10 COASTAL DISTRICTS
SUPER CYCLONE OVER ORISSA
COAST
28 Oct-3gmt 28 Oct-6gmt 28 Oct-9gmt 29 Oct-3gmt 29 Oct-6gmt 29 Oct-9gmt 30 Oct-3gmt 30 Oct-6gmt 30 Oct-9gmt

INSAT 1D IMAGE SHOWING THE LANDFALL OF SUPER CYCLONIC
STORM OF 29 OCTOBER, 1999 NEAR PARADIP ON ORISSA COAST

Damage due to super cyclone of October 29, 1999 (Source Orissa Government))
Districts affected 12
Blocks affected 97
Villages affected 14643
Population affected 129.22 Lakhs
Crop area affected 18.42 Lakh Ha
Houses affected 16.49 Lakhs
Loss of life 9887
Persons missing 40
Persons injured 2507
Livestock perished 4.44 Lakhs
Fishing boats lost 9085
Fishing nets lost 22143
Damage due to Severe cyclone of October 17, 1999 (Source Orissa and Andhra
Pradesh Government):
Lives lost 198
Persons injured 402
Loss of crops thousands Hectare of land
Damage to property three lakh coconut trees uprooted and
two lakhs trees damaged
`
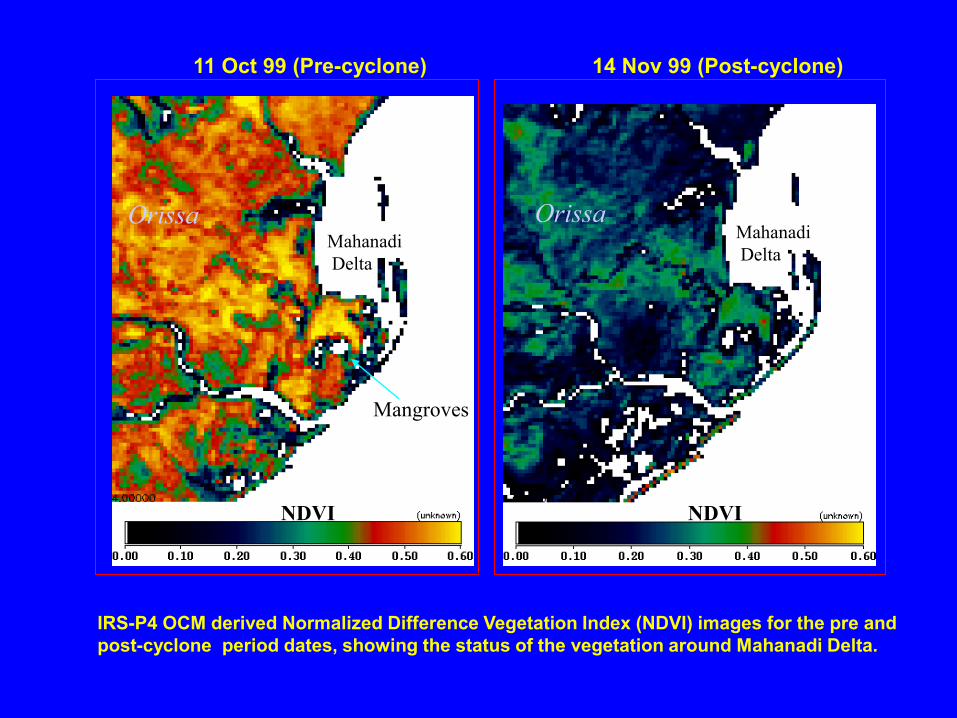
11 Oct 99 (Pre-cyclone) 14 Nov 99 (Post-cyclone)
Mahanadi
Delta
Orissa Orissa Mahanadi
Delta
NDVI NDVI
IRS-P4 OCM derived Normalized Difference Vegetation Index (NDVI) images for the pre and
post-cyclone period dates, showing the status of the vegetation around Mahanadi Delta.
Mangroves
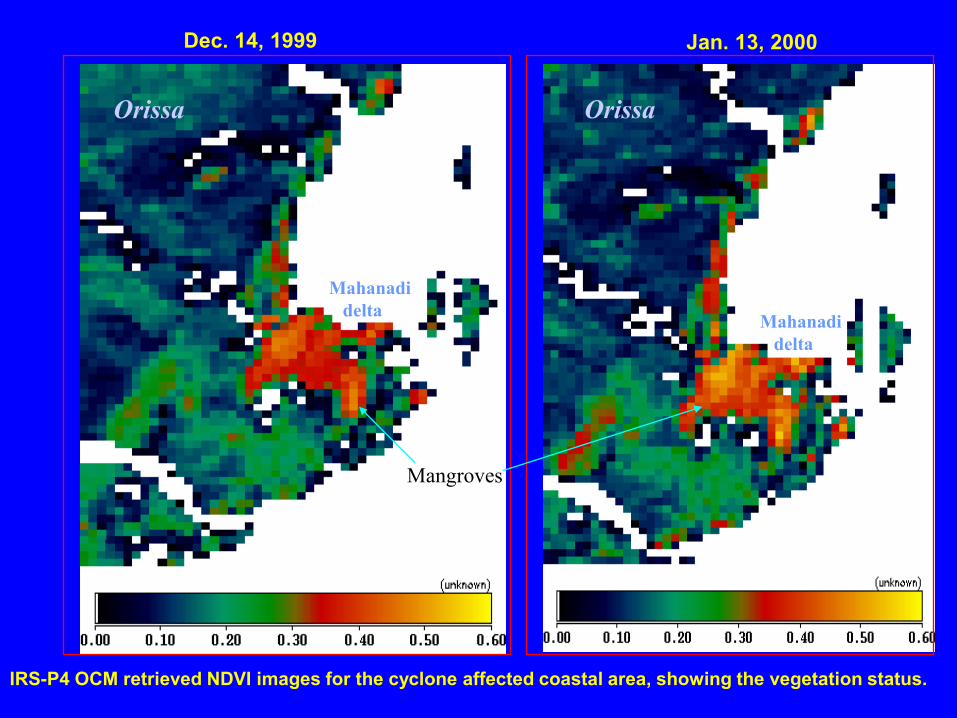
Mahanadi
delta Mahanadi
delta
IRS-P4 OCM retrieved NDVI images for the cyclone affected coastal area, showing the vegetation status.
Orissa Orissa
Dec. 14, 1999 Jan. 13, 2000
Mangroves
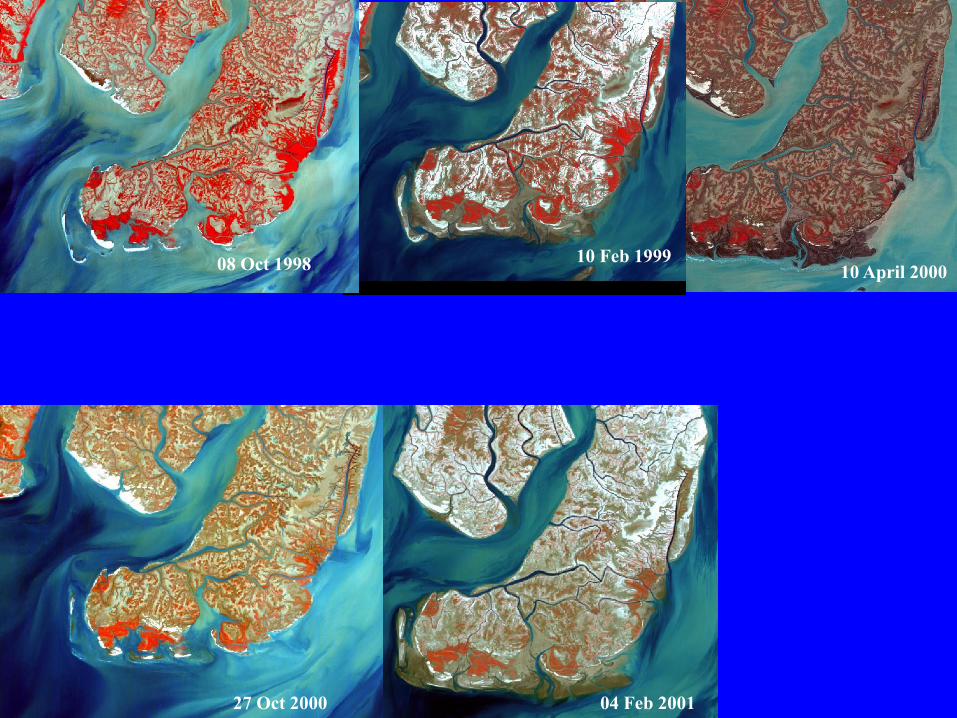
10 April 2000 10 Feb 1999
27 Oct 2000 04 Feb 2001
08 Oct 1998
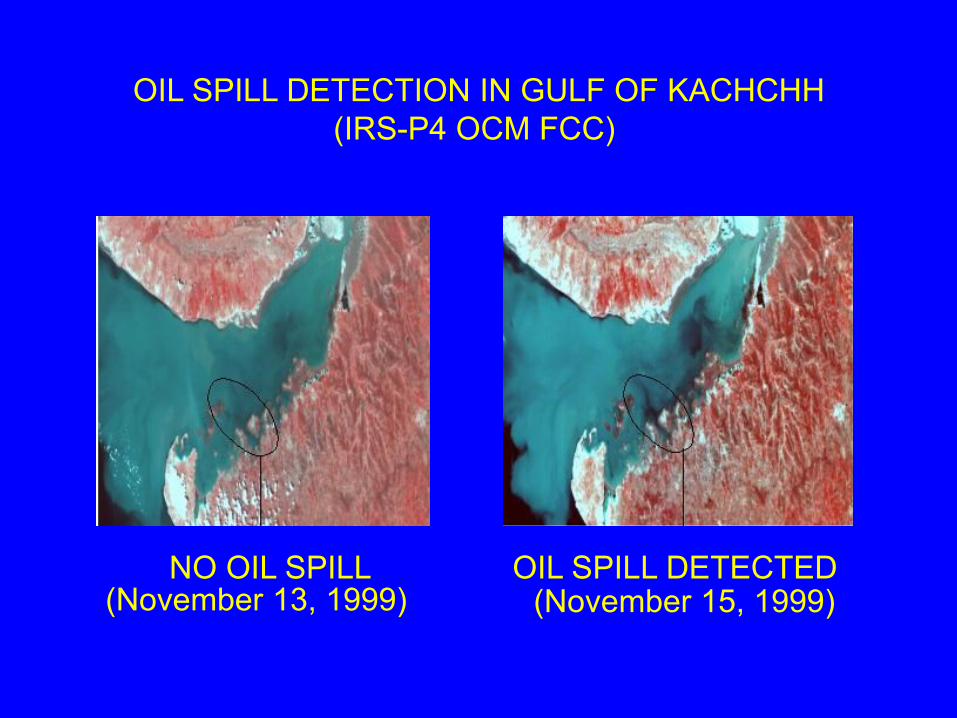
OIL SPILL DETECTION IN GULF OF KACHCHH
(IRS-P4 OCM FCC)
OIL SPILL DETECTED NO OIL SPILL (November 15, 1999)
(November 13, 1999)
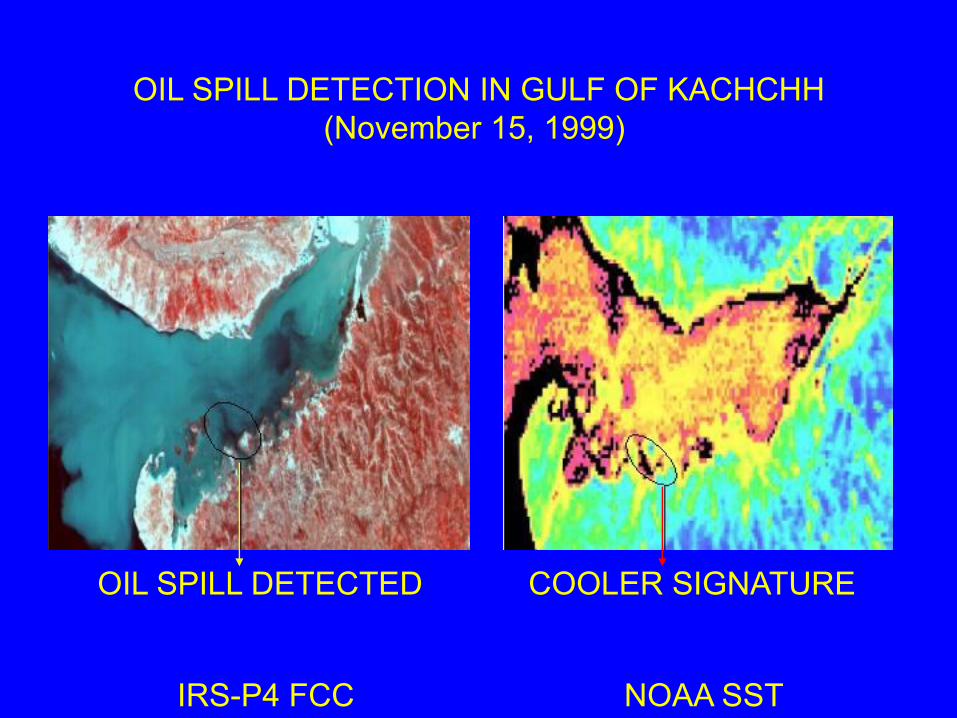
OIL SPILL DETECTION IN GULF OF KACHCHH
(November 15, 1999)
IRS-P4 FCC NOAA SST
OIL SPILL DETECTED COOLER SIGNATURE
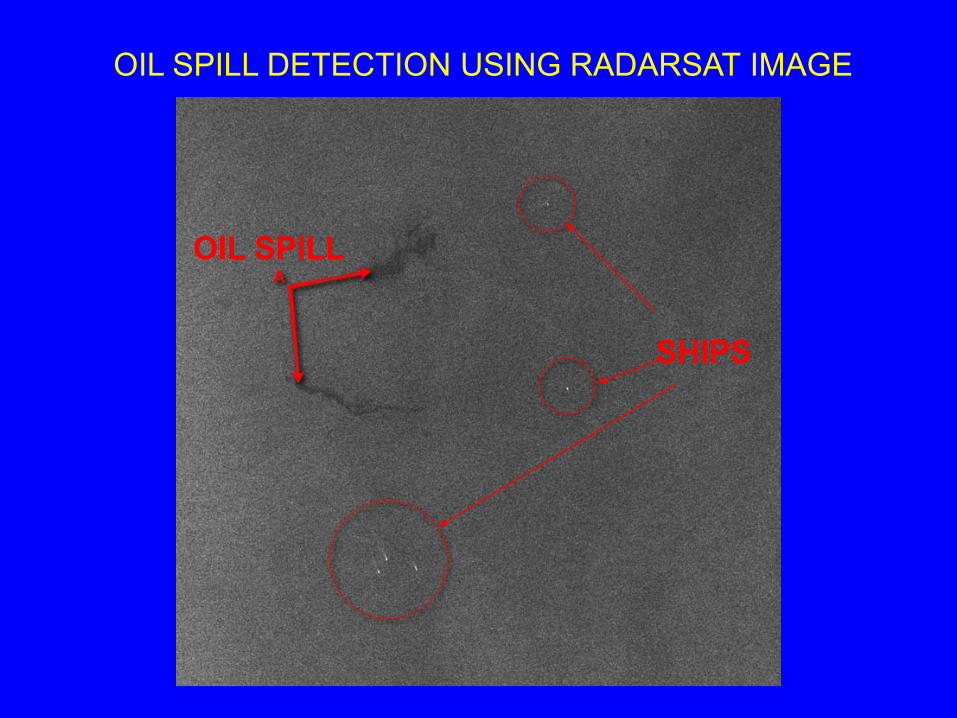
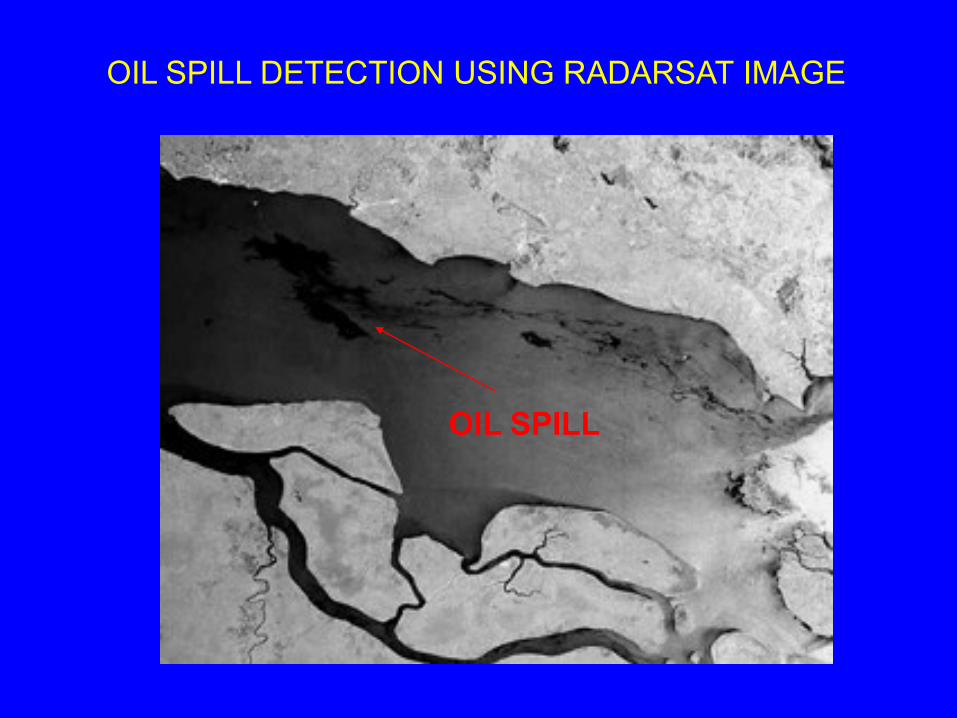
OIL SPILL DETECTION USING RADARSAT IMAGE
OIL SPILL
SHIPS
OIL SPILL DETECTION USING RADARSAT IMAGE
OIL SPILL
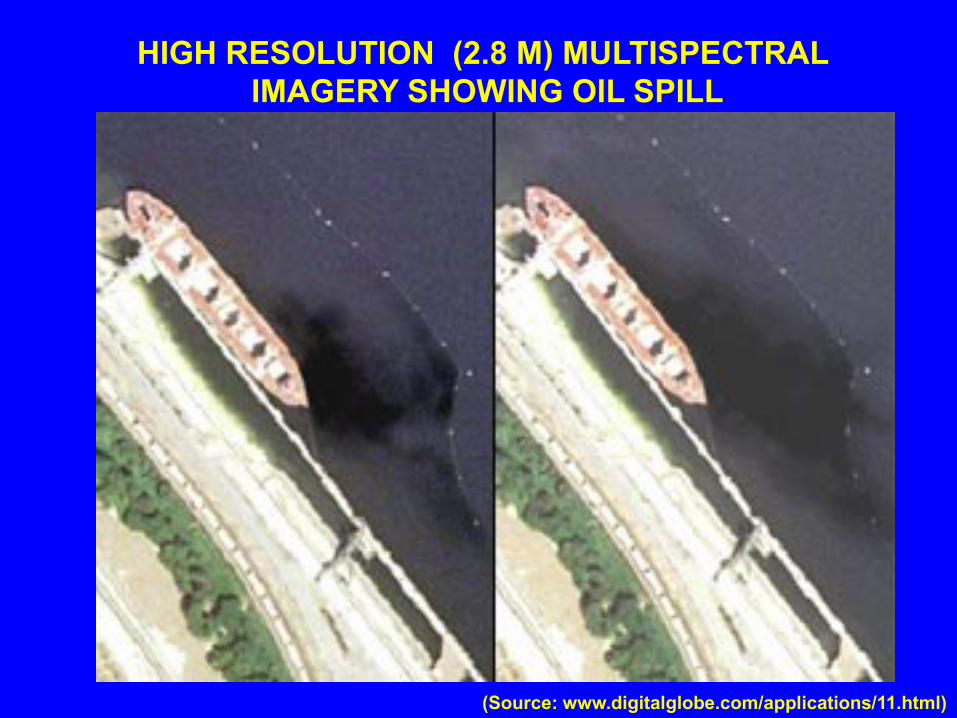
HIGH RESOLUTION (2.8 M) MULTISPECTRAL
IMAGERY SHOWING OIL SPILL
(Source: www.digitalglobe.com/applications/11.html)
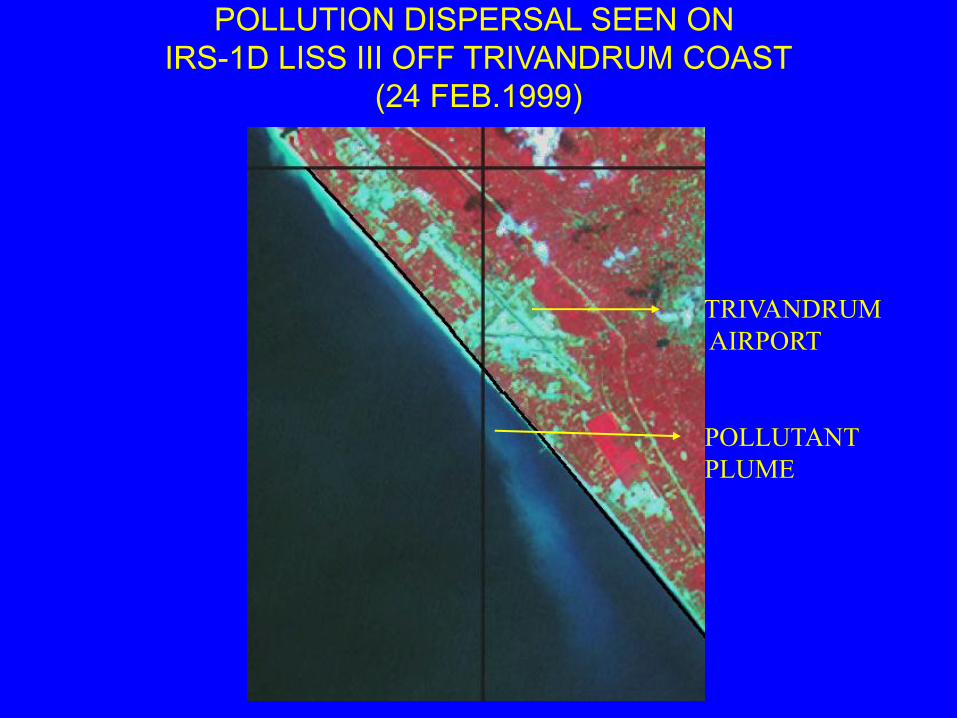
POLLUTION DISPERSAL SEEN ON
IRS-1D LISS III OFF TRIVANDRUM COAST
(24 FEB.1999)
TRIVANDRUM
AIRPORT
POLLUTANT
PLUME

SHORELINE CHANGES ARPUND DHAMRA ESTUARY AND ENVIRONS
(PARTS OF THE MAHANADI DELTA, ORISSA COAST)
Data Used:
Shoreline
shown in
SOI map
surveyed
in 1972-74
IRS-1D LISS III
March 19, 2001
Erosion
New island

SHORELINE CHANGES AROUND THE MAHANADI ESTUARY AND ENVIRONS
(PARTS OF THE MAHANADI DELTA, ORISSA COAST)
Data Used:
Shoreline
shown in
SOI map
surveyed
in 1929-30
IRS-1D LISS III
FCC
March 19,
2001
Erosion
Accretion
Paradeep Port
Changes in spit
New
Barrier
island
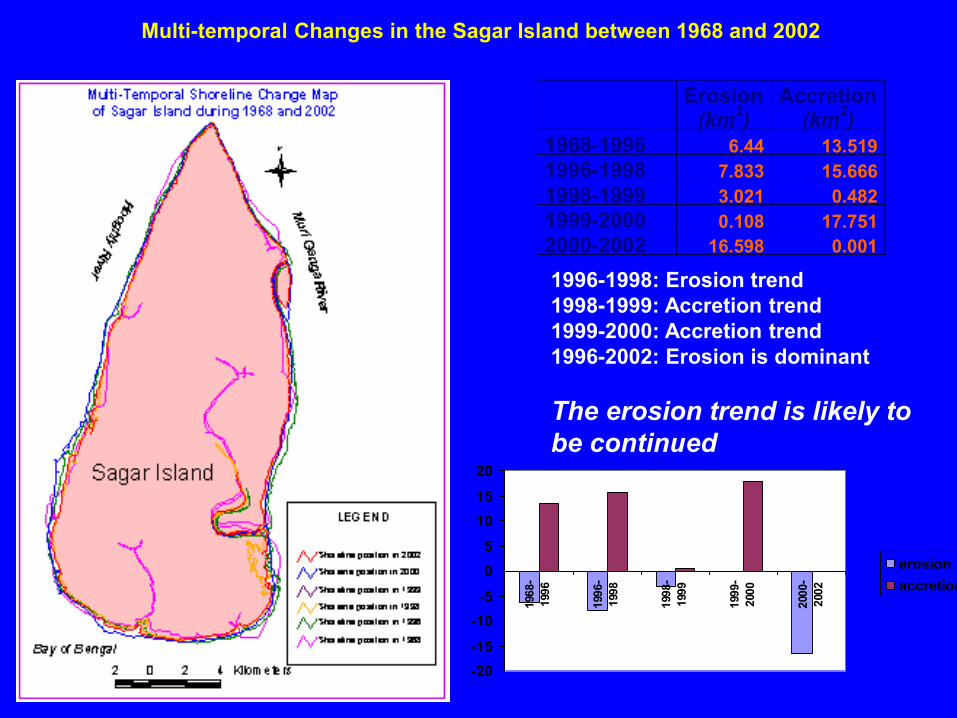
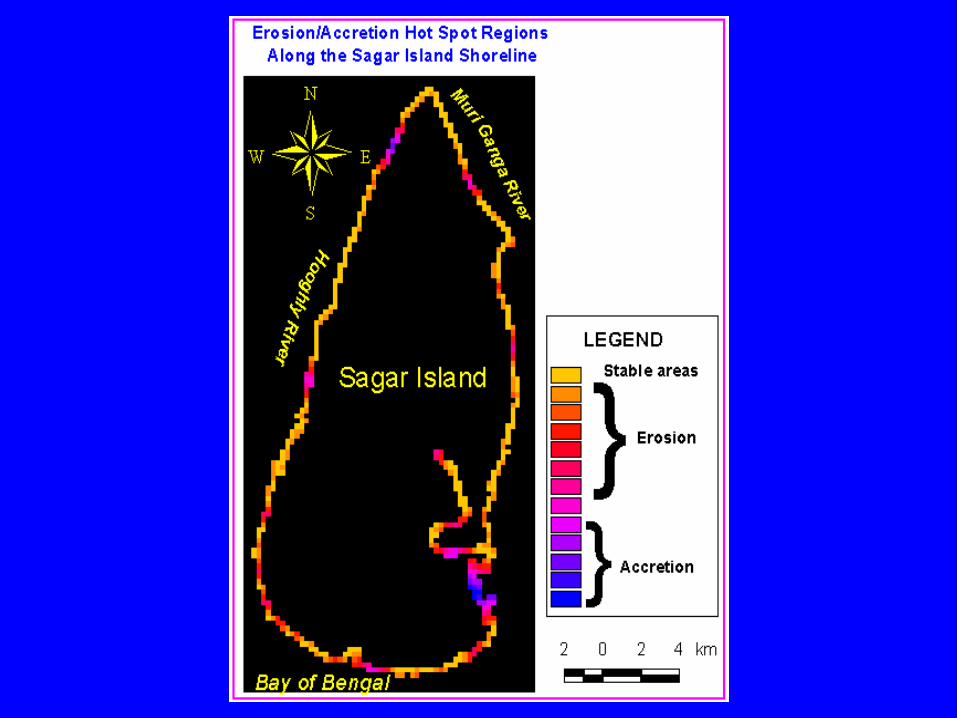
Multi-temporal Changes in the Sagar Island between 1968 and 2002
Erosion (km
2)
Accretion (km
2)
1968-1996 6.44 13.519
1996-1998 7.833 15.666
1998-1999 3.021 0.482
1999-2000 0.108 17.751
2000-2002 16.598 0.001
1996-1998: Erosion trend
1998-1999: Accretion trend
1999-2000: Accretion trend
1996-2002: Erosion is dominant
The erosion trend is likely to
be continued
-20
-15
-10
-5
0
5
10
15
20
196
8-
199
6
199
6-
199
8
199
8-
199
9
199
9-
200
0
200
0-
200
2
erosion
accretion

37
Shankarpur
Mandarmani
Dadanpatrabar
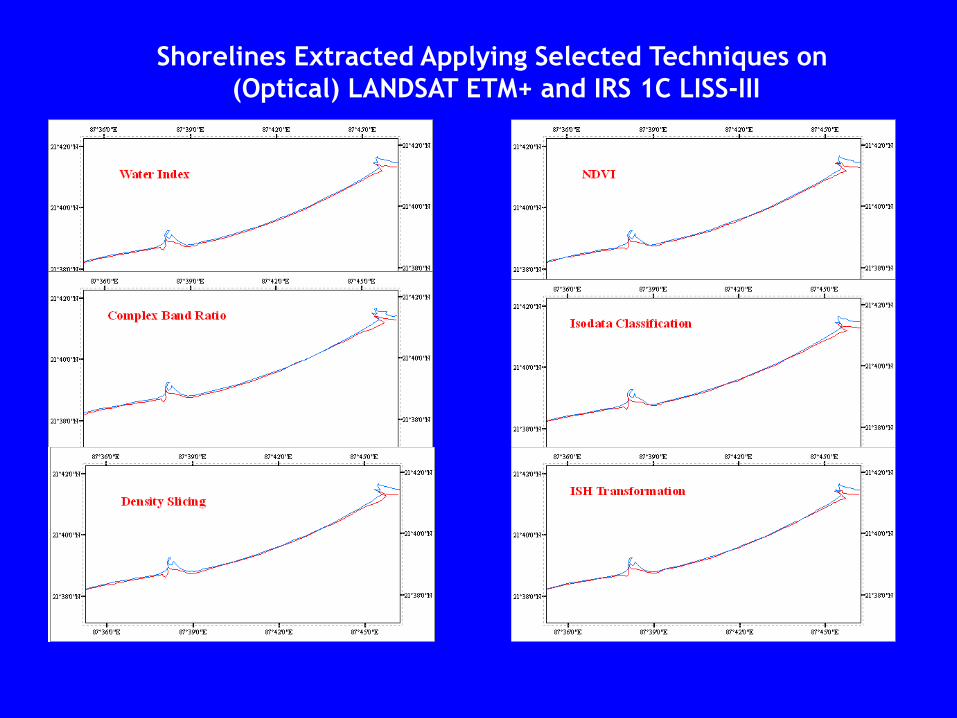
Shorelines Extracted Applying Selected Techniques on
(Optical) LANDSAT ETM+ and IRS 1C LISS-III
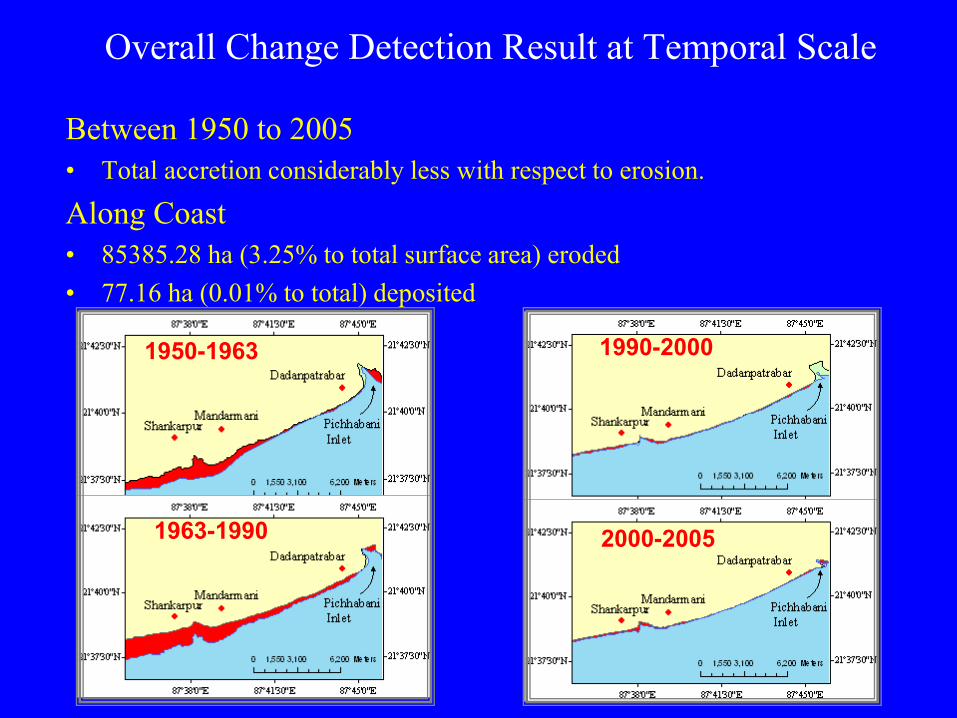
Between 1950 to 2005
• Total accretion considerably less with respect to erosion.
Along Coast
• 85385.28 ha (3.25% to total surface area) eroded
• 77.16 ha (0.01% to total) deposited
1950-1963
1963-1990
1990-2000
2000-2005
Overall Change Detection Result at Temporal Scale

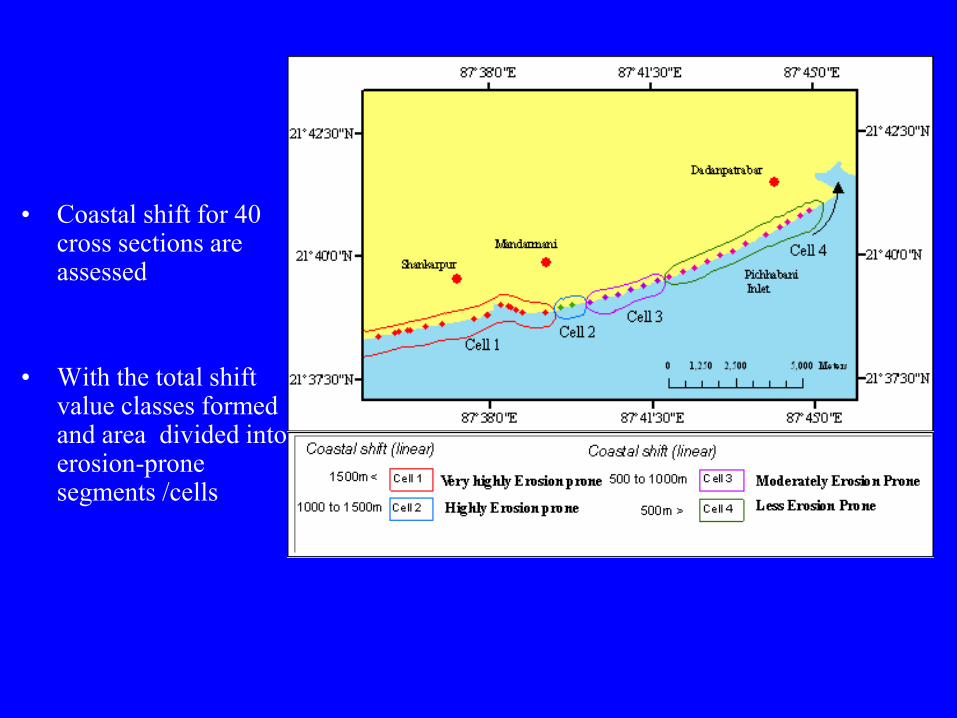
• Coastal shift for 40 cross sections are assessed
• With the total shift value classes formed and area divided into erosion-prone segments /cells
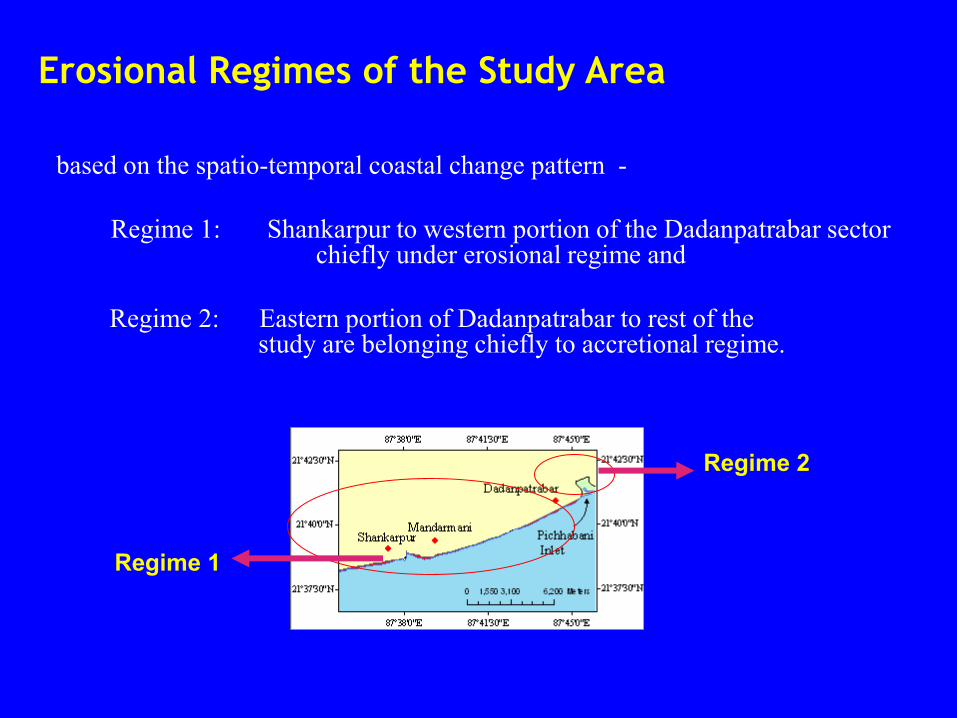
based on the spatio-temporal coastal change pattern -
Regime 1: Shankarpur to western portion of the Dadanpatrabar sector chiefly under erosional regime and
Regime 2: Eastern portion of Dadanpatrabar to rest of the study are belonging chiefly to accretional regime.
Regime 2
Regime 1
Erosional Regimes of the Study Area

Causes of Deposition and Erosion
– Tides, Waves, Rip Currents and Longshore Currents
– Sea Level Rise
– Cyclonic Storm Surge
– Anthropogenic Activities
Sand filled bags used
to build embankment at Shankarpur

Human Activities on coastal zone
Hotel on the intertidal mudflat
Construction and transport
on tidal mudflat
Fishing activities on tidal mudflat
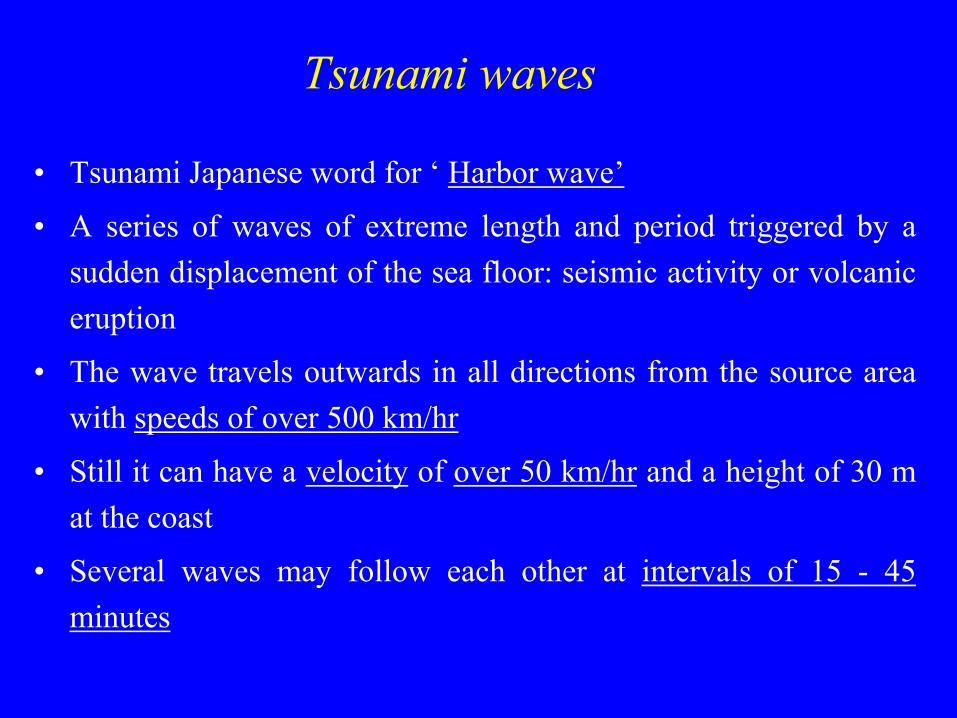
• Tsunami Japanese word for ‘ Harbor wave’
• A series of waves of extreme length and period triggered by a
sudden displacement of the sea floor: seismic activity or volcanic
eruption
• The wave travels outwards in all directions from the source area
with speeds of over 500 km/hr
• Still it can have a velocity of over 50 km/hr and a height of 30 m
at the coast
• Several waves may follow each other at intervals of 15 - 45
minutes
Tsunami waves

Tsunami waves
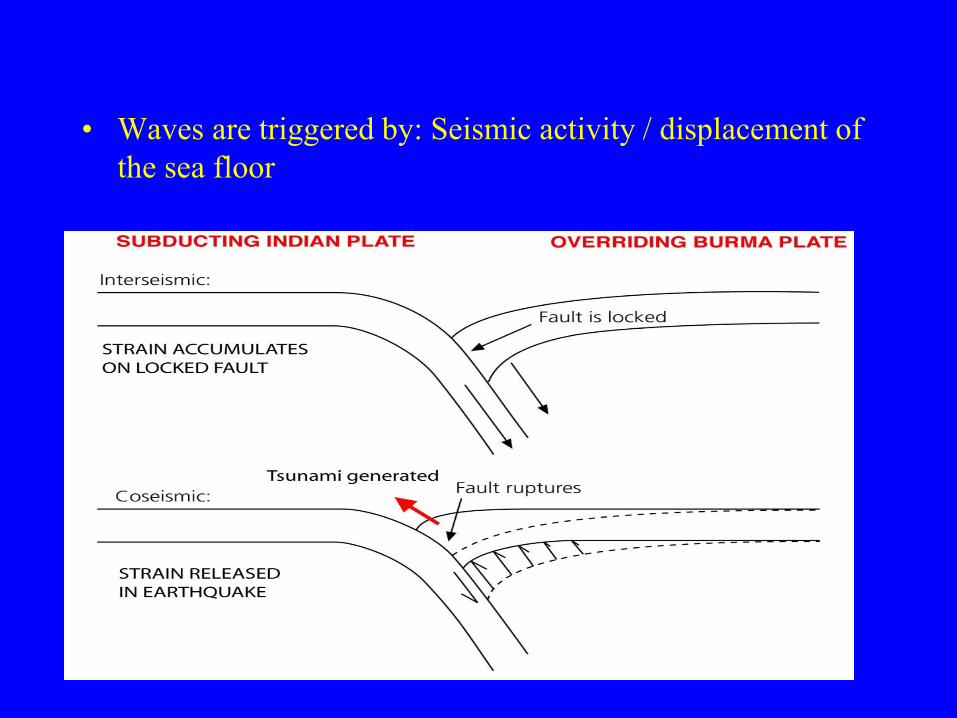
• Waves are triggered by: Seismic activity / displacement of
the sea floor

Pre and post Tsunami image of Bande
Aech Region, Indonesia

Badly affected countries
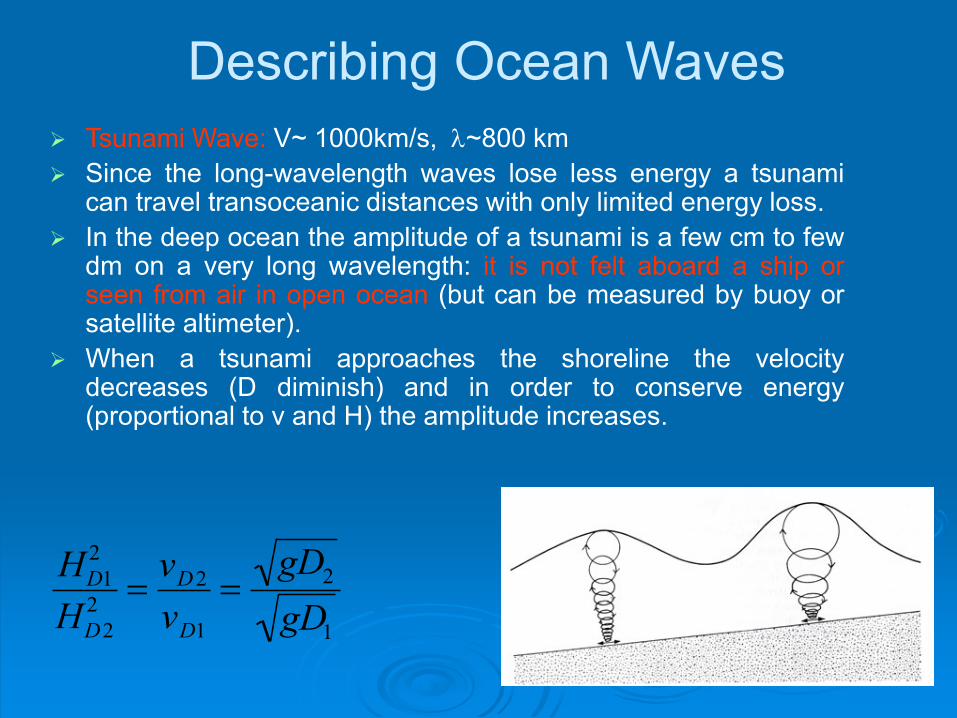
Describing Ocean Waves
Tsunami Wave: V~ 1000km/s, l~800 km
Since the long-wavelength waves lose less energy a tsunami can travel transoceanic distances with only limited energy loss.
In the deep ocean the amplitude of a tsunami is a few cm to few dm on a very long wavelength: it is not felt aboard a ship or seen from air in open ocean (but can be measured by buoy or satellite altimeter).
When a tsunami approaches the shoreline the velocity decreases (D diminish) and in order to conserve energy (proportional to v and H) the amplitude increases.
HD1
2
HD2
2vD2
vD1
gD2
gD1

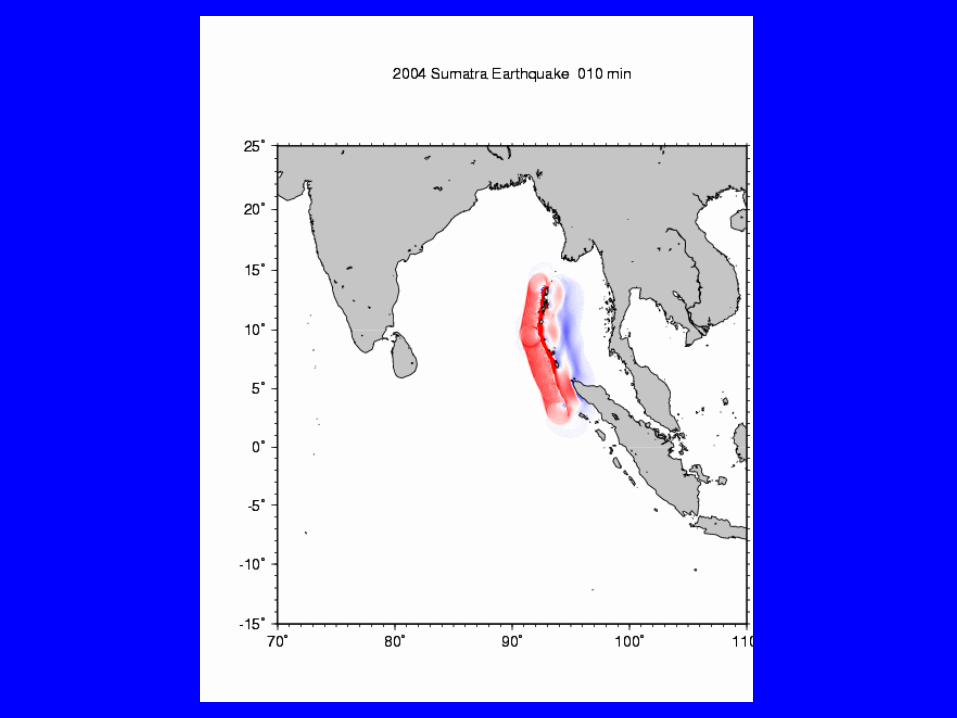
An Example
Tsunami Wave Example: Sumatra 2004
How long does it take to get to Sri Lanka?
Distance ~1600 km
Water Depth ~4000 m
T= 1600/713=2.2 hr
v gD 9.8* 4000 198m
s 713
km
hr

An Example Tsunami Wave Example: Sumatra 2004
How long to get to Thailand?
Distance ~500 km
Water Depth ~1500 m
T= 500/430=1.1 hr
v gD 9.8*1500 120m
s 430
km
hr

• Satellite remote sensing data is also very helpful for finding out
inundations due to tsunami. Penetration of water body because of tsunami
towards land can be easily traced from suitable remote sensing data.
• The inundation line derived from ground survey can be superimposed
over the taluk or village map using GIS to have an idea about the affected
agricultural areas, human population and infrastructure.


Tsunami inundation map around Nagapattinam area, Tamilnadu, India
The extent of inundation of seawater
depends on earthquake parameters,
nearshore bathymetry, beach profile, land
topography and velocity of tsunami
waves and their frequency. Due to these
parametric variations, the inundations
varied from one location to the other.

(E)
(N)
Inundation Extent and Run-up
Source: National Institute
of Oceanography, Goa

Unprecedented withdrawal of the sea between the
pulses of Tsunami waves at Tiruchendur and
tsunami deposits of ilmenite placers near Vattakottai, Kanyakumari coast.

Withdrawal of Sea at Sumatra region before the Tsunami

Salt affected mudflat along Gulf of Cambay

Salt water intrusion along Gulf of Cambay
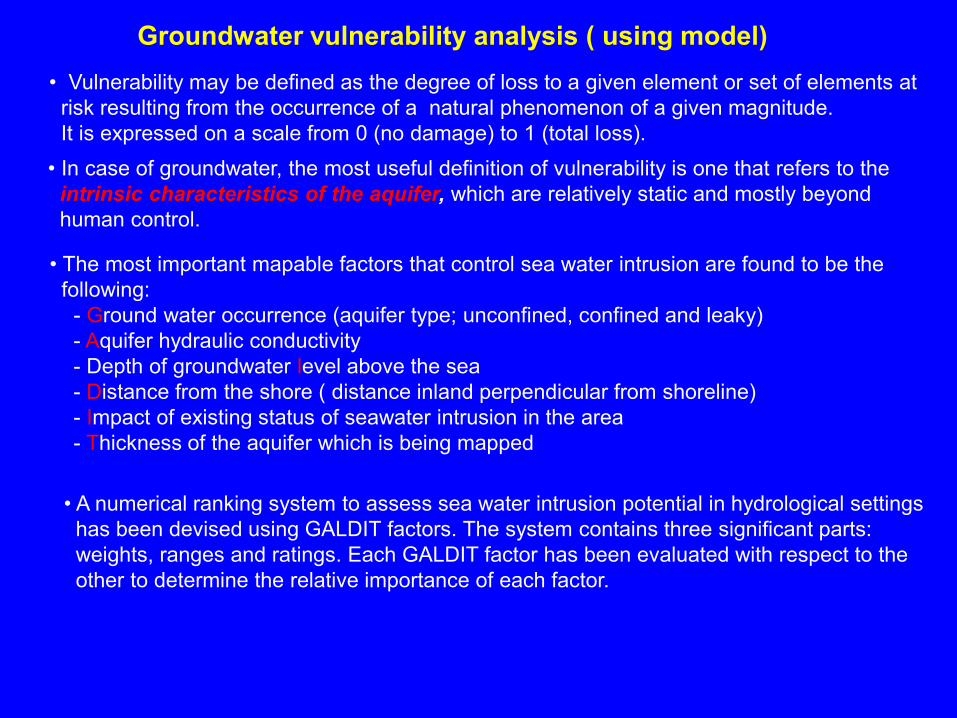
Groundwater vulnerability analysis ( using model)
• Vulnerability may be defined as the degree of loss to a given element or set of elements at
risk resulting from the occurrence of a natural phenomenon of a given magnitude.
It is expressed on a scale from 0 (no damage) to 1 (total loss).
• In case of groundwater, the most useful definition of vulnerability is one that refers to the
intrinsic characteristics of the aquifer, which are relatively static and mostly beyond
human control.
• The most important mapable factors that control sea water intrusion are found to be the
following:
- Ground water occurrence (aquifer type; unconfined, confined and leaky)
- Aquifer hydraulic conductivity
- Depth of groundwater level above the sea
- Distance from the shore ( distance inland perpendicular from shoreline)
- Impact of existing status of seawater intrusion in the area
- Thickness of the aquifer which is being mapped
• A numerical ranking system to assess sea water intrusion potential in hydrological settings
has been devised using GALDIT factors. The system contains three significant parts:
weights, ranges and ratings. Each GALDIT factor has been evaluated with respect to the
other to determine the relative importance of each factor.

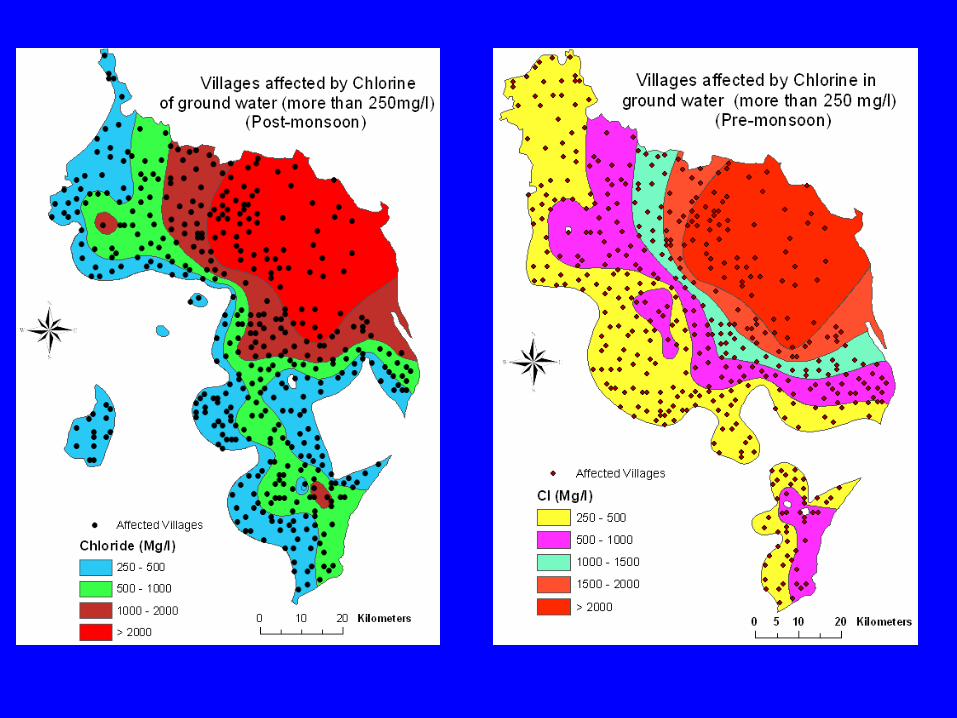
Well locations data pertaining to parameters like Total Depth (TD), Static Water Level (SWL), Total
Dissolved Solids (TDS), Carbonate (C03), Bi-Carbonate (HC03) and Chloride (Cl) around Bhavnagar
district have been collected from Gujarat Water Resources Development Corporation (GWRDC),
Gandhinagar, Gujarat for the year 1983 to 2003 in every five years interval for pre-monsoon (May) and
post-monsoon (October) period.

S.
no.
Total GALDIT
Score
Vulnerability Class
1
>90
Highly vulnerable
2
>70 - 90
Vulnerable
3
>50-70
Moderately vulnerable
4
<50
Not vulnerable
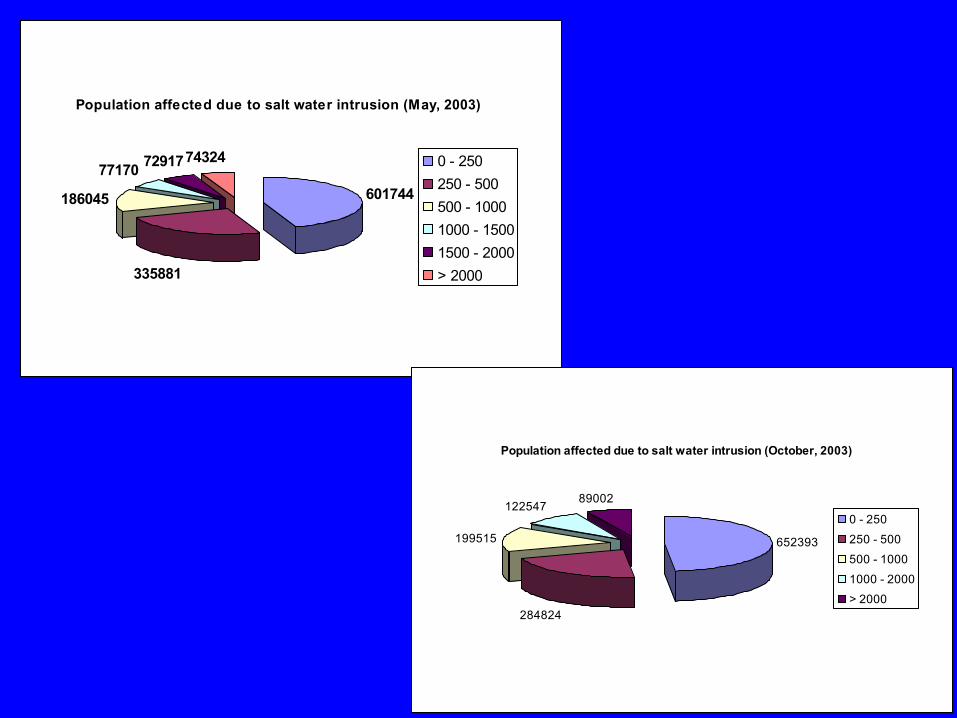
Population affected due to salt water intrusion (May, 2003)
601744
335881
186045
771707432472917 0 - 250
250 - 500
500 - 1000
1000 - 1500
1500 - 2000
> 2000
Population affected due to salt water intrusion (October, 2003)
652393
284824
199515
12254789002
0 - 250
250 - 500
500 - 1000
1000 - 2000
> 2000
SUMMARY
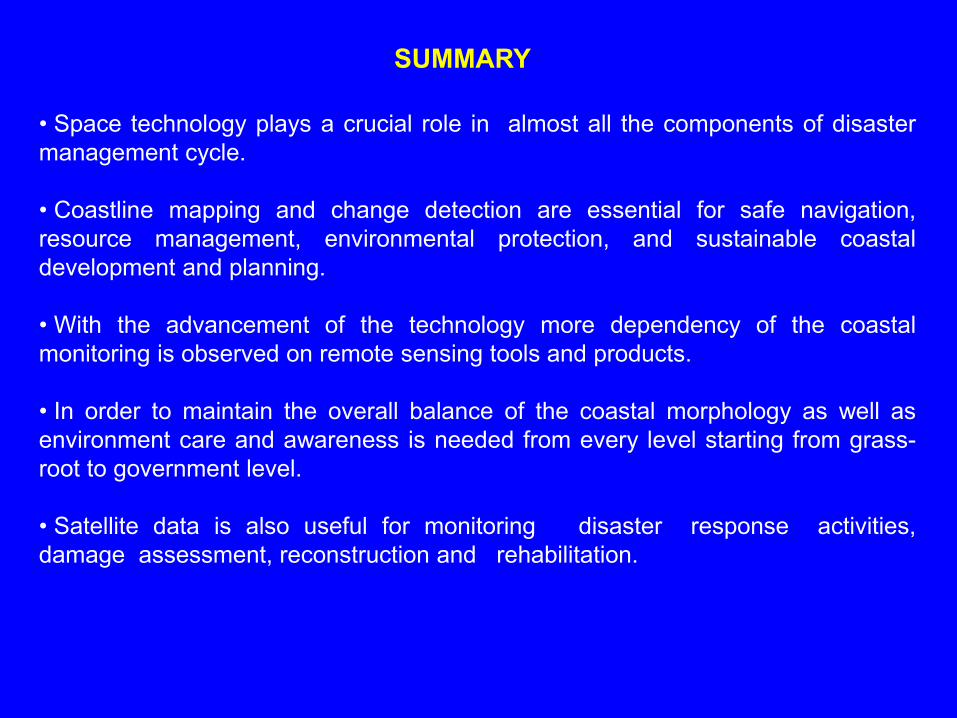
• Space technology plays a crucial role in almost all the components of disaster
management cycle.
• Coastline mapping and change detection are essential for safe navigation,
resource management, environmental protection, and sustainable coastal
development and planning.
• With the advancement of the technology more dependency of the coastal
monitoring is observed on remote sensing tools and products.
• In order to maintain the overall balance of the coastal morphology as well as
environment care and awareness is needed from every level starting from grass-
root to government level.
• Satellite data is also useful for monitoring disaster response activities,
damage assessment, reconstruction and rehabilitation.


![Namdrik Atoll Rapid Coastal Hazard Assessment Instructions[1]](https://img.dokumen.tips/doc/110x75/55cf9838550346d0339650f7/namdrik-atoll-rapid-coastal-hazard-assessment-instructions1.jpg)