Embed Size (px)
Citation preview

Moscow and City Indexes
Prof Greg Clark
Moscow Urban ForumDecember 2014
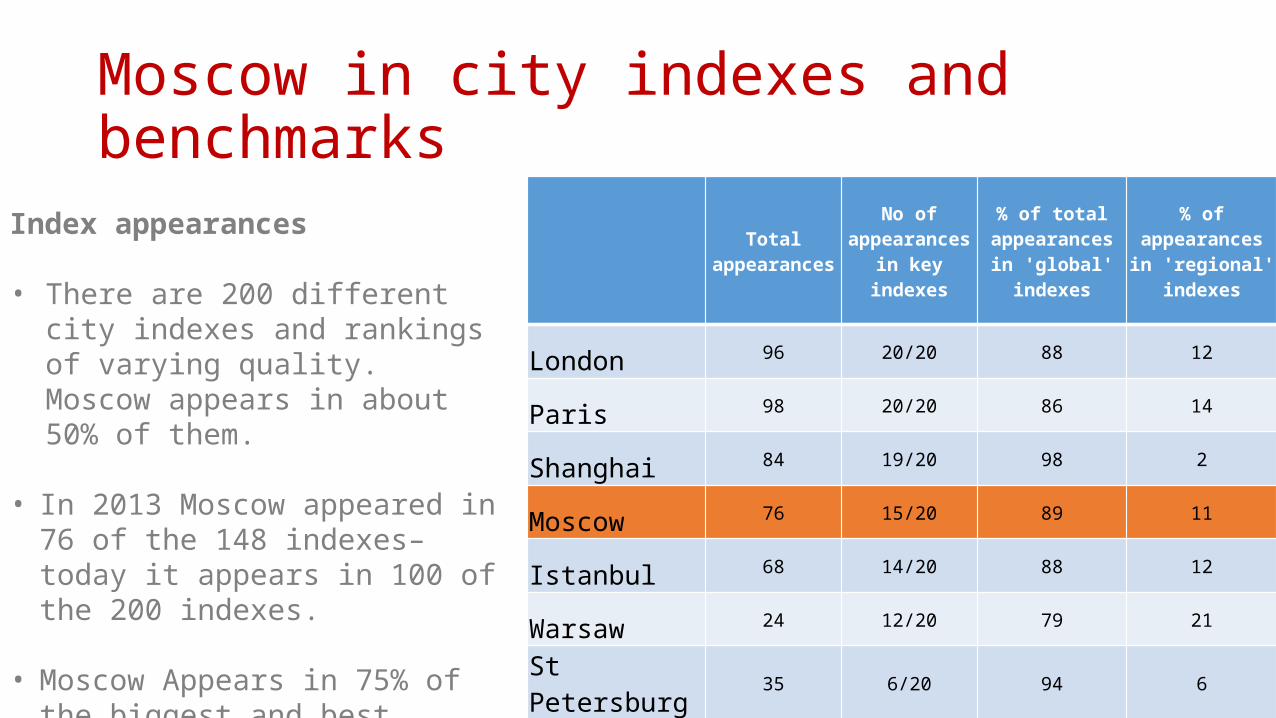
Moscow in city indexes and benchmarks
Total appearances
No of appearances in
key indexes
% of total appearances in 'global' indexes
% of appearances in 'regional'
indexes
London 96 20/20 88 12
Paris 98 20/20 86 14
Shanghai 84 19/20 98 2
Moscow 76 15/20 89 11
Istanbul 68 14/20 88 12
Warsaw 24 12/20 79 21
St Petersburg 35 6/20 94 6
Index appearances
• There are 200 different city indexes and rankings of varying quality. Moscow appears in about 50% of them.
• In 2013 Moscow appeared in 76 of the 148 indexes– today it appears in 100 of the 200 indexes.
• Moscow Appears in 75% of the biggest and best benchmarks. 65 global indexes, 10+ European indexes

What kind of indexes does Moscowappear in?• 12 comprehensive benchmarks
• 12 economic and financial measures
• 5 business and investor friendliness
• 6 transport and infrastructure indexes
• 11 R&D, innovation and talent
• 10 quality of life and environment indexes
• 5 brand, image and influence studies

What kind of indexes does Moscow appear in ?• Strongly visible in all-round studies of city performance
• Very prominent for studies on finance, economic growth, investment patterns, technology, transport
But
• Low visibility in environmental indexes• (data challenges?)
• Less prominent in studies of brands, governance and smart cities

• Moscow is broadly stable since 2008
• In the upper group of the ‘Emerging World Cities’ cluster
• Falling slightly as more cities become recognised and measured
How has Moscow fared over time? Comprehensive benchmarks

How has Moscow fared over time? Globalisation
• Much more integrated in global economy since 2000
• Has become more globalised than many emerging capitals and megacities (eg. Mexico City, Buenos Aires, Taipei)
• Only a few Asian/Gulf hubs (Shanghai, Beijing, Dubai) have risen more quickly

• Consistently strong status as an investment destination, due to market size, labour force and economic potential.
• Improved recognition for real estate strength since 2010; Moscow is now a world-class location alongside Paris
How has Moscow fared over time? Investment Performance
*Moscow did not make into the 2014/15 FDI European Cities of the Future rankings
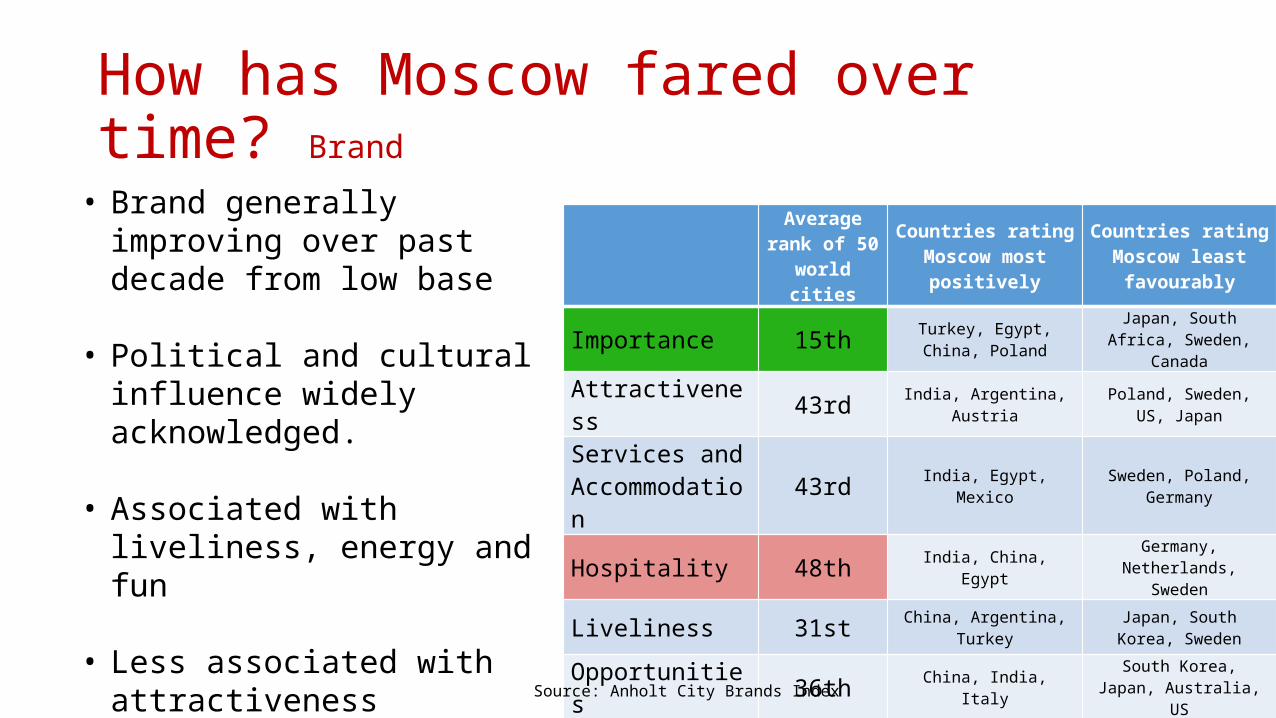
How has Moscow fared over time? Brand
Average rank of 50 world
cities
Countries rating Moscow most
positively
Countries rating Moscow least
favourably
Importance 15th Turkey, Egypt, China, Poland
Japan, South Africa, Sweden, Canada
Attractiveness 43rd India, Argentina, Austria Poland, Sweden, US, Japan
Services and Accommodation 43rd India, Egypt, Mexico Sweden, Poland, Germany
Hospitality 48th India, China, Egypt Germany, Netherlands, Sweden
Liveliness 31st China, Argentina, Turkey Japan, South Korea, Sweden
Opportunities 36th China, India, Italy South Korea, Japan, Australia, US
• Brand generally improving over past decade from low base
• Political and cultural influence widely acknowledged.
• Associated with liveliness, energy and fun
• Less associated with attractivenessor welcome
• Reputation strongest in India, China, weakest in Sweden, Japan Source: Anholt City Brands Index

How has Moscow fared over time? Financial services
• Average rating by global executives considerably improved over time, up 50% since 2008.
• But competition is growing.
• Other emerging world cities have progressed more quickly

Issue Performance Reality
Risk of natural disasters Top 25% ✓
FDI Top 25% ✓
Park Space Top 10% ✓
Dynamic young population Top 25% ✓
Transport system size Top 40%✓
✓
Passenger Flows Top 30% ✓
Political Importance Top 15% ✓
Is Moscow correctly represented? Areas where Moscow performs well
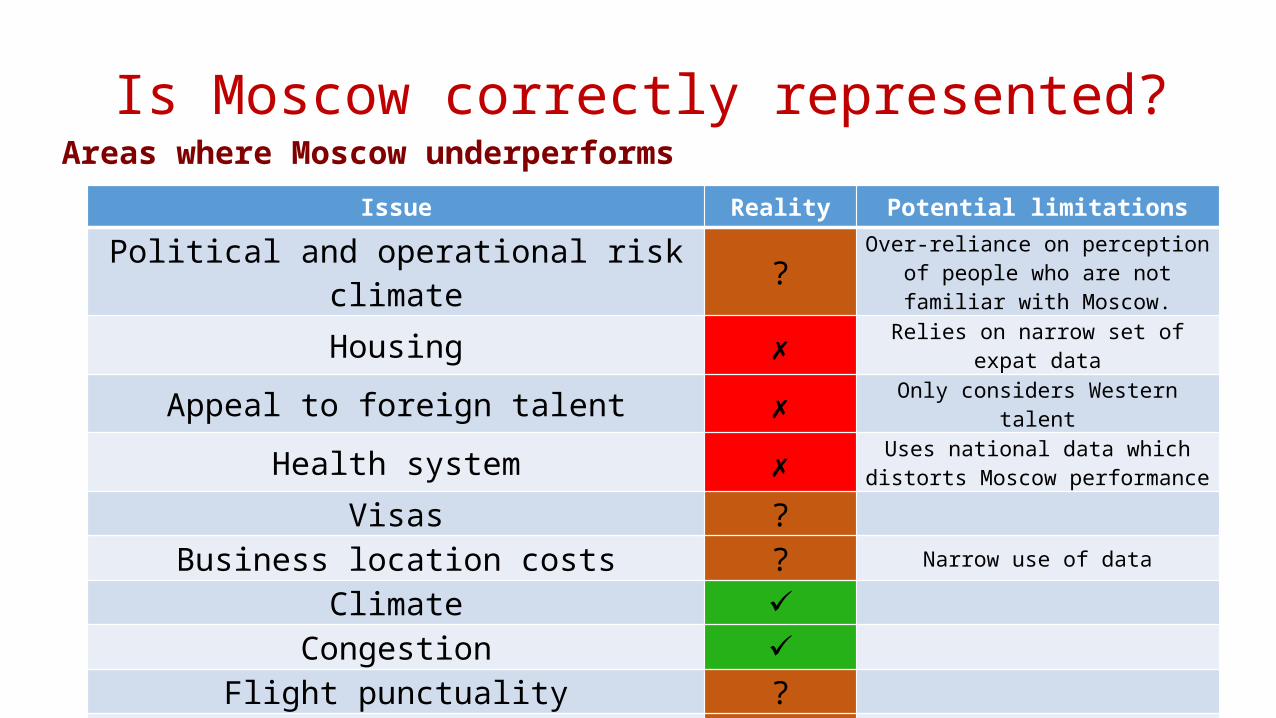
Issue Reality Potential limitations
Political and operational risk climate ? Over-reliance on perception of people who are not familiar with Moscow.
Housing ✗ Relies on narrow set of expat data
Appeal to foreign talent ✗ Only considers Western talent
Health system ✗ Uses national data which distorts Moscow performance
Visas ?Business location costs ? Narrow use of data
Climate ✓Congestion ✓
Flight punctuality ?Crime ? Reliance on national figures
Is Moscow correctly represented? Areas where Moscow underperforms

• Western bias?• Measuring ‘global appeal’ by asking Western audiences• Does not track all patterns of migration and attraction• Biases of climate and other lifestyle preferences
• Data limitations?• Reliance on national-level data• Tendency to use established datasets rather than new ones.• Lack of transparency
• Index weightings?• Indexes cater disproportionately to expat needs (e.g. terrorism security, luxury housing)
Is Moscow being unfairly measured?
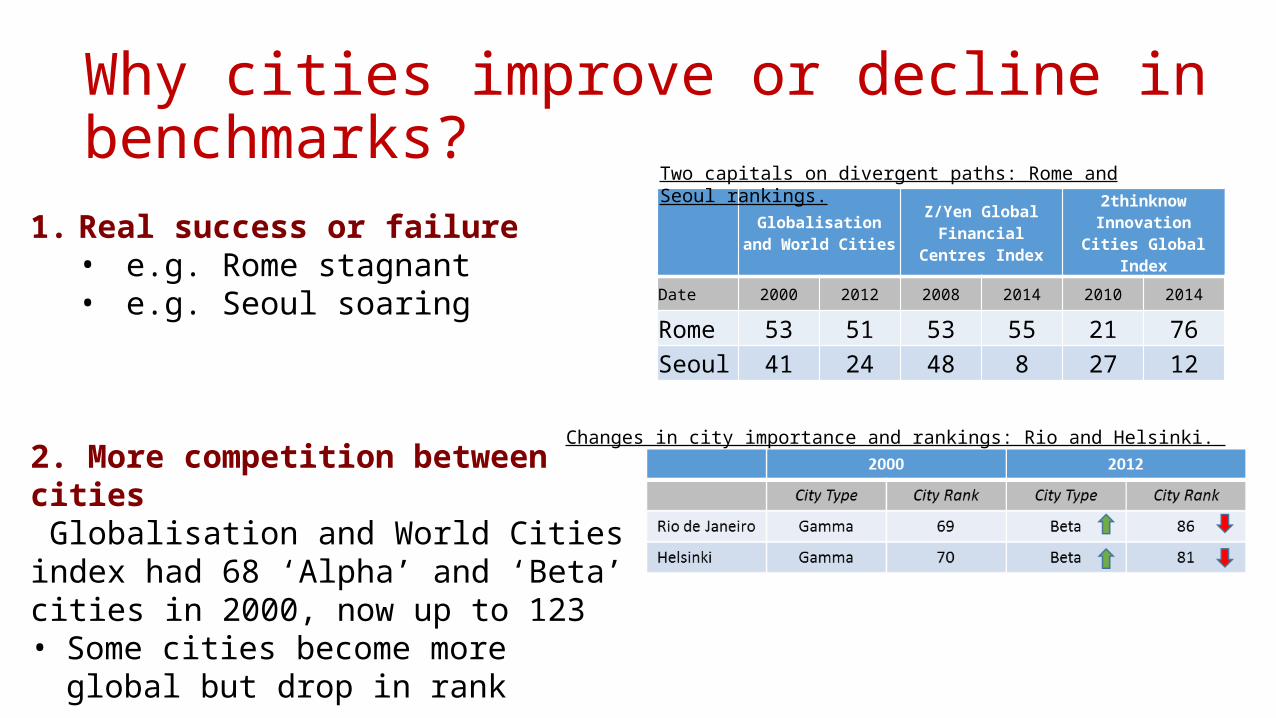
Globalisation and World Cities
Z/Yen Global Financial Centres Index
2thinknow Innovation Cities Global Index
Date 2000 2012 2008 2014 2010 2014
Rome 53 51 53 55 21 76Seoul 41 24 48 8 27 12
1. Real success or failure• e.g. Rome stagnant• e.g. Seoul soaring
2. More competition between cities Globalisation and World Cities index had 68 ‘Alpha’ and ‘Beta’ cities in 2000, now up to 123• Some cities become more global but drop
in rank
Two capitals on divergent paths: Rome and Seoul rankings.
Changes in city importance and rankings: Rio and Helsinki.
Why cities improve or decline in benchmarks?

Why cities improve or decline in benchmarks?
3. Different rankings on same issues yield different results
• Moscow Human Capital• Some factor diversity of talent. Others rely
on university rankings.• Istanbul Transportation
• Is it about size of coverage, or quality?
Same issues, different entry points,different results.
Moscow Human Capital scores
Istanbul transportation scores

4. New information or data• e.g. ‘Global Power City Index’ added ‘Urban Intangible Values’ in 2014 to reflect
how people ‘feel’ in a city – as a result, Tokyo performs much more strongly• Global Cities Index changed its ‘information and media’ metric, including city’s
presence on google, to better measure information exchange in cities.• new variables on smart cities, also shifted focus from infrastructure to ICT
leadership and governance
5. New methodologies• Changing the way city and metropolitan size is measured• Increased focus on cities as ‘gateways’ - measuring passenger flows and air
links• Less reliance on interviews and perception when data becomes available.
Why cities improve or decline in benchmarks?

How can Moscow improve in the rankings?1. Real ‘on the ground’ improvement
• E.g. Human Capital: • More hiring of foreign workers and university faculty• Higher rates of higher education attainment
• E.g. Technology readiness, smart city• Higher internet penetration in schools• Grow digital and tech economy

How can Moscow improve in the rankings? 1. (cont.)• City Gateway• Airport more easily accessible from CBD.
• Transport and infrastructure • Quality of telecommunications• Better data availability for key city systems
• Economic Clout:• Continue strong economic performance• Adjustment to risk and regulations

How can Moscow improve in the rankings? 2. Change perceptions
• Promote Moscow’s assets
• Raise awareness of Moscow’s progress
• Highlight Moscow’s brand in Asia
• Get more benefit of the doubt.
• What doesn’t the world understand?

How can Moscow improve in the rankings? 3. Change the way data and information are gathered
Co-operate to provide better data for high profile rankings (e.g. Cities of Opportunity) to improve results
• e.g. Register all conference activity with ICCA
• e.g. local-level health, education and crime stats
• e.g. track R&D investments

How can Moscow improve in the rankings? 4. Change the rankings
• Invest in or encourage the creation of new and different rankings• Benchmarks that focus on Moscow’s strengths
• Fiscal advantages• Investment rate• Market size/demand• Specialised talent• Political influence/support from national government• Housing for local residents• Growth capacity
• make case for change in methods for existing rankings.• Less reliance on security/terrorism risk• More data-led rather than perception-led

How can Moscow improve in the rankings? 5. Challenge the rankings
• In collaboration with other cities
• e.g. emerging cities undervalued by euro-centric or North-American assessments: Sao Paulo, Kuala Lumpur, Istanbul, Mexico City.
• Engage with key rankings creators (PwC, AT Kearney, MORI Memorial Foundation)

Conclusion
• Moscow has areas of great strength across the 200 rankings.• Relative to other Emerging World Cities Moscow is doing well.• Moscow also has some obvious weakness in rankings performance.• Some of these are fair, others are not.• Rankings have problems of data availability, methodology,
categorisation, and bias.• A 5 point strategy can help improve Moscow’s performance in the
rankings. Performance, Perception, Information, Nature of Rankings, Fair Challenge, and Initiation of new rankings.