Embed Size (px)
Citation preview

Planning Wars Lessons for City Planners
Andrew Nash GreenCityStreets.com Lecture Rome
May 29, 2015

Planning Wars
• The Empire Strikes Back – Vienna
• A New Hope – Zurich
• The Phantom Menace – San Francisco
• Return of the Jedi – New York
• The Force Awakens – Information Technology

The Empire Strikes Back - Vienna
• Imperial Capitol - A city for 4 million people!
• A Capitol for the people – social democracy.
• Transport and housing in a social city.
• World’s most liveable city.

Economy • Economic, cultural and
government capital of Austria Population • City: 1.71 million (City Area 415 km2) • Metropolitan area: 2.42 million Transport • Motorisation: 394 Cars / 1000 Inhabitants • U-Bahn: 74 km (2010) • Tram: 172 km (2010) – 74% exclusive lanes • Bus: 622 km (2010) – 7.7% exclusive lanes • Network bike routes: 1,206 km (most shared)
Vienna

Vienna 1850 – Walled City


Vienna Ringstrasse Lessons
• Imperial power allowed huge and disruptive infrastructure project – compare: – Haussmann (Paris) – Sixtus (Rome)
• Financing and Organisation was critical – land sales financed public construction …
agency lasted until 2000s and made a profit!

Otto Wagner’s plan for a growing Vienna - 1911


Vienna: A city for 4 million people
• Grand plans: unrealised; • Infrastructure projects: built
– Flood control; – Water supply; – Railway and tram network; – Parks and Open Space;
• These (overbuilt) infrastructure projects are the foundation for Vienna’s liveability today.

A city for the people Post World War I • Housing • Social Programs • Infrastructure
Rote Wien: Social Democracy

Rote Wien: Legacy
• Expectation of extremely high quality government services and programs:
– Housing – over 225,000 apartments owned by the City of Vienna;
– Public transport – world leader;
– Culture – at all levels from world class to neighbourhood programs.
• Is it too expensive?

Example: Vienna Public Transport
A “brute force” approach to public transport: – U-Bahn – Trams
– Sustainable transport – Livable neighborhood planning
Excellent policies, but difficult to implement politically.

Vienna: Transport statistics
Public transport trips per day: … 2.5 million PT Trip mode: … 64% U-Bahn, 22% Tram, 14% Bus Annual PT trips per resident: … 530 Number of yearly passes sold: … 650,000
Mode Split Goal: 75% Sustainable Transport by 2020.

Vienna: public transport annual tickets

Vienna: Regional public transport network

Vienna U-Bahn
• U-Bahn is most important part of Vienna PT system. • Joint City-Federal funding and planning. • Many sections are built on historic railway lines.
Karlsplatz Stadtsbahn Station by Otto Wagner.

Vienna: U-Bahn


Vienna Trams
• Historic network (not replaced by buses). • Interchange stations on Ring and exclusive ROW. • New tram line extensions.

Vienna: Trams
Shottentor transfer station Contra-flow lane on the Ring
Tram/bus exclusive lane Ultra Low Floor (ULF) Tram

Vienna: City center public transport

Neighborhood traffic regulations
Traffic regulations used to provide priority for public transport and create livable neighborhoods.

Public participation: Mariahilfestrasse


A New Hope - Zurich
• Initiatives and public participation. • A systematic approach for increasing public
transport efficiency:
– Public transport priority – S-Bahn regional rail system (commuter rail) – Coordinated ticketing and schedules – Sustainable mobility program – Low cost and high economic benefit
• World’s most livable city.

Economy • Generates 20% of
Switzerland’s GDP Population
• City: 378,000 • Metropolitan area: 1.68 million • Greater Zurich Area: 3.2 million • City Area: 91.9 km2
Transport • Motorisation: 376 Cars / 1000 Inhabitants • Public transport network: 288 km • Street network: 740 km • Bike route network: 340 km • Parking: public ground 51,000 ... private 220,000
Zurich

Zurich: Public transport stuck in traffic
What’s to do?

Direct Democracy: Ballot Initiatives
• Tiefbahn (underground trams) – Defeated 1962 • U-Bahn/S-Bahn construction – Defeated 1973 • People’s initiative for public transport – Approved 1977 • S-Bahn and ZVV (coordinating agency) – Approved 1981

The Zurich Model: Public transport priority implemented systematically throughout the network.
Incident management / control centre
Signal priority – innovative approach
Results: ! Faster travel times ! Improved reliability ! Increased patronage ! Reduced costs
Exclusive public transport lanes

Regional Rail Network (S-Bahn) • Opened in 1990 • Cost 2 billion CHF • 420 km network • 26 lines, 176 stops • 950 trains per day • Express & local trains • 380,000 pass/day (city line) • Ridership up 143% since 1990. • System being expanded. • Key problem: railway capacity.
Photo: © SBB


regional rail station
regional rail line
area accessible within time budget by walking from rapid transit
area accessible within time budget by conventional surface public transport
area accessible within time budget by walking from regional rail
Three-Level Public Transport Network
rapid transit station
rapid transit line
Infrastructure + Market Areas: Traditional public transport: 3-level system
Regional Rail
Rapid Transit
Surface Transit

Two-Level Public Transport Network
regional rail station
regional rail line
area accessible within time budget by walking from rapid transit
area accessible within time budget by conventional surface public transport
area accessible within time budget by walking from regional rail
rapid transit station
rapid transit line
area accessible within time budget by upgraded surface public transport
limited additional benefit of a three-level network
Faster surface public transit
More regional rail stations
in centre
Limited added benefit of 3-level network
Infrastructure + Market Areas Zurich’s 2-level System

surface public transport
Non-motorized
regional rail
rapid transit
level 3
level 1
„level 0"
trip length served attractively
level 2
Non-motorized
rapid transit
level 3
level 1
„level 0"
trip length served attractively
level 2
surface public transport
regional rail
Functional Coverage Diagram: 3 vs. 2-level system

Public Transport Coordination in Switzerland • Coordinated fares and common tickets • Coordinated schedules • Coordinated interchange locations
Source: ZVV
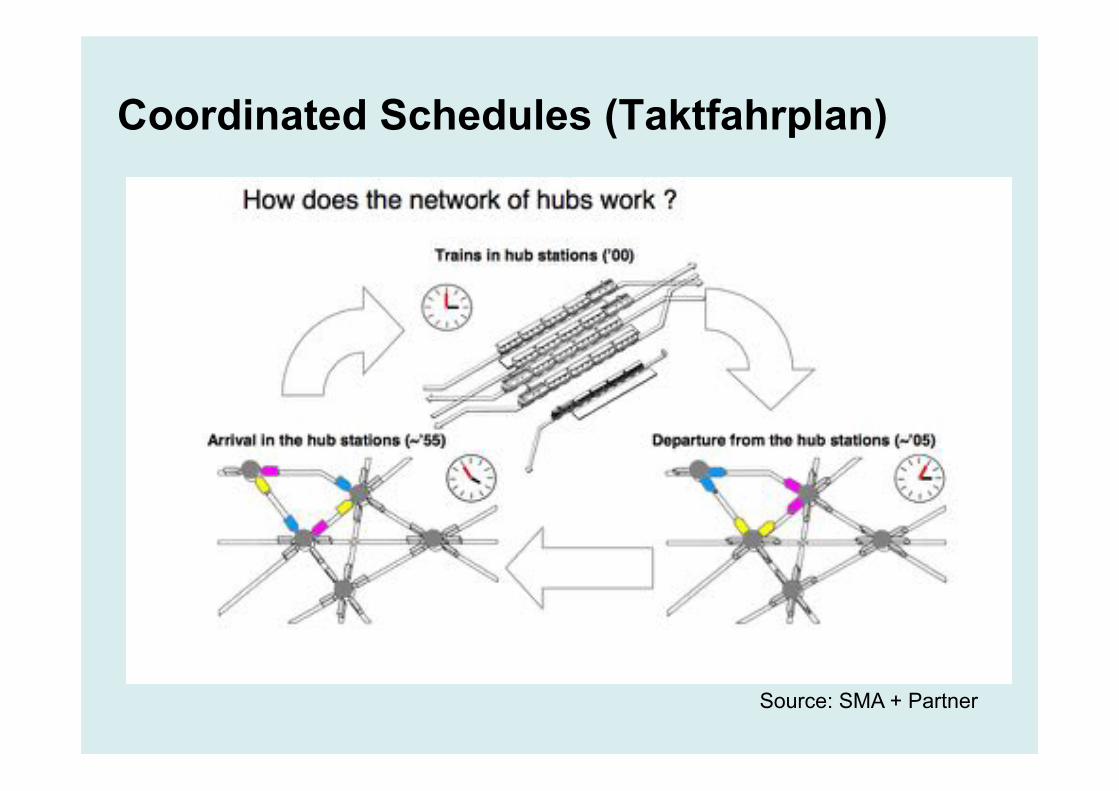
Coordinated Schedules (Taktfahrplan)
Source: SMA + Partner

Regional hub example: Wetzikon (rail)
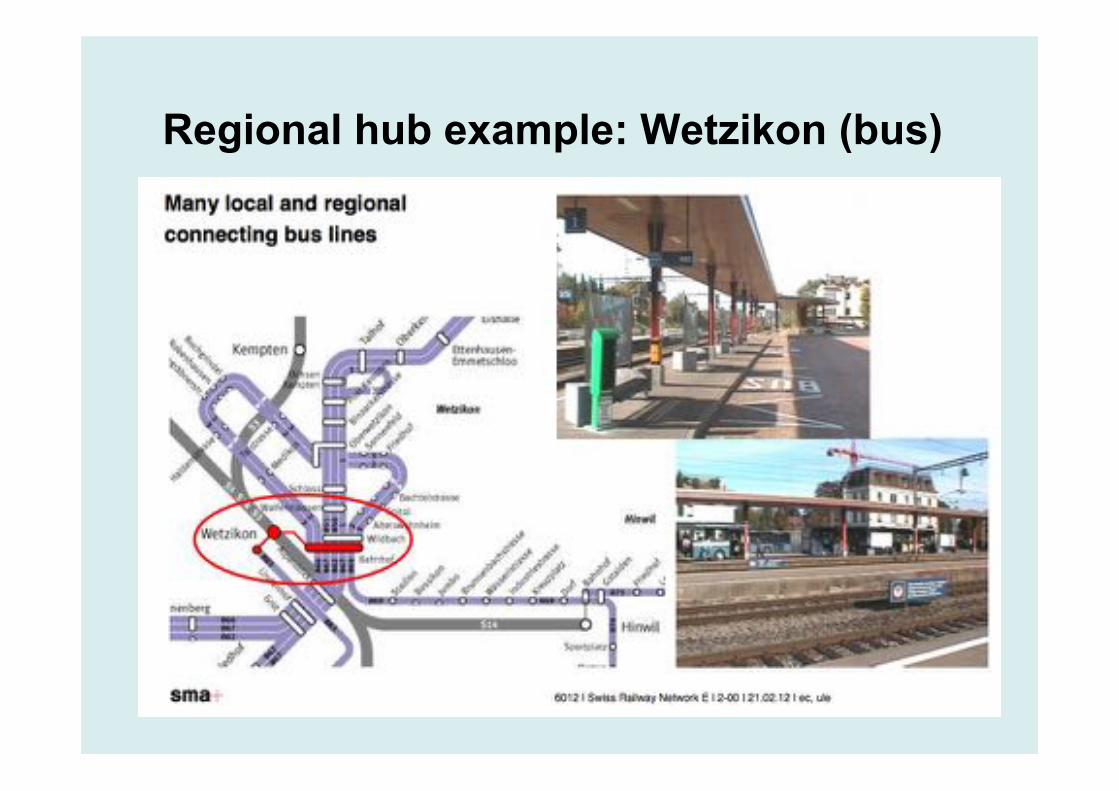
Regional hub example: Wetzikon (bus)

80%
100%
120%
140%
160%
180%
200%
220%
240%
260%
280%
1990 1995 2000 2005 2010
Gro
wth
, ind
exed
aga
inst
199
0
Year
Regional Rail Passengers Metropolitan Area Population
City Population Bus/Tram Passengers
Zurich: PT ridership vs. population

Zurich’s sustainable mobility program
• Promote public transport • Reduce and regulate parking • Reduce private automobile traffic • Improve conditions for pedestrians and bikes • Develop ways to co-exist (shared space) • Repair urban damage (freeway tunnels) • Promote sustainable transport (behavior change) • Network and share information with other cities

Reduce auto traffic: control traffic flow
• Traffic signals used to control how much traffic enters the city.
• Less traffic reduces congestion for public transport.
• Like ramp metering for the whole city, makes all traffic flow more efficiently.

Advertisement: parking control officers!

Equal Opportunity
Humor Dear ladies: there are still men, who are on-time, gallantly open the door for you and will “un-aggressively” bring you home afterwards.

Zurich Lessons
• Public support is critical (U-Bahn initiative)
• Residents have good ideas (prioritization)
• Street space must be allocated
• Efficiency can work (high quality PT)
• Coordination can be implemented
• Clever ideas beat infrastructure (PT Priority and S-Bahn)

The fight continues …
Congestion in Zurich
• Increased travel times
• Lower reliability
• Higher costs
Centre city delays have added 32,000 hours/year to travel time and increased operating costs by CHF 8 million.

The Phantom Menace – San Francisco
• Congestion!

Economy • Creative & economic
centre of information technology worldwide.
Population • City: 852,000 + • Metropolitan area: 8 million • City Area: 121 km2 (metro 9,120 km2)
Transport • Public transport mode split: 33% (city) 10% (region) • SF Muni ridership 273 trips per capita annually • SF Muni average speed: 13 kph
San Francisco

San Francisco Freeway Plan
Typical of the standard American approach to urban transport planning in the 1950s – 1960s.

San Francisco Freeway Revolt
Spurred by freeway construction and the environmental movement.

Loma Prieta Earthquake – October 17, 1989

San Francisco Central Freeway
Political Process • 1997: Rebuild – Passes • 1998: Replace with boulevard – Passes • 1999-a: Rebuild – Fails • 1999-b: Replace with boulevard – Passes The politics had little to do with transportation or urban development.

No freeway = congestion and no people!

Induced traffic: if you build it they will come.

San Francisco Lessons
• Transport is highly political.
• Congestion is not really a problem.
• Removing freeways does not necessarily increase congestion …
• … But can significantly increase liveability and economic development.

Return of the Jedi – New York
Michael R. Bloomberg Mayor
Janette Sadik-Kahn Transportation Commissioner


Experimentation and data driven learning


Lessons from New York
• Political courage
• Imagination and creativity
• Temporary measures and paint
• Data collection and evaluation
• Learning and improving
If planning change can happen there it can happen anywhere … it’s up to you NY, NY!

The Force Awakens: Participation
• Information technology has vastly increased the ability of people to participate;
• This increased ability to participate is revolutionising society …
• … especially how we plan and “operate” cities.

How do people plan and “operate” cities?
A. Provide information & ideas
B. Analyze data
C. Decide (people collaborate)
D. Act
Information Analyze Decide Act
Support

A. Input: simple and ubiquitous
• Social media
• Reporting applications
• Sensor data

Chicago Transit Authority – Twitter Feed

Zurich Public Transport Authority – Facebook Page

SeeClickFix http://seeclickfix.com


Traffic Check http://www.trafficcheck.at/
User friendly features needed for mobile phone reporting: • automatic geo location, • logical information flow, • check boxes for data entry.

Meine Radspur, Vienna http://www.meineradspur.at/

Street Bump, Boston http://streetbump.org/


• City data – open data or scraped.
• Citizen data – cheap sensors.
B. Data: you can’t hide
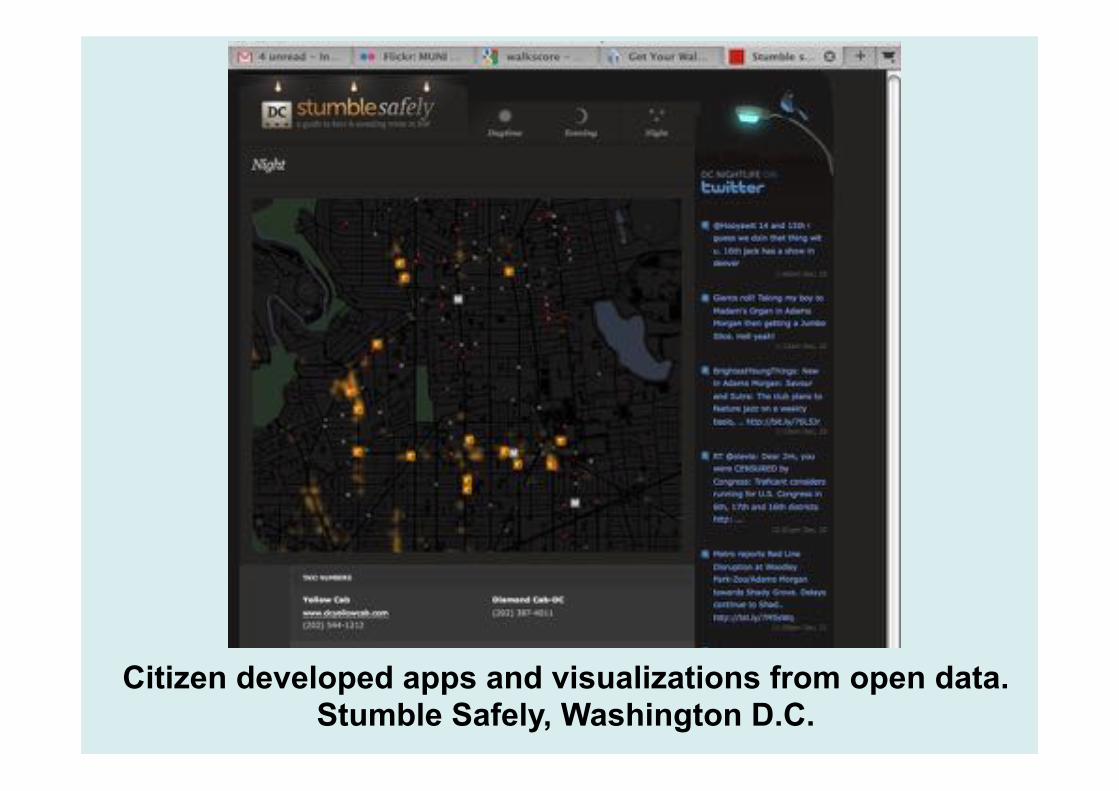
Citizen developed apps and visualizations from open data. Stumble Safely, Washington D.C.

WayCount vehicle counter and software www.waycount.com

Smart Citizen sensor and software http://www.smartcitizen.me/


• Education – city planning is complex
• Better processes – meeting management
• Increased engagement – more is better
C. Decide: collaborate efficiently

BusMeister game … public transport learning http://greencitystreets.com

Public Transport wiki … crowd-sourced education http://greencitystreets.com

Visualization ... Participatory Chinatown Boston
Using virtual reality to help residents understand city planning.
http://www.participatorychinatown.org/

Visualisation of street cross sections... Streetmix
Helping residents understand street design and trade-offs.
http://streetmix.net

Collaboration Apps: Mind Mixer www.improveSF.com

Shareabouts – geo-based collaboration app

GreenCityStreets.com … Facebook-based collaboration
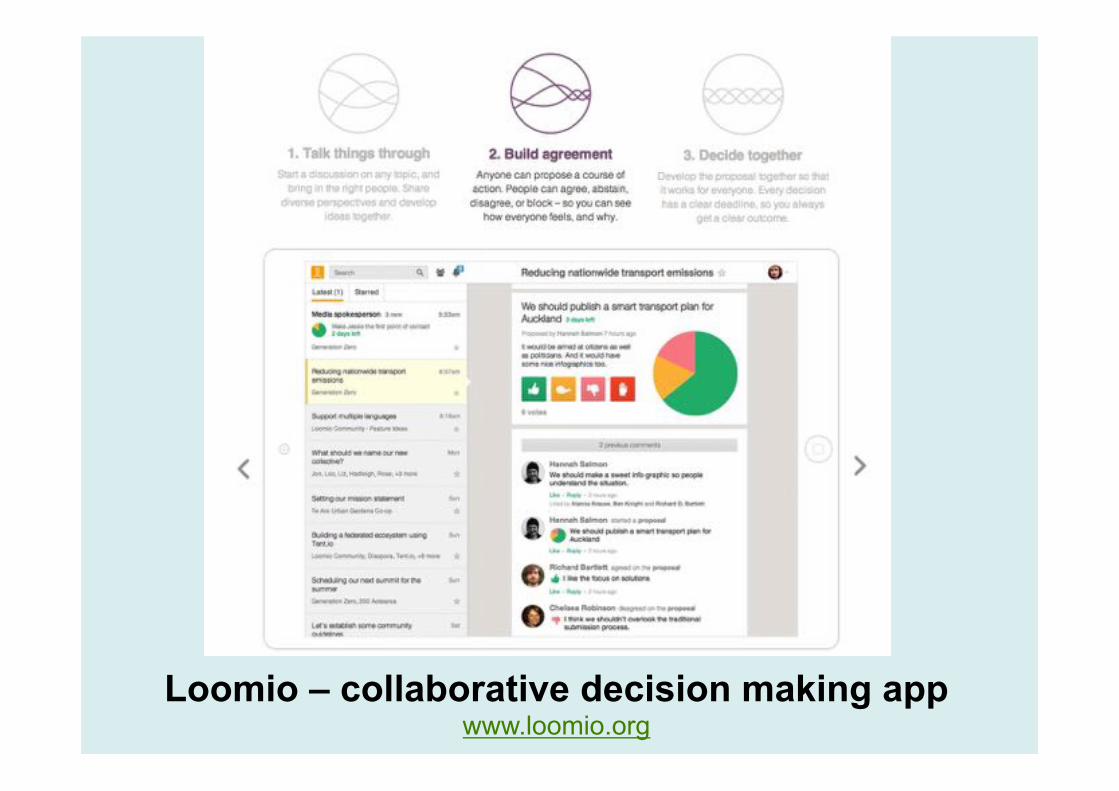
Loomio – collaborative decision making app www.loomio.org

Ring Ride – Game to encourage participation
www.ringstrasse150.com

Grr-Grr-Bike – Game for education + engagement. www.grr-grr-bike.com

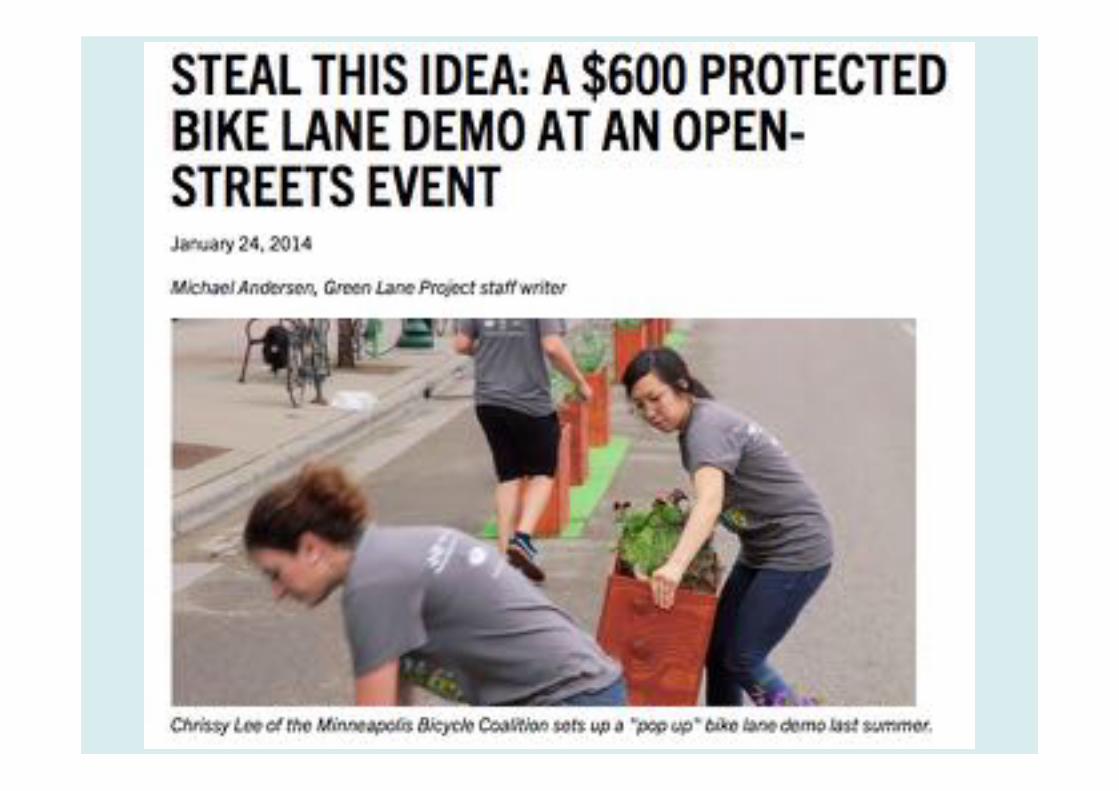
D. Act: disruptive change
• Information – Twitter real time transport
• Civic organisation – 596 Acres, Casserole
• Sharing society – P2P ridesharing
• Crowd-sourced civic works – Kickstarter
• Disruptive businesses – Uber, Bridj

Information exchange and organisation … 596 Acres

Crowdfunding for civic improvements … Kickstarter

Using games to influence behaviour … Chromaroma (London)

App-based public transport

Designing passionate, people-powered public services
Casserole is an example of how understanding citizens as producers as well as consumers leads to services that help communities turn the issues they’re passionate about into ways to be more self-sufficient and less invested in expensive public services.

Lessons from Cyberspace
• Information technology has fundamentally changed the role of government.
• Applications enable active participation in planning and operating cities …
• … if government does not embrace this active participation – someone else will!
• Participation apps should be easy, fun and active.

The Empire Strikes Back – Vienna • Infrastructure investment pays off.
A New Hope – Zurich • Efficiency is possible.
The Phantom Menace – San Francisco • Don’t be afraid of congestion.
Return of the Jedi – New York • Planning needs brains AND courage.
The Force Awakens – Information Technology • Participation is revolutionizing cities and planning.

Andrew Nash develops engaging public participation applications and games designed to improve city livability and transport. • GreenCityStreets.com • Ringstrasse150.com/wp/ • AndyNash.com