Embed Size (px)
Citation preview
Affordable & Liveable Property GuideBrisbane Metro 2nd Hal f 2021

METHODOLOGYThis affordable and liveable property guide for Brisbane Metro analyses all suburbs within a 20km radius of the Brisbane CBD. The following criteria were considered:
• Property trends criteria – all suburbs have a minimum of 20 sales transactions for statistical reliability purposes. Based on market conditions suburbs have either positive, or as close as possible to neutral price growth between 2020 to 2021*.
• Investment criteria – as of September 2021, suburbs considered will have an on-par or higher rental yield than Brisbane Metro, and an on-par or lower vacancy rate.
• Affordability criteria – identified affordable and liveable suburbs have a median price below a set threshold. This was determined by adding percentage premiums to the Queensland (QLD) average home loan, which was $461,414** as of Q2 2021. Premiums of 56% for houses and -3% for units were added, which were below those required to reach Brisbane Metro’s median prices (79% for houses and 1% for units). This places the chosen suburbs below Brisbane’s median prices, meaning that the suburbs identified within this report are more affordable for buyers.
• Development criteria – suburbs identified must have a high total estimated value of future project development for the 2nd half of 2021, as well as a higher proportion of commercial and infrastructure projects. This ensures the suburbs show signs of sustainable economic growth, in turn positively affecting the property market.
• Liveability criteria – all identified suburbs have low crime rates, availability of amenities within a 5km radius (i.e. schools, green spaces, public transport, shopping centres and health care facilities), and an unemployment rate on-par or lower in comparison to the QLD average (as determined by the Department of Jobs and Small Business, June Quarter 2021 release).
RECENT TOP PERFORMERS
Area Suburb TypeMedianPrice 2020
MedianPrice 2021*
Price Growth
Projects 2021***
InnerKangaroo Point House $1,084,000 $1,937,000 78.7% $386.9M
Kangaroo Point Unit $520,000 $900,000 73.4% $386.9M
NorthCarseldine House $648,000 $760,000 17.1% $67.5M
Nundah Unit $390,000 $418,000 7.2% $31.6M
SouthCarindale House $919,000 $1,150,000 25.1% $80.7M
Rochedale Unit $587,000 $635,000 8.2% $171.0M
EastLota House $690,000 $782,000 13.3% $30.3M
Murarrie Unit $575,000 $605,000 5.2% $56.0M
WestIndooroopilly House $972,000 $1,344,000 38.2% $203.4M
Redbank Unit $210,000 $263,000 25.2% $87.8M
OVERVIEWMedian property prices in Brisbane Metro increased by 22.3% for houses to $825,000 from Q3 2020 to Q3 2021*, and by 3.6% for units at $465,000. Between Q3 2020 – Q3 2021 total house sales declined by -11.7% (to 4,902 sales), but unit sales increased by 121.9% (to 4,043 sales). Undersupply is evident in Brisbane Metro’s house market, as price growth is alongside lower transaction volumes, suggesting an imbalance between available stock and high demand. Units show real returns in capital investment, as price growth was sustained by increased sales. $4.8B of projects are planned across the 2nd half of 2021, where mixed-use and residential projects will assist with housing supply. Infrastructure and commercial projects suggest new businesses and improved services. The Olympics 2032 announcement brought a certain buzz into Brisbane’s property market, and with imminent border openings soon, this trend is expected to continue in 2022.
BENCHMARKSBRISBANE METRO
$425
Sales
Median Price
Rental Price
Annual Change^
Median Price
Rental Price
Sales
BRISBANE METRO
$500
MEDIAN RENTAL PRICE
$465K$825k
MEDIAN SALE PRICE
HOUSE UNIT
HOUSE UNIT
*Median price quoted captures sale transactions from 1st January 2021 to 30th September 2021, or Q1 2020 – Q3 2021. **Average home loan figure is derived from June Quarter 2021 Housing Affordability Report by the Real Estate Institute of Australia (REIA) and Adelaide Bank. ***Project development is based on aggregate of estimated construction value for residential, commercial, industrial, mixed-use and infrastructure projects scheduled to commence in the 2nd half of 2021 as stated by the relevant data authority. ^Annual Change is reflective of median price change from Q3 2020 to Q3 2021. Figures displayed in infographics are for the period Q3 2020.Source: APM Pricefinder, REIA, SQM Research, Cordell Connect, Department of Jobs and Small Business. © PRD 2021.
VACANCY RATE
3.7% 5.2%
5.1%
$461,414
1.4%
UNEMPLOYMENT RATE
HOUSE YIELD UNIT YIELD
AVERAGE HOME LOAN
BENCHMARKSQUEENSLAND
AVERAGE VENDOR DISCOUNT KEY COMMENTS
MARKET PERFORMANCE
PRICE BREAKDOWNUNITS SOLDHOUSES SOLD
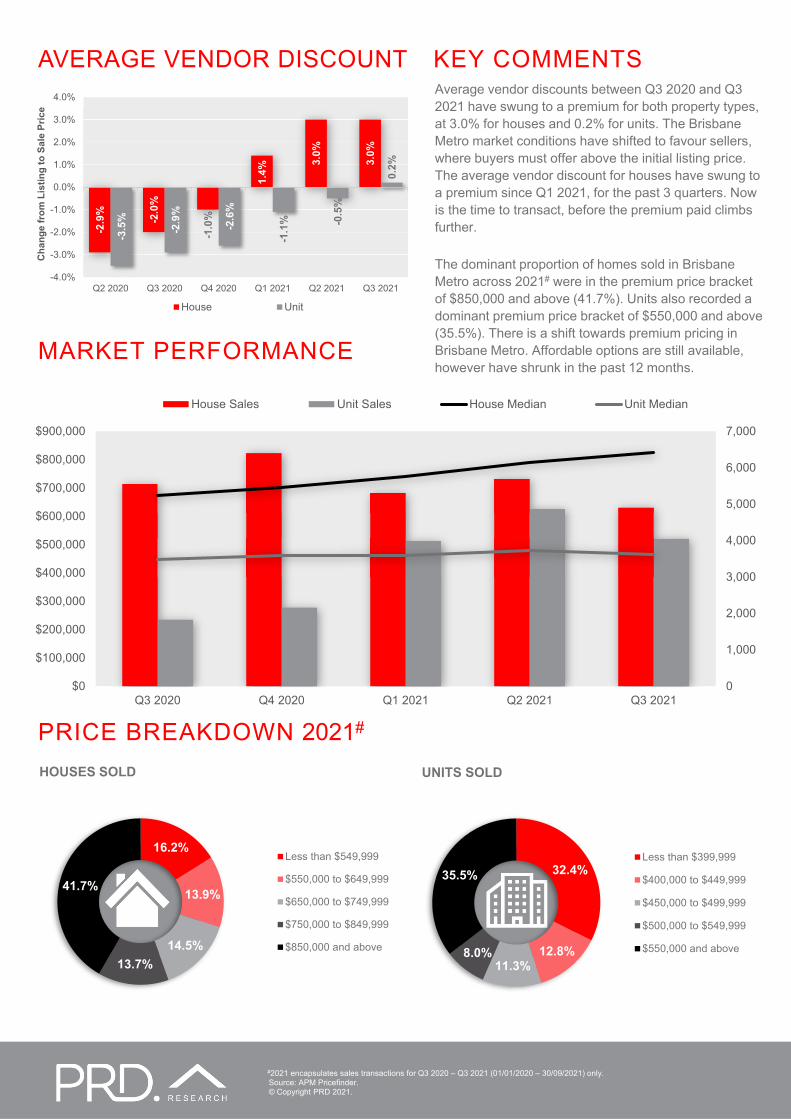
Average vendor discounts between Q3 2020 and Q3 2021 have swung to a premium for both property types, at 3.0% for houses and 0.2% for units. The Brisbane Metro market conditions have shifted to favour sellers, where buyers must offer above the initial listing price. The average vendor discount for houses have swung to a premium since Q1 2021, for the past 3 quarters. Now is the time to transact, before the premium paid climbs further.
The dominant proportion of homes sold in Brisbane Metro across 2021# were in the premium price bracket of $850,000 and above (41.7%). Units also recorded a dominant premium price bracket of $550,000 and above (35.5%). There is a shift towards premium pricing in Brisbane Metro. Affordable options are still available, however have shrunk in the past 12 months.
2021#
#2021 encapsulates sales transactions for Q3 2020 – Q3 2021 (01/01/2020 – 30/09/2021) only.Source: APM Pricefinder.© Copyright PRD 2021.
-2.9
%
-2.0
%
-1.0
%
1.4%
3.0%
3.0%
-3.5
%
-2.9
%
-2.6
%
-1.1
% -0.5
%
0.2%
-4.0%
-3.0%
-2.0%
-1.0%
0.0%
1.0%
2.0%
3.0%
4.0%
Q2 2020 Q3 2020 Q4 2020 Q1 2021 Q2 2021 Q3 2021
Cha
nge
from
Lis
ting
to S
ale
Pric
e
House Unit
0
1,000
2,000
3,000
4,000
5,000
6,000
7,000
$0
$100,000
$200,000
$300,000
$400,000
$500,000
$600,000
$700,000
$800,000
$900,000
Q3 2020 Q4 2020 Q1 2021 Q2 2021 Q3 2021
House Sales Unit Sales House Median Unit Median
16.2%
13.9%
14.5%13.7%
41.7%
Less than $549,999
$550,000 to $649,999
$650,000 to $749,999
$750,000 to $849,999
$850,000 and above
32.4%
12.8%11.3%
8.0%
35.5%Less than $399,999
$400,000 to $449,999
$450,000 to $499,999
$500,000 to $549,999
$550,000 and above
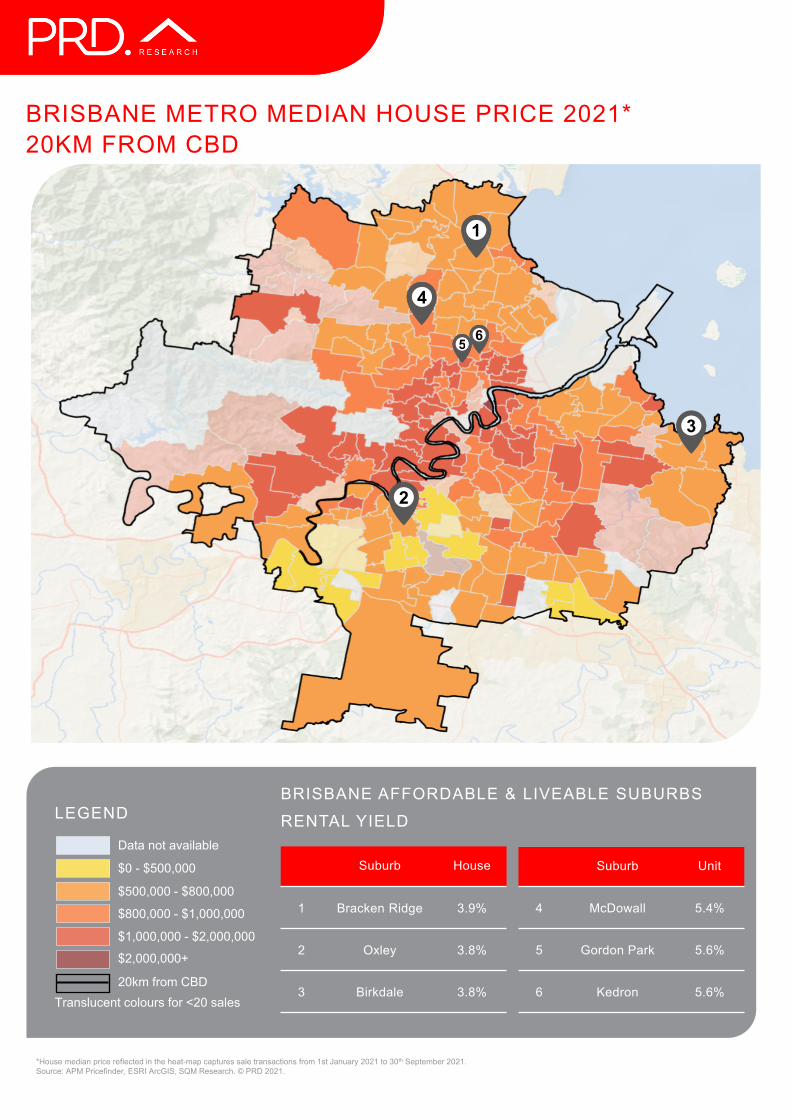
BRISBANE METRO MEDIAN HOUSE PRICE 2021* 20KM FROM CBD
Suburb House
1 Bracken Ridge 3.9%
2 Oxley 3.8%
3 Birkdale 3.8%
*House median price reflected in the heat-map captures sale transactions from 1st January 2021 to 30th September 2021.Source: APM Pricefinder, ESRI ArcGIS, SQM Research. © PRD 2021.
Suburb Unit
4 McDowall 5.4%
5 Gordon Park 5.6%
6 Kedron 5.6%
RENTAL YIELDBRISBANE AFFORDABLE & LIVEABLE SUBURBS
LEGEND
Data not available
$0 - $500,000
$500,000 - $800,000
$800,000 - $1,000,000
$1,000,000 - $2,000,000
$2,000,000+
Translucent colours for <20 sales20km from CBD
2
1
3
4
5 6
RENTAL GROWTH
RENTAL VACANCY RATES
RENTAL YIELD
BrisbaneMetro
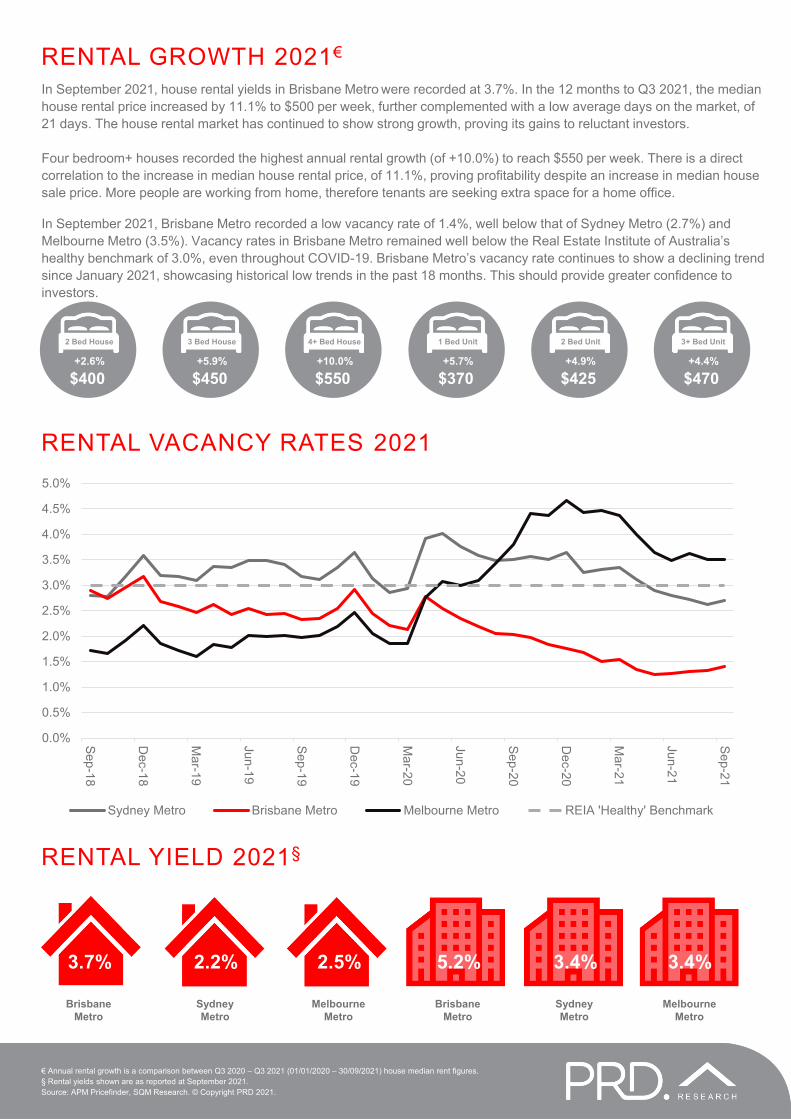
In September 2021, house rental yields in Brisbane Metro were recorded at 3.7%. In the 12 months to Q3 2021, the median house rental price increased by 11.1% to $500 per week, further complemented with a low average days on the market, of 21 days. The house rental market has continued to show strong growth, proving its gains to reluctant investors.
Four bedroom+ houses recorded the highest annual rental growth (of +10.0%) to reach $550 per week. There is a direct correlation to the increase in median house rental price, of 11.1%, proving profitability despite an increase in median housesale price. More people are working from home, therefore tenants are seeking extra space for a home office.
In September 2021, Brisbane Metro recorded a low vacancy rate of 1.4%, well below that of Sydney Metro (2.7%) and Melbourne Metro (3.5%). Vacancy rates in Brisbane Metro remained well below the Real Estate Institute of Australia’s healthy benchmark of 3.0%, even throughout COVID-19. Brisbane Metro’s vacancy rate continues to show a declining trend since January 2021, showcasing historical low trends in the past 18 months. This should provide greater confidence to investors.
5.2%
SydneyMetro
3.4%
Melbourne Metro
3.4%2.5%
BrisbaneMetro
SydneyMetro
Melbourne Metro
2.2%3.7%
2021§
2021
2021€
2 Bed Unit 3+ Bed Unit1 Bed Unit3 Bed House 4+ Bed House2 Bed House
+5.9%
$450+5.7%
$370+2.6%
$400+4.9%
$425+4.4%
$470+10.0%
$550
€ Annual rental growth is a comparison between Q3 2020 – Q3 2021 (01/01/2020 – 30/09/2021) house median rent figures.§ Rental yields shown are as reported at September 2021. Source: APM Pricefinder, SQM Research. © Copyright PRD 2021.
0.0%
0.5%
1.0%
1.5%
2.0%
2.5%
3.0%
3.5%
4.0%
4.5%
5.0%
Sep-18
Dec-18
Mar-19
Jun-19
Sep-19
Dec-19
Mar-20
Jun-20
Sep-20
Dec-20
Mar-21
Jun-21
Sep-21
Sydney Metro Brisbane Metro Melbourne Metro REIA 'Healthy' Benchmark
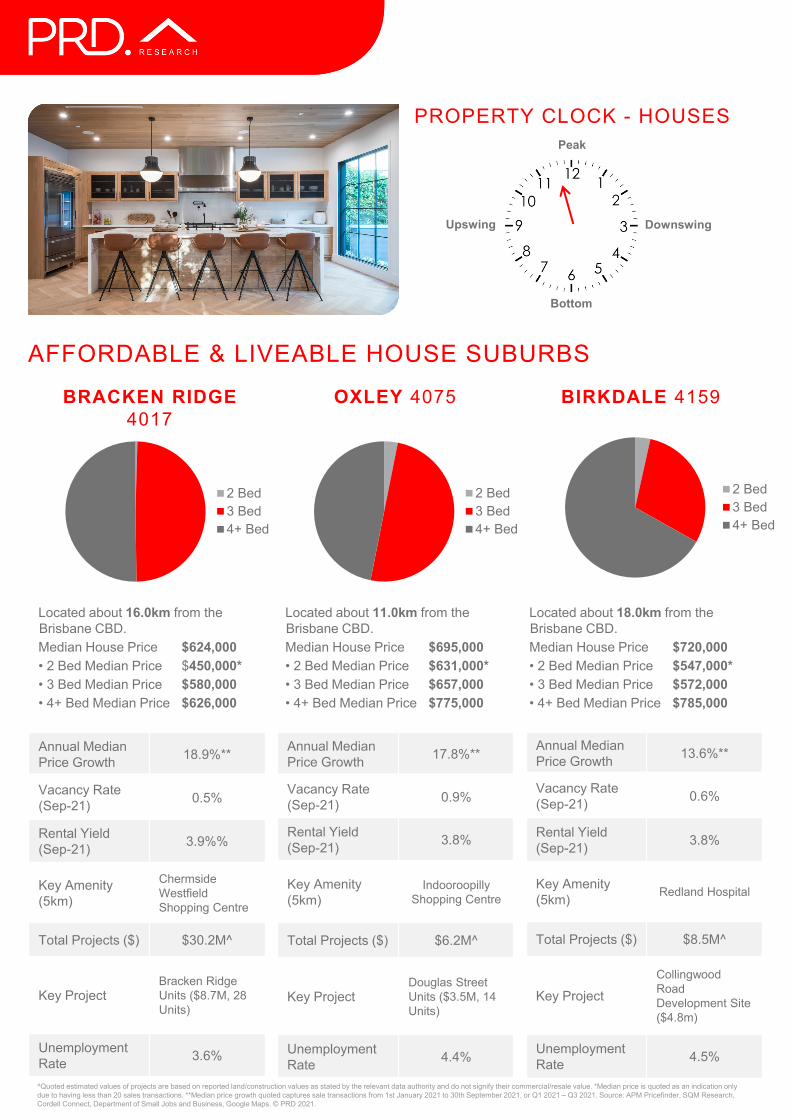
Annual Median Price Growth 13.6%**
Vacancy Rate (Sep-21) 0.6%
Rental Yield (Sep-21) 3.8%
Key Amenity (5km) Redland Hospital
Total Projects ($) $8.5M^
Key ProjectCollingwood Road Development Site ($4.8m)
Unemployment Rate 4.5%
Annual Median Price Growth 17.8%**
Vacancy Rate (Sep-21) 0.9%
Rental Yield (Sep-21) 3.8%
Key Amenity (5km)
Indooroopilly Shopping Centre
Total Projects ($) $6.2M^
Key ProjectDouglas Street Units ($3.5M, 14 Units)
Unemployment Rate 4.4%
Located about 11.0km from the Brisbane CBD.Median House Price $695,000• 2 Bed Median Price $631,000*• 3 Bed Median Price $657,000• 4+ Bed Median Price $775,000
Located about 16.0km from the Brisbane CBD.Median House Price $624,000• 2 Bed Median Price $450,000*• 3 Bed Median Price $580,000• 4+ Bed Median Price $626,000
Located about 18.0km from the Brisbane CBD.Median House Price $720,000• 2 Bed Median Price $547,000*• 3 Bed Median Price $572,000• 4+ Bed Median Price $785,000
PROPERTY CLOCK - HOUSES
AFFORDABLE & LIVEABLE HOUSE SUBURBS
BRACKEN RIDGE4017
OXLEY 4075 BIRKDALE 4159
Peak
Bottom
Upswing Downswing
^Quoted estimated values of projects are based on reported land/construction values as stated by the relevant data authority and do not signify their commercial/resale value. *Median price is quoted as an indication only due to having less than 20 sales transactions. **Median price growth quoted captures sale transactions from 1st January 2021 to 30th September 2021, or Q1 2021 – Q3 2021. Source: APM Pricefinder, SQM Research, Cordell Connect, Department of Small Jobs and Business, Google Maps. © PRD 2021.
Annual Median Price Growth 18.9%**
Vacancy Rate (Sep-21) 0.5%
Rental Yield (Sep-21) 3.9%%
Key Amenity (5km)
Chermside Westfield Shopping Centre
Total Projects ($) $30.2M^
Key ProjectBracken Ridge Units ($8.7M, 28 Units)
Unemployment Rate 3.6%
2 Bed3 Bed4+ Bed
2 Bed3 Bed4+ Bed
2 Bed3 Bed4+ Bed
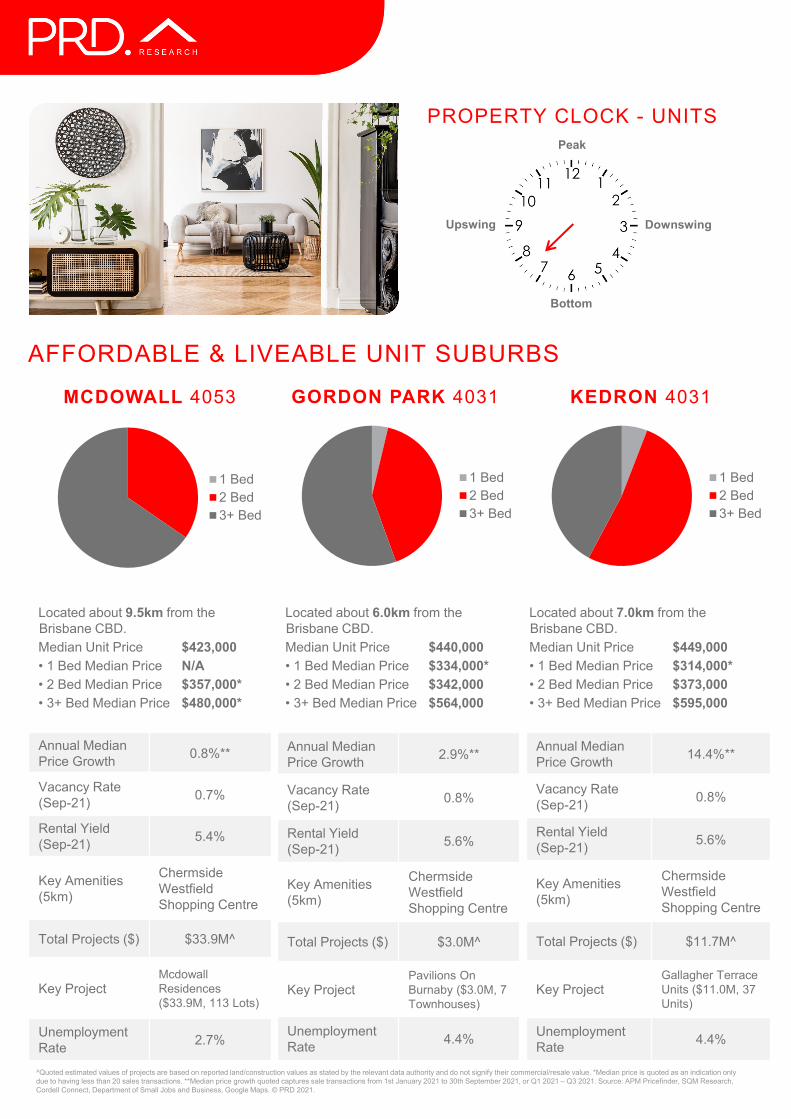
Located about 6.0km from the Brisbane CBD.Median Unit Price $440,000• 1 Bed Median Price $334,000*• 2 Bed Median Price $342,000• 3+ Bed Median Price $564,000
Located about 9.5km from the Brisbane CBD.Median Unit Price $423,000• 1 Bed Median Price N/A• 2 Bed Median Price $357,000*• 3+ Bed Median Price $480,000*
Located about 7.0km from the Brisbane CBD.Median Unit Price $449,000• 1 Bed Median Price $314,000*• 2 Bed Median Price $373,000• 3+ Bed Median Price $595,000
PROPERTY CLOCK - UNITS
AFFORDABLE & LIVEABLE UNIT SUBURBS
Peak
Bottom
Upswing Downswing
MCDOWALL 4053 GORDON PARK 4031 KEDRON 4031
^Quoted estimated values of projects are based on reported land/construction values as stated by the relevant data authority and do not signify their commercial/resale value. *Median price is quoted as an indication only due to having less than 20 sales transactions. **Median price growth quoted captures sale transactions from 1st January 2021 to 30th September 2021, or Q1 2021 – Q3 2021. Source: APM Pricefinder, SQM Research, Cordell Connect, Department of Small Jobs and Business, Google Maps. © PRD 2021.
Annual Median Price Growth 14.4%**
Vacancy Rate (Sep-21) 0.8%
Rental Yield (Sep-21) 5.6%
Key Amenities (5km)
Chermside Westfield Shopping Centre
Total Projects ($) $11.7M^
Key ProjectGallagher Terrace Units ($11.0M, 37 Units)
Unemployment Rate 4.4%
Annual Median Price Growth 2.9%**
Vacancy Rate (Sep-21) 0.8%
Rental Yield (Sep-21) 5.6%
Key Amenities (5km)
Chermside Westfield Shopping Centre
Total Projects ($) $3.0M^
Key ProjectPavilions On Burnaby ($3.0M, 7 Townhouses)
Unemployment Rate 4.4%
Annual Median Price Growth 0.8%**
Vacancy Rate (Sep-21) 0.7%
Rental Yield (Sep-21) 5.4%
Key Amenities (5km)
Chermside Westfield Shopping Centre
Total Projects ($) $33.9M^
Key ProjectMcdowallResidences ($33.9M, 113 Lots)
Unemployment Rate 2.7%
1 Bed2 Bed3+ Bed
1 Bed2 Bed3+ Bed
1 Bed2 Bed3+ Bed
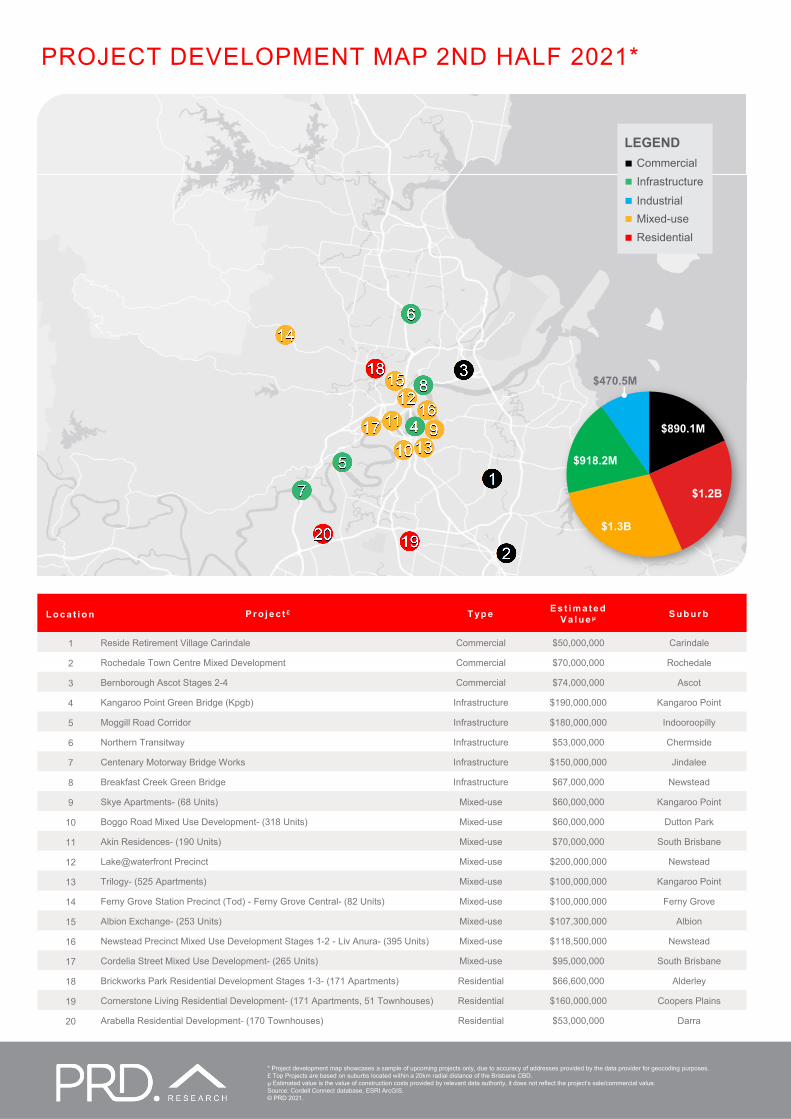
L o c a t i o n P r o j e c t £ T yp e E s t i m a t e d V a l u e µ S u b u r b
1 Reside Retirement Village Carindale Commercial $50,000,000 Carindale
2 Rochedale Town Centre Mixed Development Commercial $70,000,000 Rochedale
3 Bernborough Ascot Stages 2-4 Commercial $74,000,000 Ascot
4 Kangaroo Point Green Bridge (Kpgb) Infrastructure $190,000,000 Kangaroo Point
5 Moggill Road Corridor Infrastructure $180,000,000 Indooroopilly
6 Northern Transitway Infrastructure $53,000,000 Chermside
7 Centenary Motorway Bridge Works Infrastructure $150,000,000 Jindalee
8 Breakfast Creek Green Bridge Infrastructure $67,000,000 Newstead
9 Skye Apartments- (68 Units) Mixed-use $60,000,000 Kangaroo Point
10 Boggo Road Mixed Use Development- (318 Units) Mixed-use $60,000,000 Dutton Park
11 Akin Residences- (190 Units) Mixed-use $70,000,000 South Brisbane
12 Lake@waterfront Precinct Mixed-use $200,000,000 Newstead
13 Trilogy- (525 Apartments) Mixed-use $100,000,000 Kangaroo Point
14 Ferny Grove Station Precinct (Tod) - Ferny Grove Central- (82 Units) Mixed-use $100,000,000 Ferny Grove
15 Albion Exchange- (253 Units) Mixed-use $107,300,000 Albion
16 Newstead Precinct Mixed Use Development Stages 1-2 - Liv Anura- (395 Units) Mixed-use $118,500,000 Newstead
17 Cordelia Street Mixed Use Development- (265 Units) Mixed-use $95,000,000 South Brisbane
18 Brickworks Park Residential Development Stages 1-3- (171 Apartments) Residential $66,600,000 Alderley
19 Cornerstone Living Residential Development- (171 Apartments, 51 Townhouses) Residential $160,000,000 Coopers Plains
20 Arabella Residential Development- (170 Townhouses) Residential $53,000,000 Darra
PROJECT DEVELOPMENT MAP 2ND HALF 2021*
Commercial
Residential
IndustrialInfrastructure
LEGEND
Mixed-use
* Project development map showcases a sample of upcoming projects only, due to accuracy of addresses provided by the data provider for geocoding purposes.£ Top Projects are based on suburbs located within a 20km radial distance of the Brisbane CBD.µ Estimated value is the value of construction costs provided by relevant data authority, it does not reflect the project’s sale/commercial value.Source: Cordell Connect database, ESRI ArcGIS.© PRD 2021.
$890.1M
$1.2B
$1.3B
$918.2M
$470.5M
ABOUT PRD RESEARCHPRD Research Division provides reliable, unbiased, and authoritative property research and consultancy to clients in metro and regional locations across Australia
Our extensive research capability and specialised approach ensures our clients can make the most informed and financially sound decisions about residential and commercial properties.
OUR KNOWLEDGE
OUR SERVICES INCLUDE
PRD ResearchT +61 7 3229 3344E [email protected]
PRD.com.au
• Advisory and consultancy
• Market Analysis including
profiling and trends
• Primary qualitative and
quantitative research
• Demographic and target market
Analysis
• Geographic information mapping
• Project Analysis including product
and pricing recommendations
• Rental and investment return
analysis
Access to accurate and objective research is the foundation of all good property decisions.
As the first and only truly knowledge based property services company, PRD shares experience and knowledge to deliver innovative and effective solutions to our clients.
We have a unique approach that integrates people, experience, systems and technology to create meaningful business connections. We focus on understanding new issues impacting the property industry; such as the environment and sustainability, the economy, demographic and psychographic shifts, commercial and residential design; and forecast future implications around such issues based on historical data and fact.
OUR PEOPLEOur research team is made up of highly qualified researchers who focus solely on property analysis.
Skilled in deriving macro and micro quantitative information from multiple credible sources, we partner with clients to provide strategic advice and direction regarding property and market performance. We have the added advantage of sourcing valuable and factual qualitative market research in order to ensure our solutions are the most well considered and financially viable.
Our experts are highly sought after consultants for both corporate and government bodies and their advice has helped steer the direction of a number of property developments and secured successful outcomes for our clients.
OUR SERVICESOur research services span over every suburb, LGA, and state within Australia; captured in a variety of standard and customised products.
We have the ability and systems to monitor market movements, demographic changes and property trends. We use our knowledge of market sizes, price structure and buyer profiles to identify opportunities for clients and provide market knowledge that is unbiased, thorough and reliable.
PRD does not give any warranty in relation to the accuracy of the information contained in this report. If you intend to rely upon the information contained herein, you must take note that the Information, figures and projections have been provided by various sources and have not been verified by us. We have no belief one way or the other in relation to the accuracy of such information, figures and projections. PRD will not be liable for any loss or damage resulting from any statement, figure, calculation or any other information that you rely upon that is contained in the material. Prepared by PRD Research © All medians and volumes are calculated by PRD Research. Use with written permission only. All other responsibilities disclaimed.